Abstract
Background:
Pulmonary insufficiency is a consequence of transannular patch repair in Tetralogy of Fallot (ToF) leading to late morbidity and mortality. Transcatheter native outflow tract pulmonary valve replacement has become a reality. However, predicting a secure, atraumatic implantation of a catheter-based device remains a significant challenge due to the complex and dynamic nature of the right ventricular outflow tract (RVOT). We sought to quantify the differences in compression and volume for actual implants, and those predicted by pre-implant modeling.
Methods:
We used custom software to interactively place virtual transcatheter pulmonary valves (TPV) into RVOT models created from pre-implant and post Harmony valve implant CT scans of 5 ovine surgical models of TOF to quantify and visualize device volume and compression.
Results:
Virtual device placement visually mimicked actual device placement and allowed for quantification of device volume and radius. On average, simulated proximal and distal device volumes and compression did not vary statistically throughout the cardiac cycle (p=0.11) but assessment was limited by small sample size. In comparison to actual implants, there was no significant pairwise difference in the proximal third of the device (p>0.80), but the simulated distal device volume was significantly underestimated relative to actual device implant volume(p=0.06).
Conclusions:
This study demonstrates that pre-implant modeling which assumes a rigid vessel wall may not accurately predict the degree of distal RVOT expansion following actual device placement. We suggest the potential for virtual modeling of TPVR to be a useful adjunct to procedural planning, but further development is needed.
Keywords: Tetralogy of Fallot, percutaneous pulmonary valve implantation, magnetic resonance imaging, prosthetic heart valve
INTRODUCTION
Pulmonary insufficiency is a consequence of transannular patch repair in Tetralogy of Fallot (ToF) leading to right ventricular dilation, ventricular arrhythmias and heart failure.(1–3) Pulmonary valve replacement (PVR), traditionally with a surgically implanted bioprosthetic valve, can prevent or ameliorate some of these long term complications.(4–7) In patients with a failing right ventricle-to-pulmonary artery (RV-PA) conduit or surgical bioprosthetic valve, transcatheter PVR (TPVR) with balloon-expandable bioprosthetic valves has become increasingly common.(8–12) Follow-up of these devices has shown promising results while avoiding the risks and complications of surgical valve replacement.(3,13) The off-label use of Melody (Medtronic, Minneapolis, MN) and Sapien (Edwards Lifesciences, Inc.) TPV in “native” right ventricular outflow tracts (RVOT) has also been described, but is limited due to the typically dilated and heterogeneous shape of the native RVOT following transannular patch repair.(14,15)
The limited applicability of balloon expandable valves within these complex outflow tracts has fueled the development of self-expanding valve platforms designed to conform to a variety of native RVOT shapes and sizes.(14–17) Implantation of a self-expanding stent valve was described by Bonhoeffer and colleagues in 2009, and work since that time has resulted in the development of the Harmony TPV (Medtronic, Minneapolis, MN) which has been studied in both preclinical models, and in early human trials.(3,18,19) These studies have demonstrated encouraging improvements in ventricular size and function after TPVR.(3,18,19) However, it remains challenging to design devices that can accommodate a broad array of heterogeneous outflow tracts and function within an environment that can change size and shape dramatically throughout the cardiac cycle. This was well demonstrated by the high screen failure rate documented in the Harmony early feasibility study (EFS).(19) Multiple device shapes and sizes will increase the number of potential candidates for TPVR, but there is also a need to develop tools to improve the efficiency and accuracy of screening patients for available devices. Current screening techniques to identify suitable candidates are labor intensive and continue to rely primarily on 2D measurements from CT reconstructions of the RVOT and implantation of actual devices into 3D printed models to visually assess device fit, which assume a rigid vessel wall.(19) Prior modeling has also primarily been implemented in proprietary modeling packages which are expensive, and more importantly not customizable by the end-user.
In this study we create custom open-source software to quantify the difference in device volume and compression between actual Harmony implants and those predicted by pre-implant virtual modeling in an ovine surgical model of pulmonary insufficiency in both systole and diastole. We investigate the potential for virtual modeling to contribute to the visualization and quantification of TPVR device shape and compression, with possible future application to assessment of patient candidacy.
METHODS
Ovine Surgical Procedure and Image Acquisition
As previously reported, an ovine model of pulmonary regurgitation was created using a surgical transannular patch in order to study the in-vivo feasibility of Harmony TPVR and the early effects of restoration of valve competence on RV and RVOT dimension and function.(3) As part of this study, CT images of the RVOT in systole and diastole were obtained in 5 sheep prior to Harmony TPVR and 1–2 months after valve implantation. Paired data at these two time points were utilized to create the models for virtual implantation.
Segmentation of the RVOT and Pulmonary Arteries
To create the virtual models of the RVOT, systolic and diastolic CT images in DICOM format were imported into 3D Slicer, an open-source image processing workspace running on a Lenovo P300 workstation (Lenovo Inc, Quarry Bay, Hong Kong).(20) The right ventricular and pulmonary artery blood pool was segmented using 3D threshold paint or grow cut algorithms within the 3D Slicer Segments extension.(20) The blood pool was then dilated by 4 mm and the original blood pool subtracted to create a 4mm thick “shell” representing the right ventricle and pulmonary artery around the blood pool (Figure 1). These RVOT shell models were then utilized as the vessel into which virtual devices were implanted. Time for model segmentation was recorded by stopwatch.
Figure 1. Creation of RVOT Model (Segmentation) from CT data.
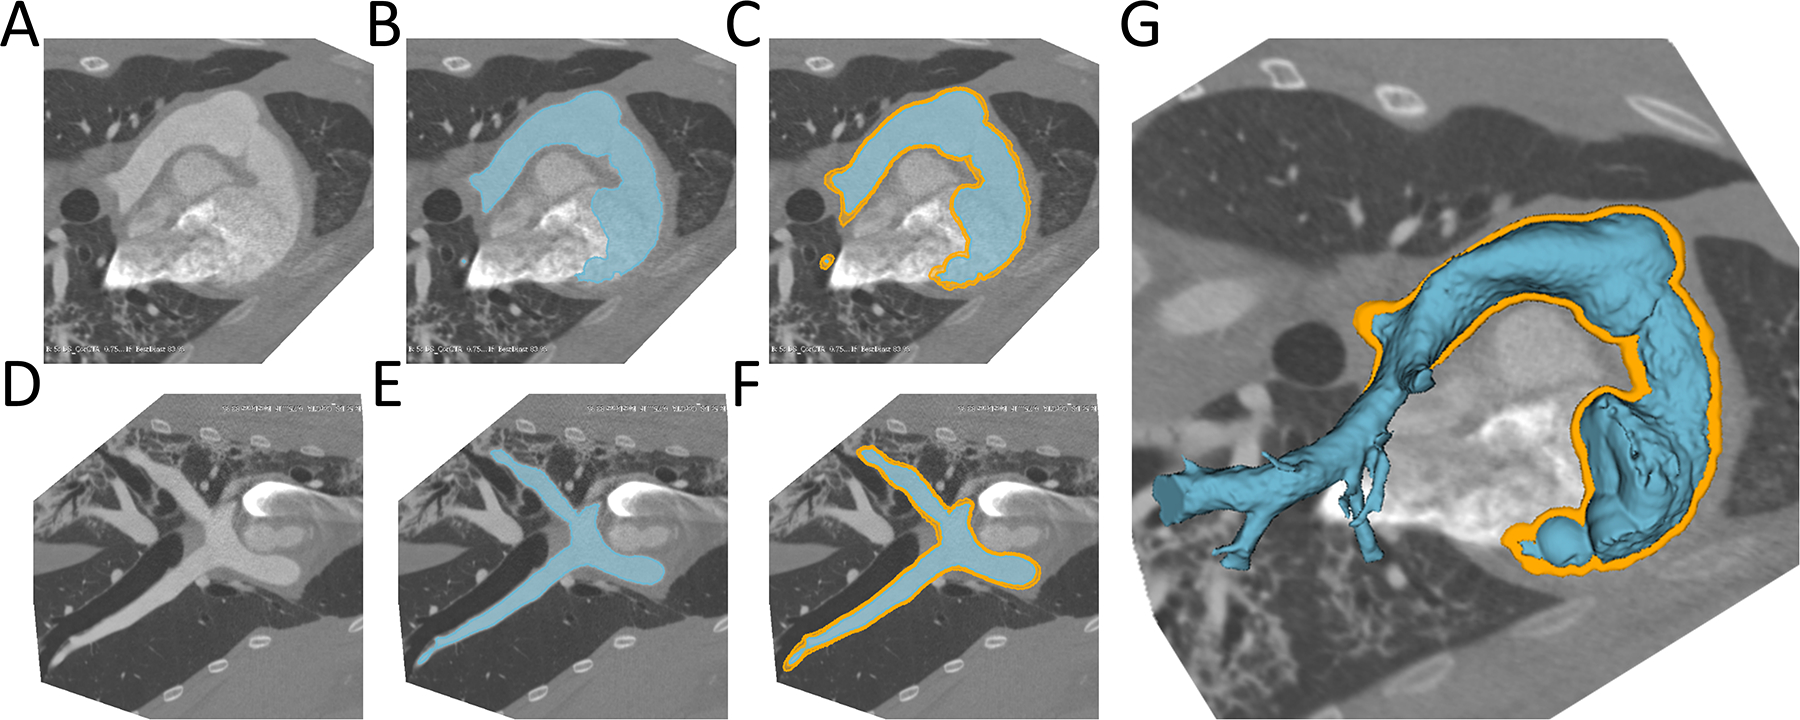
A) Native CT slice plane, B)RVOT model created in slice plane, C) RVOT (blue) surrounded by RVOT shell (orange) in slice plane; D-F) Same as above from side view; G: 3D rendered RVOT segmentation surrounded by RVOT Shell. RVOT=Right ventricular outflow tract.
Virtual Device Modeling and Quantification
Custom software was developed to run in the 3D Slicer environment (www.slicer.org) to enable creation of virtual devices of desired size and shape.(21) A virtual Harmony transcatheter valve was made based on a previously published device dimensions as images(Figure 2).(3) In order to model valve implantation, the device was conformed to the systolic and diastolic RVOT shells (Figures 3,4). Conformation to the RVOT was achieved by moving 12 control points around the device circumference placed every 5 mm along its length (Figure 2). The device was restricted to the shape of the RVOT in different phases of the cardiac cycle to simulate the characteristics of a self-expanding device (Figure 3). Device volumes were computed using custom calculations. Device displacement between the control points was computed using thin plate spline interpolation. Mean percent compression at each level of the device was defined as the average radial displacement at each level of the device (defined by the 12 points) divided by the native radius at 6 degree intervals (60 points per level). The device was divided into thirds along the centerline of the device which we defined as proximal (nearest the RV), mid, distal (nearest the pulmonary artery). For quantitative analysis the radial displacement of the deformed device relative to the fully expanded native device at multiple points along the length of the device were exported from 3D Slicer and imported into Microsoft Excel 2011(Microsoft, Redmond, WA). The displacement of the device at lengthwise increments was calculated along with percentiles. The degree of device deformation (radial displacement) was depicted using a color scale projected onto the valve surface (Figure 5).
Figure 2. Device Conformation Workflow.
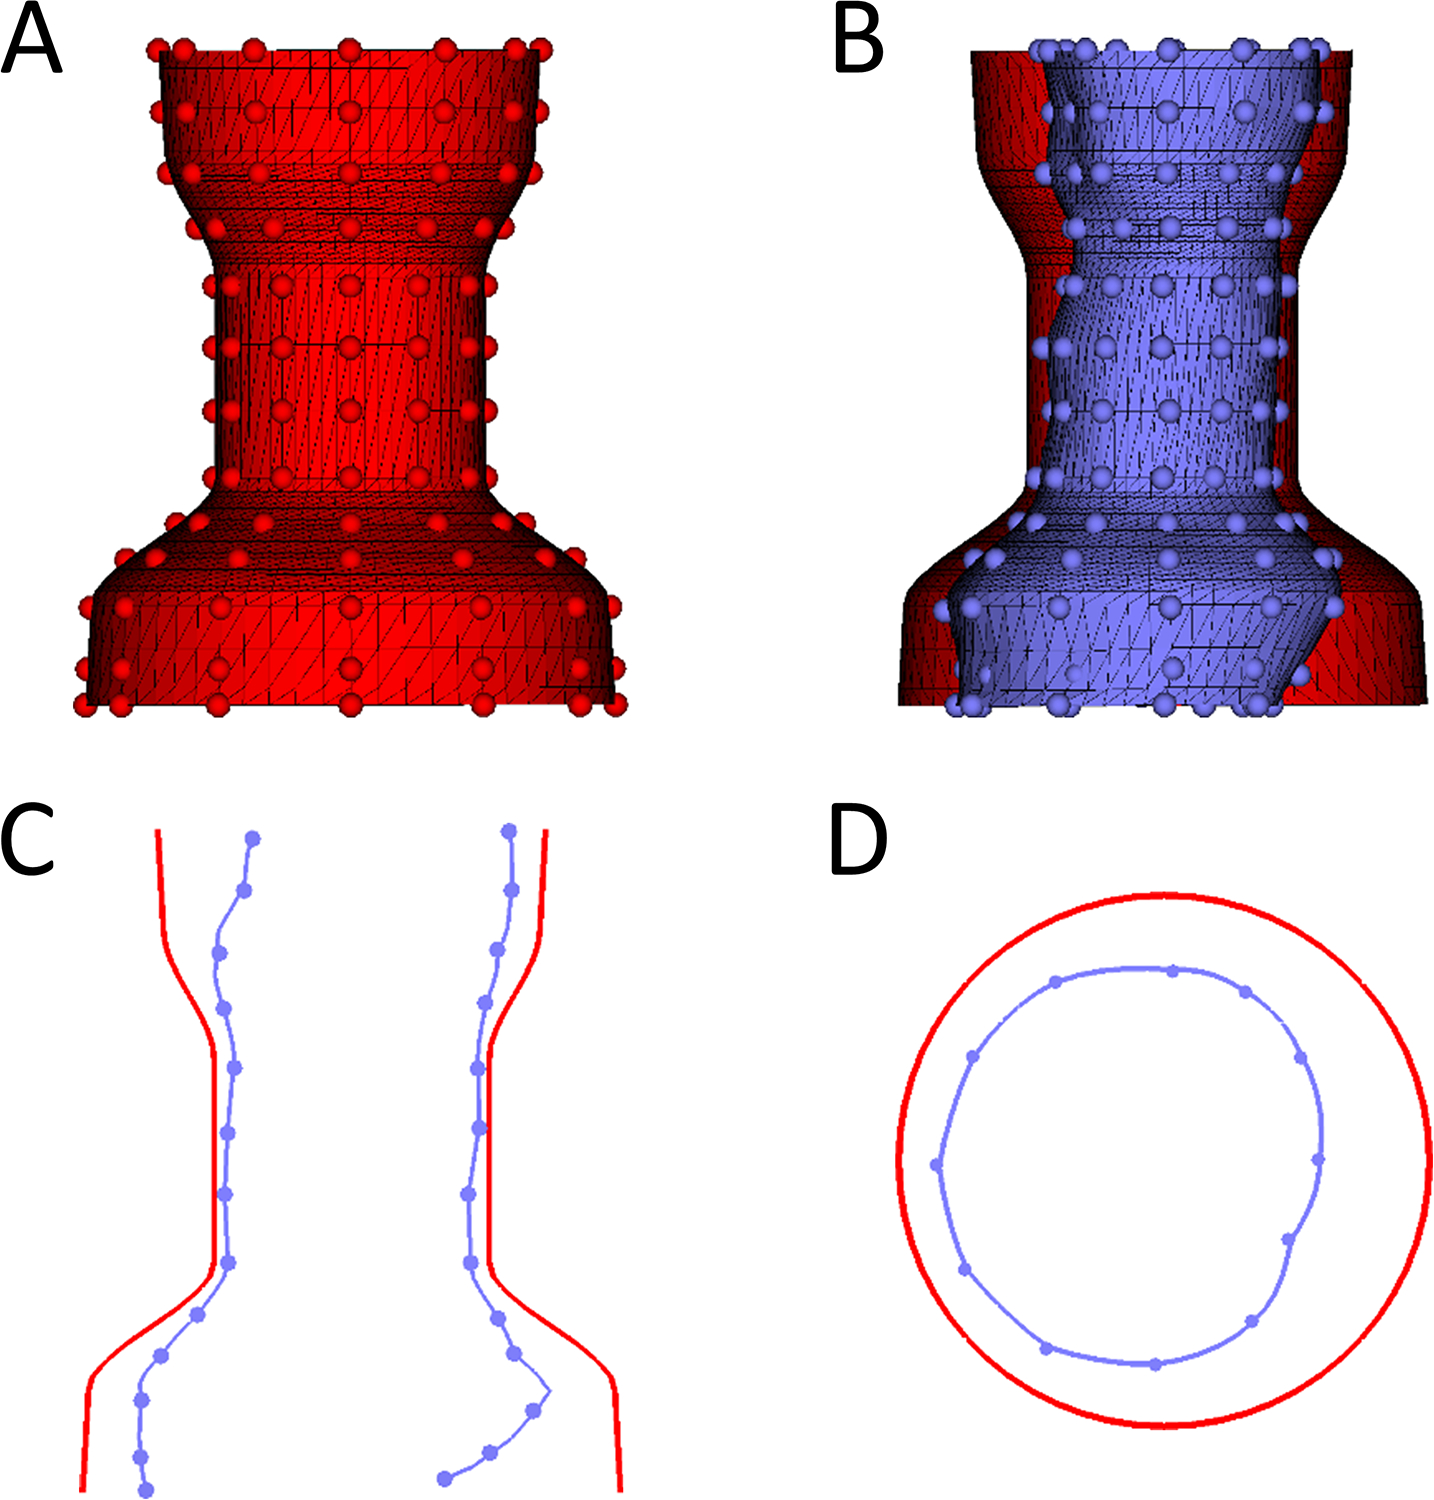
A. Example of unconformed device in 3D (Red) with handles depicted as small spheres which can moved to conform the device; B. Conformed device (blue) compared to unconfirmed device (red); C. Saggital plane comparing uncomformed device (Red) to conformed device (Blue). D. Transverse cutting plane comparing uncomformed device (Red) to conformed device (Blue).
Figure 3. Demonstration of Ability of Virtual Device to Model Actual Device Placement in Post-Implant CT Scan:
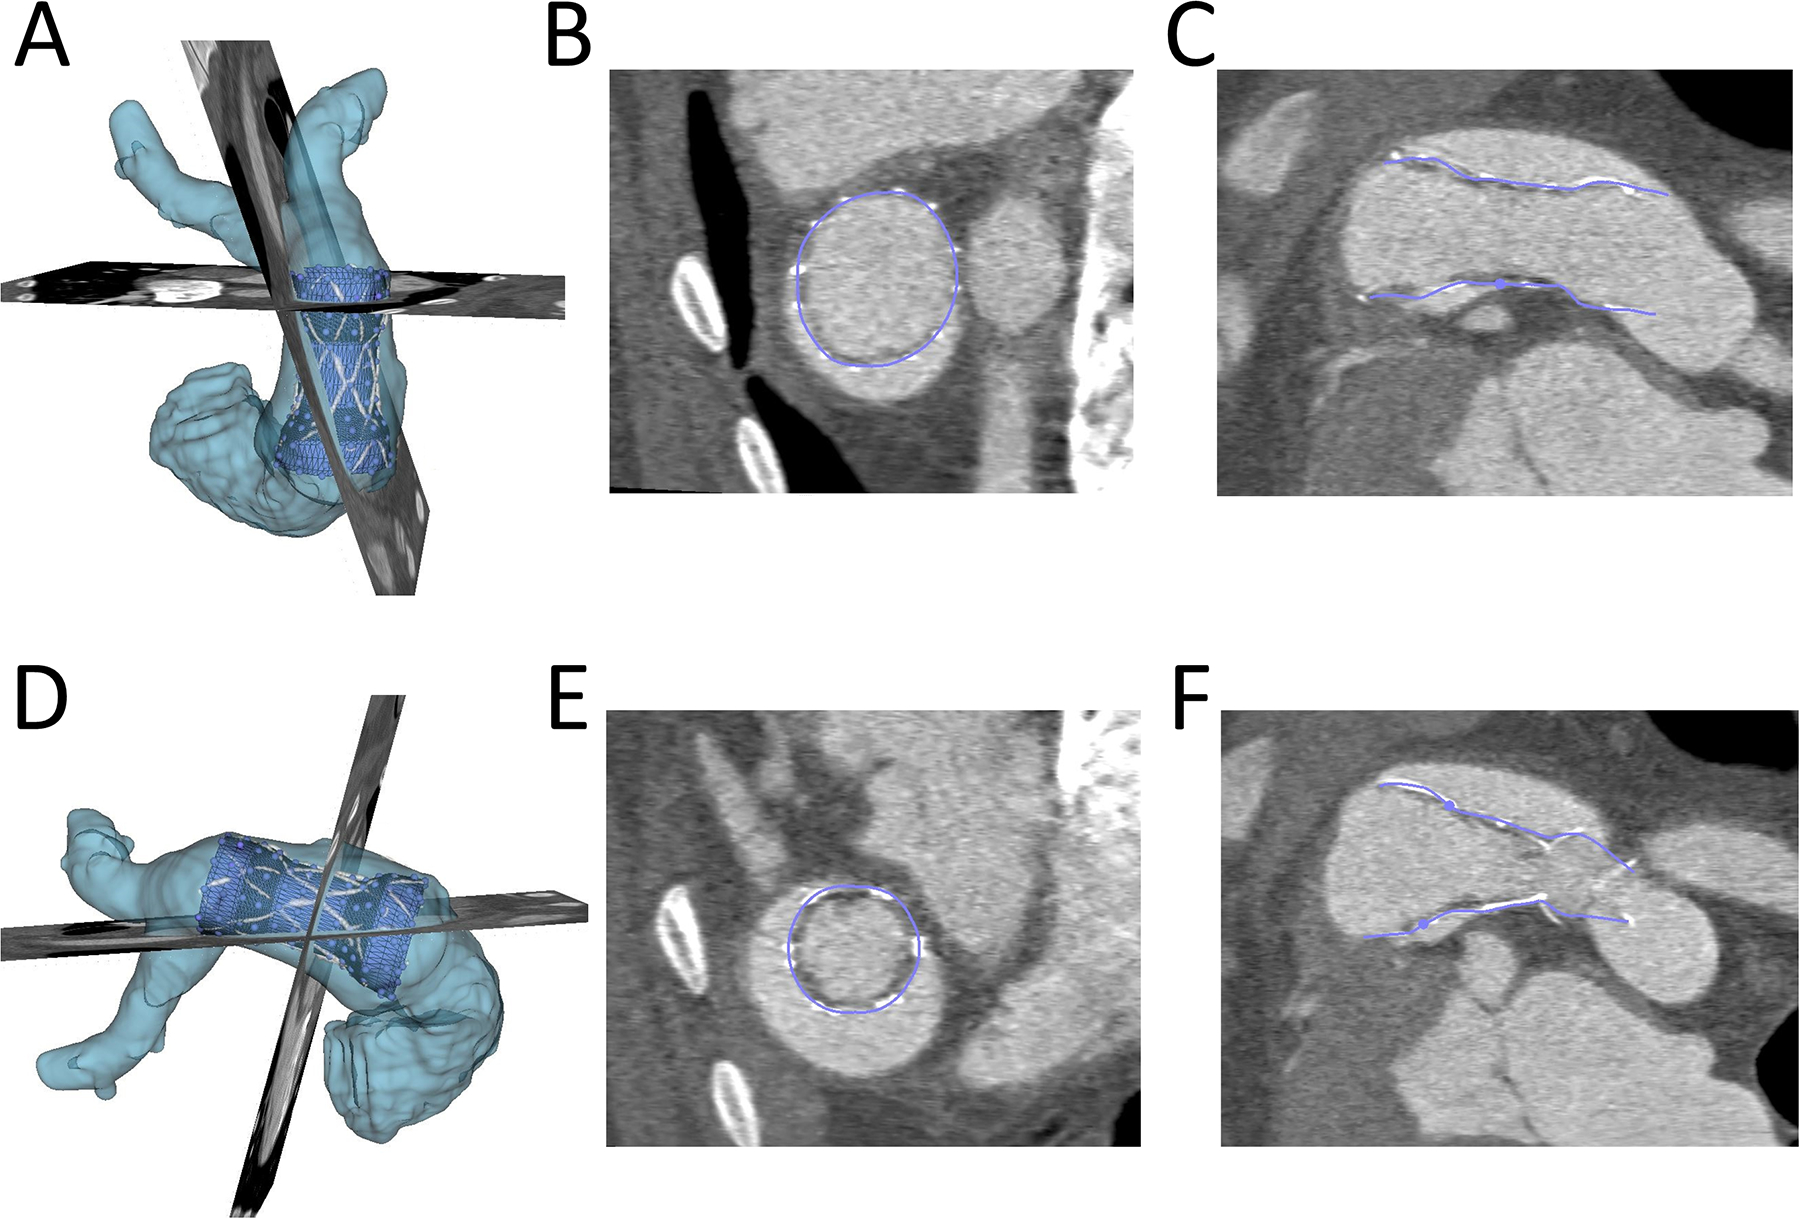
The actual volume rendered device (white), RVOT(light blue), the conformed virtual device (dark blue) are shown. A) and D): Device conformation in 3D from anterior and lateral view; B) and E) Device conformation in two axial planes; C) and F) Device conformation in two sagittal planes.
Figure 4. Demonstration of Conforming Virtual Device to the Right ventricular Outflow Tract from Pre-Implant CT Scan.
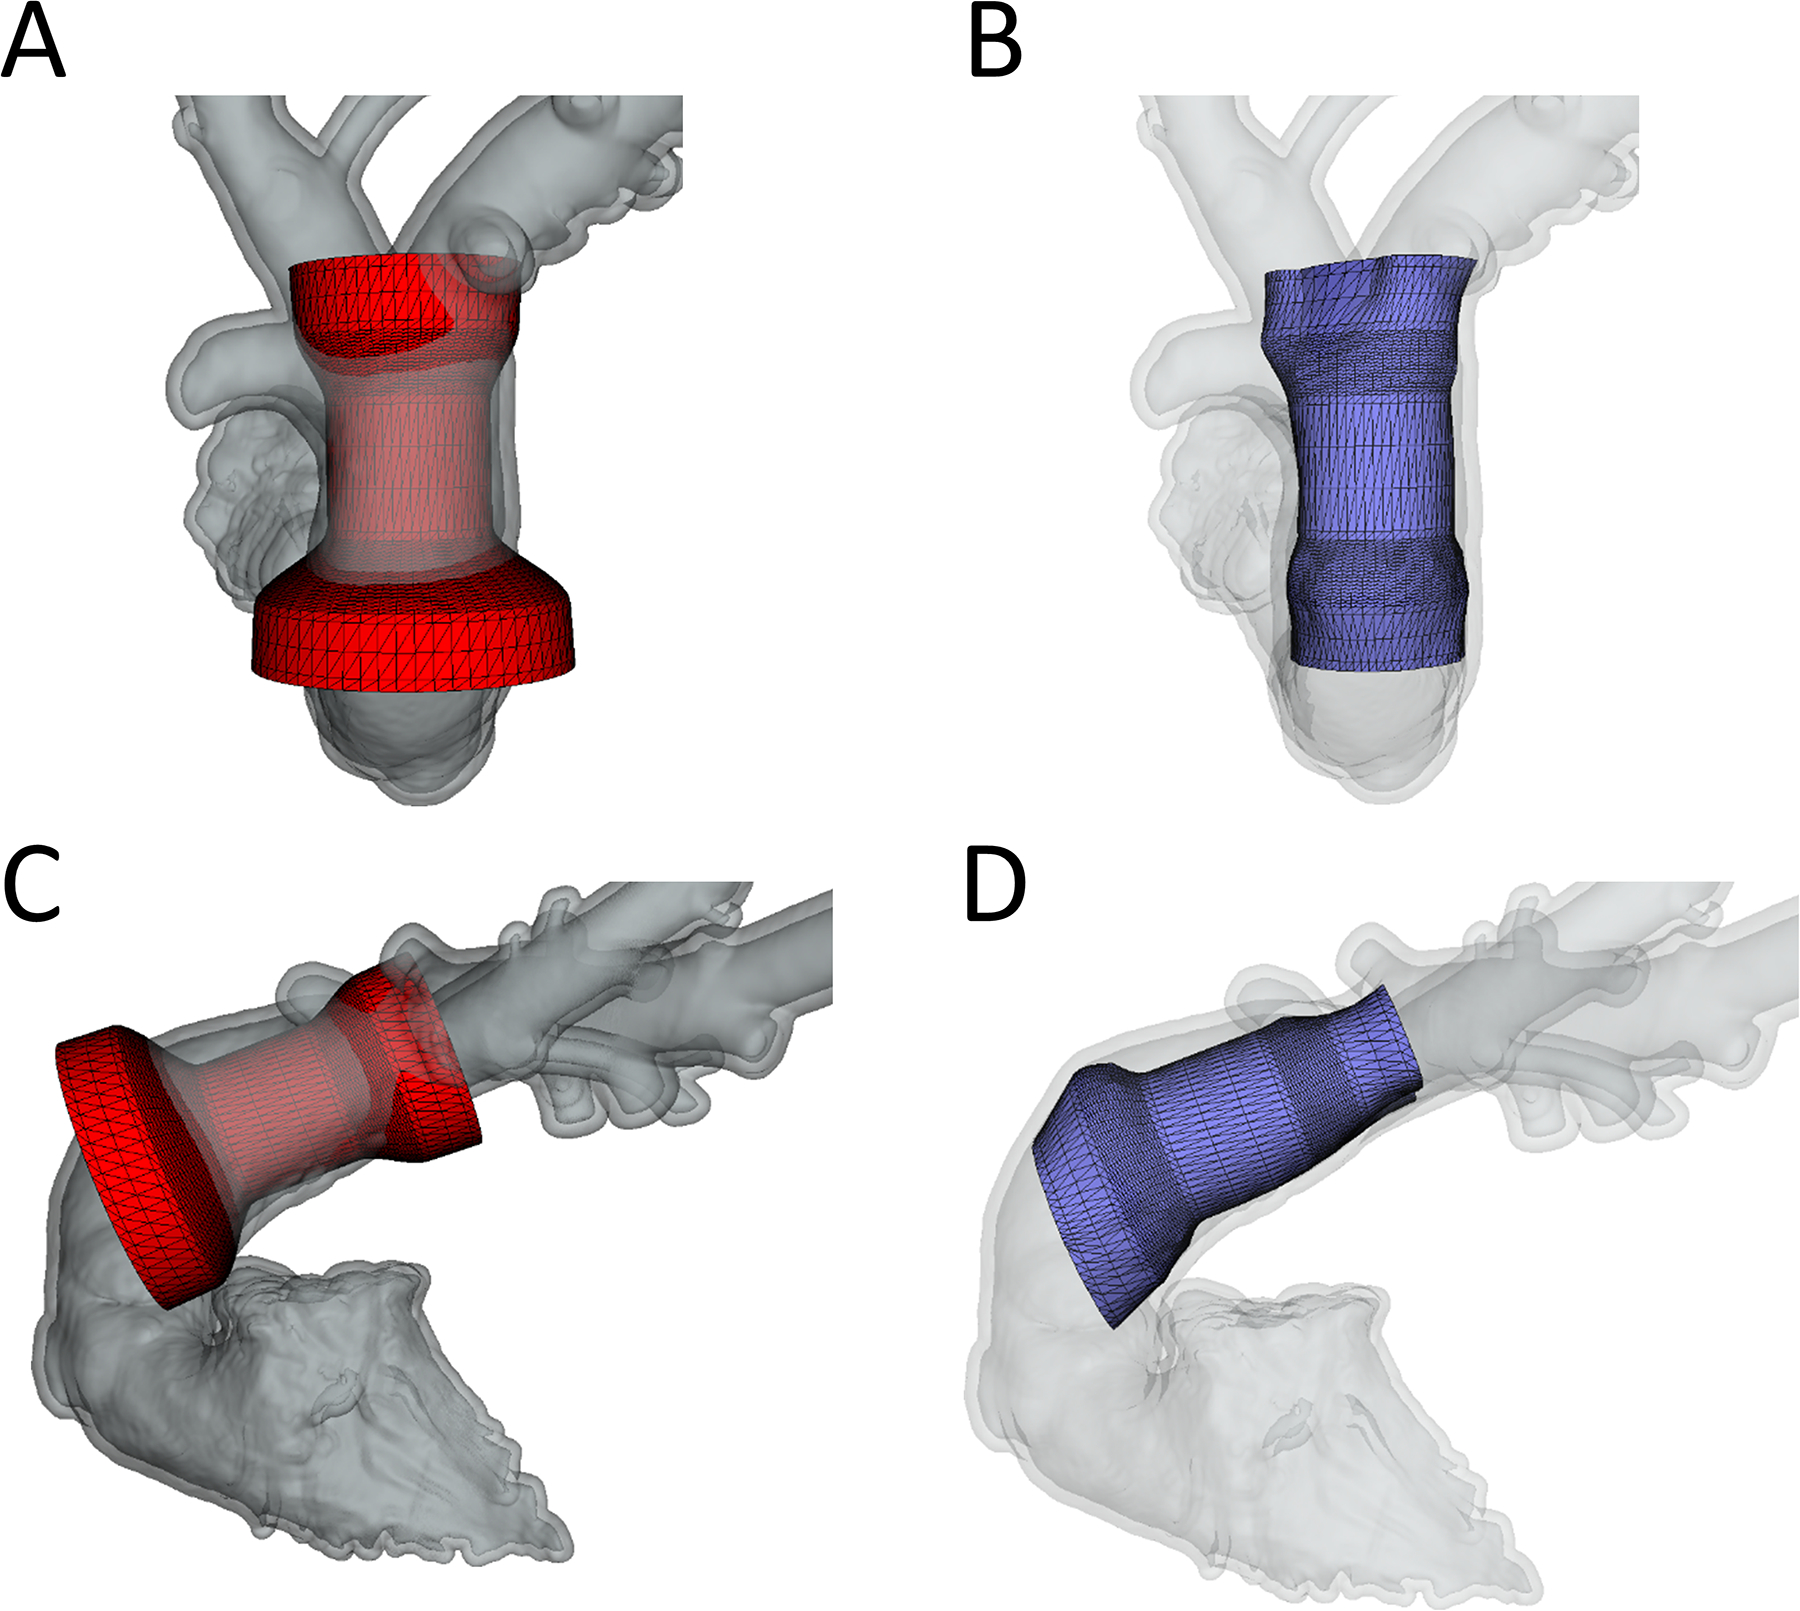
A)Frontal view of unconformed device; B) Frontal view of conformed device; C) Lateral view of unconformed device; D) Lateral view of conformed device.
Figure 5. Comparison of Pre-Modeling vs. Actual Implant in Systole and Diastole.
Computer models shown with olor scale on representing amount of compression: Blue, no compression through red significant compression. White is the volume rendered actual device implant overlayed on device segmentation with underlying model used for quantification of volumes and compression.
Characterization of Actual Implants and Pre-Implant Modeling in Systole and Diastole
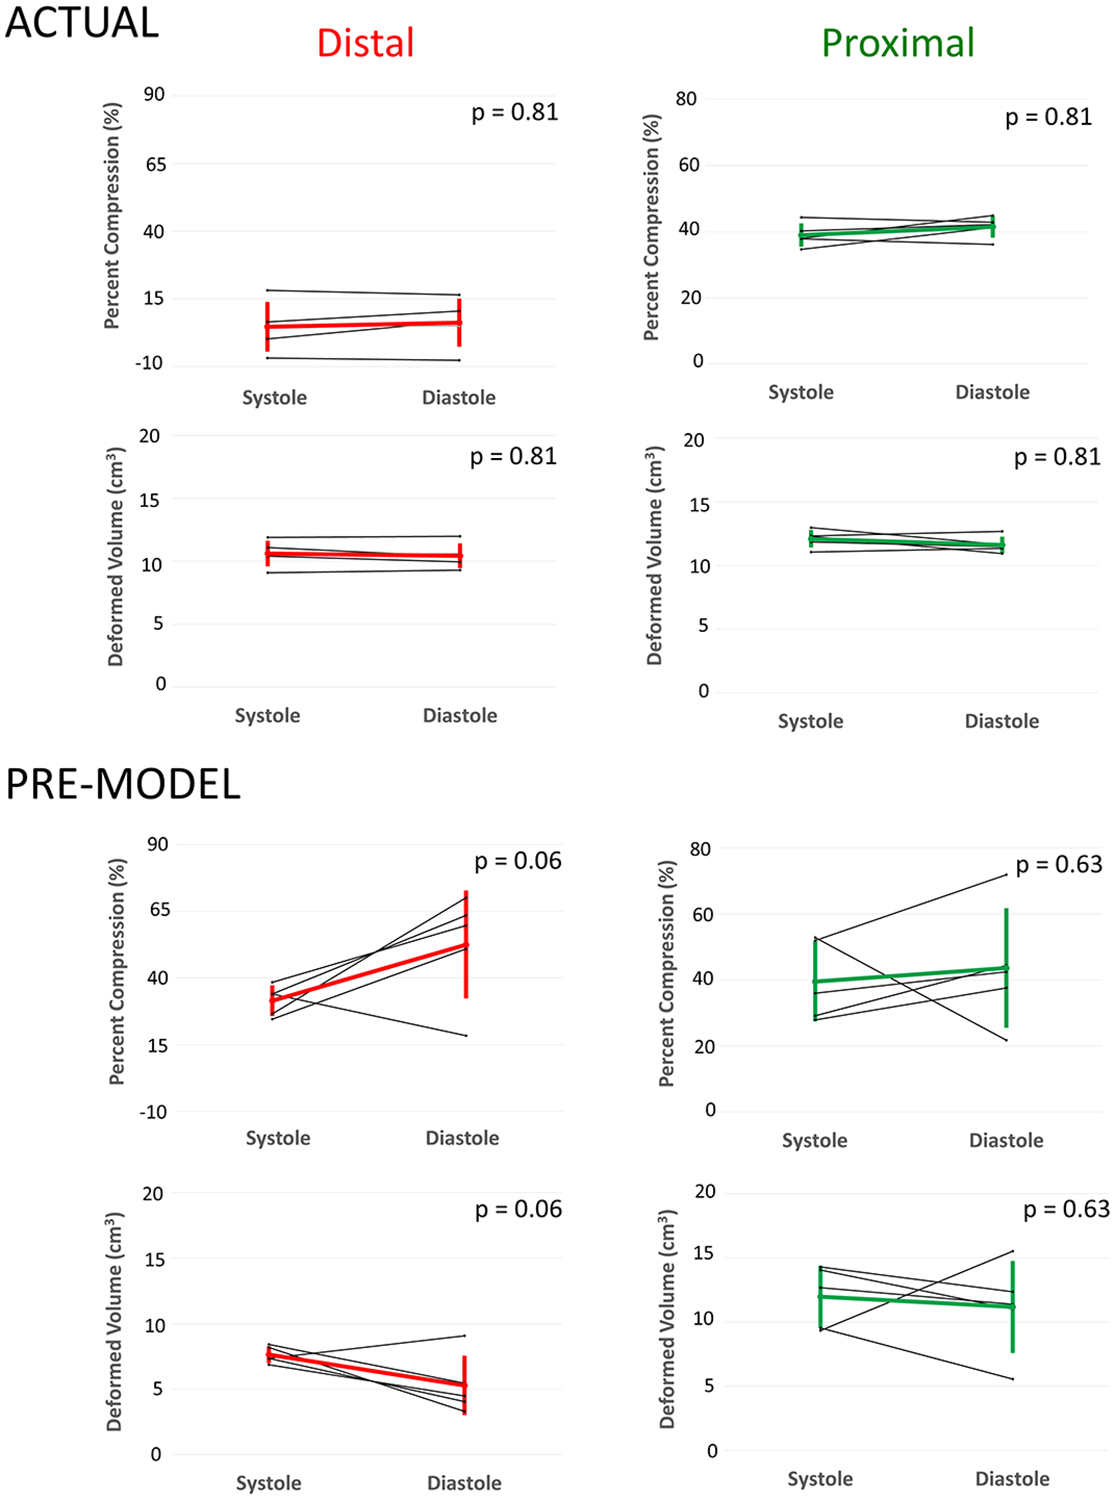
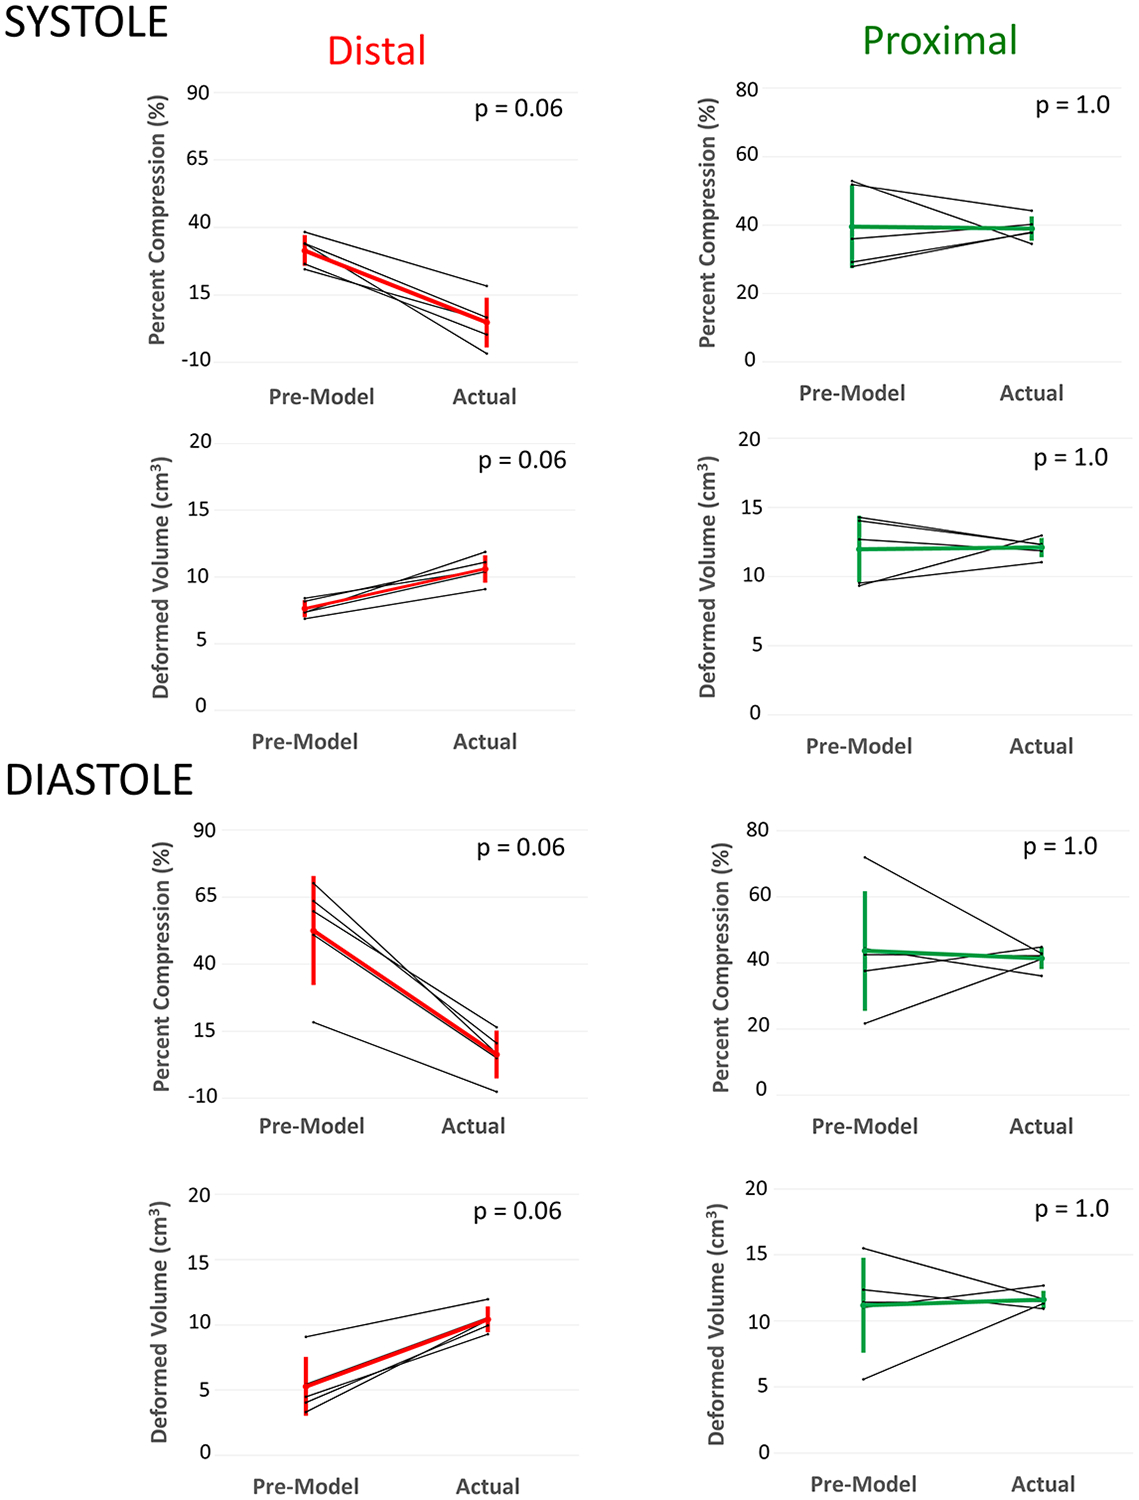
In order to quantify actual TPV volume and compression, virtual models were superimposed on actual implants as shown in figure 3 in both systole and diastole. For actual device implant fitting and quantification the models were conformed to the actual shape of the device, but predominantly in plane. Similarly, virtual implants in pre-device implant CT scans were placed in models derived from the same animals pre-implant CT scan to demonstrate pre-implant modeling as shown in Figure 4. For virtual pre-implant modeling the control points were moved within their cross sectional plane only, relative to the centerline of the device. Device volume and compression for actual TPVR and pre-implant models were compared in systole and diastole using the Wilcoxon signed rank test (Figure 6). Similarly, actual TPVR in a given animal model was compared to pre-implant modeling using the Wilcoxon signed rank test given the small sample size using SAS Studio (Figure 7). Given the small sample size limiting the lowest possible p-value attainable for the Wilcoxon signed rank test was 0.0625, a p-values less than 0.1 was considered significant. Statistics were were produced using SAS Studio 3.71 (SAS, Cary NC)
Figure 6. Changes in Device Volume and Compression from Systole and Diastole for Actual Implants (Top) and Pre-Model Virtual Implants (Bottom).
Distal: Distal third of device; Proximal: Proximal third of device. * Minimum p-value achievable with Wilcoxon signed-rank test with n=5.
Figure 7. Comparison of Actual Model Volumes and Compression to Pre-Model Volumes and Compression in Systole (Top) and Diastole (Bottom).
Total: Whole device; Distal: Distal third of device; Proximal: Proximal third of device. * Minimum p-value achievable with Wilcoxon signed-rank test with n=5.
Investigation of Visualization and Graphical Summaries for Individual Models
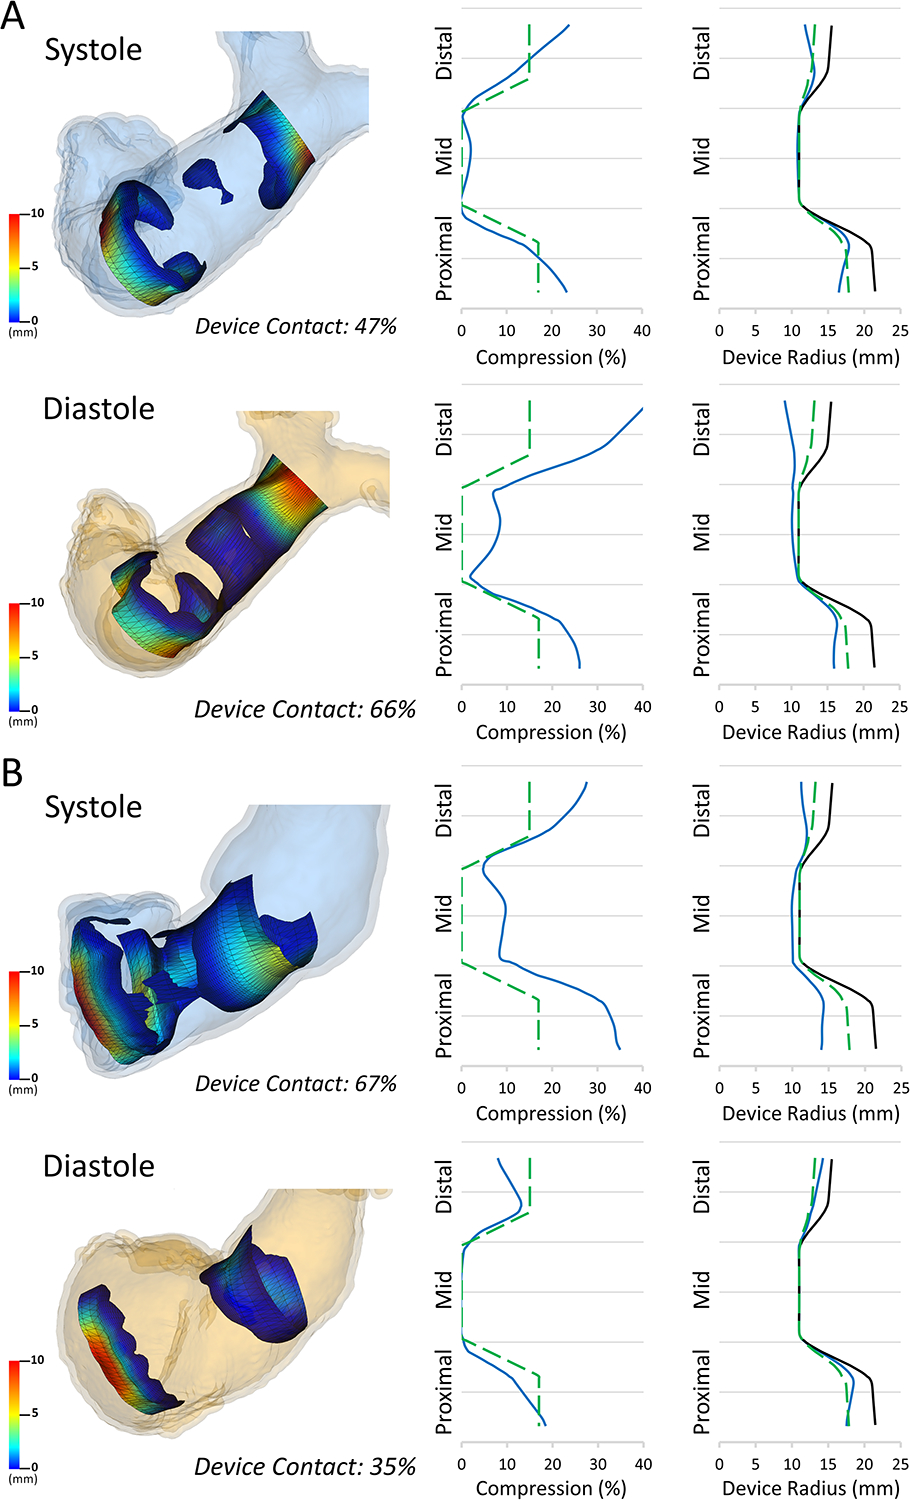
To experiment with different ways of conveying and summarizing complex 3-dimensional information we developed a “contact map”. Transparent areas in contact maps represent areas where the device was not deformed (not touching the vessel wall) while the visible color map conveys the degree of deformation for the parts of the device that are displaced (contacting the vessel wall). Similarly we developed example plots of device compression and radius which could be generated from the device modeling (Figure 7). Ideal minimal device displacement was defined as 17%, 0% and 15% in the proximal, mid and distal segments respectively, based on prior description.(18,19) These minimal compression values were plotted for comparison to actual compression for Sheep 4 and 5 (Figure 8, green dashed lines), which represented the range of deformation changes observed. Finally, virtual reality visualization was performed using the Slicer VR extension (www.slicer.org) with visualization on the HTC Vive, and Open-VR compatible virtual reality headset(HTC, New Taipei City, Taiwan).
Figure 8. Estimated Contact Visualization and Graphical Summary Data in Pre-Implant Model.
Left: Estimated contact maps for A)Device Primarily in the Pulmonary Artery(Sheep 5) and B)Device Primarily in the Right Ventricle(Sheep 4) in both Systole and Diastole. Middle: Example plot of the mean % compression (blue) relative to ideal minimal compression (dashed green) across device length for each model; Right: Example plot of mean device radius (blue) compared to ideal minimal compression (dashed green) and fully expanded device (black) for each model.
RESULTS
Median time to create right ventricular and pulmonary artery models from CT scans was 15 minutes (range 10–22 minutes). Simulated device placement took a median of 7 minutes (range 5–12 minutes). Virtual device placement could visually replicate actual device placement in post implant models (Figure 3). Virtual devices were superimposed on post-implant CT scans to quantify actual device characteristics in systole and diastole(Figure 4, Figure 5). In pairwise comparison, changes in the distal and proximal volumes of the actual device were not statistically significantly different throughout the cardiac cycle (Figure 6). Compression values had a similar, but reciprocal relationship. The changes in the mean percent compression of the distal and proximal aspects of the actual device were also not significantly different throughout the cardiac cycle(Figure 6).
In virtual implants in pre-implant CT scan based models the distal and proximal device volumes did not vary significantly throughout the cardiac cycle(Figure 6). Similarly, in virtual implants in pre-implant CT scan based models the average predicted percent compression of the distal and proximal portions of the device did not vary significantly from systole to diastole(Figure 6).
To assess the accuracy of pre-implant modeling we directly compared device volumes and compression of virtual modeling in pre-implant CT scans to actual device volumes and compression in post-implant CT scans. Visually the device appeared larger in the actual implants when compared to the pre-implant modeling (Figure 5) and this was confirmed quantitatively. The distal volume of the actual device was significantly greater than the distal volume of the virtual device in both systole and diastole (Figure 7). These differences were not statistically significant in the proximal portion in systole or diastole (Figure 7). The actual total device volume was significantly larger than the virtual total device volume in systole, but not in diastole ((Systole: 29.2 ± 1.8 cc vs. 25.9 ± 3.3 cc, p = 0.0625), (Diastole: 28.6 ± 1.3 cc vs. 21.7 ± 6.3 cc, p = 0.125)). There was the expected reciprocal relationship for percent compression. There was significantly less percent compression in the distal actual device than the distal virtual device in systole and diastole (Figure 7). The percent compression of the actual total device was significantly less than the percent compression of the virtual total device in systole, but not in diastole ((Systole: 22.3 ± 4.7% vs. 31.1 ± 8.7%, p = 0.0625), (Diastole: 24.0 ± 3.5% vs. 42.2 ± 16.9%, p = 0.125)) The percent compression did not differ significantly between the proximal actual device and the proximal virtual device in systole or diastole (Figure 7). Visualizations and graphs for each sheep are shown in supplement figures S1–S5. Models could be visualized both on screen and in virtual reality as demonstrated in Video S1.
While the above summarizes general trends there was substantial variation in the pattern of compression for different sheep (Supplement Figure 1). For example, in Sheep 4 (Figure 5) the device was largely in the right ventricle resulting in a compression pattern that was the reciprocal of a more typically placed device in the main pulmonary artery (Sheep 5). Specifically, the device positioned more proximally in the RVOT decreased in volume in systole, whereas in the other animals the device increased in volume during systole. The reciprocal changes in these two sheep are characterized in Figure 8, which also demonstrates potentially useful metrics derived from modeling such as estimated contact area and graphical depictions of device radius and compression across the length of the device.
DISCUSSION
Patients with repaired TOF and a native outflow tract constitute a large and growing population for whom transcatheter pulmonary valves are being designed and tested.(3,22,23) The challenge of device design for these patients remains the significant heterogeneity of the RVOT shape and size and the dynamic nature of the RVOT throughout the cardiac cycle. Schievano and colleagues have demonstrated a large variety of outflow tract types and mathematically characterized them into different groups.(15) However, even within groups there is significant variation in size and morphology and it is unclear if such a general distinction is sufficient to ideally match a patient to a given device. The Harmony early feasibility study employed 2D metrics and 3D printed models which assume a rigid vessel. This study is the first to quantitate the differences between the predicted device volume and compression between actual Harmony implants and those predicted by pre-implant virtual modeling assuming a rigid vessel wall, exposing limitations in the current patient selection approach. To do this we created open-source software which demonstrates potential for a visual and interactive virtual approach to assessment of self-expanding devices for TPVR, but will require further development.
Comparison of Pre-Implant Modeling to Actual Device Implants
Pre-implant modeling visually suggested dynamic changes in the distal device and RVOT and more stable volumes throughout the cardiac cycle in the proximal RVOT. However, actual device volumes both distally and proximally did not vary significantly throughout the cardiac cycle. Following actual TPVR the volumes of the distal portion of the device and RVOT were significantly larger than those predicted by the pre-implant modeling, which assumes a rigid vessel wall. This was not true for the proximal device where the pre-implant modeling appeared to more accurately reflect the post implant device. This could be due to several factors. First, the distal device sits in the main pulmonary artery, which may have more elasticity to dilate in response to the expanding spring device than the portion of the device closer to the area of the RVOT and patched annular region. Further, implantation of a competent valve has been shown to result in both systolic and diastolic dilation of the distal pulmonary vasculature.(24) Pre-implant modeling using the rigid vessel assumption was unable to account for the radial forces of the device on the vessel wall as well the additional forces generated following establishment of valve competency.(19) This preliminary evidence suggests further incorporation of vessel elasticity and other empiric feedback may be needed to improve accuracy of pre-implant virtual modeling.
Potential for Virtual Modeling to Improve Assessment of Patient Candidacy
The current methodology for assessing TPVR candidacy is not ideal.(19) First, as discussed, modeling relies on “rigid” vessel dimensions derived from it which we demonstrate may not reflect actual post implant geometry in the setting of a “spring” based self-expanding device and insertion of a competent valve. Second, current evaluation utilizes primarily 2D measurements of 3D images, which may not fully convey latent 3D information to the viewer. Patients that pass the initial 2D screening go on to have 3D printed models created which is time consuming and expensive. More importantly, while multiple physical devices could be trialed in a 3D printed model, there is no quantitative information provided on device conformation and compression, which may be critical to patient selection.
While the software in this study was designed to quantify volume and compression based on the vessels in pre-implant and post-implant CT scans, the resulting visualizations and quantifications are compelling and suggest the potential, with further development, for utilization for candidacy selection. The ultimate goal would be to utilize pre-implant tomographic imaging to develop an RVOT model which could be used to virtually implant devices in different positions along the RVOT to determine which device and device position will best fit. This will become even more important as more device shapes and sizes become available for TPVR.(18,22,23) Challenges remain, however, as realistic device structure, physics based behavior of both the device (spring rate), and vessel wall (elasticity) need to be incorporated into the models. In particular, the vessel wall elasticity may be anisotropic and difficult to determine in the setting of calcification and both native and bioprosthetic tissue in the RVOT.(14,25) This has been studied using complex finite element modeling focused on one or two patients, and have not yet been demonstrated to be practical for rapid patient-specific interactive use. Further, given the unknowns (vessel elasticity) in the setting of calcification and post-surgical changes there will likely need to be both calculated and empiric factors incorporated into such a model. We approached the modeling from the simple perspective of using the virtual modeled device to interrogate and visualize the size and geometry of the outflow track, effectively doing what is done currently in the Harmony EPS study, but using the full 3D information of the RVOT to generate automatic visualization and quantification. We hope this simple, but visual and interactive approach will converge with complex approaches using currently impractical for clinical use, seeking a balance of realistic device behavior and rapid interaction. To enable further development of this tool, and utilization for modeling of self-expanding valves in image-based models we have integrated the segmentation and device modeling tools into the 3D Slicer application(www.slicer.org), for free and open-source use.
In addition to incorporating additional factors to increase accuracy, modeling will need to be faster, perhaps with the device automatically snapping to the RVOT model, incorporating self-centering physics as described above. Similarly, automated segmentation algorithms of the RVOT could simplify RVOT model creation. The combination would allow rapid trial and error virtual testing with visualization and quantification changing based on each movement.
One of the benefits of 3D printing that is not available with on screen viewing is the ability to intuitively appreciate the actual 3D structure. However, at least some aspects of this experience may be achieved through the use of virtual reality visualization as we demonstrate in Video 1. The combination of virtual modeling and emerging technologies such as augmented reality (holograms) and virtual reality may allow a similar understanding, but with less expense, time, and quantitative feedback on device placements.
Our study focused on TPVR in repaired TOF, but the process could be applied to the implantation of other self-expanding devices into complex targets. For example, as indications for transcatheter aortic valve placement extends from high-risk calcific aortic stenosis toward regurgitant aortic valves, understanding the dimensions of these dilated and asymmetric left ventricular outflow tracts may reduce the risk of device migration and perivalvular leak.(27,28) These modeling techniques could be applied to any self-expanding device in a variety of targets.
Limitations
Our dataset consisted of 5 ovine models of pulmonary insufficiency, a number which severely limits statistical inference or generalization. A larger study applying the same methodology to human pre- and post TPVR implant imaging is needed. Our simple modeling realistically quantifies actual implant volumes and radial compression, but does not attempt to replicate exact structure (frame), or material properties of the devices. For example a real device would decrease in length with expansion, whereas our “pre-implant” modeling devices were fixed in length. The modeling software in this work was designed to model the vessel wall as a rigid structure, which does not move with device expansion. While this was necessary to demonstrate that rigid modeling differs from actual implant, our findings demonstrate that the current Harmony valve screening methods are sub-optimal. To evolve toward actual utilization, extensive work is needed to incorporate device and vessel properties as extensively detailed above.
CONCLUSIONS
Assumption of a rigid vessel wall may limit the accuracy of current approaches to patient selection for TPVR in native outflow tracts, especially in the distal third of the device. 3D image based virtual device placement shows promise for facilitating patient selection, but further incorporation of physics based modeling, as well as empiric feedback from actual human implants is needed to determine actual utility and reliability in this complex population.
Supplementary Material
Left: Computer models showing color scale to represent amount of compression. Blue, no compression through red, significant compression; Middle: Plot of mean % compression (blue) relative to ideal minimal compression (dashed green) across device length; Right: Plot of mean device radius (blue) compared to ideal minimal compression (dashed green) and fully expanded device (black).
Left: Computer models showing color scale to represent amount of compression. Blue, no compression through red, significant compression; Middle: Plot of mean % compression (blue) relative to ideal minimal compression (dashed green) across device length; Right: Plot of mean device radius (blue) compared to ideal minimal compression (dashed green) and fully expanded device (black).
Left: Computer models showing color scale to represent amount of compression. Blue, no compression through red, significant compression; Middle: Plot of mean % compression (blue) relative to ideal minimal compression (dashed green) across device length; Right: Plot of mean device radius (blue) compared to ideal minimal compression (dashed green) and fully expanded device (black).
Left: Computer models showing color scale to represent amount of compression. Blue, no compression through red, significant compression; Middle: Plot of mean % compression (blue) relative to ideal minimal compression (dashed green) across device length; Right: Plot of mean device radius (blue) compared to ideal minimal compression (dashed green) and fully expanded device (black).
Left: Computer models showing color scale to represent amount of compression. Blue, no compression through red, significant compression; Middle: Plot of mean % compression (blue) relative to ideal minimal compression (dashed green) across device length; Right: Plot of mean device radius (blue) compared to ideal minimal compression (dashed green) and fully expanded device (black).
Video S1: Demonstration of Visualization of Modeling On-Screen and in Virtual Reality
FUNDING
Computer modeling was supported the Department of Anesthesia and Critical Care at The Children’s Hospital of Philadelphia, the National Institute of Biomedical Imaging and Bioengineering (NIBIB) (P41 EB015902), Cancer Care Ontario, and CANARIES research software program. Animal modeling of the images utilized for this study was supported by The Children’s Hospital of Philadelphia, as well as philanthropic support from Mr. Richard Seidel and family.
Abbreviations:
- 3D
Three-dimensional
- 2D
Two-dimensional
- CHD
Congenital Heart Disease
- EFS
Harmony Early Feasibility Study
- PI
Pulmonary insufficiency
- PVR
Pulmonary Valve Replacement
- TAP
Transannular patch
- ToF
Tetralogy of Fallot
- TPVR
Transcatheter Pulmonary Valve Replacement
- RVOT
Right ventricular outflow tract
Footnotes
DISCLOSURES
Drs. Gillespie and Morray serve as consultants for Medtronic, the manufacturer of the Harmony Device. The other authors report no conflicts.
REFERENCES
- 1.Al Habib HF, Jacobs JP, Mavroudis C, Tchervenkov CI, O’Brien SM, Mohammadi S, Jacobs ML. Contemporary patterns of management of tetralogy of Fallot: data from the Society of Thoracic Surgeons Database. Ann Thorac Surg 2010;90(3):813–9; discussion 819–20. [DOI] [PubMed] [Google Scholar]
- 2.Apitz C, Webb GD, Redington AN. Tetralogy of fallot. The Lancet 2009;374(9699):1462–1471. [DOI] [PubMed] [Google Scholar]
- 3.Schoonbeek RC, Takebayashi S, Aoki C, Shimaoka T, Harris MA, Fu GL, Kim TS, Dori Y, McGarvey J, Litt H and others. Implantation of the Medtronic Harmony Transcatheter Pulmonary Valve Improves Right Ventricular Size and Function in an Ovine Model of Postoperative Chronic Pulmonary Insufficiency. Circ Cardiovasc Interv 2016;9(10). [DOI] [PMC free article] [PubMed] [Google Scholar]
- 4.Geva T. Repaired tetralogy of Fallot: the roles of cardiovascular magnetic resonance in evaluating pathophysiology and for pulmonary valve replacement decision support. J Cardiovasc Magn Reson 2011;13:9. [DOI] [PMC free article] [PubMed] [Google Scholar]
- 5.Geva T. Indications for pulmonary valve replacement in repaired tetralogy of fallot: the quest continues. Circulation 2013;128(17):1855–7. [DOI] [PMC free article] [PubMed] [Google Scholar]
- 6.Geva T, Sandweiss BM, Gauvreau K, Lock JE, Powell AJ. Factors associated with impaired clinical status in long-term survivors of tetralogy of Fallot repair evaluated by magnetic resonance imaging. J Am Coll Cardiol 2004;43(6):1068–74. [DOI] [PubMed] [Google Scholar]
- 7.Valente AM, Gauvreau K, Assenza GE, Babu-Narayan SV, Schreier J, Gatzoulis MA, Groenink M, Inuzuka R, Kilner PJ, Koyak Z and others. Contemporary predictors of death and sustained ventricular tachycardia in patients with repaired tetralogy of Fallot enrolled in the INDICATOR cohort. Heart 2014;100(3):247–53. [DOI] [PMC free article] [PubMed] [Google Scholar]
- 8.Biernacka EK, Ruzyllo W, Demkow M, Kowalski M, Spiewak M, Piotrowski W, Kusmierczyk M, Banas S, Rozanski J, Hoffman P. Transcatheter pulmonary valve implantation in patients with right ventricular outflow tract dysfunction: early and mid-term results. J Invasive Cardiol 2015;27(6):E82–9. [PubMed] [Google Scholar]
- 9.Demkow M, Ruzyllo W, Biernacka EK, Kalinczuk L, Spiewak M, Kowalski M, Sitkowska E, Kusmierczyk M, Rozanski J, Banas S and others. Percutaneous Edwards SAPIEN() valve implantation for significant pulmonary regurgitation after previous surgical repair with a right ventricular outflow patch. Catheter Cardiovasc Interv 2014;83(3):474–81. [DOI] [PubMed] [Google Scholar]
- 10.Ghawi H, Kenny D, Hijazi ZM. Transcatheter pulmonary valve replacement. Cardiol Ther 2012;1(1):5. [DOI] [PMC free article] [PubMed] [Google Scholar]
- 11.Kenny D, Hijazi ZM, Kar S, Rhodes J, Mullen M, Makkar R, Shirali G, Fogel M, Fahey J, Heitschmidt MG and others. Percutaneous implantation of the Edwards SAPIEN transcatheter heart valve for conduit failure in the pulmonary position: early phase 1 results from an international multicenter clinical trial. J Am Coll Cardiol 2011;58(21):2248–56. [DOI] [PubMed] [Google Scholar]
- 12.O’Byrne ML, Glatz AC, Mercer-Rosa L, Gillespie MJ, Dori Y, Goldmuntz E, Kawut S, Rome JJ. Trends in pulmonary valve replacement in children and adults with tetralogy of fallot. Am J Cardiol 2015;115(1):118–24. [DOI] [PMC free article] [PubMed] [Google Scholar]
- 13.Cheatham JP, Hellenbrand WE, Zahn EM, Jones TK, Berman DP, Vincent JA, McElhinney DB. Clinical and hemodynamic outcomes up to 7 years after transcatheter pulmonary valve replacement in the US melody valve investigational device exemption trial. Circulation 2015;131(22):1960–70. [DOI] [PubMed] [Google Scholar]
- 14.Capelli C, Taylor AM, Migliavacca F, Bonhoeffer P, Schievano S. Patient-specific reconstructed anatomies and computer simulations are fundamental for selecting medical device treatment: application to a new percutaneous pulmonary valve. Philos Trans A Math Phys Eng Sci 2010;368(1921):3027–38. [DOI] [PMC free article] [PubMed] [Google Scholar]
- 15.Schievano S, Coats L, Migliavacca F, Norman W, Frigiola A, Deanfield J, Bonhoeffer P, Taylor AM. Variations in right ventricular outflow tract morphology following repair of congenital heart disease: implications for percutaneous pulmonary valve implantation. J Cardiovasc Magn Reson 2007;9(4):687–95. [DOI] [PubMed] [Google Scholar]
- 16.Schievano S, Migliavacca F, Coats L, Khambadkone S, Carminati M, Wilson N, Deanfield JE, Bonhoeffer P, Taylor AM. Percutaneous pulmonary valve implantation based on rapid prototyping of right ventricular outflow tract and pulmonary trunk from MR data. Radiology 2007;242(2):490–7. [DOI] [PubMed] [Google Scholar]
- 17.Lurz P, Bonhoeffer P. Percutaneous implantation of pulmonary valves for treatment of right ventricular outflow tract dysfunction. Cardiol Young 2008;18(3):260–7. [DOI] [PubMed] [Google Scholar]
- 18.Bergersen L, Benson LN, Gillespie MJ, Cheatham SL, Crean AM, Hor KN, Horlick EM, Lung TH, McHenry BT, Osten MD and others. Harmony Feasibility Trial: Acute and Short-Term Outcomes With a Self-Expanding Transcatheter Pulmonary Valve. JACC Cardiovasc Interv 2017;10(17):1763–1773. [DOI] [PubMed] [Google Scholar]
- 19.Gillespie MJ, Benson LN, Bergersen L, Bacha EA, Cheatham SL, Crean AM, Eicken A, Ewert P, Geva T, Hellenbrand WE and others. Patient Selection Process for the Harmony Transcatheter Pulmonary Valve Early Feasibility Study. Am J Cardiol 2017. [DOI] [PubMed] [Google Scholar]
- 20.Fedorov A, Beichel R, Kalpathy-Cramer J, Finet J, Fillion-Robin JC, Pujol S, Bauer C, Jennings D, Fennessy F, Sonka M and others. 3D Slicer as an image computing platform for the Quantitative Imaging Network. Magn Reson Imaging 2012;30(9):1323–41. [DOI] [PMC free article] [PubMed] [Google Scholar]
- 21.Ungi T, Lasso A, Fichtinger G. Open-source platforms for navigated image-guided interventions. Med Image Anal 2016;33:181–6. [DOI] [PubMed] [Google Scholar]
- 22.Husain J, Praichasilchai P, Gilbert Y, Qureshi SA, Morgan GJ. Early European experience with the Venus P-valve(R): filling the gap in percutaneous pulmonary valve implantation. EuroIntervention 2016;12(5):e643–51. [DOI] [PubMed] [Google Scholar]
- 23.Promphan W, Prachasilchai P, Siripornpitak S, Qureshi SA, Layangool T. Percutaneous pulmonary valve implantation with the Venus P-valve: clinical experience and early results. Cardiology in the young 2016;26(04):698–710. [DOI] [PubMed] [Google Scholar]
- 24.Callahan R, Bergersen L, Lock JE, Marshall AC. Transcatheter Pulmonary Valve Replacement and Acute Increase in Diastolic Pressure are Associated with Increases in Both Systolic and Diastolic Pulmonary Artery Dimensions. Pediatr Cardiol 2017;38(3):456–464. [DOI] [PubMed] [Google Scholar]
- 25.Capelli C, Biglino G, Petrini L, Migliavacca F, Cosentino D, Bonhoeffer P, Taylor AM, Schievano S. Finite element strategies to satisfy clinical and engineering requirements in the field of percutaneous valves. Ann Biomed Eng 2012;40(12):2663–73. [DOI] [PubMed] [Google Scholar]
- 26.Schievano S, Taylor AM, Capelli C, Coats L, Walker F, Lurz P, Nordmeyer J, Wright S, Khambadkone S, Tsang V. First-in-man implantation of a novel percutaneous valve: a new approach to medical device development. EuroIntervention: journal of EuroPCR in collaboration with the Working Group on Interventional Cardiology of the European Society of Cardiology 2010;5(6):745–750. [DOI] [PubMed] [Google Scholar]
- 27.Sawaya FJ, Deutsch MA, Seiffert M, Yoon SH, Codner P, Wickramarachchi U, Latib A, Petronio AS, Rodes-Cabau J, Taramasso M and others. Safety and Efficacy of Transcatheter Aortic Valve Replacement in the Treatment of Pure Aortic Regurgitation in Native Valves and Failing Surgical Bioprostheses: Results From an International Registry Study. JACC Cardiovasc Interv 2017;10(10):1048–1056. [DOI] [PubMed] [Google Scholar]
- 28.Hira RS, Vemulapalli S, Li Z, McCabe JM, Rumsfeld JS, Kapadia SR, Alam M, Jneid H, Don C, Reisman M and others. Trends and Outcomes of Off-Label Use of Transcatheter Aortic Valve Replacement: Insights From the NCDR STS/ACC TVT Registry. JAMA Cardiol 2017. [DOI] [PMC free article] [PubMed] [Google Scholar]
Associated Data
This section collects any data citations, data availability statements, or supplementary materials included in this article.
Supplementary Materials
Left: Computer models showing color scale to represent amount of compression. Blue, no compression through red, significant compression; Middle: Plot of mean % compression (blue) relative to ideal minimal compression (dashed green) across device length; Right: Plot of mean device radius (blue) compared to ideal minimal compression (dashed green) and fully expanded device (black).
Left: Computer models showing color scale to represent amount of compression. Blue, no compression through red, significant compression; Middle: Plot of mean % compression (blue) relative to ideal minimal compression (dashed green) across device length; Right: Plot of mean device radius (blue) compared to ideal minimal compression (dashed green) and fully expanded device (black).
Left: Computer models showing color scale to represent amount of compression. Blue, no compression through red, significant compression; Middle: Plot of mean % compression (blue) relative to ideal minimal compression (dashed green) across device length; Right: Plot of mean device radius (blue) compared to ideal minimal compression (dashed green) and fully expanded device (black).
Left: Computer models showing color scale to represent amount of compression. Blue, no compression through red, significant compression; Middle: Plot of mean % compression (blue) relative to ideal minimal compression (dashed green) across device length; Right: Plot of mean device radius (blue) compared to ideal minimal compression (dashed green) and fully expanded device (black).
Left: Computer models showing color scale to represent amount of compression. Blue, no compression through red, significant compression; Middle: Plot of mean % compression (blue) relative to ideal minimal compression (dashed green) across device length; Right: Plot of mean device radius (blue) compared to ideal minimal compression (dashed green) and fully expanded device (black).
Video S1: Demonstration of Visualization of Modeling On-Screen and in Virtual Reality


