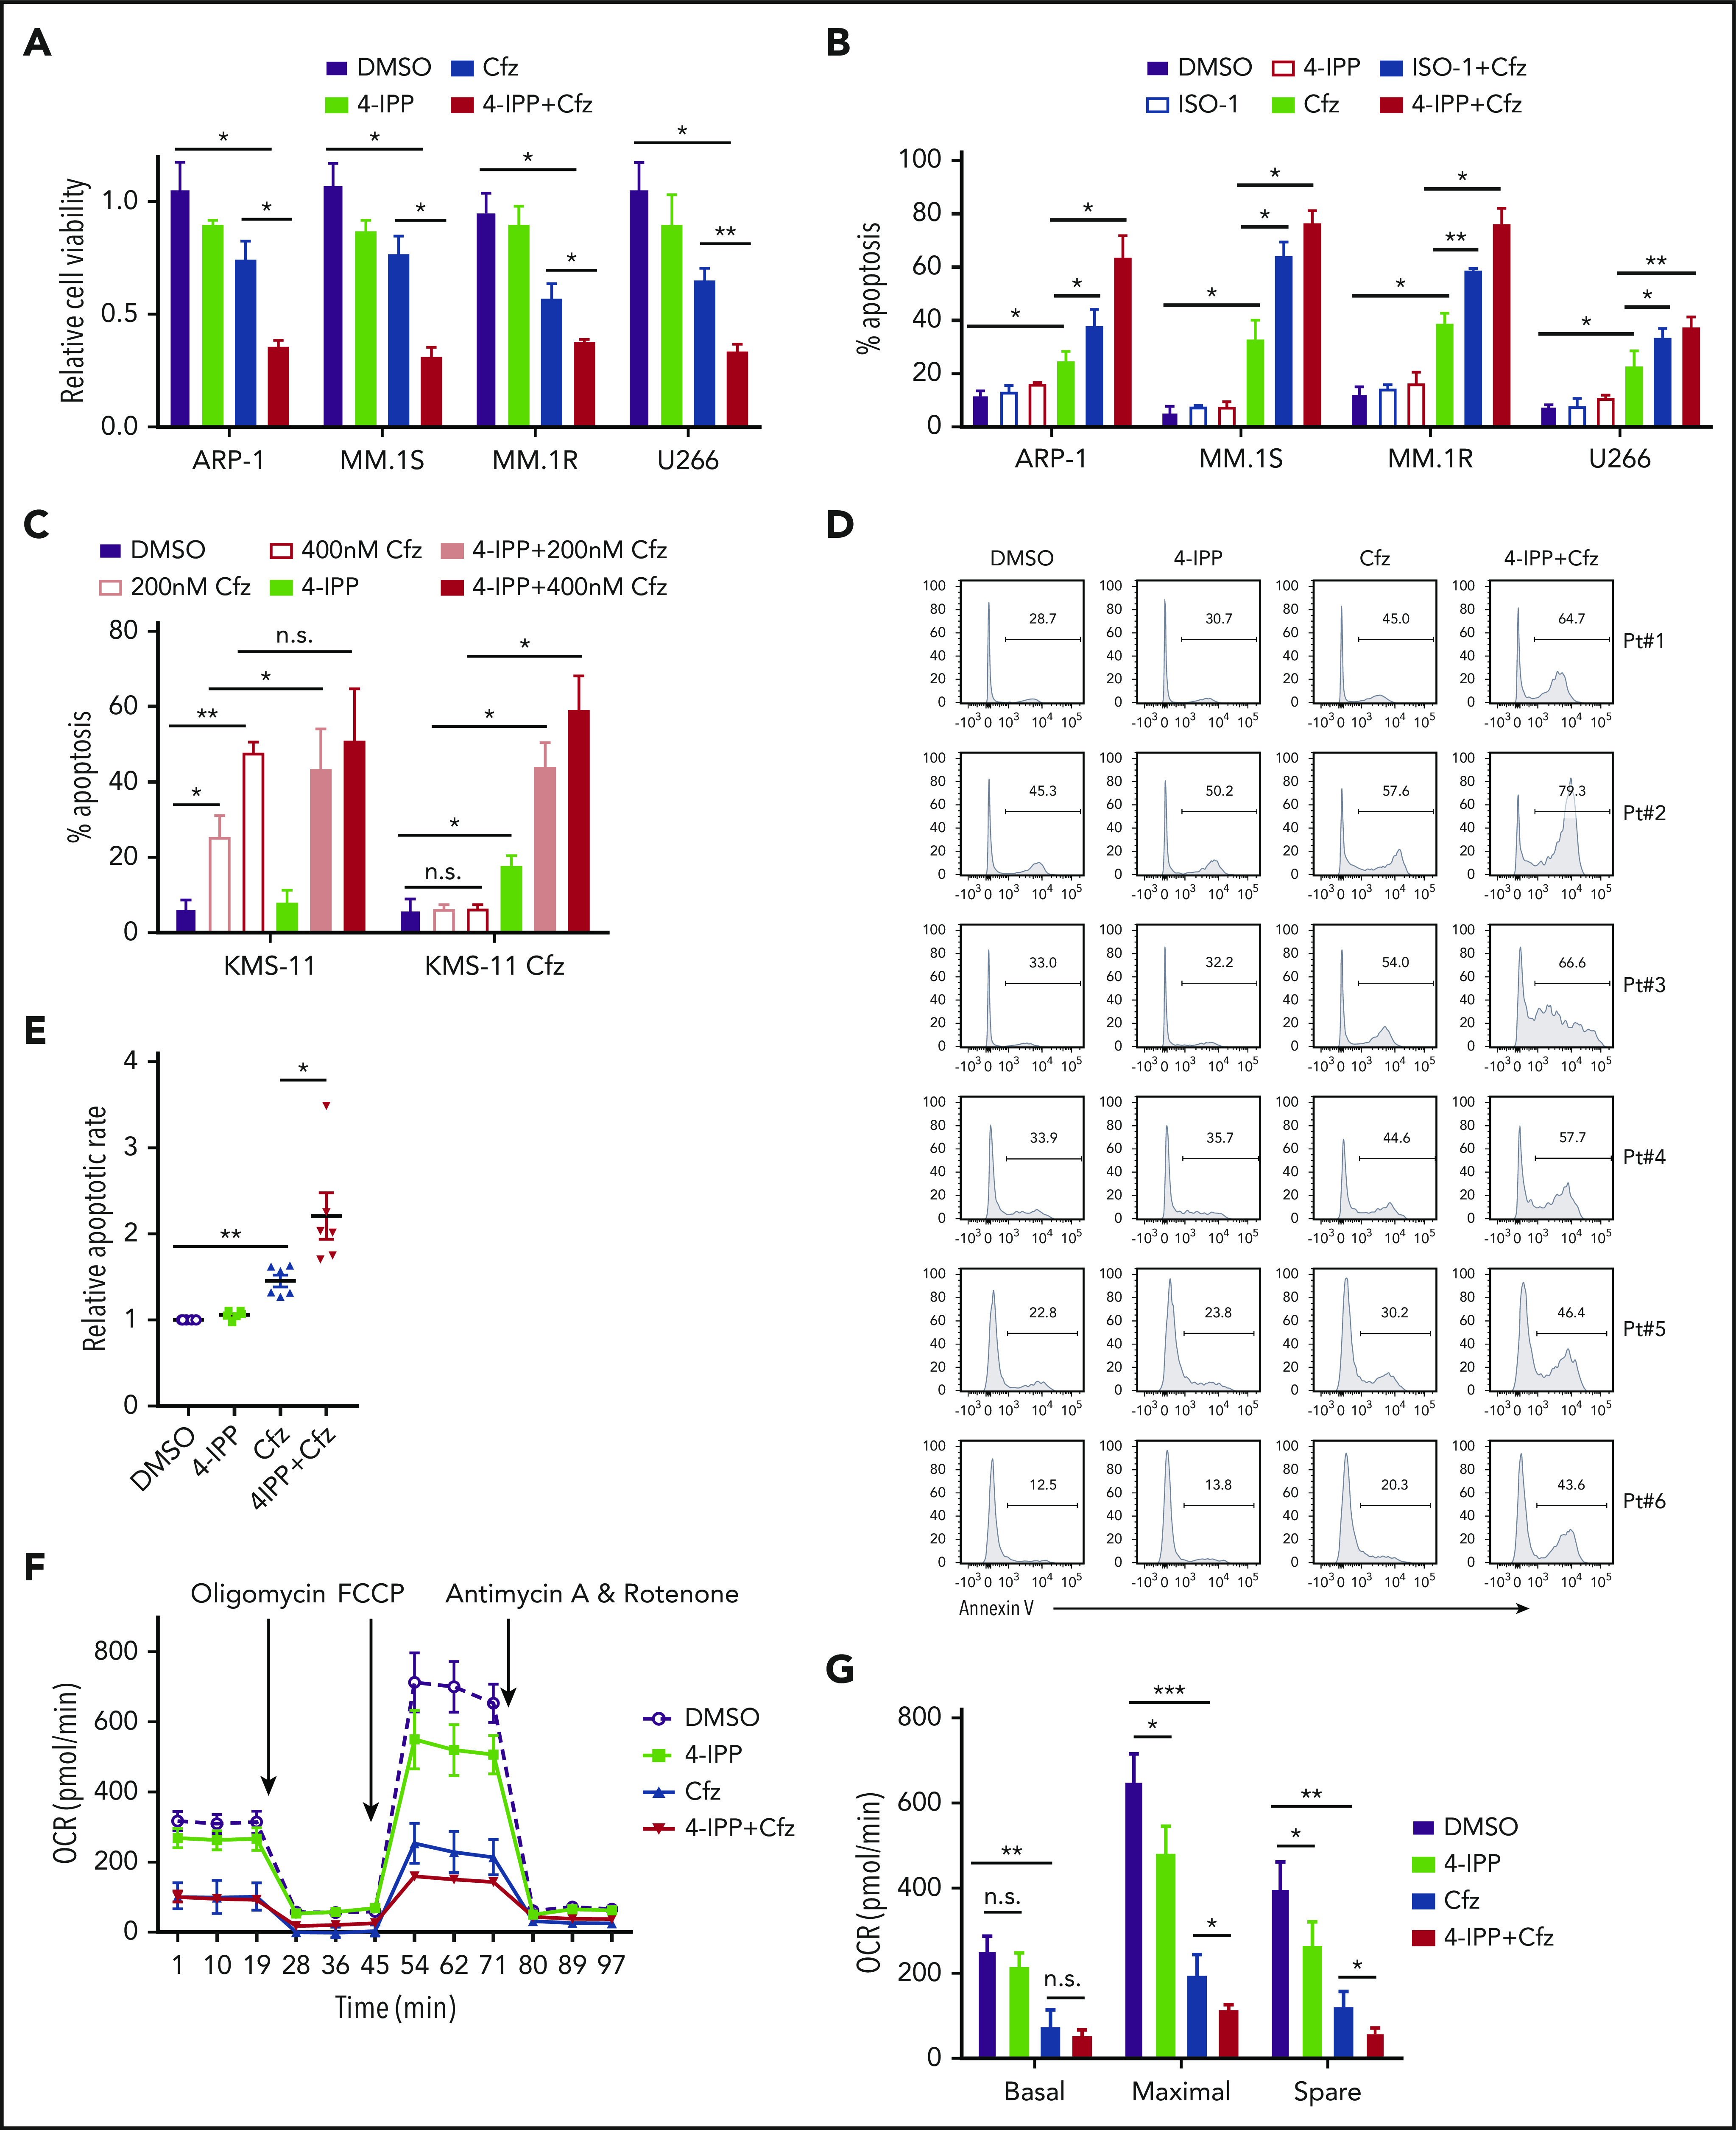
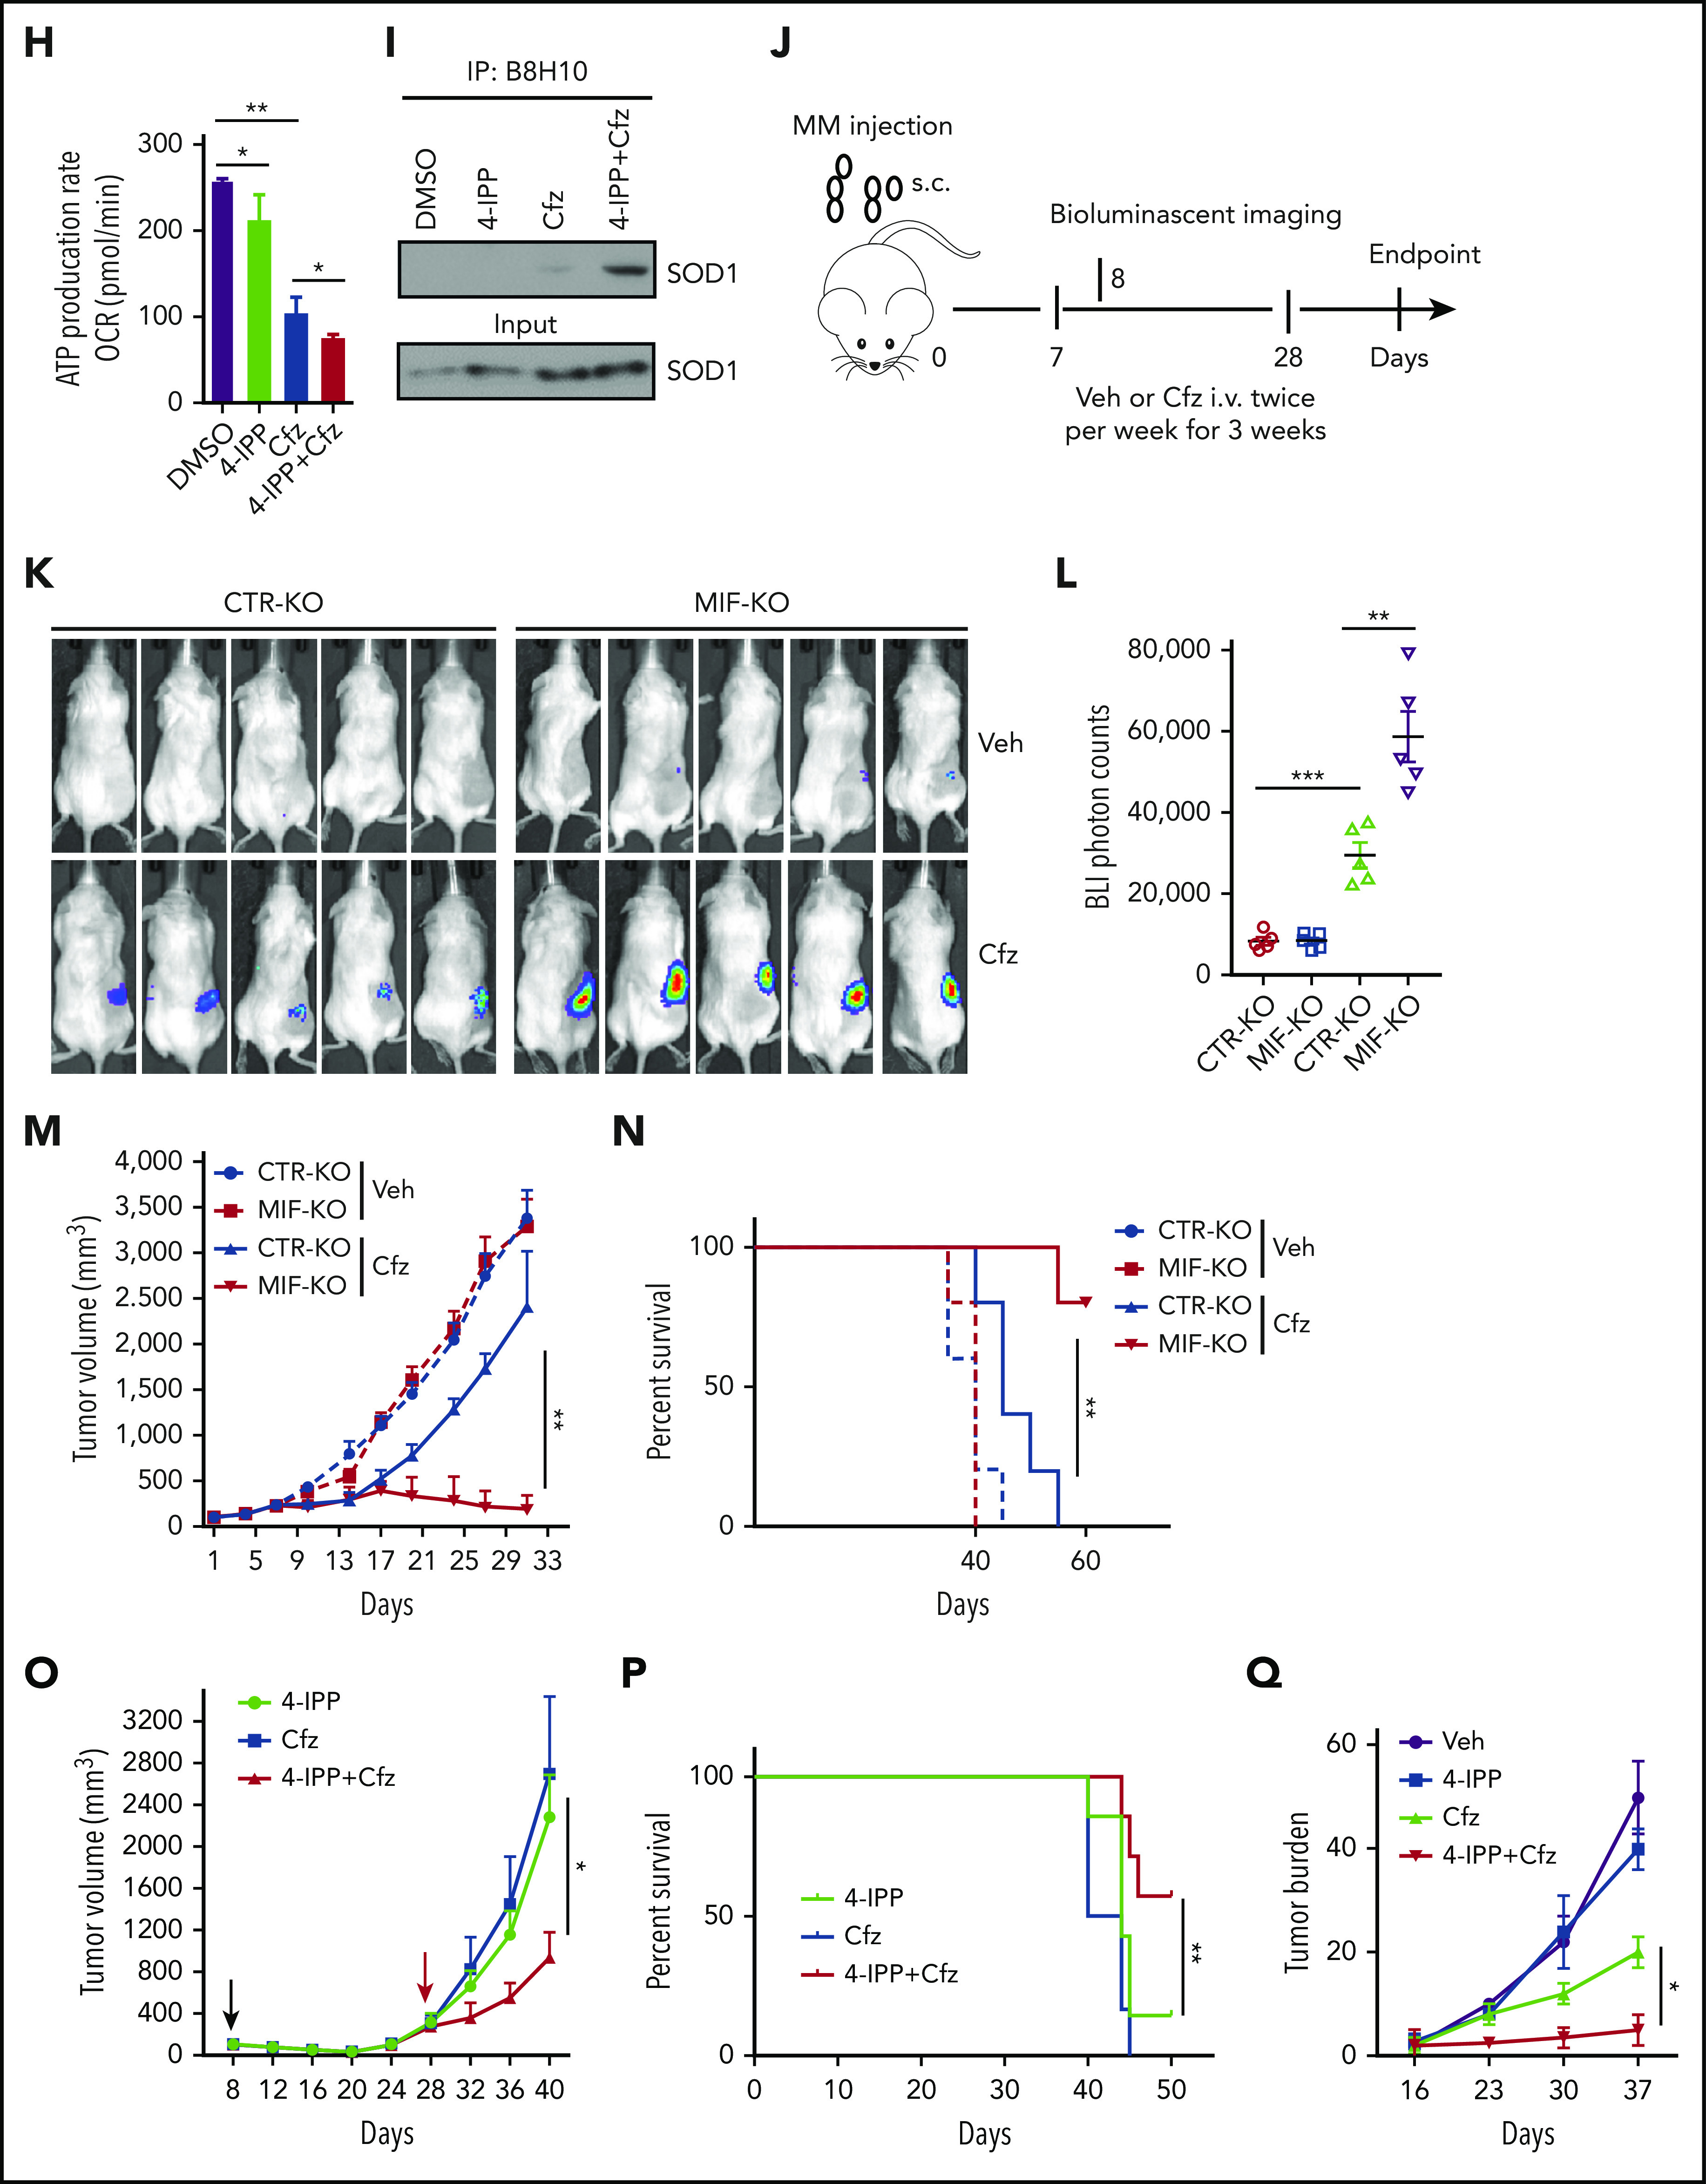
Figure 6.


MIF inhibitors sensitize human MM cells to PIs in vitro and in vivo. (A) Cell viability of human MM cell lines pulsed with DMSO or 80 nM Cfz for 1 hour and treated without or with 10 μM 4-IPP (4-IPP+Cfz) for 48 hours, normalized with DMSO-treated group. (B) Summarized results of apoptosis of human MM cell lines at 24 hours after treatment with DMSO, 4-IPP, 10 μM ISO-1, Cfz, 4-IPP+Cfz, or ISO-1+Cfz. (C) Summarized results of apoptotic rates in KMS-11 or KMS-11/Cfz MM cells at 24 hours after treatment with DMSO, 4-IPP, and Cfz at the indicated concentrations, or 4-IPP+Cfz. Flow cytometry histogram (D) and summarized results (E) of apoptotic rates in primary MM cells (n = 6) treated with DMSO, 4-IPP, Cfz, or 4-IPP+Cfz for 24 hours. Mitochondrial respiration (OCR) (F) and summarized results of basal OCR, maximum OCR, spare OCR (G), or ATP production OCR (H) in ARP-1 MM cells treated with DMSO, 4-IPP, Cfz, or 4-IPP+Cfz for 16 hours. (I) Misfolded SOD1 expression in ARP-1 MM cells treated with DMSO, 4-IPP, Cfz, or 4-IPP+Cfz for 16 hours. (J) NSG mice were injected subcutaneously (s.c.) with 2 × 10⁶ CTR-KO or MIF-KO ARP-1 MM cells. At day 7 after tumor inoculation, vehicle (Veh) or 3 mg/kg Cfz were IV injected, 2 consecutive days in a week and repeated for 3 weeks, into MM-bearing mice (n = 5 for each group). At day 8, MM-bearing mice were intraperitoneally (IP) injected with L 012 sodium salt and detected in vivo for ROS signal by bioluminescent imaging (K,L). (M) Tumor volume was calculated from caliper measurements every 3 to 4 days. (N) Survival curves of CTR-KO or MIF-KO MM-bearing mice treated with Veh or Cfz. (O,P) NSG mice were injected s.c. with 2 × 10⁶ ARP-1 MM cells. At day 8 after tumor inoculation, Veh or 1 mg/kg Cfz was IV injected, 2 consecutive days weekly, into MM-bearing mice. At day 28 when the size of some tumors enlarged to 10 mm, MM-bearing mice received treatment with a high dose of Cfz (3 mg/kg for 2 consecutive days weekly; n = 6) or 4-IPP (0.5 mg per mouse for every 3 days; n = 7) alone, or their combinations (n = 6) until the end of the experiment. Tumor volume (O) and survival curves (P) were calculated. (Q-T) NSG mice were injected IV with 2 × 10⁶ MM.1S or ARP-1 MM cells. At day 14 after tumor inoculation, Veh, 4-IPP, Cfz, or 4-IPP+Cfz was injected into MM-bearing mice (n = 5 per group). Blood samples were collected weekly starting at day 16. Tumor burden (Q,S), analyzed by using enzyme-linked immunosorbent assay measuring human immunoglobulin light chain in mouse plasma which was normalized to control, and survival (R,T) in MM.1S or ARP-1 MM-bearing mice were calculated. The Student t test was used to compare 2 samples. Tumor burden was analyzed by one-way analysis of variance with Tukey’s post hoc test at each time point. The survival plots in panels N, P, R, and T show Kaplan-Meier estimates of survival and comparisons using the log-rank test.*P < .05; **P < .01; ***P < .001. n.s., not significant.
