Figure 2.

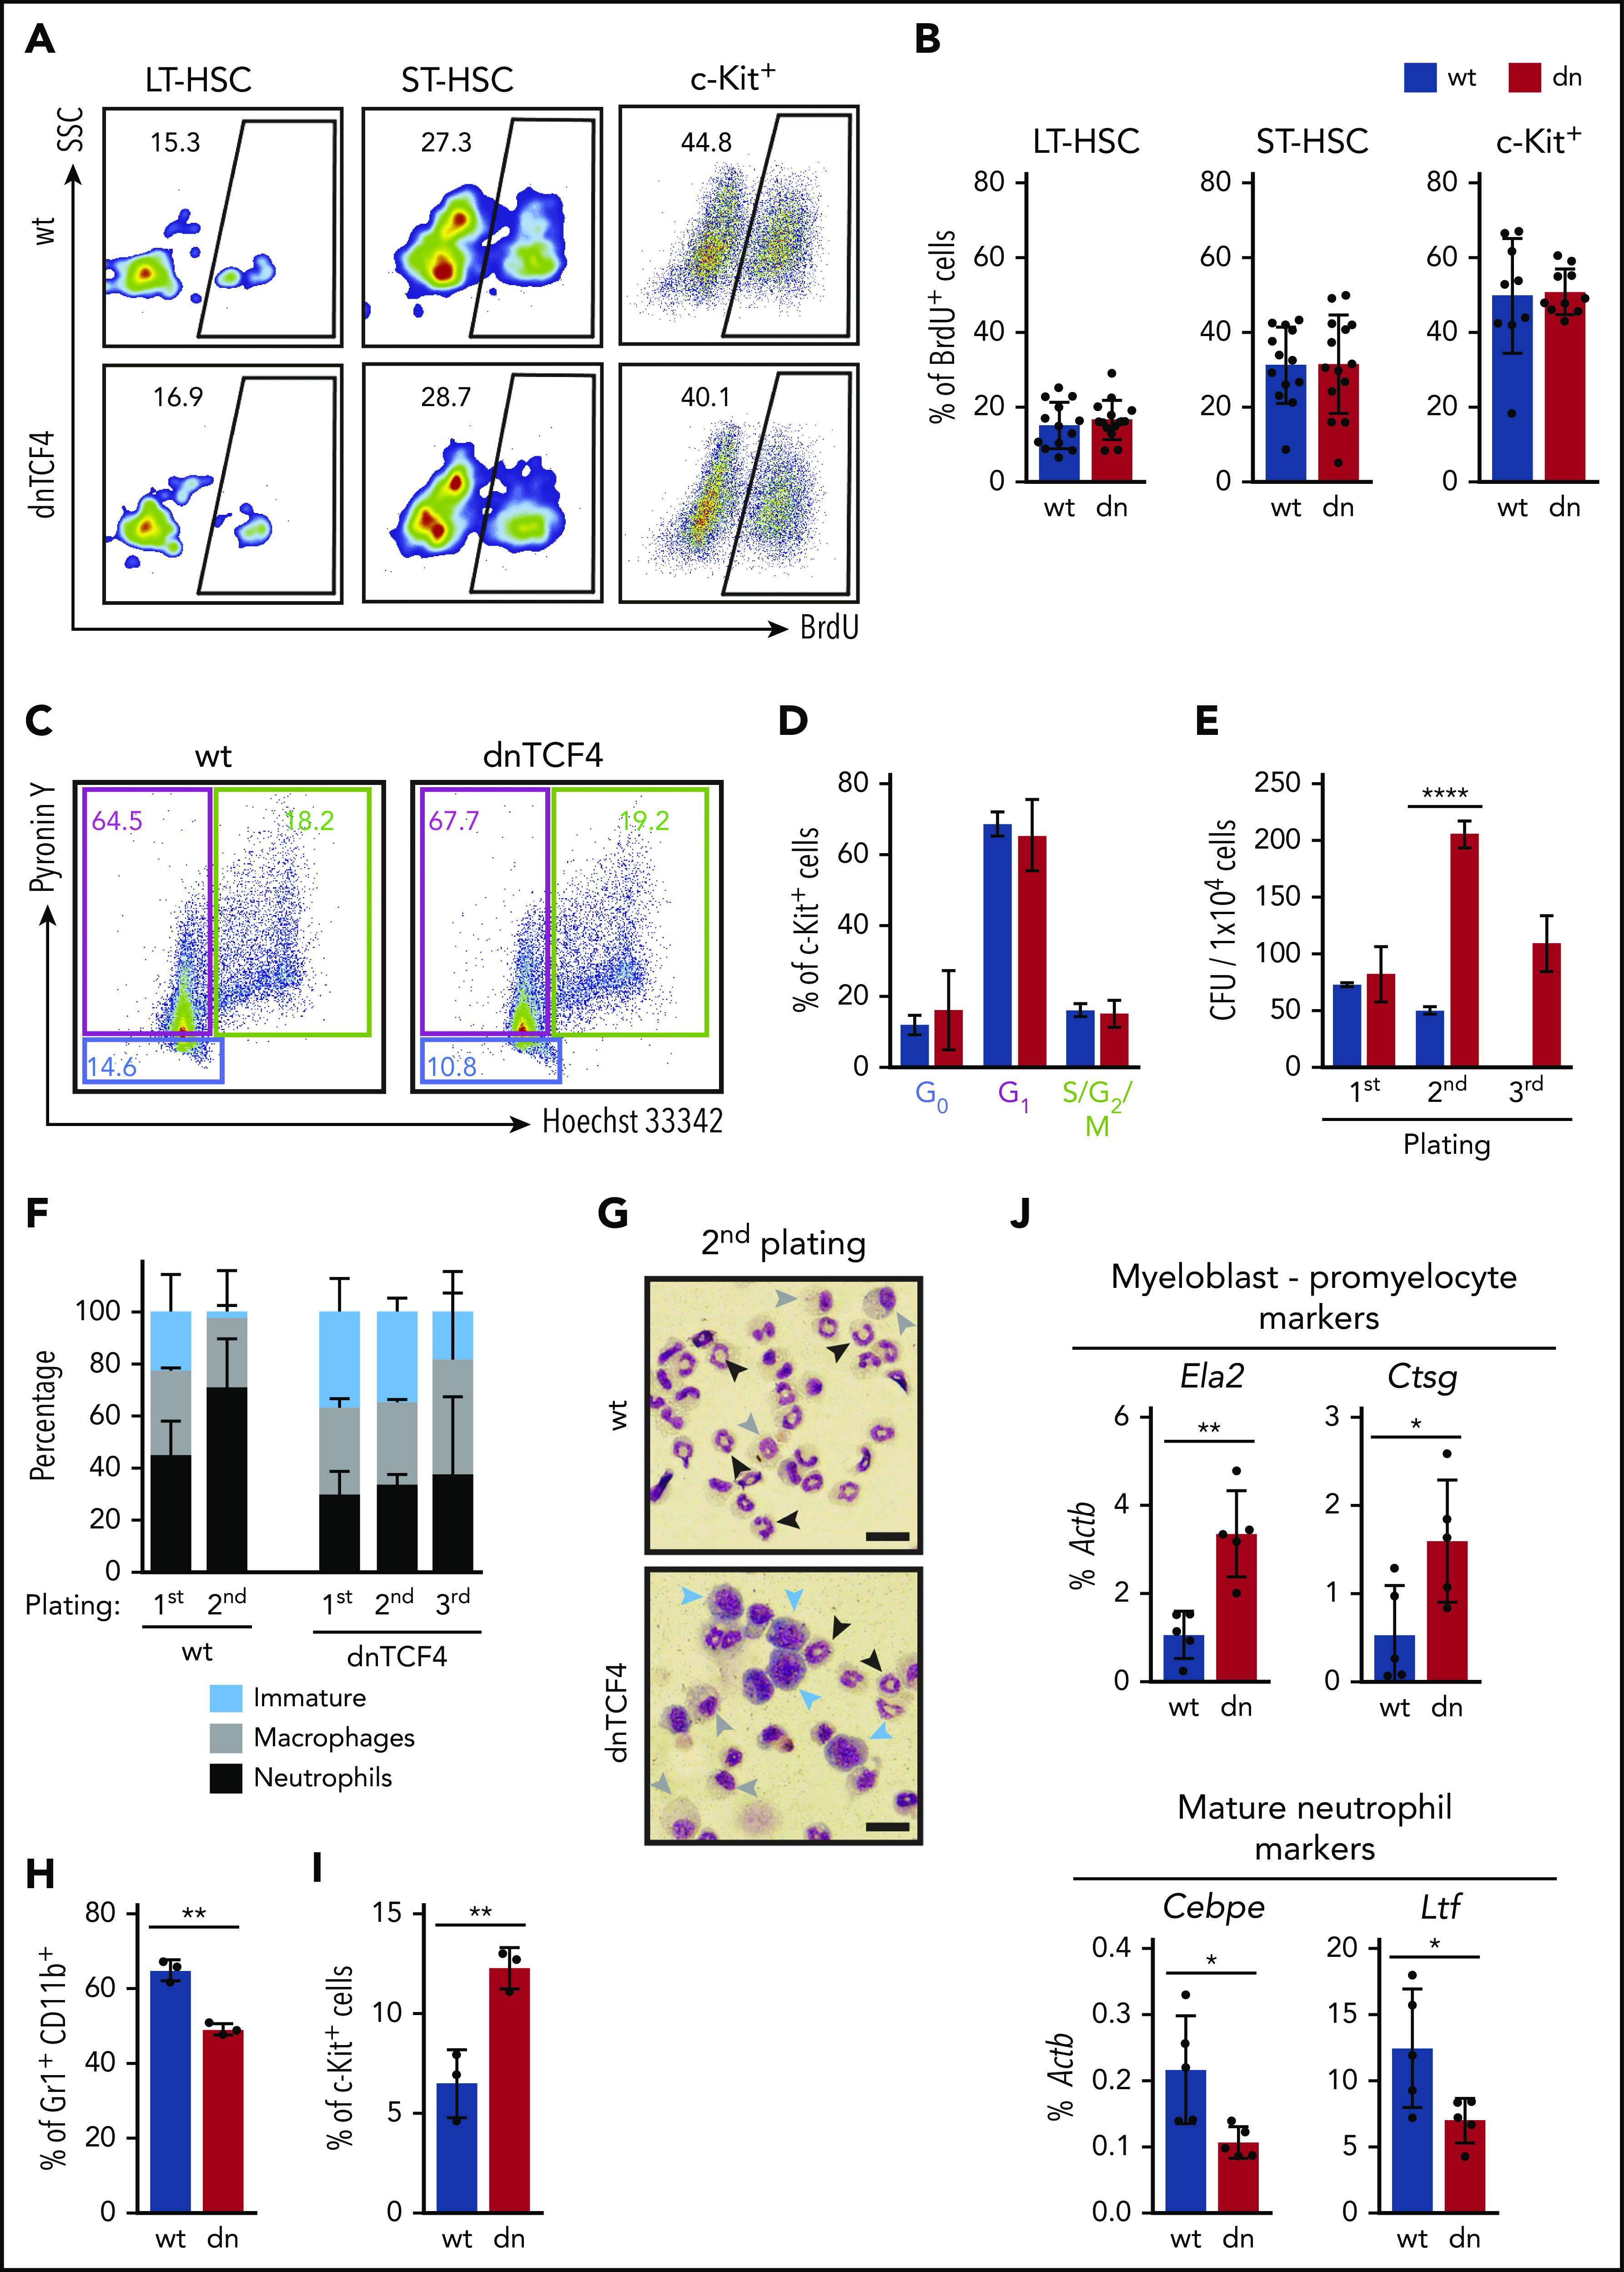
HSPCs accumulate in dnTCF4 BM because of differentiation arrest rather than to changes in proliferation. (A) Representative flow cytometry plots from 5-bromo-2′-deoxyuridine (BrdU) incorporation assay in WT and dnTCF4 mouse BM. Numbers indicate the percentage of BrdU+ cells in the indicated BM populations. (B) Quantification of panel A. At least 10 animals (12 weeks old) from 3 independent experiments were included in each group. (C) Representative flow cytometry plots of pyronin Y/Hoechst 33342 staining in WT and dnTCF4 mouse c-Kit+ BM cells. Color boxes indicate the percentage of cells in G0 (blue), in G1 (pink), and S/G2/M (green) phase. (D) Distribution of c-Kit+ cells in the indicated cell-cycle phases. Data are pooled from 2 independent experiments, n = 5. (E) Colony replating assays of WT and dnTCF4 BM cells using MethoCult GF M3434. A total of 1 × 10⁴ BM cells was plated per well (first plating) and 5 × 10³ cells were replated (second and third platings). Colonies were counted and replated on day 10. The y-axis indicates the number of colony-forming units (CFU) per 1 × 10⁴ cells. n = 3 in each group. (F) Differential counting was performed based on cell morphology. Cells in colony culture assays were cytospun and cell morphology assessed in 200 to 300 cells per cytospin. Y-axis indicates the percentage of immature cells (medium to large cells with big nucleus and scant and dark-blue cytoplasm; blue bars), macrophages (large and round cells with round nucleus and light-blue cytoplasm; gray bars), and neutrophils (smaller cells characterized by a ring shape or lobulated nucleus; black bars). Graph shows data from 2 independent cultures, n = 6. (G) Representative pictures of WT (top) and dnTCF4 (bottom) cells cytospun from semisolid cultures (second plating). Cytospins were stained with May-Grünwald Giemsa. Scale bar represents 50 μm. Blue arrows point at immature cells, gray arrows at macrophages, and black arrows at neutrophils (as defined in panel F). (H) Percentage of Gr1+ CD11b+ cells and (I) immature c-Kit+ cells in WT and dnTCF4 cells from semisolid cultures (second plating). The y-axes indicate the percentage of live cells. Graph shows data from 3 independent experiments, n = 5. (J) Quantitative RT-PCR from cells harvested from WT and dnTCF4 cultures (first plating). Expression of Ela2, Ctsg, Cebpe, and Lft is indicated. The y-axes represent relative expression compared with Actb control. Data in Figure 2 represent mean ± SD, 2-tailed Student t test was used to assess statistical significance (*P < .05, **P < .01, and ****P < .0001).
