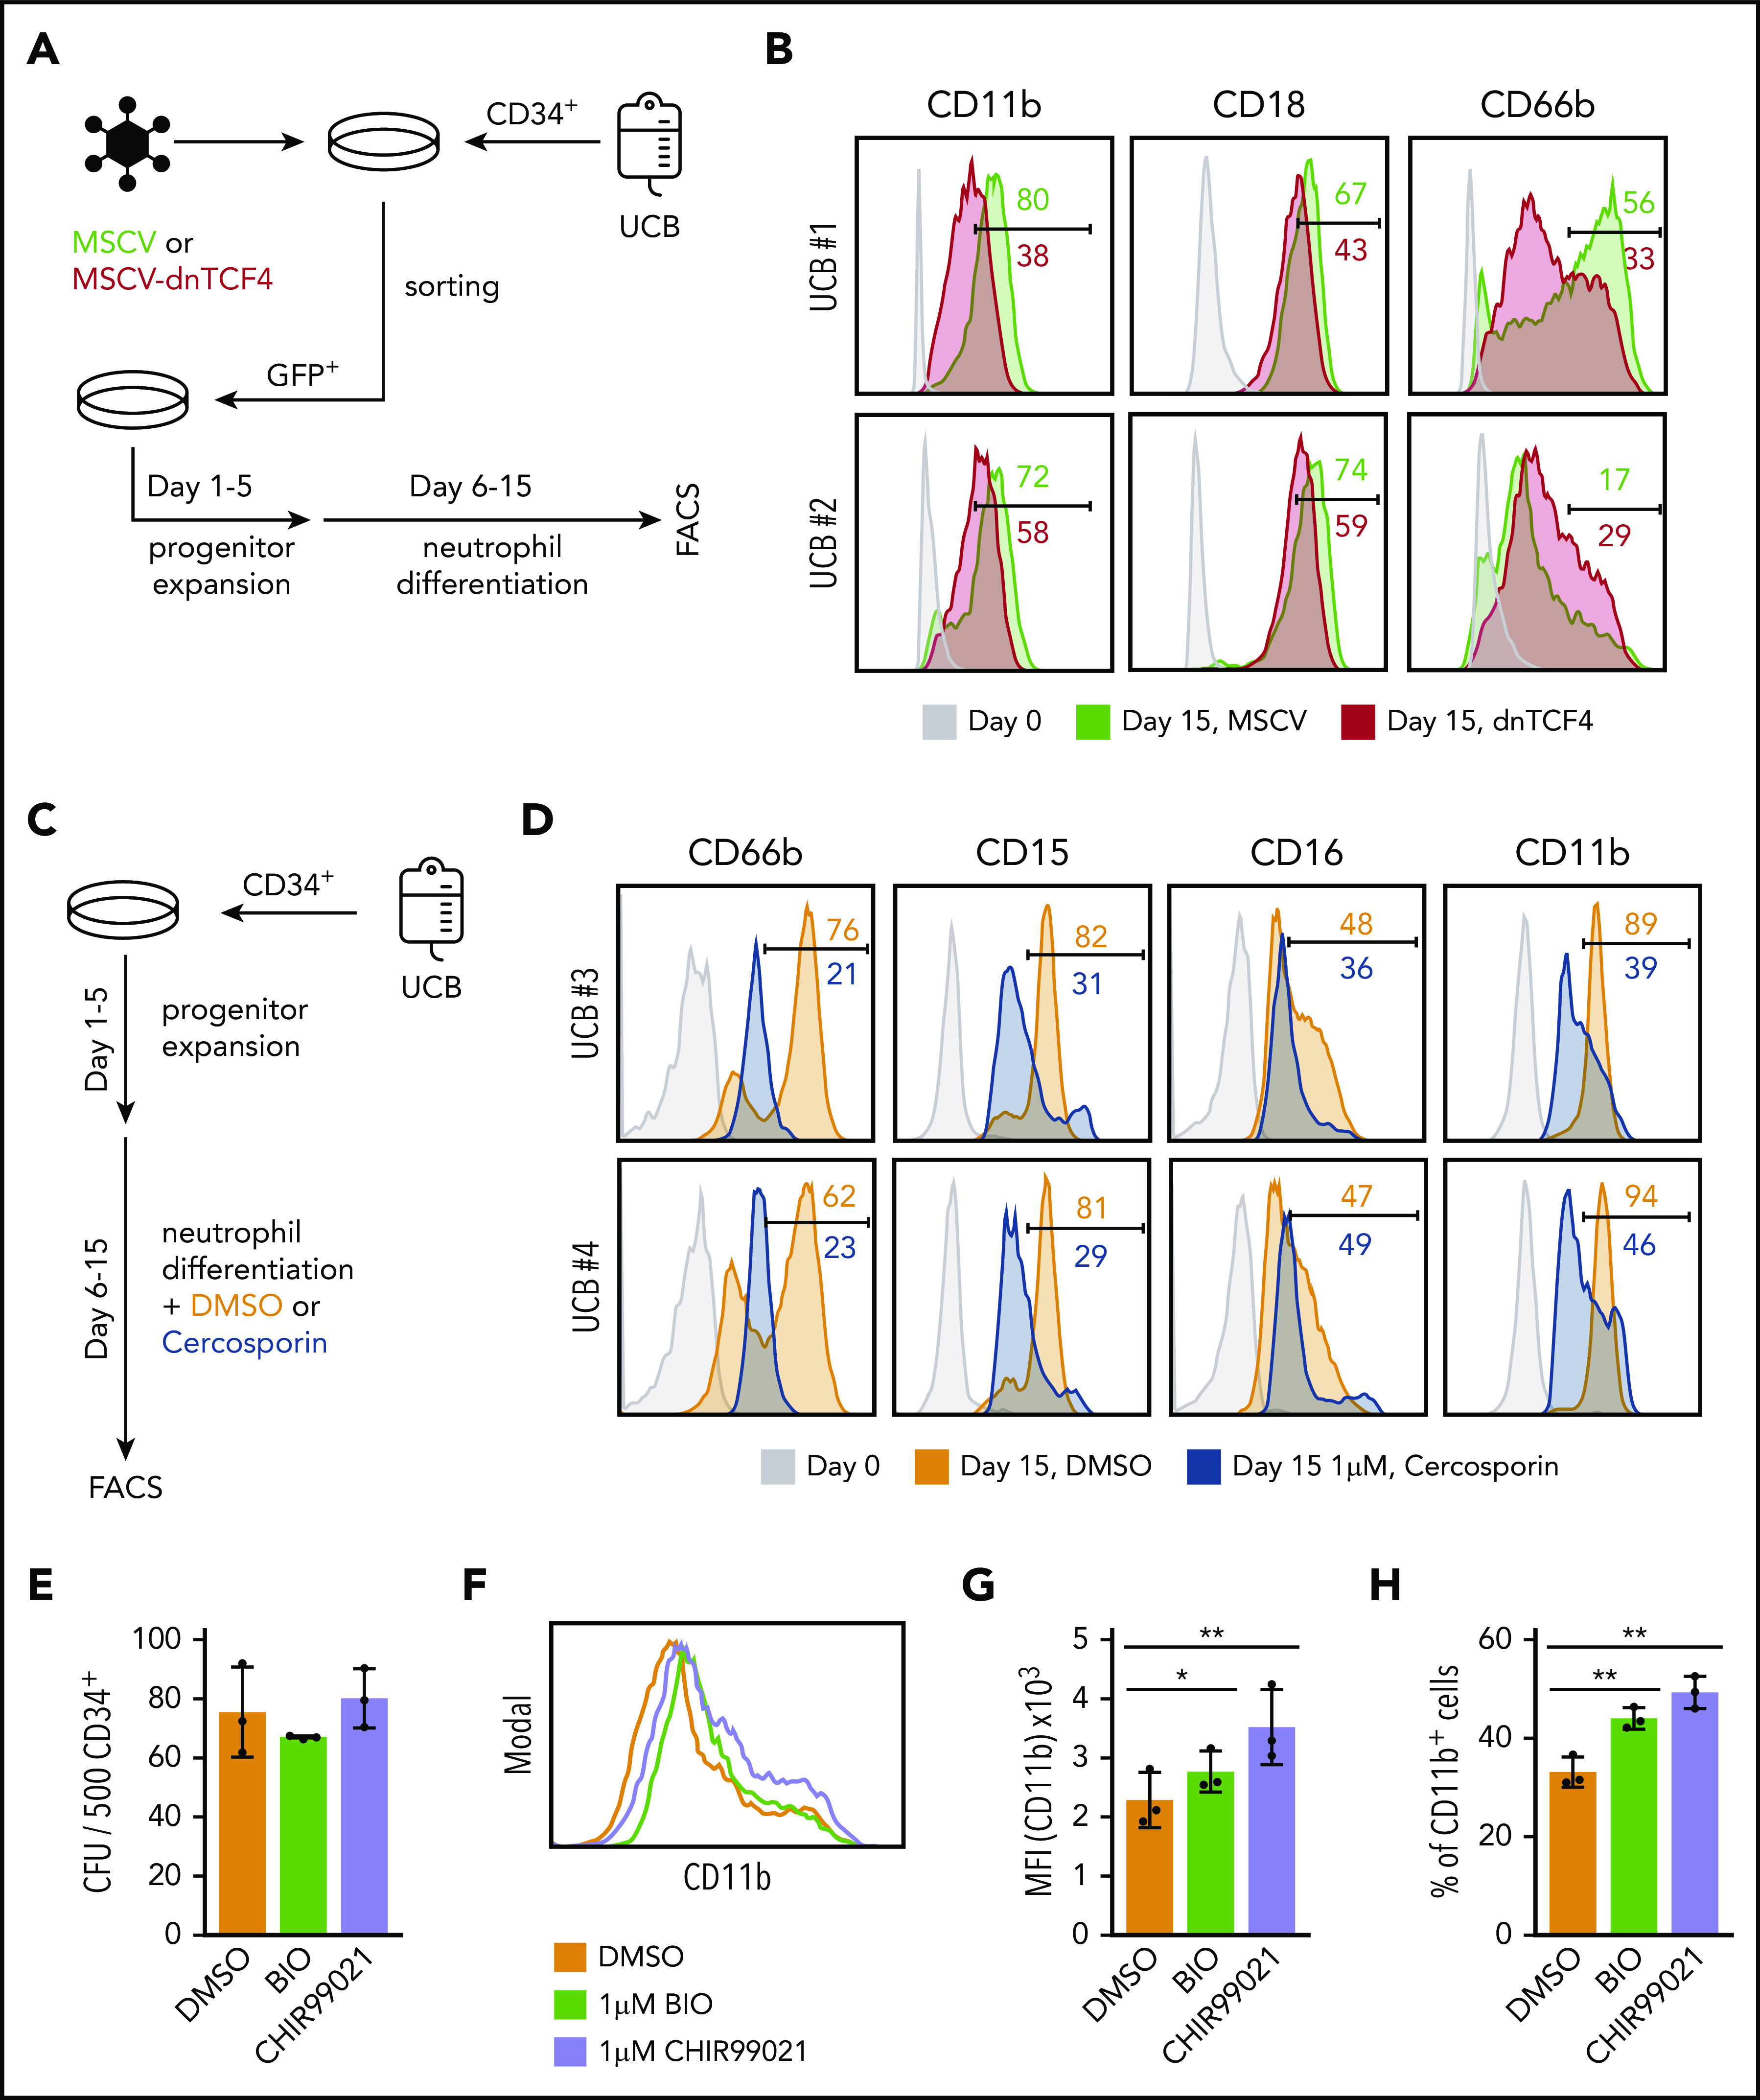
Figure 7.

The β-catenin-TCF/LEF signaling pathway regulates myeloid differentiation of human CD34+ cells. (A) Schematic representation of the experimental procedure. CD34+ cells were isolated from human umbilical cord blood (UCB) and infected with empty vector (MSCV) or dnTCF4 (MSCV-dnTCF4) expressing retroviral particles. Three days after infection, GFP+ cells were sorted, cultured in progenitor expansion medium for 5 days (days 1-5), and then cultured in neutrophil differentiation medium for 10 days (days 6-15). (B) Flow cytometry analysis of 2 human samples (UCB #1 and UCB #2). Expression of CD11b, CD18, and CD66b was determined before infection (day 0) and at the end of differentiation (day 15). MSCV histograms are shown in green and dnTCF4 are shown in red. Numbers indicate percentage of positive cells. (C) Schematic representation of the experimental procedure. CD34+ cells were isolated from human UCB. Culture conditions and days of culture are indicated. DMSO or Cercosporin (a β-catenin-TCF/LEF interaction inhibitor) were added to the neutrophil differentiation medium. (D) Flow cytometry analysis of 2 human samples (UCB #3 and UCB #4). Expression of CD66b, CD15, CD16, and CD11b was determined at day 0 (before treatment, light gray histogram) or after 10 days of culture in differentiation medium without (orange histogram) or with 1 μM Cercosporin (blue histogram). Numbers indicate percentage of positive cells. (E) Quantification of CFU in semisolid cultures (day 10). Human CD34+ cells isolated from cord blood were plated in the presence of DMSO control (0.01%) or the GSK3β inhibitors BIO (1 μM) and CHIR99021 (1 μM) (of note, GSK3β inhibitors cause β-catenin stabilization). The y-axis indicates the number of colonies per 500 input cells. (F) Representative histogram plot of cells harvested on day 10 from semisolid cultures. The x-axis indicates CD11b expression. (G) Quantification of panel F. (H) Percentage of CD11b+ cells in DMSO, BIO, and CHIR99021 containing semisolid cultures assessed by flow cytometry after 10 days of culture. Data in Figure 7E,G-H represent mean ± SD, n = 3 per group, 2-tailed Student t tests were used to assess statistical significance, *P < .05 **P < .01. Each black dot symbol represents 1 human sample.
