Figure 8.

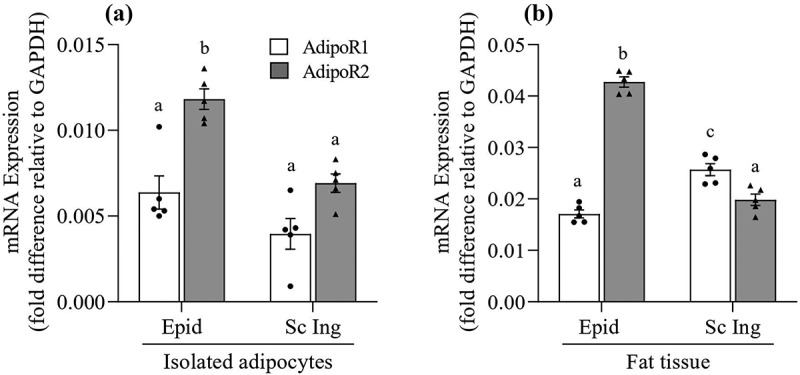
Distinct profile of AdipoR1 and AdipoR2 mRNA expression between epididymal (Epid) and subcutaneous inguinal (Sc Ing) adipocytes (a) and fat depots (b). Different letters denote statistical significance (p < 0.05). Two-way ANOVA, n = 5

Distinct profile of AdipoR1 and AdipoR2 mRNA expression between epididymal (Epid) and subcutaneous inguinal (Sc Ing) adipocytes (a) and fat depots (b). Different letters denote statistical significance (p < 0.05). Two-way ANOVA, n = 5