Abstract
Background.
Respiratory motion can deteriorate image fidelity in cardiac perfusion SPECT. We determined the extent of respiratory motion, assessed its impact on image fidelity, and investigated the existence of gender differences, thereby examining the influence of respiratory motion in a large population of patients.
Methods.
One thousand one hundred and three SPECT/CT patients underwent visual tracking of markers on their anterior surface during stress acquisition to track respiratory motion. The extent of motion was estimated by registration. Visual indicators of changes in cardiac slices with motion correction, and the correlation between the extent of motion with changes in segmental-counts were assessed.
Results.
Respiratory motion in the head-to-feet direction was the largest component of motion, varying between 1.1 and 37.4 mm, and was statistically significantly higher (p = 0.002) for males than females. In 33.0% of the patients, motion estimates were larger than 10 mm. Patients progressively show more distinct visual changes with an increase in the extent of motion. The increase in segmental-count differences in the anterior, antero-lateral, and inferior segments correlated with the extent of motion.
Conclusions.
Respiratory motion correction diminished the artefactual reduction in anterior and inferior wall counts associated with respiratory motion. The extent of improvement was strongly related to the magnitude of motion.
Keywords: Cardiac perfusion, SPECT/CT, Motion tracking, Respiratory motion estimation and correction
INTRODUCTION
The degrading effects of respiratory motion in cardiac perfusion SPECT have been demonstrated in digital simulation1–3 experimentally acquired phantoms,4–6 and patient studies.5–9 For example, in3 it was shown that the detectability of cardiac defects decreased as the magnitude of the simulated respiratory motion increased, and that the decrease occurred more rapidly for small as opposed to large defects. In the experimental studies of4 the authors noted reductions in the count density in the anterior and inferior wall compared to the lateral wall, which increased with the amplitude of respiratory motion. They also noted that the symmetry of the reductions depended on the pattern of respiratory motion, and heart angulation. The clinical studies of respiratory motion in SPECT5–9 have shown that the predicted reductions can be observed clinically along with an impact on ventricular functional parameters. Thus, at least for patients at the higher extents of respiratory motion it is clear that correction for this motion should favorably impact the clinical SPECT imaging.
With a dedicated cardiac gamma-camera system where 19 pinhole/detector pairs acquire all the projections at the same time, it has been shown possible to estimate the internal motion of the heart as the variation in the axial center-of-mass of counts without external monitoring.6 Due to count rate limitations and attenuation-related variation in counts with projection angle, the center-of-mass approach has been found difficult with conventional rotating-detector SPECT systems.10 Thus, a number of methods have been used to track respiratory motion so that binning of SPECT data as a function of respiration may be used to reduce respiratory motion artifacts for such systems. For example, stretching of an elastic strap wrapped around the abdomen,5 pressure changes in a pneumatic bellows similarly wrapped about the abdomen,11 and visual tracking of retro-reflective markers on the anterior surface of the abdomen12 have been employed. Reconstructions of the binned projection data can then be used to estimate the cardiac respiratory motion within the chest by registration of the heart in the respiratory bins to a selected reference bin, and a second pass through reconstruction used to create a combined set of slices corrected for motion.11
In this investigation, we present our methodology for overcoming the difficulties in estimating and correcting respiratory motion when imaging with conventional 2-headed SPECT systems for a population of 1103 patients, undergoing stress myocardial perfusion imaging using a dual-headed SPECT/CT system, we report our findings regarding: the frequency of respiratory motion; the impact on the distribution of counts in polar maps of respiratory motion; and the impact on the visual appearance of slices and polar maps of respiratory motion and its compensation, all as a function of motion extent. We also explore gender differences in respiratory motion in this patient population.
METHODS
Patient Acquisitions
Patients undergoing routine Tc-99m MIBI same day rest-stress or two-day stress-rest cardiac perfusion SPECT/CT tests were recruited for this institutional review board approved study. The study group consisted of 1103 patients (558 female) varying in age from 21 to 90 years (62.0 ± 11.0) with BMI’s varying from 16.8 to 66.0 kg/m2 (32.7 ± 6.8). Written consent was obtained from all patients. Stressing was via exercise in 438 of the patients and pharmacologically (Regadenoson) in 630, while 35 patients were converted from exercise to pharmacological stress. This and other clinical characteristics of the patient population are summarized in Table 1. Stress acquisitions were scheduled to commence 45 minutes after either exercise or pharmacological stress, with an actual wait time of 53 ± 23 minutes.
Table 1.
A summary of patient demographics and the most prevalent clinical reasons ordering the SPECT/CT perfusion imaging test
| Description | Male | Female | Combined |
|---|---|---|---|
| Demographics | |||
| Gender | 547 | 558 | 1103 |
| Age (years) | 61.3 ± 11.2 (21–89) | 62.6 ± 10.8 (26–90) | 62.0 ± 11.0 (21–90) |
| BMI (kg/m2) | 32.4 ± 6.1 (18.0–59.7) | 33.1 ± 7.2 (16.8–62.0) | 32.8 ± 6.7 (16.8–62.0) |
| Height (m) | 1.75 ± 0.07 (1.52–2.01) | 1.61 ± 0.07 (1.40–1.91) | 1.68 ± 0.10 (1.40–2.01) |
| Weight (kg) | 99.4 ± 20.8 (48.1–172.8) | 85.9 ± 20.1 (44.9–163.7) | 92.6 ± 21.5 (44.9–172.8) |
| Exercise (Pharmacological) | 242 (281) | 196 (349) | 438 (630) |
| Reasons for test | |||
| Chest pain (atypical) | 219 (15) | 290 (31) | 509 (56) |
| CAD | 111 | 64 | 175 |
| Shortness of breath | 54 | 62 | 116 |
| Dyspnea on exercise | 66 | 61 | 127 |
| Hypertension | 68 | 58 | 126 |
| Pre-op evaluation | 64 | 58 | 122 |
Visual tracking at 30 Hz employing 5 near infrared cameras from Vicon Motion Systems, Inc. (Lake Forest, CA) of 7 retro-reflective markers on the anterior surface of the patient12 took place during list-mode gated stress acquisition employing a BrightView SPECT/CT (Philips Healthcare, Cleveland OH) (Figure 1, step 1). Note that no motion tracking was performed during the rest acquisitions so those studies will not be discussed herein. One marker was used to track abdominal excursion, while the other six markers placed on the chest and right lower rib monitored body motion. Two of the infrared cameras were located on the wall at the patient’s foot end and primarily viewed the abdominal and right rib marker (Figure 2). The other three cameras on the wall at the patient’s head end primarily viewed the chest markers (Figure 2).
Figure 1.
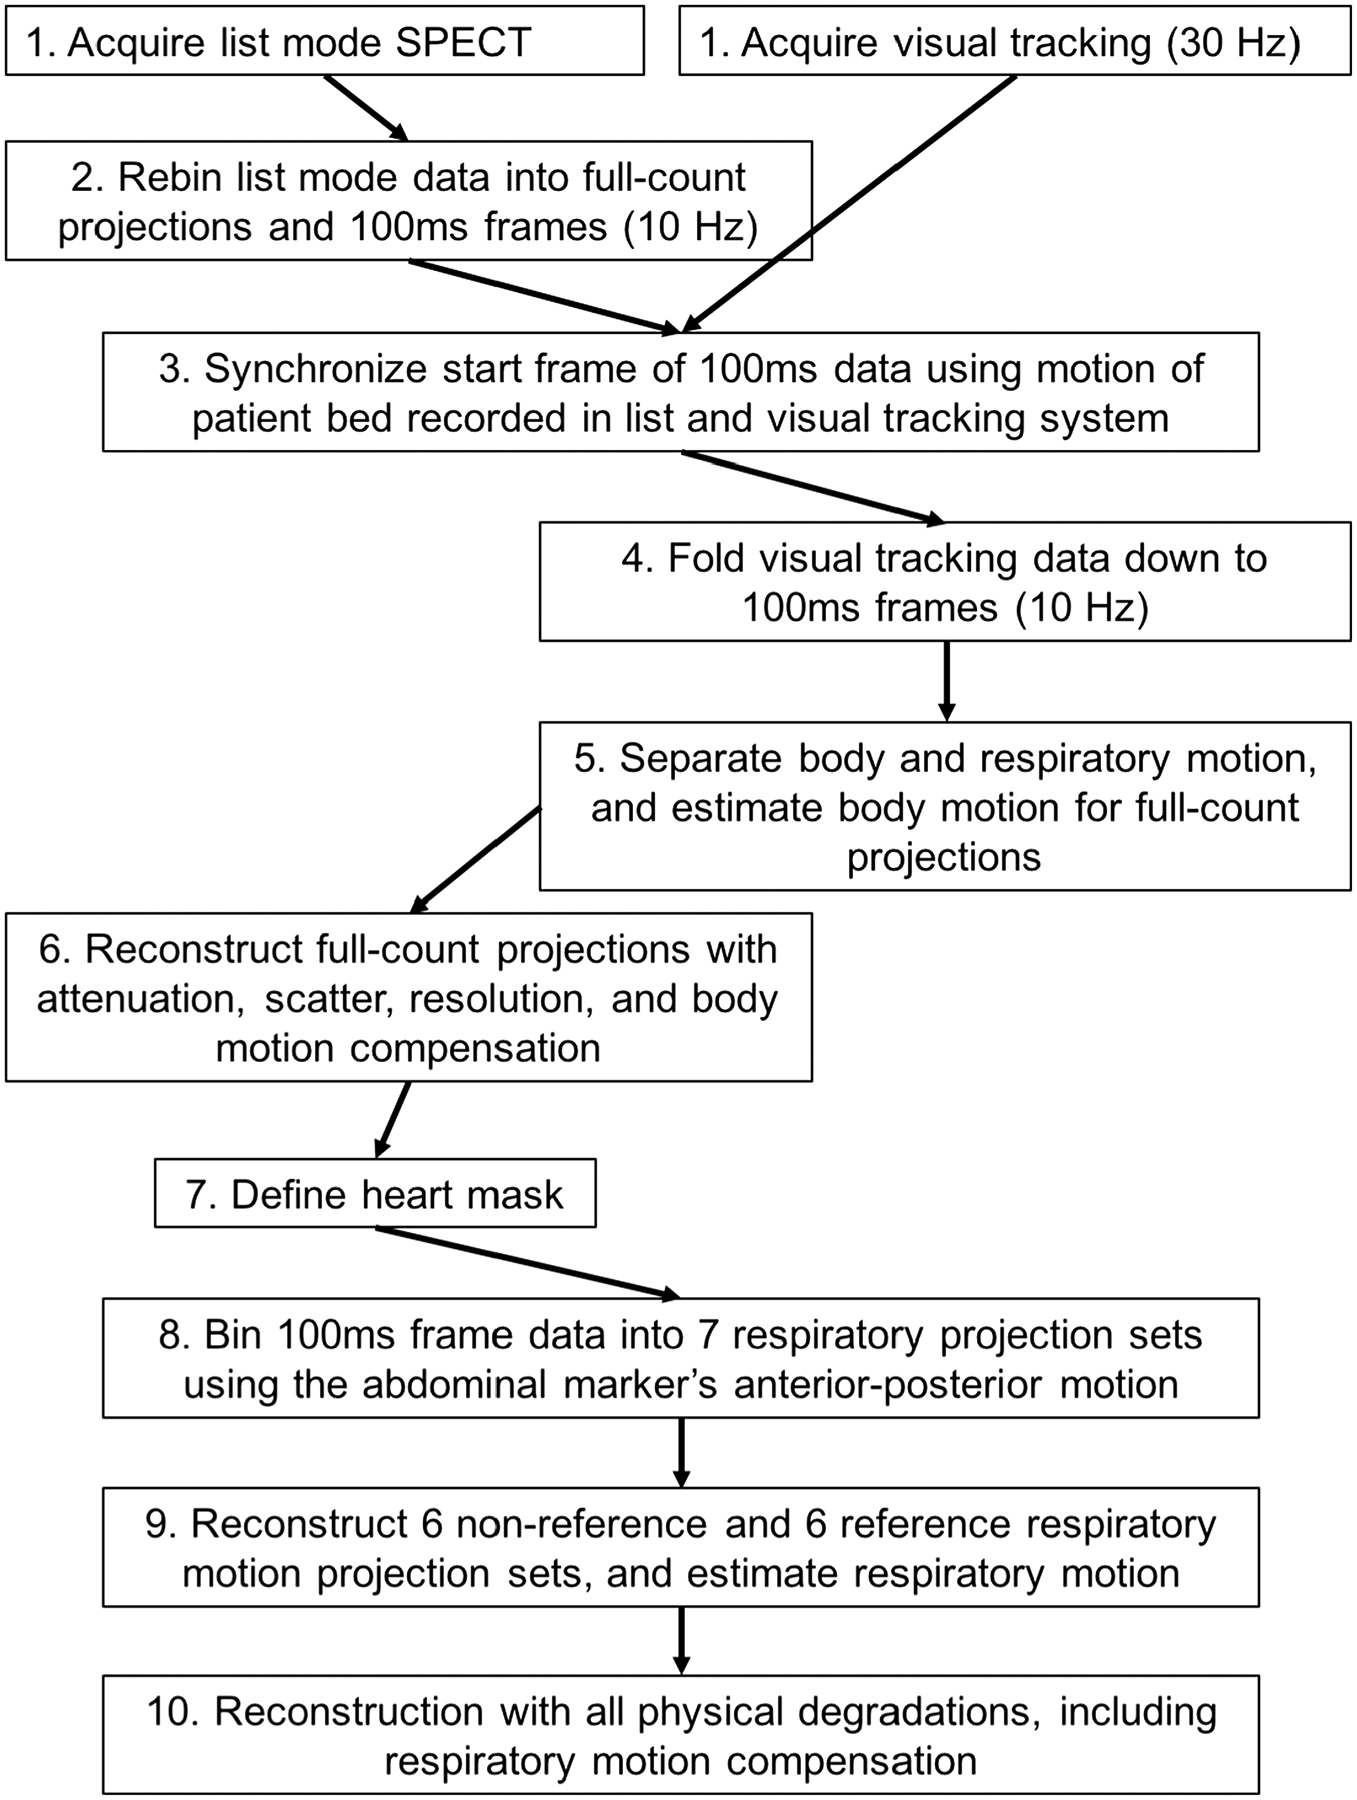
A diagram to explain the workflow. Each step1–10 is referenced in the text. Note that all steps are not treated in sequence in the text.
Figure 2.
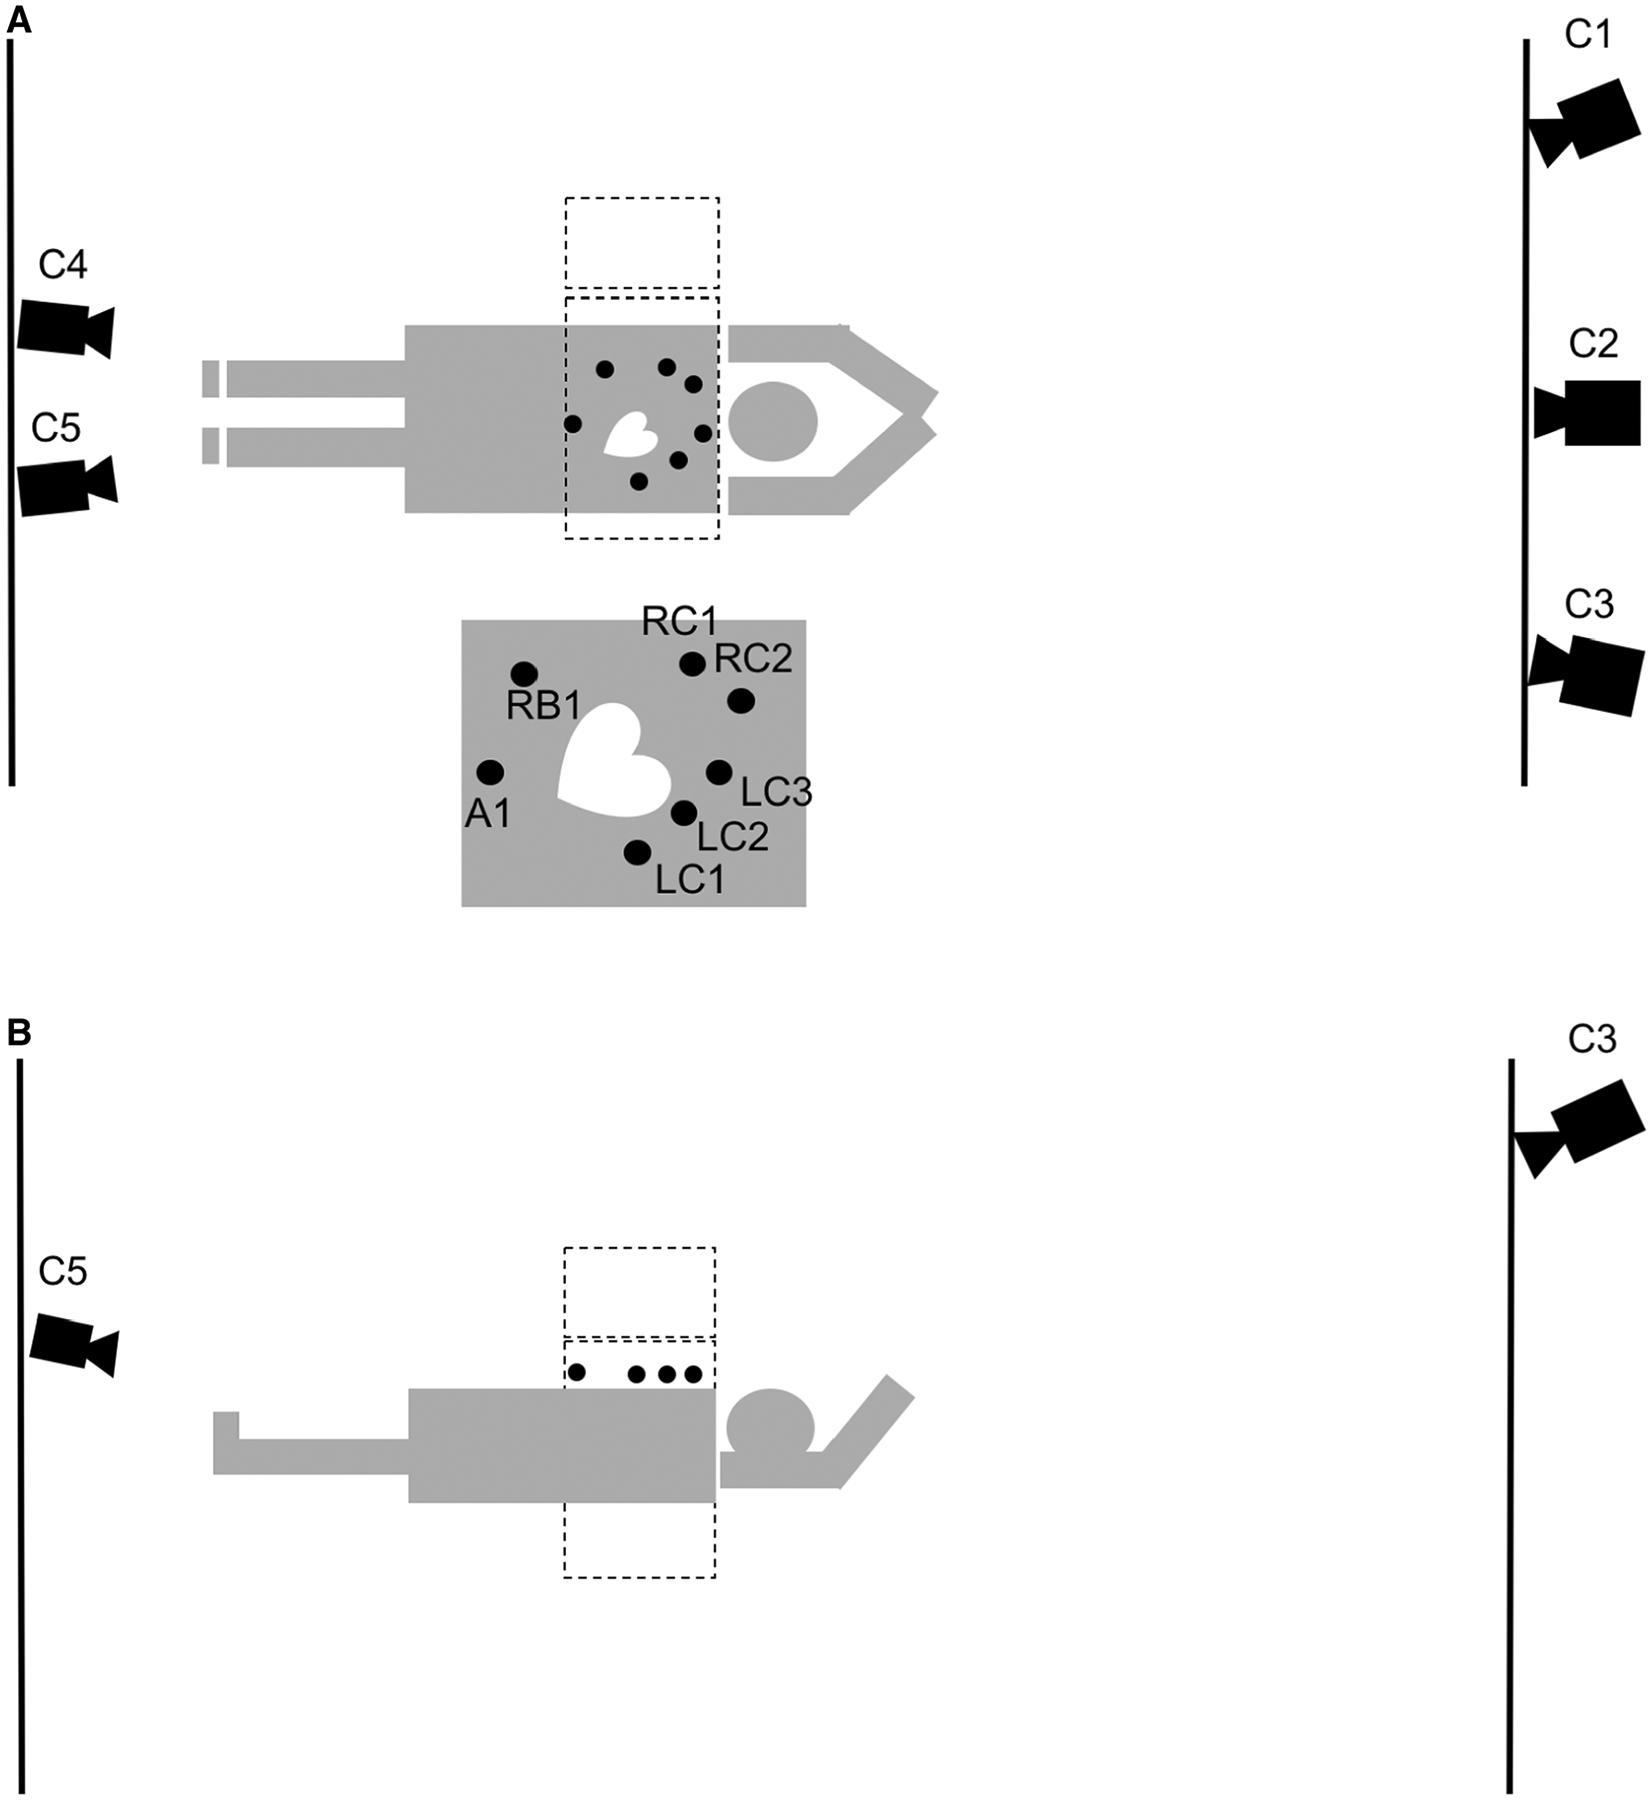
A diagram of the visual tracking setup from two different aspects, above (A), and left side (B) of the patient. Three Vicon cameras are placed at the head end of the patient behind the control room lead glass window (C1–C3), while two are placed at the foot end of the patient. (C4, C5). The two gamma camera heads (dotted lines) are at 90 and 180 degrees with the markers place on the right chest (RC1, RC2), the left chest (LC1-LC3), the right rib (RB1), and the abdomen (A1). The makers visible in (B) are LC1-LC3, and A1. The diagram is not strictly drawn according to scale.
A standard step-and-shoot clinical protocol was followed with 64 projections acquired through 180 degrees by the two-headed SPECT system in a 90-degree configuration following a body-contouring orbit. All reframing from list-mode for this study was into 12 × 128 matrices with a pixel size of 0.466 cm. A low-dose cone beam CT was acquired prior to the SPECT study for attenuation compensation (5 mAs, 120 kVp, 300 projections in 60 seconds). Patients were asked to lay still and breathe evenly during the study. After completion of the study, the acquired SPECT list-mode data were simultaneously reframed into 100 millisecond (msec) frames (10 Hz) as well as full-count projections. During reframing record was kept of the number of 100 msec frames at each projection angle, the temporal start and end of each projection, the radial distance of the head from the center-of-rotation, and the motion of the camera heads between projections (Figure 1, step 2).
Synchronization
Respiratory motion estimation and compensation critically depend on the accurate temporal synchronization of the visual tracking information with list-mode acquired SPECT data. Herein we used knowledge of the translation of the patient bed between the low-dose cone beam CT and gated-cardiac SPECT acquisition recorded in the list-mode acquisition, and marker movement in the visual tracking system data to provide the synchronization. We had previously used other methods12,13; however, tracking bed movement seamlessly integrated synchronization into the workflow without the need for additional signals being added to the list-mode acquisition. The patient bed’s translational information from the list was resampled to 30 Hz using linear interpolation after which cross-correlation was performed between these data and the translation of the patient bed as measured by the visual tracking system sampled at 30 Hz. The minimum squared error was calculated to determine the best temporal fit between the two datasets, thus providing synchronization with the first 100 ms data frame (Figure 1, step 3).
Motion Estimation and Respiratory Amplitude Binning
Estimation of the rigid body motion of the heart region of patients employed an analysis of the tracked motion of the non-abdominal markers, as previously detailed by McNamara et al.12 The visual tracking signal was downsampled to 10 Hz to match the temporal sampling of the 100 msec frames formed from the list-mode data and the respiratory motion component of all markers was separated from body motion (Figure 1, step 4, 5).11 Six-degree-of-freedom (6-DOF) rigid body motion of the body consisting of translation in the anterior-posterior, superior-inferior, and lateral directions as well as rotations about these direction was then estimated from the residual signal of the non-abdominal markers by the methods of Mukherjee et al.11 The anterior-posterior motion of the abdominal marker is considerably larger in magnitude compared to the other markers. This signal was used in amplitude binning the 100 msec frames at each projection angle into seven projection sets (Figure 1, step 8). The fourth (center) projection set was taken as the reference set as it is approximately at the mid-point of respiratory motion. A first pass through reconstruction of these sets was then employed for respiratory motion estimation as described by Dey et al8 and summarized in the following. To reduce the impact of very low count projections on the noise characteristics of reconstructed slices when respiration was irregular, projections in the 6 non-reference sets which contained less than 25% of that expected with regular respiration were set to zero (Figure 1, step 9). The remaining projections were scaled to the expected number, and reconstructed using ordered subset expectation maximization (OSEM) as detailed in the next section. A matching reference set in terms of missing angles was constructed for usage in determining 6-DOF rigid body respiratory motion between the two (Figure 1, step 9). The motion was estimated by intensity-based registration using the minimization of the sum-squared-difference (SSD) as the criterion. To isolate motion estimation to just that of the heart, only reference set voxels within a graphical user interface defined ellipsoidal volume-of-interest (VOI) about the heart were included when calculating the SSD (Figure 1, step 7). This VOI was obtained from slices reconstructed with body motion, attenuation, scatter, and distance dependent resolution correction using the full-count projections (Figure 1, step 6). For each of the 6-DOF estimates, the maximal extent of respiratory motion (the distance between the first and seventh respiratory amplitude slices when motion was linear) was recorded for each patient, and used to perform an analysis of the range and frequency of different extents of respiratory motion for the patient population.
Reconstruction
To correct motion, the estimated motion, whether just body motion or combined body plus respiratory motion, was included in both the projection and back-projection operations through usage of 3-dimensional Gaussian interpolation, which also accounted for gantry rotation.14 During OSEM reconstruction for respiratory motion estimation 16 projections per subset were employed (Figure 1, step 9); however, four projections per subset were used for the final combined motion compensation reconstructions (Figure 1, step 10). The larger number of projections per subset employed for respiratory motion estimation was to minimize reconstruction artifacts when incomplete data were present due to the 25% threshold on inclusion of projections in reconstruction, but still obtain some measure of speed increase over our initial efforts where MLEM was used.8 Similarly, to save time only three iterations of OSEM were employed (~12 MLEM equivalent iterations) in reconstruction for respiratory motion estimation (Figure 1, step 9). The final reconstruction for compensation of rigid body motion to the initial position of the patient (first projection) and respiratory motion to the reference respiratory position was implemented by including the estimated combined motion in the respiratory binned projection sets at each acquisition angle, before stepping to the next projection in the subset. Each of the respiratory projections was weighted with its fractional contribution to the full-count projection at a given angle such that the combined weighting was 1.0. Our decision to estimate and correct SPECT slices to a selected reference position locates the heart at an average position in the attenuation map, facilitating more robust attenuation correction. All reconstructions included correction for attenuation,15 distance-depended spatial-resolution,15 scatter using the triple energy window (TEW) method,16 and rigid body motion.14 Through the above process all acquired counts were included in final reconstruction which employed 5 iterations of OSEM (80 MLEM equivalent iterations). The reconstruction code was multi-threaded such that it adapted to the number of cores available to reduce reconstruction time by spreading the computational load over these cores (see Table 2 for detail). To allow assessment of the impact of respiratory motion correction a non-corrected set of slices was reconstructed from the full-count projection set similarly in all regards except for the absence of respiratory motion correction. Both the respiratory corrected and non-corrected reconstructed data-sets were filtered with a 3-dimensional Gaussian filter with a sigma of 0.466 cm.15
Table 2.
Tabulation of the processing time of the different steps in estimation and reconstruction on a linux platform with two dual core 3.0 GHz CPU’s (4 CPU’s)
| Activity | Time (minutes) |
|---|---|
| Rebin list-mode data | 1.5 |
| Synchronization | 3.5 |
| Separate body and respiratory motion | 4.5 |
| Reconstruct with only resolution compensation to check attenuation map alignment | 1.5 |
| Check attenuation map alignment | 2.0 |
| Reconstruct with attenuation, resolution, and scatter compensation for heart mask definition | 1.5 |
| Define heart mask | 1.5 |
| Reconstruct 6 reference and 6 non-reference respiratory projection sets | 8.5 |
| Estimate respiratory amplitude (6DOF) | 0.25 |
| Reconstruct simultaneously and in sequence 7 respiratory projections sets | 10.0 |
| Reorientation and generation of polar maps | 5.0 |
| Total | 38.75 |
Note that reconstructing without attenuation compensation to check the alignment of the attenuation map is not described in the text. Such QC is also done clinically
Data Analysis and Evaluation
Transaxial slices were reoriented to short-, horizontal long-, and vertical long-axis slices, after which polar maps were generated from the short-axis slices as described in Pretorius et al.17 A visual assessment was made of the impact of varying extents of respiratory motion on image quality in terms of markers of improvement such as reduced elliptical eccentricity of left-ventricular shape, reduction in count reduction of the inferior and/or anterior walls, and reduction in myocardial merging with extra-cardiac activity. We also employed the polar maps to quantitatively investigate the impact of correction of respiratory motion. The parameter employed was the percent segmental-count differences (%Diff) between maps from corrected and non-corrected slices for each of 17 polar-map segments18 calculated as:
To investigate the effect of the magnitude of respiratory motion on the alteration of counts in the segments, we plotted the %Diff versus the extent of motion in the dominant respiratory motion direction (head-to-feet) for each segment. An analysis of the correlation between these was performed by doing a linear fit of the %Diff as a function of the magnitude of the motion using Excel and comparing the intercept, slope, Pearson’s correlation coefficient R, and standard error of the estimate (SEE) between the segments.
Statistical Analysis of Gender Differences
Unpaired two tailed t-tests with different variances were used to determine if there was a difference in extent of respiratory motion along each of the three axes and in % Differences between genders for each of the 17 segments. A p value less than 0.05 was deemed significantly different.
RESULTS AND DISCUSSION
Respiratory Motion Demographics
The average, standard deviation, and range of the respiratory motion estimates are given in Table 3 for our population of 1103 patients in the three principal directions (x: left-to-right, 2.1 ± 1.2 mm, y: anterior-posterior, 2.5 ± 1.4 mm, z: head-to-feet, 9.0 ± 3.7 mm). The average motion estimates compared well with published values as estimated using MRI19 and CT,20 with the head-to-feet direction being dominate in each case. As seen in Table 3, the extents of motion for males are consistently larger than that of females, with statistically significant differences in the left-to-right (p = 0.008) and head-to-feet (p = 0.002) directions. A detailed breakdown of the % occurrence of respiratory estimates of the dominant head-to-feet component of the respiratory motion within selected ranges of motion is given in Table 4 for all patients, as well as males and females separately. Note that in all instances, the metrics for males exceeds those of females, with a combined average of 33% of the patients with respiratory estimates in the head-to-feet direction larger than 10 mm (37.6% of males, 28.5% of females). There was no statistical significant difference in respiratory motion estimates between pharmacological and exercise stress; however, the average estimated head-to-feet amplitudes for pharmacological patients were smaller (8.8 ± 3.6 vs. 9.2 ± 3.9 mm, p = 0.08) and approached significance. The probable reason is that there were 68 more female patients than male patients in the pharmacological stress group, and these two groups were statistically significantly different. As observed by others19,20 the extent of rotation about the 3 axes was small. Thus, the rotation in these DOFs are not reported or discussed further herein.
Table 3.
Average, standard deviation and range of respiratory motion estimated in three directions for the combined patient population, solely males, and solely females
| Gender | Left-to-right (X) |
Anterior-posterior (Y) |
Head-to-feet (Z) |
|---|---|---|---|
| Combined (mm) (Range) | 2.1 ± 1.2 (0.2–9.2) | 2.5 ± 1.4 (0.3–12.9) | 9.0 ± 3.7 (1.1–37.4) |
| Male (mm) (Range) | 2.2 ± 1.3 (0.2–9.2) | 2.6 ± 1.5 (0.3–12.9) | 9.3 ± 4.1 (1.1–37.4) |
| Female (mm) (Range) | 2.0 ± 1.1 (0.3–6.4) | 2.4 ± 1.2 (0.5–7.3) | 8.6 ± 3.3 (1.3–21.4) |
| p values (male vs. female) | 0.008 | 0.754 | 0.002 |
Table 4.
Percent (number) of patients with the dominant head-to-feet component of the estimated respiratory motion lying within selected ranges of motion for all patients, male patients, and female patients
| Respiratory estimate range | Combined | Male | Female |
|---|---|---|---|
| ≤6 mm | 20.3% (224) | 20.3% (111) | 20.3% (113) |
| >6 mm, <10 mm | 46.7% (515) | 42.2% (230) | 51.2% (285) |
| ≥10 mm, <14 mm | 23.5% (260) | 25.4% (139) | 21.8% (121) |
| ≥14 mm, <18 mm | 7.1% (78) | 9.3% (51) | 4.9% (27) |
| ≥18 mm | 2.4% (26) | 2.9% (16) | 1.8% (10) |
Percent Segmental-Count Difference (%Diff) and Regression Analysis
Table 5 presents the average percent segmental-count differences (%Diff) and the range in the values for the combined gender population of patients, and the genders individually. In accordance with the larger average extents of respiratory motion in males, the males have statistically larger %Diff than the females in all but the anterior septal mid-ventricle (p = 0.06) and anterior septal base (p = 0.11) segments. Note that in each “ring” of polar map segments the largest changes in %Diff occur in the anterior and inferior segments as one would expect from past simulation,1,2,21 phantom,4–6 and patient studies.5–8 Also notice that none of the average vales of the %Diff are large enough to change an abnormal to normal clinical interpretation, or vice versa, for any of the segments; however, at either end of the range in values the %Diff are large enough to cause such changes. In Table 5, the positive extents of the range of values are always larger numerically than the negatives (many times they are considerably so), thus one would expect that respiratory motion correction diminishes the artefactual reductions in wall counts caused by respiratory motion, as illustrated in the following example patient studies.
Table 5.
Average (range) percent segmental-count differences (% Diff) in the 17 polar map segments for the gender-combined population, 448 male patients, and 454 female patients
| Polar map segment | Combined %Diff | Male %Diff | Female %Diff |
|---|---|---|---|
| Apex | 0.7 (−8.7 to 21.5) | 1.3 (−8.0 to 21.5) | 0.1 (−8.7 to 16.7) |
| Anterior apical | 2.9 (−10.6 to 27.3) | 3.4 (−10.6 to 27.3) | 2.4 (−5.8 to 22.0) |
| Septal apical | 0.9 (−9.4 to 29.0) | 1.2 (−7.2 to 17.4) | 0.5 (−9.4 to 29.0) |
| Inferior apical | 3.7 (−10.5 to 28.9) | 4.4 (−10.2 to 28.9) | 3.1 (−10.5 to 28.2) |
| Lateral apical | 2.6 (−14.4 to 27.0) | 3.1 (−14.4 to 27.0) | 2.1 (−7.8 to 17.3) |
| Anterior mid-ventricle | 5.1 (−9.0 to 33.6) | 5.5 (−6.9 to 33.6) | 4.6 (−9.0 to 28.5) |
| Ant sep mid-ventricle | 1.2 (−8.1 to 22.8) | 1.3 (−7.5 to 17.7)* | 1.0 (−8.2 to 22.8)* |
| Inf sep mid-ventricle | 2.0 (−9.0 to 19.0) | 2.3 (−9.0 to 19.0) | 1.7 (−8.4 to 17.2) |
| Inferior mid-ventricle | 5.9 (−8.9 to 41.9) | 6.3 (−8.9 to 37.3) | 5.6 (−7.0 to 41.9) |
| Inf lat mid-ventricle | 2.1 (−15.0 to 20.2) | 2.5 (−15.0 to 20.2) | 1.8 (−8.9 to 13.9) |
| Ant lat mid-ventricle | 3.6 (−12.0 to 30.3) | 4.0 (−11.6 to 30.3) | 3.3 (−12.0 to 21.8) |
| Anterior base | 4.8 (−8.6 to 28.3) | 5.3 (−8.6 to 27.6) | 4.4 (−8.4 to 28.3) |
| Anterior septal base | 1.4 (−22.7 to 32.5) | 1.6 (−20.7 to 32.5) | 1.1 (−22.7 to 29.3)* |
| Inferior septal base | 2.9 (−16.8 to 40.2) | 3.4 (−15.4 to 40.2) | 2.4 (−16.8 to 33.9) |
| Inferior base | 5.7 (−5.9 to 40.1) | 6.4 (−5.3 to 37.8) | 5.0 (−5.9 to 40.1) |
| Inferior lateral base | 2.2 (−8.9 to 27.5) | 2.6 (−8.9 to 27.5) | 1.8 (−8.4 to 18.1) |
| Anterior lateral base | 4.1 (8.9 to 32.4) | 4.7 (−8.8 to 32.4) | 3.5 (−8.9 to 27.6) |
Indicates no significant difference between males and females by t test, p = 0.11, for the Anterior Septal Mid-Ventricle segment, and p = 0.06 for the Anterior Septal Base segment. All other segments are statistically significantly different between males and females
Table 6 shows that all anterior, anterior lateral, and inferior segments also show a similar trend for an increase in %Diff with an increase the head-to-feet respiratory motion estimate, to varying extents; however, no or only a slight indication of an increase in %Diff with increasing respiratory motion is seen in the other polar map segments. Figure 3 shows plots of %Diff versus the magnitude of the estimated motion in the head-to-feet direction for the anterior mid-ventricle and apical segments, which are the two extremes in slope of the regression line in Table 6. This figure thus illustrates the observed trend for an increase in the %Diff as the magnitude of respiratory motion in the head-to-feet direction increases in the anterior mid-ventricle segment (top plot of Figure 3, r = 0.720). In contrast, no such trend is noted in the apical segment (bottom plot of Figure 3, r = 0.044).
Table 6.
Parameters for linear fit of head-to-feet respiratory motion estimates to percent segmental-count differences (%Diff) for the 17 polar map segments for gender-combined population
| Polar map segment | Slope | Intercept | R | SEE |
|---|---|---|---|---|
| Apex | 0.05 | 0.26 | 0.044 | 4.06 |
| Anterior apical | 0.55 | −2.05 | 0.478 | 3.87 |
| Septal apical | 0.18 | −0.77 | 0.193 | 3.52 |
| Inferior apical | 0.62 | −1.77 | 0.491 | 4.11 |
| Lateral apical | 0.32 | −0.25 | 0.227 | 4.26 |
| Anterior mid-ventricle | 1.08 | −4.64 | 0.720 | 3.89 |
| Ant sep mid-ventricle | 0.32 | −1.75 | 0.359 | 3.15 |
| Inf sep mid-ventricle | 0.38 | −1.39 | 0.367 | 3.57 |
| Inferior mid-ventricle | 1.07 | −3.61 | 0.701 | 4.04 |
| Inf lat mid-ventricle | 0.26 | −0.17 | 0.262 | 3.55 |
| Ant lat mid-ventricle | 0.70 | −2.65 | 0.539 | 4.07 |
| Anterior base | 0.92 | −3.40 | 0.607 | 4.51 |
| Anterior septal base | 0.07 | 0.74 | 0.045 | 5.59 |
| Inferior septal base | 0.39 | −0.56 | 0.059 | 5.85 |
| Inferior base | 0.93 | −2.61 | 0.600 | 4.65 |
| Inferior lateral base | 0.29 | −0.04 | 0.257 | 4.23 |
| Anterior lateral base | 0.77 | −2.80 | 0.547 | 5.06 |
Figure 3.
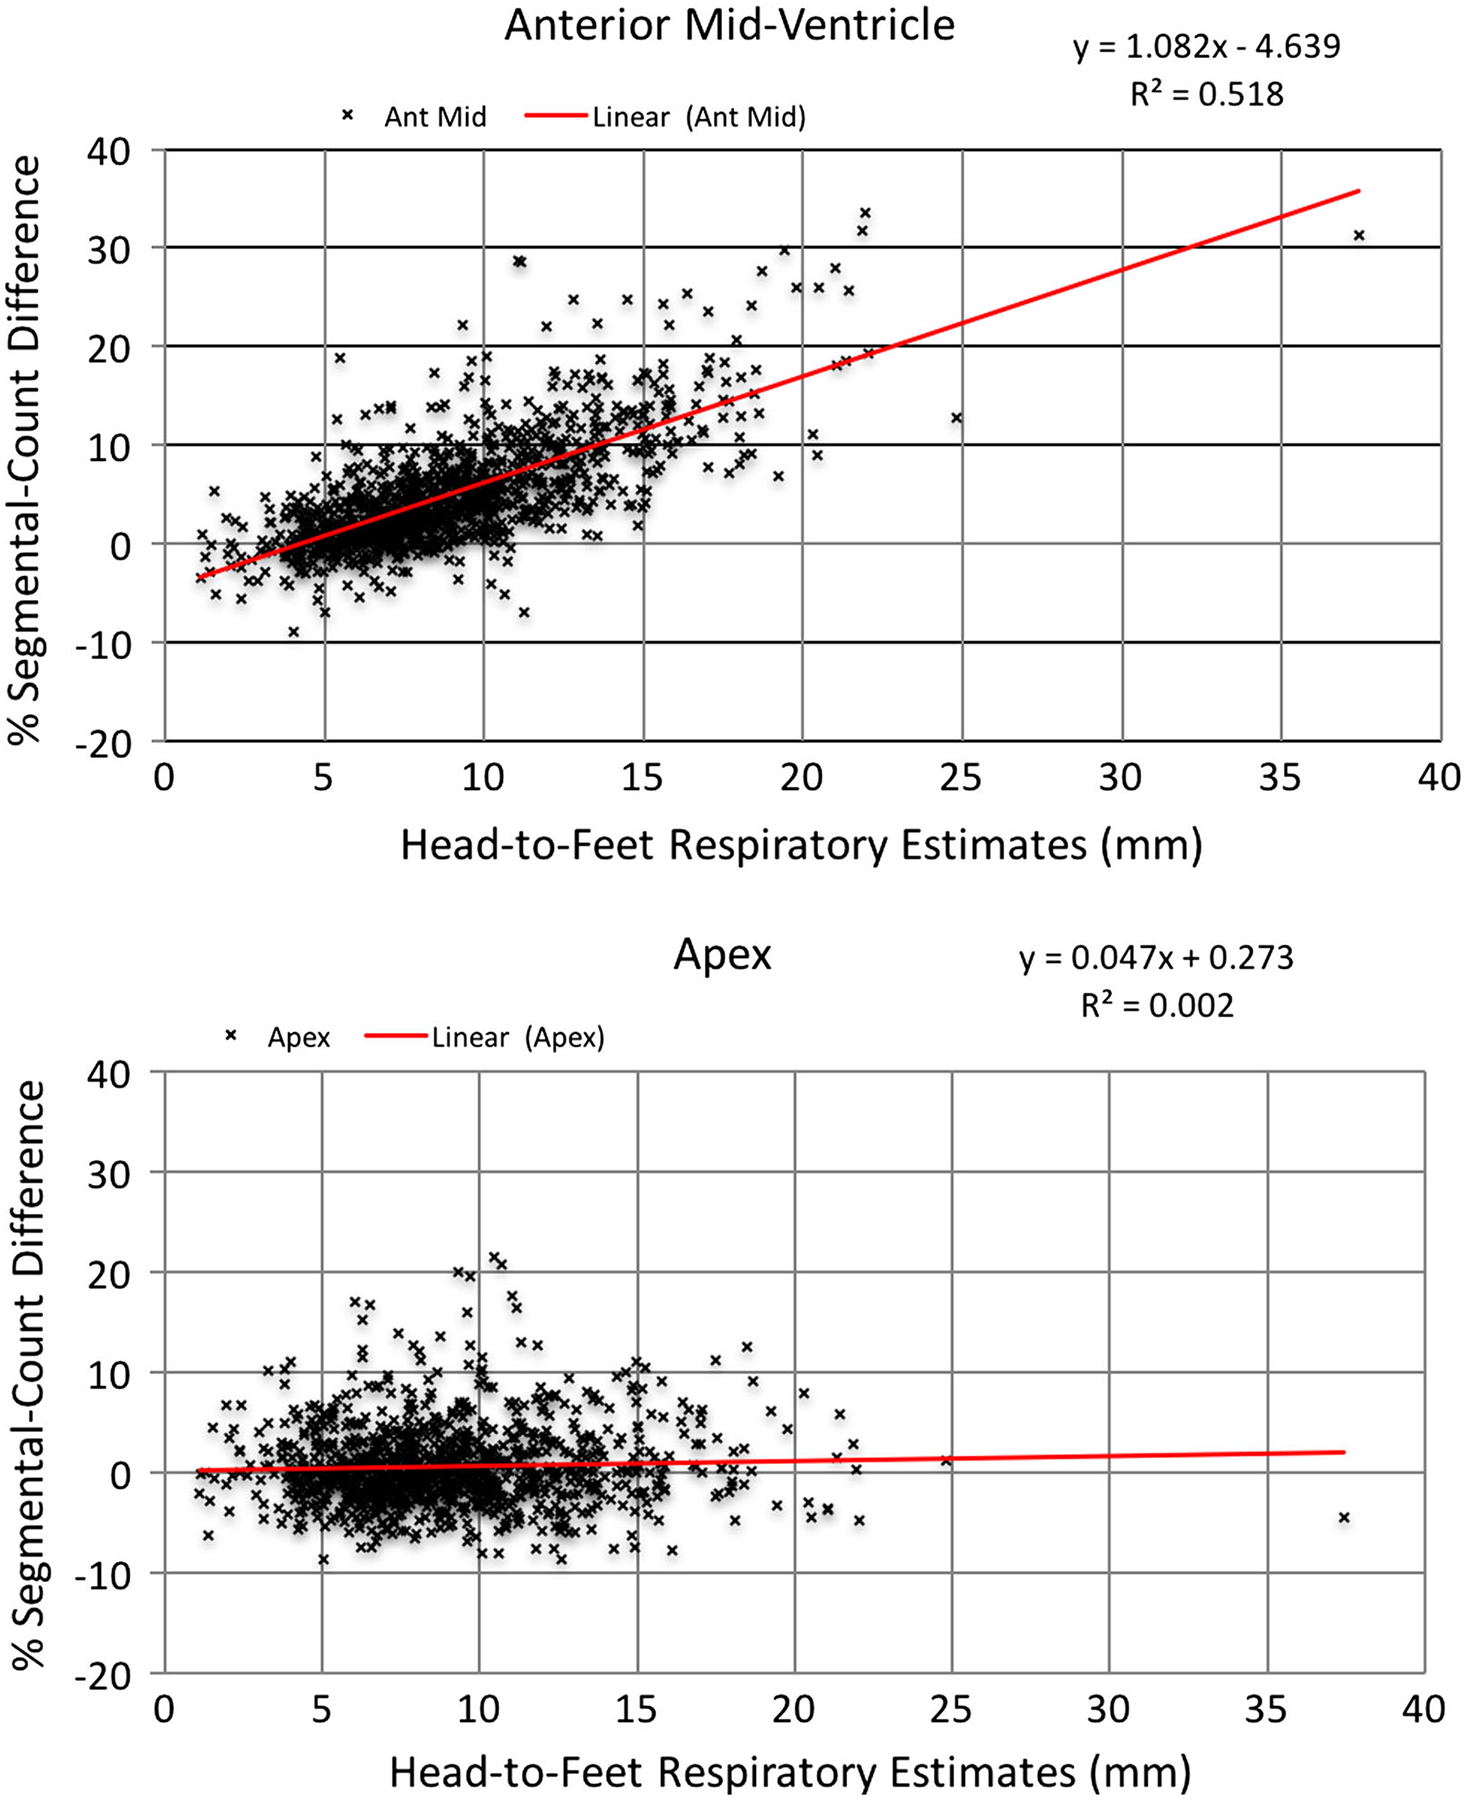
Graphs showing two extremes in slope from Table 4 as examples of the relationship between head-to-feet respiratory motion estimates and percent segmental-count differences (% Diff) with the anterior mid-ventricle segment at the top, and the apex segment of the patient polar maps at the bottom.
Patient Examples
Figures 4, 5, 6, 7, and 8 show slices, polar maps, and %Diff for five example patient studies illustrating the differences seen with respiratory motion correction in four patients read as having normal myocardial perfusion and one with a reported cardiac perfusion defect. Figure 4 shows a study of a female with BMI of 22.5 presenting with dizziness, palpitations, scapular pain, and increased GE reflux disease. Respiratory motion estimates were 1.0, 1.8, and 13 mm in the x (left-to-right), y (anterior-inferior), and z (head-to-foot) directions, respectively. The head-to-feet motion which is representative of our third range of motion estimates in Table 4 which included 23.5% of our population. Note the correction of slight count decrease in the anterior and inferior walls (%Diff: 3.9%−10.7%), rounder blood-pool cavity, and clearer visibility of apical thinning1 with correction. Figures 5 and 6 show patient studies for the fourth range of respiratory motion listed in Table 4 which included 7.1% of our population. In Figure 5, notice the clearly improved uniformity of the inferior (%Diff: 5.1%−27.1%) and to a lesser extent anterior wall (%Diff: −1.2%−10.3%), and larger blood-pool cavity. In Figure 6, notice the removal of the apparent moderate inferior and anterior count reduction (%Diff: 10.3%−18.7%), larger blood-pool cavity size, and better separation of the ventricular wall from the sub-diaphragmatic activity with respiratory motion correction. Figure 7, which represents the 2.4% of our population with greater than 18 mm extent of respiratory motion, shows the correction of obvious inferior and anterior pseudo-ischemic decreases (%Diff: 8.5%−32.3%), and dramatic improvement in blood-pool cavity size and decrease in motion thickening of ventricular walls. The changes in the anterior and inferior wall are large enough that they would definitely remove any concern regarding abnormality. Finally, in Figure 8 a patient with prior percutaneous cardiac intervention (PCI) and known arteriosclerosis of the coronary arteries presenting with chest pain and excessive respiratory motion estimated at 37.4 mm. This patient example clearly shows a change in the shape of the left ventricle and also the severity of the disease in the inferior wall after respiratory motion correction.
Figure 4.
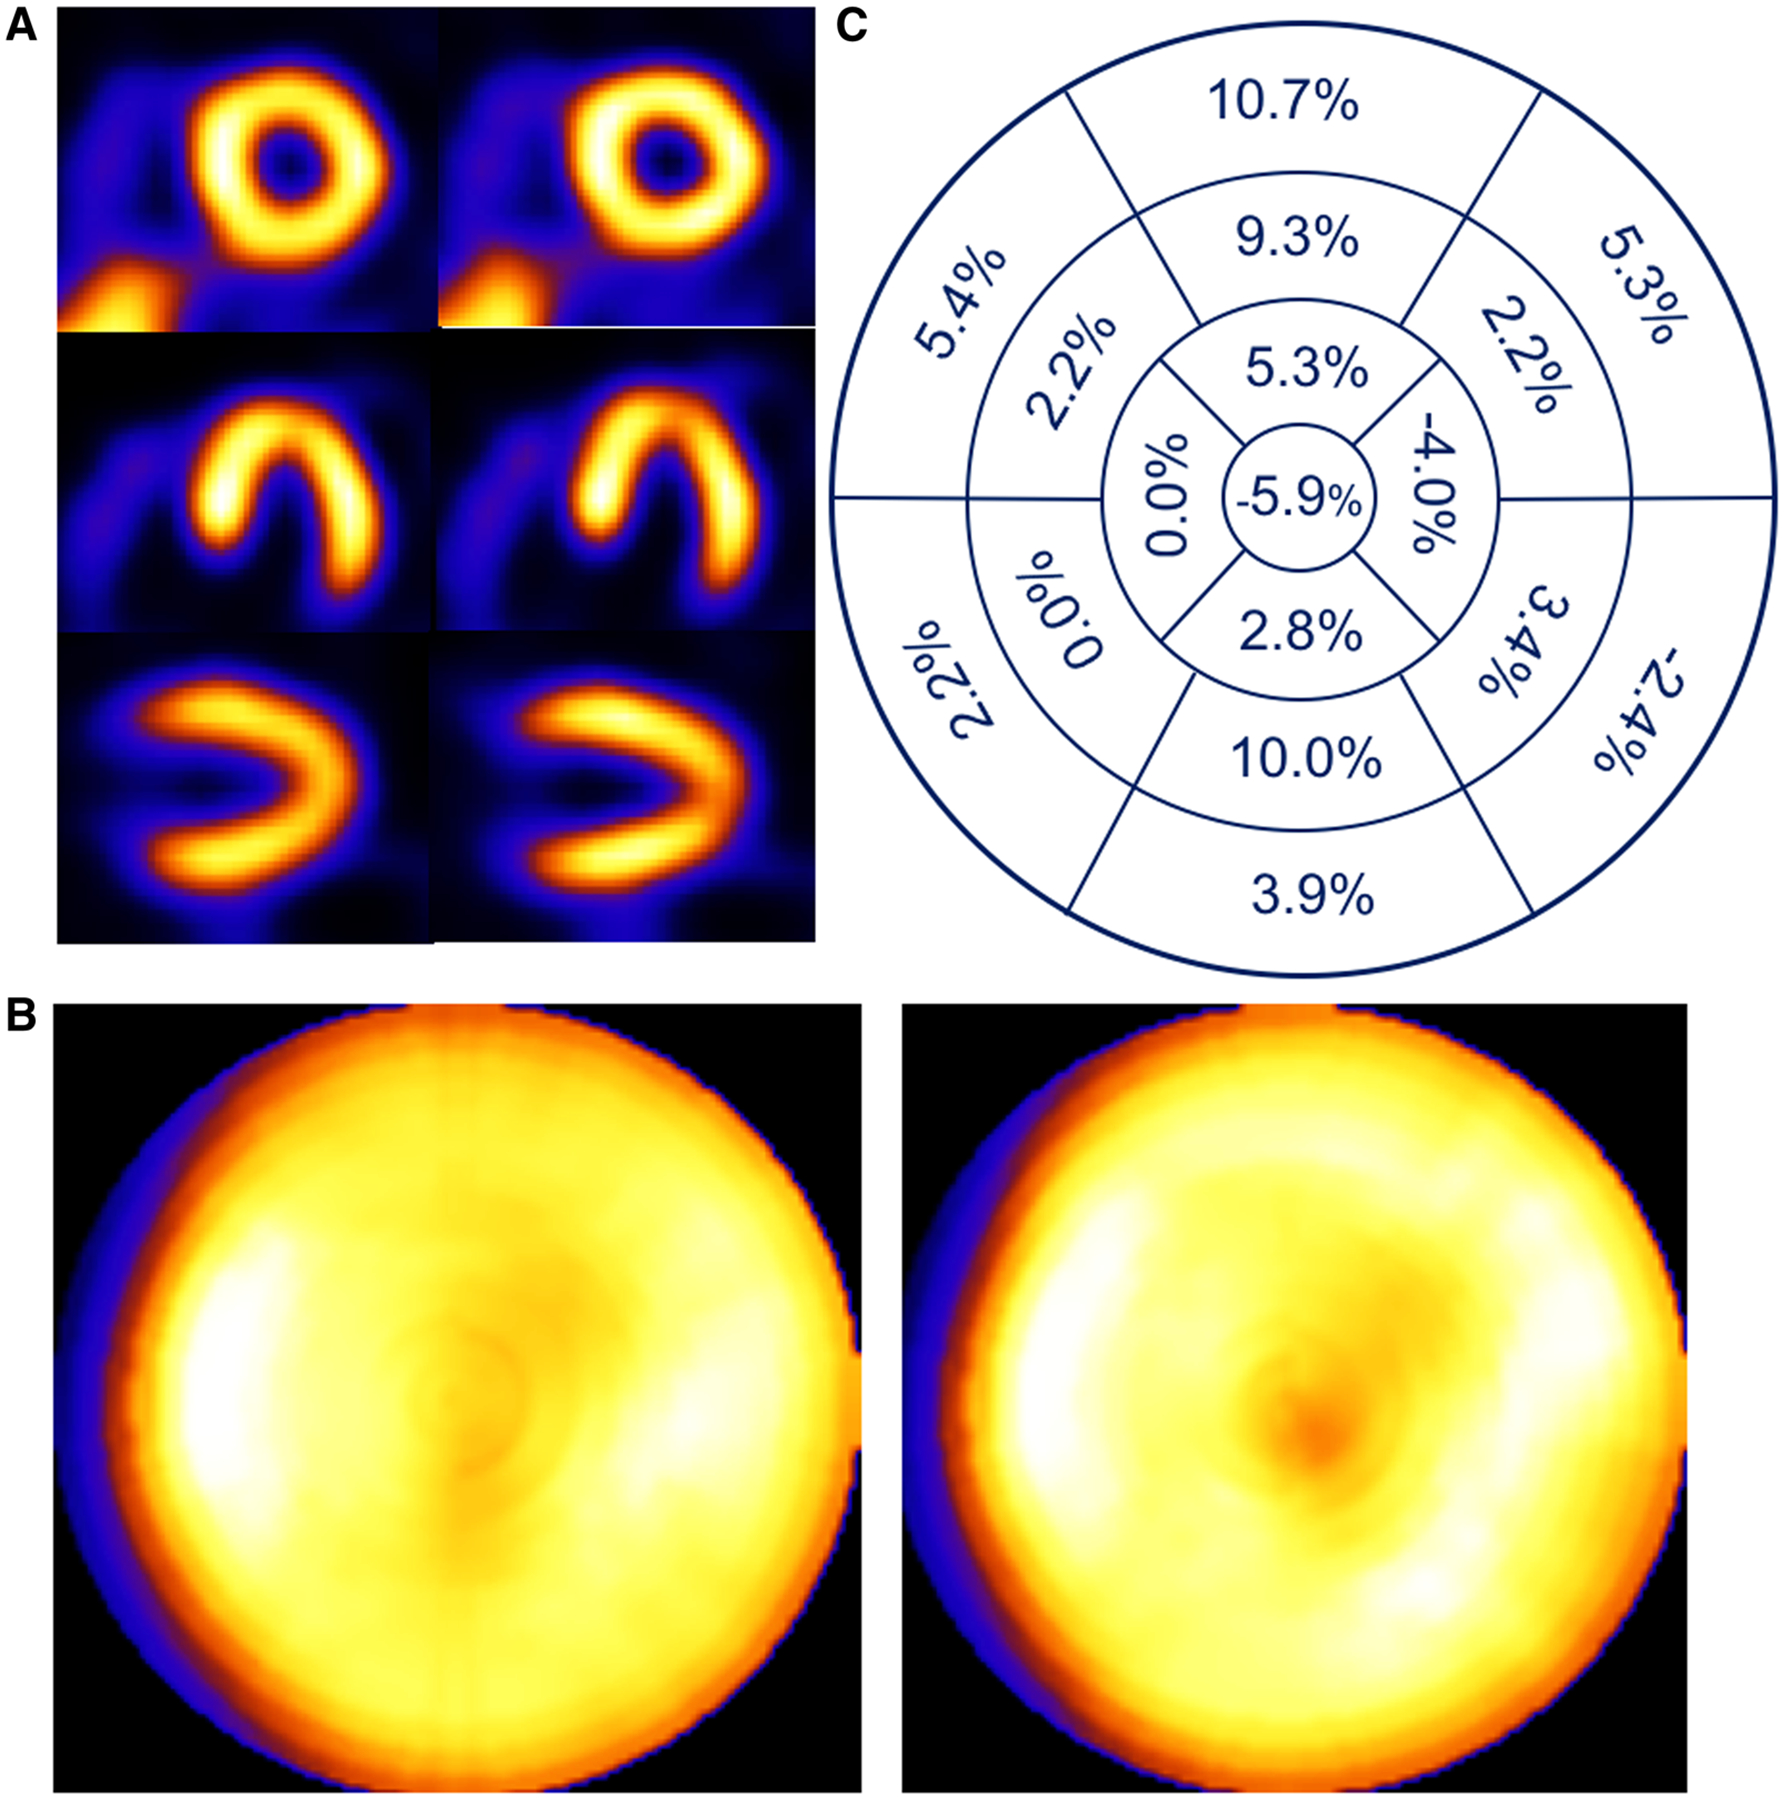
Patient example of a 74-year-old female with a 13 mm head-to-feet respiratory motion estimate. Shown (A) are short-, horizontal long-, and vertical long-axis slices without (left) and with (right) respiratory compensation. Note improved visualization of apical thinning as an increased apical photopenic area with respiratory motion correction. (B) Comparison of polar maps generated from short-axis slices without (left) and with (right) respiratory motion compensation, each displayed to its own maximum, which shows a reduction in the variation between anterior and inferior versus lateral and septal walls with correction. (C) Presentation of the average % segmental-count differences between without and with respiratory motion compensation for the 17 polar map segments, which numerically confirms the greater increase in anterior and inferior versus lateral and septal walls with correction visualized in the polar map.
Figure 5.
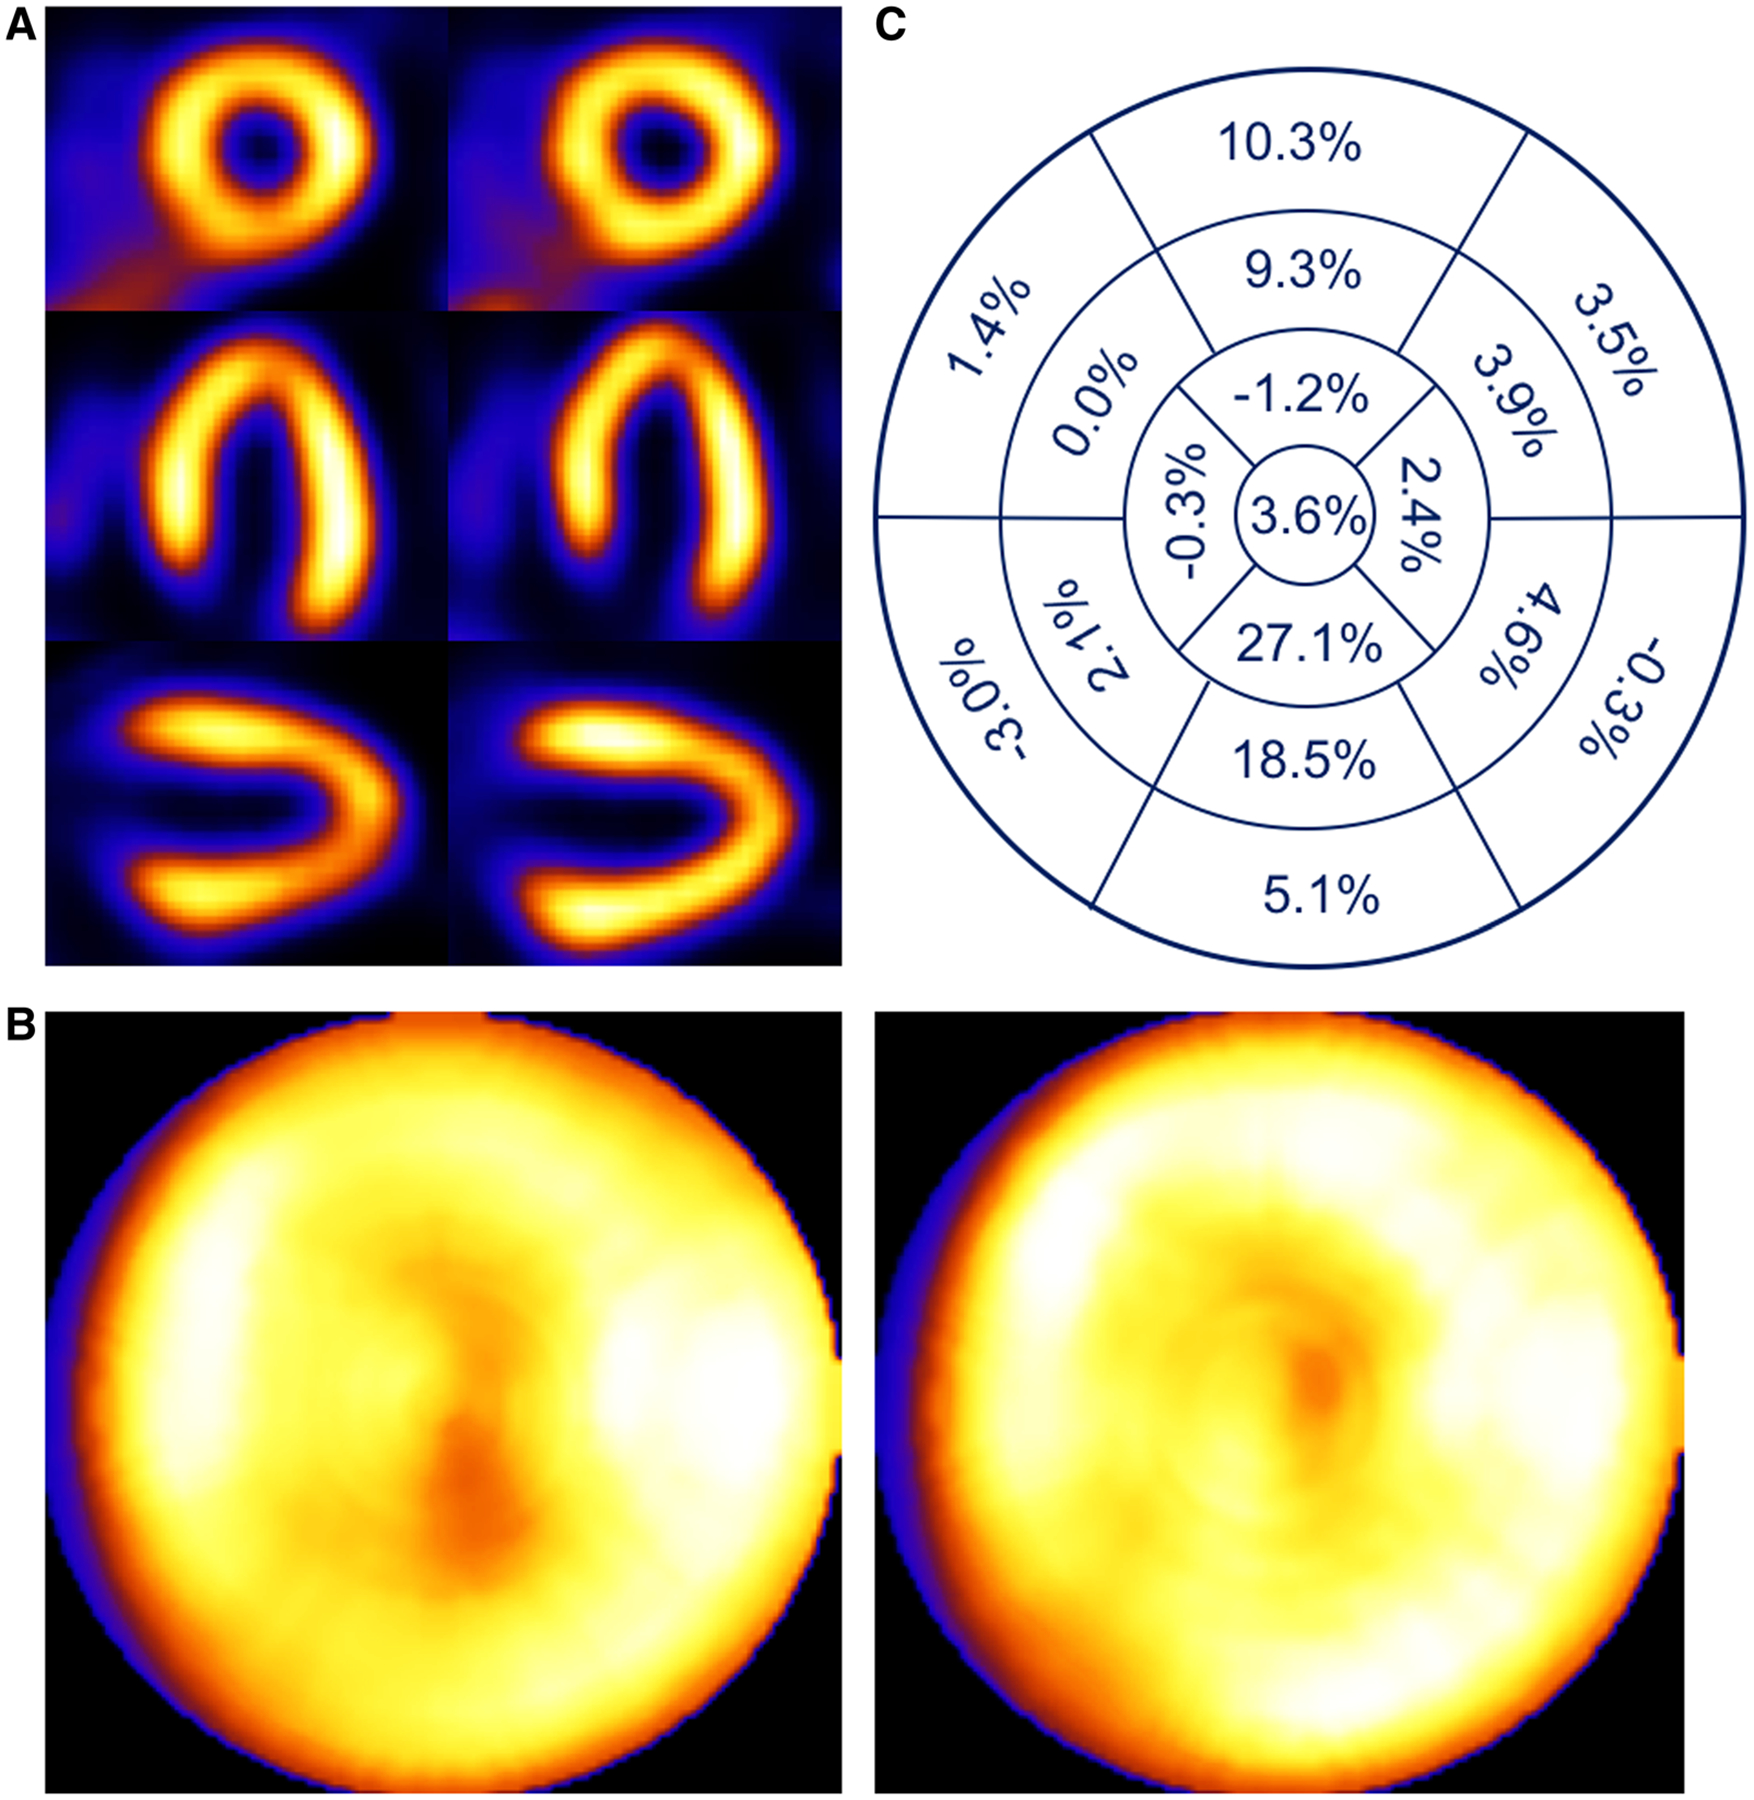
Patient example of a 64-year-old female with BMI of 33.7 presenting with syncope. Respiratory motion estimates were 1.4, 2.9, and 16.5 mm in the x (left-to-right), y (anterior-inferior), and z (head-to-foot) directions, respectively. (A) Shown are short-, horizontal long-, and vertical long-axis slices without (left) and with (right) respiratory compensation. (B) Comparison of polar maps generated from short-axis slices without (left) and with (right) respiratory motion compensation. (C) Presentation of the average % segmental-count differences between without and with respiratory motion compensation for the 17 polar map segments.
Figure 6.
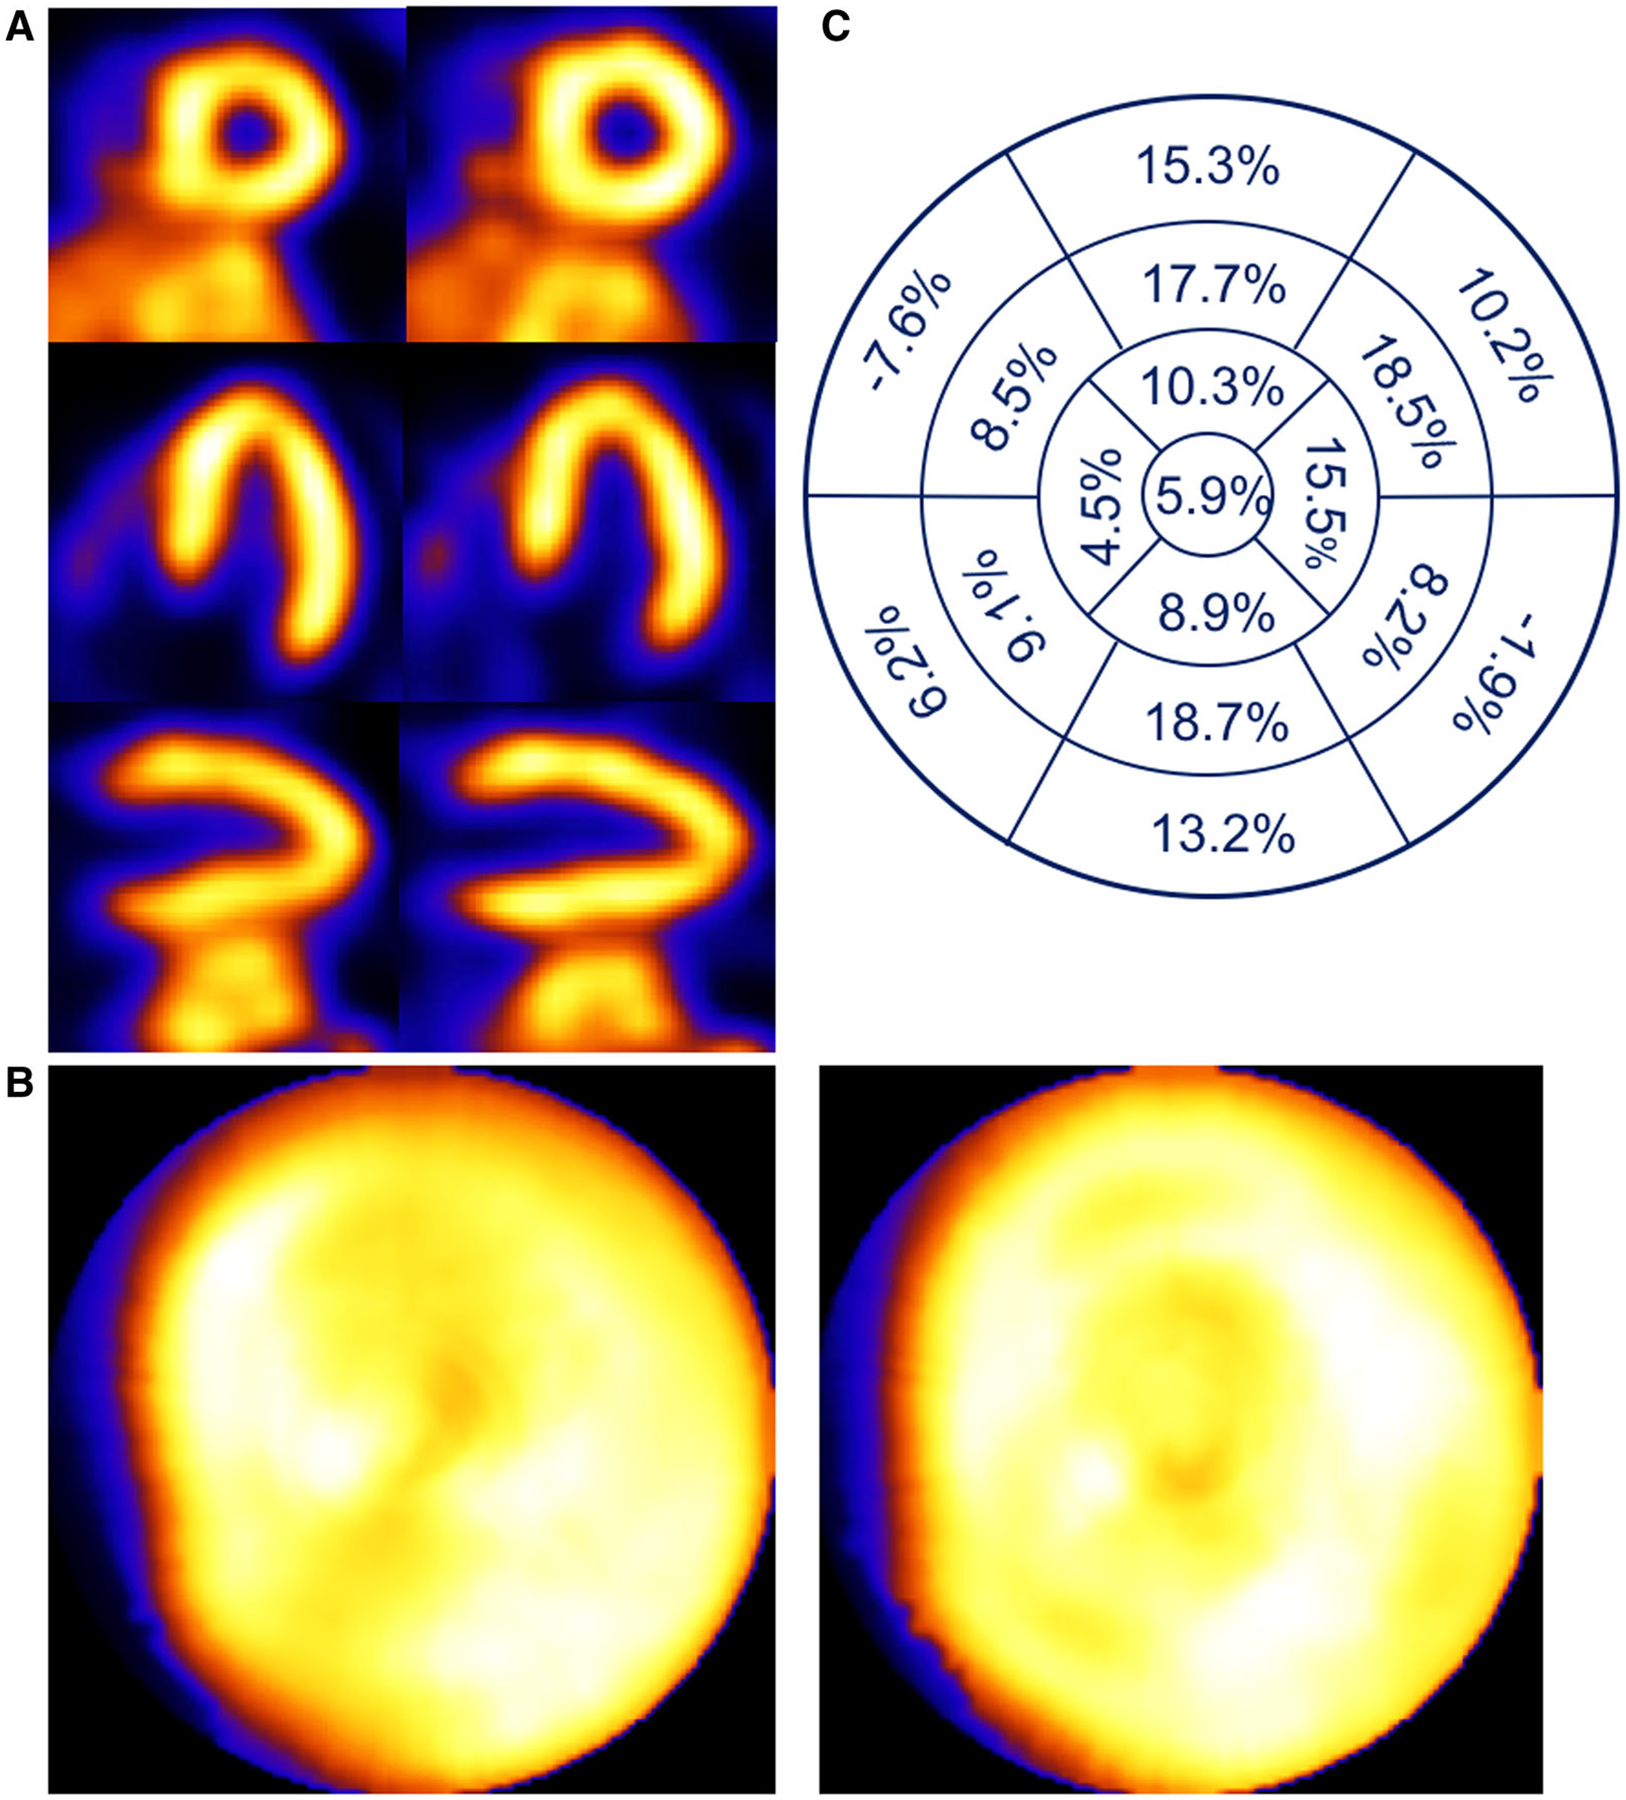
Patient example of a 49-year-old male with BMI of 26.0 evaluated for pre-operative renal treatment. Respiratory motion estimates were 2.8, 5.3, and 17.0 mm in the x (left-to-right), y (anterior-inferior), and z (head-to-foot) directions, respectively. (A) Shown are short-, horizontal long-, and vertical long-axis slices without (left) and with (right) respiratory compensation. (B) Comparison of polar maps generated from short-axis slices without (left) and with (right) respiratory motion compensation. (C) Presentation of the average % segmental-count differences between without and with respiratory motion compensation for the 17 polar map segments.
Figure 7.
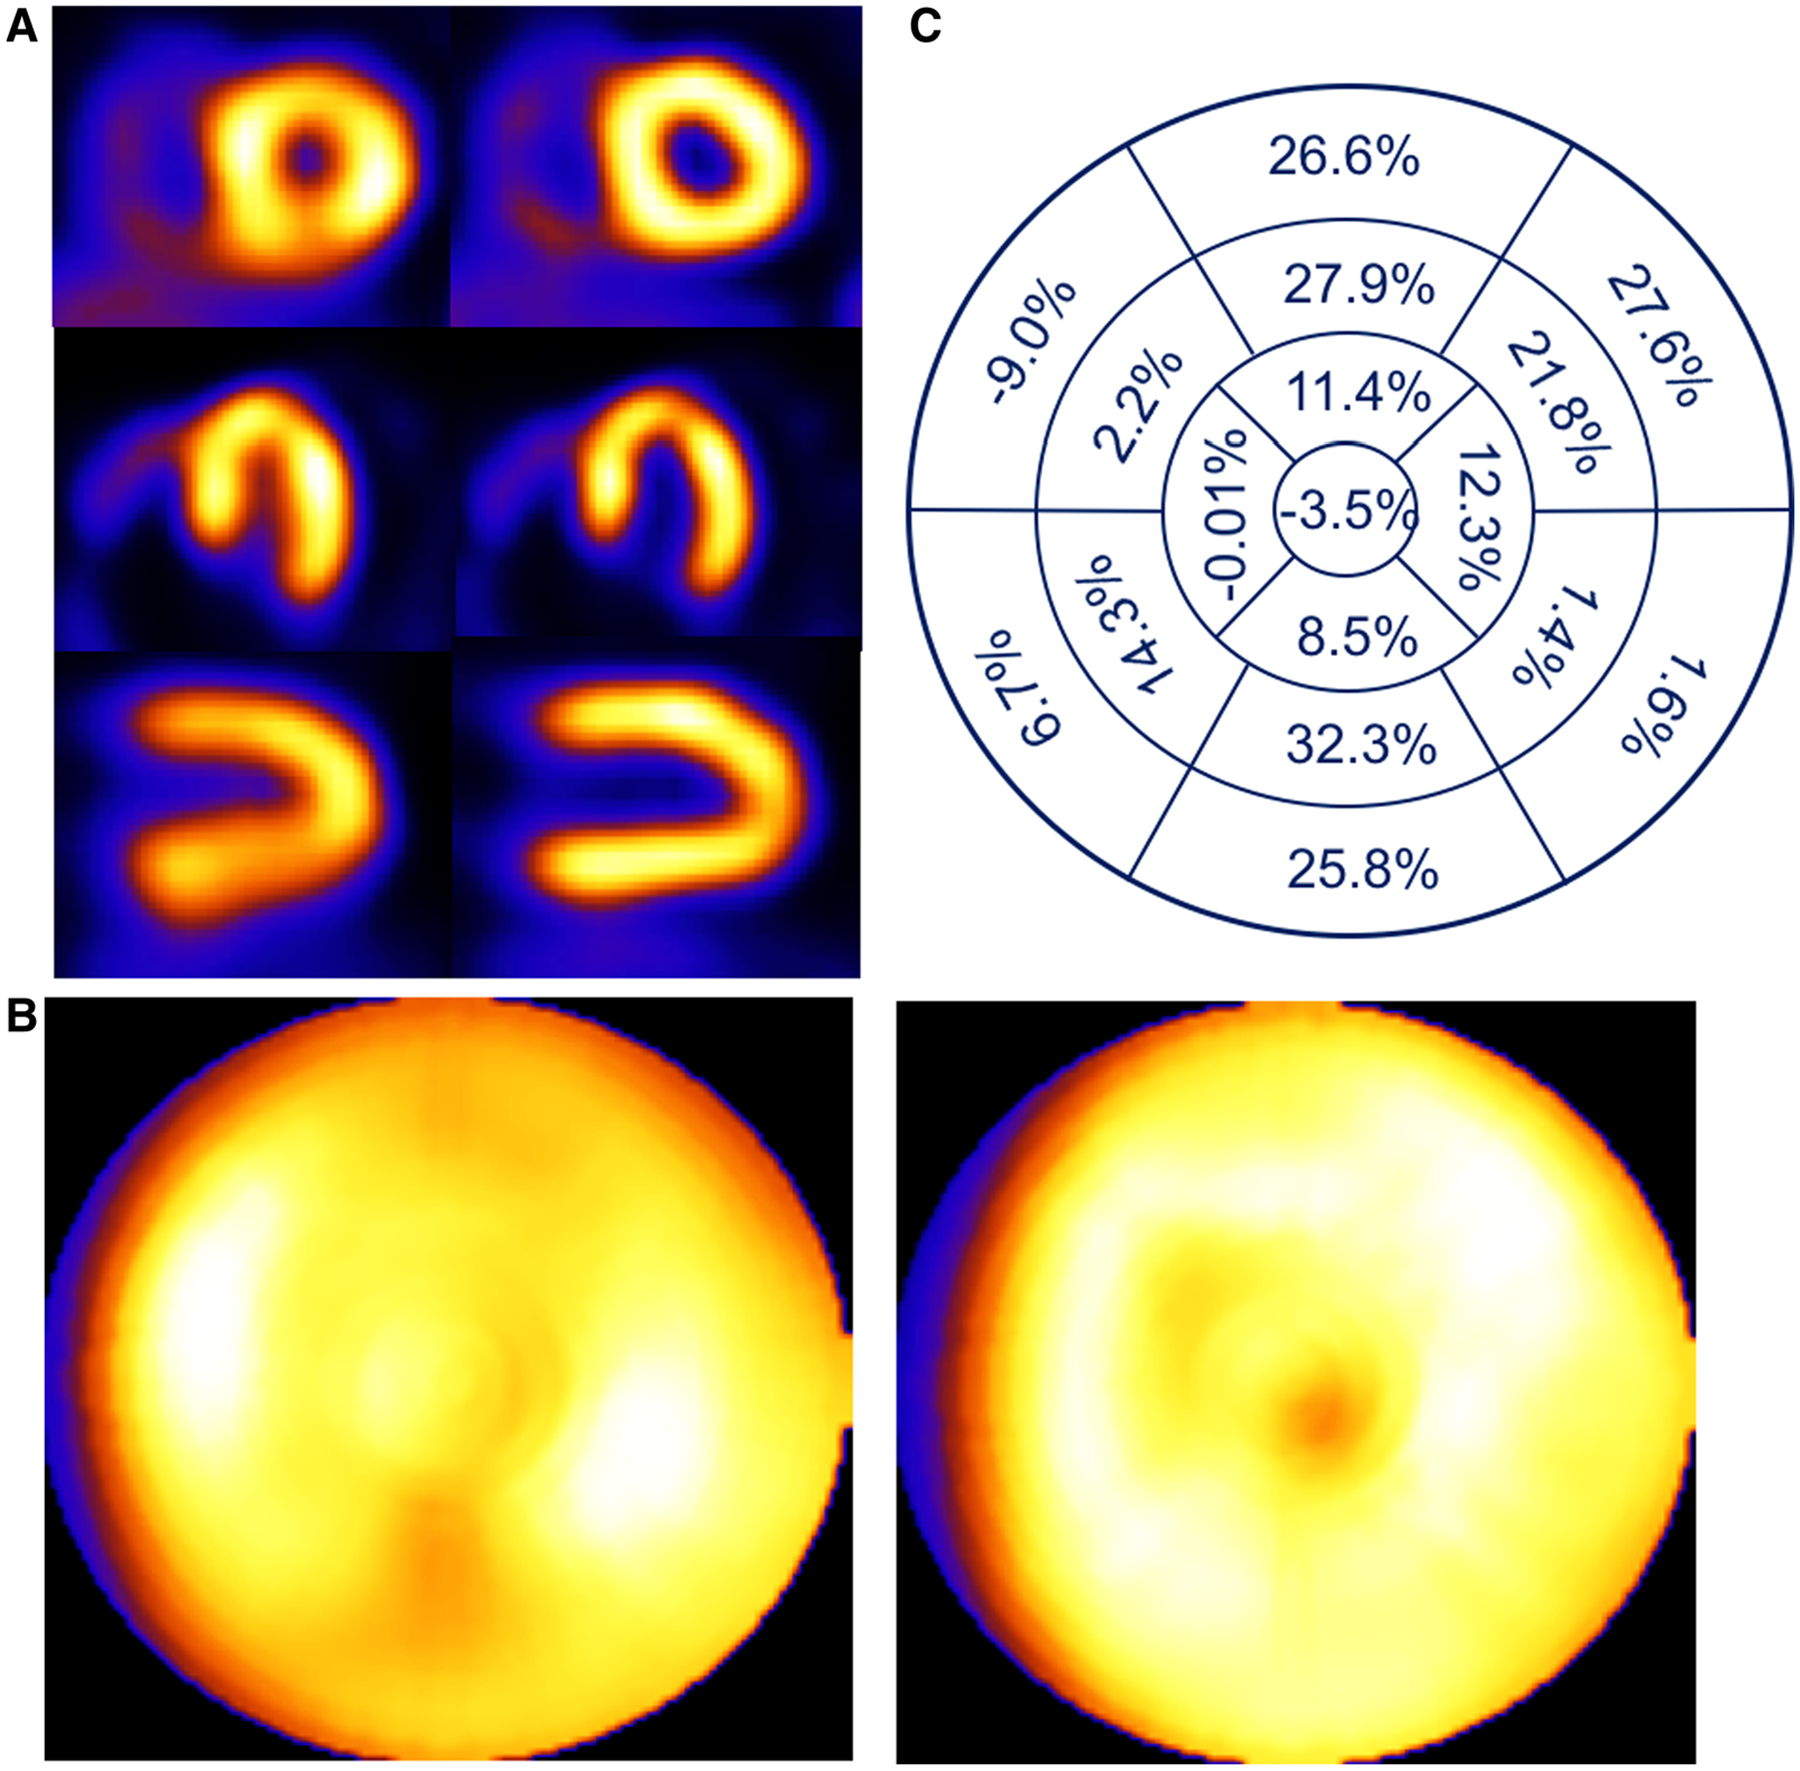
Patient example of a 54-year-old female with BMI of 35.3 presenting with palpitations. Respiratory motion estimates were 2.9, 7.3, and 21 mm in the x (left-to-right), y (anterior-inferior), and z (head-to-foot) directions respectively. (A) Shown are short-, horizontal long-, and vertical long-axis slices without (left) and with (right) respiratory compensation. (B) Comparison of polar maps generated from short-axis slices without (left) and with (right) respiratory motion compensation. (C) Presentation of the average % segmental-count differences between without and with respiratory motion compensation for the 17 polar map segments.
Figure 8.
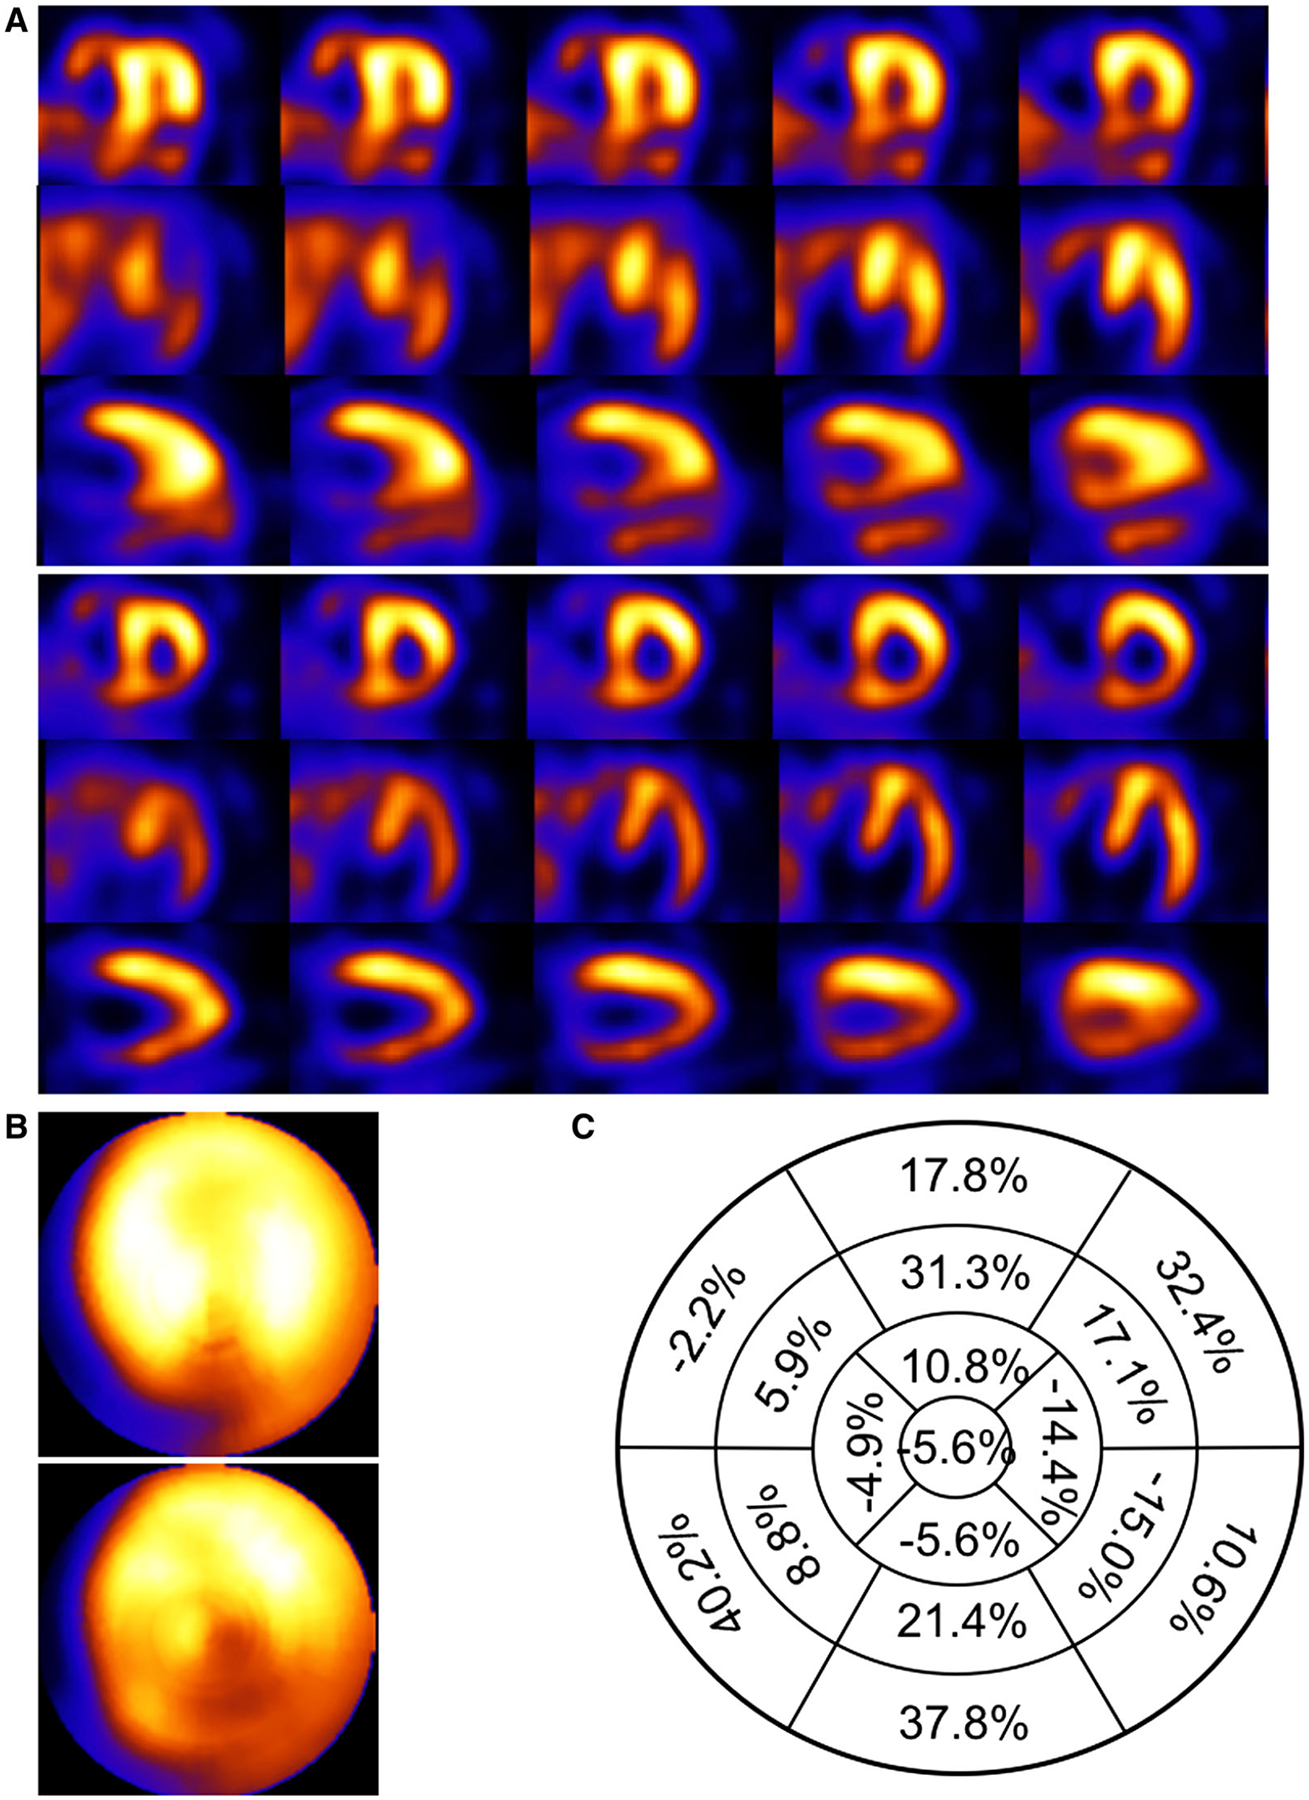
Patient example of a 73-year-old male with BMI of 30.7 with a previous percutaneous cardiac intervention (PCI) and known arteriosclerosis of the coronary arteries presenting with chest pain. Respiratory motion estimates were 9.2, 12.9 and 37.4 mm in the x (left-to-right), y (anterior-inferior), and z (head-to-foot) directions respectively. (A) Shown are short-, horizontal long-, and vertical long-axis slices without (top) and with (bottom) respiratory compensation. (B) Comparison of polar maps generated from short-axis slices without (top) and with (bottom) respiratory motion compensation. (C) Presentation of the average % segmental-count differences between without and with respiratory motion compensation for the 17 polar map segments.
Observations
As observed in the example studies of Figures 4, 5, 6, 7, and 8 and reported by others1,2,4–8,21 pseudo-ischemic decreases in the anterior and inferior walls can result from respiratory motion. In our experience, these decreases can be in both the anterior and inferior walls as pointed out by Arasaratnam et al22 and seen in our Figures 4, 6, 7 and 8, or more obviously in one or the other as seen in our Figure 5. We believe this difference in presentation may be due to variations in the pattern of respiration,4 orientation of the walls with respect to the direction of respiratory motion,4 the presence of extra-cardiac activity which may slow convergence with iterative reconstruction, and other anatomical/physiological variations between patients. It is interesting to note that attenuation has been shown to decrease counts in the anterior wall (preferentially for females) and inferior walls (typically for males).23–25 Thus, in the absence of attenuation correction respiratory motion could combine synergistically with these artifacts to result in even larger perceived alternations in wall counts.
Possible challenges to our acquisition and correction methods for respiratory motion correction are twofold, firstly, the success with which the markers are tracked, and secondly, the breathing pattern of the patient. Variations in patient anatomy, breathing patterns, camera head location during body-contouring acquisition, as well as equipment and technologist errors, can lead to failure in motion tracking. This caused an additional 62 patients beyond the 1103 reported herein to be unfit for respiratory motion correction. As we gained more experience and refined our methods for marker placement and tracking, we reduced the failure rate to a very low level (5.3% when failures are included in the total) from an initial 15% during the first 100 successful acquisitions. We still occasionally have issues with tracking very thin patients with “concave” abdomens. The second is a patient-specific phenomenon where due to very irregular breathing the magnitudes of the abdominal signal are such that one or more of the amplitude binned projections at a given angle are not populated with sufficient counts (25% of that expected with regular respiration)8 to be used in the initial reconstructions to estimate respiratory motion. When the subset projections for a given amplitude bin are not favorable (spread evenly across the acquisition arc), OSEM has difficulty reconstructing accurate enough slice estimates for use in respiratory motion estimation (step 9, Figure 1). We have determined it is then prudent to switch to MLEM which handles limited angle data better, adding to the processing time given in Table 2. Note that once the motion has been estimated, all counts are used in the final reconstruction so there this issue is not present.
NEW KNOWLEDGE GAINED
In this study of 1103 patients, we confirmed the degradation effects of respiratory motion on cardiac perfusion imaging, determined that 33.0% of the patients have motion estimates larger than 10 mm, and are first to point to the gender differences in respiratory motion estimates. Furthermore, we show that there is a benefit for routine clinical respiratory motion monitoring and subsequent compensation when the estimated motion was equal or greater than 10 mm in extent.
CONCLUSIONS
We have successfully developed and implemented an external respiratory motion tracking method in conjunction with respiratory motion estimation and reconstruction software for motion compensation. Our results suggest that about 33% of patients have respiratory estimates larger than 10 mm and would benefit visually to a varying extent depending on the magnitude of motion from compensation. Based on the change in counts in the anterior, anterior lateral, and inferior segments with motion correction (Figure 3 and Table 5), numerically one would expect changes caused by respiratory motion even for smaller respiratory motion estimates which would improve with correction, and the magnitude of the changes to increase with increased respiratory motion. In comparing genders, we noted a statically significant larger extent of respiratory motion in the left-to-right and head-to-feet directions in males. We also determined a statistically significant difference in the distribution of percent segmental-count differences with correction for all but two of the polar map segments for males, with male indices all larger than that of the females. Thus, males on average may be more impacted by respiratory motion. The utility of respiratory motion correction on the accuracy of SPECT myocardial perfusion imaging for the diagnosis of coronary artery disease warrants further study.
Acknowledgments
This study was supported by the National Institute of Biomedical Imaging and Bioengineering (NIBIB) under Grant No R01 EB001457, the National Heart, Lung, and Blood Institute under Grant No R01 HL122484, and Philips Healthcare. The contents are solely the responsibility of the authors and do not necessarily represent the official views of the National Institutes of Health or Philips Healthcare. The authors would also like to acknowledge the assistance of the technologists within the Division of Nuclear medicine at UMass Memorial Medical Center who assisted in the recruitment and imaging of the patient volunteers.
Disclosure
All the authors were supported in part by the National Institute of Biomedical Imaging and Bioengineering (NIBIB) under Grant No R01 EB001457, and the National Heart, Lung, and Blood Institute under Grant No R01 HL122484. Philips Health Care assist by providing information regarding the list mode rebinning routine used herein.
Abbreviations
- SPECT
Single photon emission computed tomography
- CT
Computed tomography
- OSEM
Ordered subset expectation maximization
- MLEM
Maximum likelihood expectation maximization
- SSD
Sum-squared-difference
- BMI
Body mass index
- SEE
Standard error of the estimate
- VOI
Volume of interest
- 6-DOF
6 degrees of freedom
- TEW
Triple energy window
Footnotes
Electronic supplementary material The online version of this article (doi:10.1007/s12350-017-0890-3) contains supplementary material, which is available to authorized users.
The authors of this article have provided a PowerPoint file, available for download at SpringerLink, which summarises the contents of the paper and is free for re-use at meetings and presentations. Search for the article DOI on http://www.SpringerLink.com.
References
- 1.Pretorius PH, King MA. A study of possible causes of artifactual decreases in the left ventricular apex with SPECT cardiac perfusion imaging. IEEE Trans Nucl Sci 1999;46:1016–23. [Google Scholar]
- 2.Tsui BMW, Segars WP, Lalush DS. Effects of upward creep and respiratory motion in myocardial SPECT. IEEE Trans Nucl Sci 2000;47:1192–5. [Google Scholar]
- 3.Yang Y-W C J-C, He X, Wang S-J, Tsui BMW. Evaluation of respiratory motion effect of defect detection in myocardial perfusion SPECT: A simulation study. IEEE Trans Nucl Sci 2009;56:671–6. [DOI] [PMC free article] [PubMed] [Google Scholar]
- 4.Pitman AG, Kalff V, Van Every B, Risa B, Barnden LR, Kelly MJ. Effect of mechanically simulated diaphragmatic respiratory motion on myocardial SPECT processed with and without attenuation correction. J Nucl Med 2002;43:1259–67. [PubMed] [Google Scholar]
- 5.Kovalski G, Israel O, Keidar Z, Frenkel A, Sachs J, Azhari H. Correction of heart motion due to respiration in clinical myocardial perfusion SPECT scans using respiratory gating. J Nucl Med 2007;48:630–6. [DOI] [PubMed] [Google Scholar]
- 6.Ko CL, Wu YW, Cheng MF, Yen RF, Wu WC, Tzen KY. Data-driven respiratory motion tracking and compensation in CZT cameras: A comprehensive analysis of phantom and human images. J Nucl Cardiol 2015;22:308–18. [DOI] [PubMed] [Google Scholar]
- 7.Cho K, Kumiata S, Okada S, Kumazaki T. Development of respiratory gated myocardial SPECT system. J Nucl Cardiol 1999;6:20–8. [DOI] [PubMed] [Google Scholar]
- 8.Dey J, Segars WP, Pretorius PH, Walvick RP, Bruyant PP, Dahlberg S, et al. Estimation and correction of cardiac respiratory motion in SPECT in the presence of limited-angle effects due to irregular respiration. Med Phys 2010;37:6453–65. [DOI] [PMC free article] [PubMed] [Google Scholar]
- 9.Buechel RRHL, Pazhenkottil AP, Nkoulou R, Herzog BA, Vurger IA, Ghadri JR, Wolfrum M, Kaufman PA. Myocardial perfusion imaging with real-time respiratory triggering: impact of inspiration breath hold on left ventricular function parameters. J Nucl Cardiol 2010;17:848–52. [DOI] [PubMed] [Google Scholar]
- 10.Bruyant PP, King MA, Pretorius PH. Correction of the respiratory motion of the heart by tracking of the center of mass of thresholded projections: A simulation study using the dynamic MCAT phantom. IEEE Trans Nucl Sci 2002;49:2159–66. [Google Scholar]
- 11.Mukherjee JM, McNamara JE, Johnson KL, Dey J, King MA. Estimation of rigid-body and respiratory motion of the heart from marker-tracking data for SPECT motion correction. IEEE Trans Nucl Sci 2009;56:147–55. [DOI] [PMC free article] [PubMed] [Google Scholar]
- 12.McNamara JE, Pretorius PH, Johnson K, Mukherjee JM, Dey J, Gennert MA, et al. A flexible multicamera visual-tracking system for detecting and correcting motion-induced artifacts in cardiac SPECT slices. Med Phys 2009;36:1913–23. [DOI] [PMC free article] [PubMed] [Google Scholar]
- 13.O’Connor JM, Pretorius PH, Johnson K, King MA. A method to synchronize signals from multiple patient monitoring devices through a single input channel for inclusion in list-mode acquisitions. Med Phys 2013;40:122502. [DOI] [PMC free article] [PubMed] [Google Scholar]
- 14.Feng B, Gifford HC, Beach RD, Boening G, Gennert MA, King MA. Use of three-dimensional Gaussian interpolation in the projector/backprojector pair of iterative reconstruction for compensation of known rigid-body motion in SPECT. IEEE Trans Med Imaging 2006;25:838–44. [DOI] [PMC free article] [PubMed] [Google Scholar]
- 15.Narayanan MV, King MA, Pretorius PH, Dahlberg ST, Spencer F, Simon E, et al. Human-observer receiver-operating-characteristic evaluation of attenuation, scatter, and resolution compensation strategies for Tc-99m myocardial perfusion imaging. J Nucl Med 2003;44:1725–34. [PubMed] [Google Scholar]
- 16.Ichihara T, Ogawa K, Motomura N, Kubo A, Hashimoto S. Compton scatter compensation using the triple-energy window method for single-isotope and dual-isotope SPECT. J Nucl Med 1993;34:2216–21. [PubMed] [Google Scholar]
- 17.Pretorius PH, Johnson KL, King MA. Evaluation of rigid-body motion compensation in cardiac perfusion SPECT employing polar-map quantification. IEEE Trans Nucl Sci 2016;63:1419–25. [DOI] [PMC free article] [PubMed] [Google Scholar]
- 18.Holly TA, Abbott BG, Al-Mallah M, Calnon DA, Cohen MC, DiFilippo FP, et al. Single photon-emission computed tomography. J Nucl Cardiol 2010;17:941–73. [DOI] [PubMed] [Google Scholar]
- 19.McLeish K, Hill DLG, Atkinson D, Blackall JM, Razavi R. A study of the motion and deformation of the heart due to respiration. IEEE Trans Med Imaging 2002;21:1142–50. [DOI] [PubMed] [Google Scholar]
- 20.Dey J, Pan TS, Choi DJ, Robotis D, Smyczynski MS, Pretorius PH, et al. Estimation of cardiac respiratory-motion by semi-automatic segmentation and registration of non-contrast-enhanced 4D-CT cardiac datasets. IEEE Trans Nuclear Sci 2009;56:3662–71. [DOI] [PMC free article] [PubMed] [Google Scholar]
- 21.Segars WP, Mok SP, Tsui BM. Investigation of respiratory gating in quantitative myocardial SPECT. IEEE Trans Nucl Sci 2009;56:91–6. [DOI] [PMC free article] [PubMed] [Google Scholar]
- 22.Arasaratnam P, Al-Zahrani A, Glenn Wells R, Beanlands RS, deKemp RA. Respiratory motion resulting in a pseudo-ischemia pattern on stress PET-CT imaging. J Nucl Cardiol 2016;23:159–60. [DOI] [PubMed] [Google Scholar]
- 23.DePuey EG. How to detect and avoid myocardial perfusion SPECT artifacts. J Nucl Med 1994;35:699–702. [PubMed] [Google Scholar]
- 24.Corbett JR F EP. Clinical review of attenuation-corrected cardiac SPECT. J Nucl Cardiol 1999;6:54–68. [DOI] [PubMed] [Google Scholar]
- 25.Burrell SMA. Artifacts and pitfalls in myocardial perfusion imaging. J Nucl Med Tech 2006;34:193–211. [PubMed] [Google Scholar]


