

Abstract
Introduction:
It is unclear how different proteinopathies (tau, transactive response DNA-binding protein 43 [TDP-43], amyloid β [Aβ], and α-synuclein) contribute to atrophy within medial temporal lobe (MTL) subregions in Alzheimer’s disease (AD).
Methods:
We utilized antemortem structural magnetic resonance imaging (MRI) data to measure MTL substructures and examined the relative contribution of tau, TDP-43, Aβ, and α-synuclein measured in post-mortem tissue from 92 individuals with intermediate to high AD neuropathology. Receiver-operating characteristic (ROC) curves were analyzed for each subregion in order to discriminate TDP-43-negative and TDP-43-positive patients.
Results:
TDP-43 was strongly associated with anterior MTL regions, whereas tau was relatively more associated with the posterior hippocampus. Among the MTL regions, the anterior hippocampus showed the highest area under the ROC curve (AUC).
Discussion:
We found specific contributions of different pathologies on MTL substructure in this population with AD neuropathology. The anterior hippocampus may be a relevant region to detect concomitant TDP-43 pathology in the MTL of patients with AD.
Keywords: Alzheimer’s disease, atrophy, medial temporal lobe, neuropathology, tau, TDP-43
1 |. INTRODUCTION
Brain atrophy is a typical feature of Alzheimer’s disease (AD).1,2 The medial temporal lobe (MTL), composed of the hippocampus and entorhinal (ERC), perirhinal (PRC—including Brodmann areas [BA] 35 and 36), and parahippocampal cortices (PHC), is usually the earliest region to display atrophy over the course of the disease, consistent with the early neurofibrillary tangle involvement of this region.1,3–5 Moreover, MTL subregions are not affected homogeneously. Although PRC—more precisely BA35—is already affected in individuals with preclinical AD (ie, amyloid-positive, cognitively normal), ERC, PHC, and the hippocampus display greater atrophy as the disease progresses to prodromal AD and beyond.6,7
From a neuropathologic point of view, AD is defined by the presence of neurofibrillary tangles (NFTs) and extracellular deposits of amyloid β (Aβ).8 Using autopsy data, Braak et al. described a stereotypical spatial progression of NFTs, with initial involvement of the transentorhinal region (corresponding to BA35) before the pathology spreads to the limbic regions and ultimately to the neocortex.9 The topography of this progression is similar to the progression of brain atrophy, supporting a direct relationship between tau pathology and atrophy. Indeed, a number of studies have associated volumetric magnetic resonance imaging (MRI) with either pathological,10–12 cerebrospinal fluid (CSF),13–15 or positron emission tomography (PET)16–18 measures of NFT burden.
However, additional pathologies such as transactive response DNA-binding protein 43 (TDP-43) and/or α-synuclein (α-syn) often co-occur alongside NFT and Aβ in individuals with AD pathological change.19 For example, TDP-43 pathology has been found in 30% to 70% of individuals with autopsy-confirmed AD19–23 and, similar to NFTs, is hypothesized to spread according to a stereotypical scheme starting in the MTL before reaching cortical regions.24 Recently, a consensus working group aimed at highlighting the role of TDP-43 in aging-related neurodegenerative disease and introduced the new neuropathological term LATE (for limbic-predominant age-related TDP-43 encephalopathy).25 It is important to note that studies coupling MRI and histology have demonstrated that TDP-43 pathology is associated with reduced hippocampal volume and increased rate of hippocampal atrophy in individuals with AD, as well as increased likelihood of being cognitively impaired at death.21,22,26 Unfortunately, there is no available molecular biomarker (biofluid or PET) that allows detection of concomitant TDP-43 pathology in vivo at this time. This inability to distinguish AD patients with and without TDP-43 pathology is thus a major gap in current clinical practice and research. Although it is well acknowledged that the MTL is associated with several concomitant pathologies in the context of AD, the relative contribution of each to atrophy is not well established, particularly when considering effects of specific MTL subregions. Furthermore, it is unclear whether patterns of MTL atrophy may be able to differentiate AD pathology alone versus cases with mixed pathology. If so, this would provide additional specificity to MRI-based MTL measures of neurodegeneration in this region.26
The aim of this study was to examine the pattern of MTL subregion atrophy associated with different co-pathologies (tau, Aβ, TDP-43, and α-syn) in the AD continuum. As such, we utilized antemortem structural MRI data using an advanced segmentation tool to measure MTL structures and examined the relative contribution of NFT, Aβ, TDP-43, and α-syn measured in post-mortem tissue from patients with AD neuropathological change. Given prior work demonstrating a specific effect of TDP-43 on MTL structure in the context of AD, a second aim was to discriminate patients with and without TDP-43 pathology using MTL subregions.
2 |. METHODS
2.1 |. Participants
Participants were selected from the Penn Center for Neurodegenerative Disease Research (CNDR) brain bank according to the following criteria: (1) at least low Alzheimer’s disease neuropathologic change (ADNC) and (2) research-quality antemortem magnetic resonance imaging (MRI). Individuals with non-AD tauopathies as a primary pathological diagnosis were excluded. A total of 122 patients met these criteria and were included in this study. Note that the average time between MRI and autopsy was 44.83 (± 31.40) (SD) months. All procedures during life were performed with prior informed consent in accordance with Penn Institutional Review Board guidelines.
2.2 |. Neuropathological staging
Sixteen regions are routinely examined in the CNDR neuropathology evaluations as described in previous publications.27 More precisely, tissue was embedded in paraffin blocks and cut into 6 μm sections for immunohistochemistry using the following primary antibodies: NAB228 to detect amyloid deposits, phosphorylated tau PHF-1 to detect phosphorylated tau deposits, pS409/410 to detect phosphorylated TDP-43 deposits, and Syn303 to detect the presence of pathological conformation of α-syn (see Figure 1 for examples of staining). Each region was assigned a semiquantitative score at neuropathological examination, that is, none (0), rare (0.5), mild (1), moderate (2), or severe (3) for individual lesions. Because the present study focused specifically on the medial temporal lobe (MTL) (excluding the amygdala), a score was calculated by averaging the scores of CA1/subiculum and the entorhinal cortex (ERC) for each pathologic species. Note that we focused on studying granular MTL measurements in relationship to pathology given their frequent use as a neurodegenerative biomarker in the AD continuum, the precision with which our MRI pipeline can measure these subregions, and the fact that different proteinopathies may affect different MTL structures. Future work may also want to focus on the amygdala in which all pathologies occur early. Patients were considered as TDP-43 positive with an MTL score ≥1. As a consequence, the TDP-43-negative group was composed of patients without any TDP-43 pathology or with amygdala only TDP-43 (stage 1 according to Josephs et al. [2016]).24
FIGURE 1.
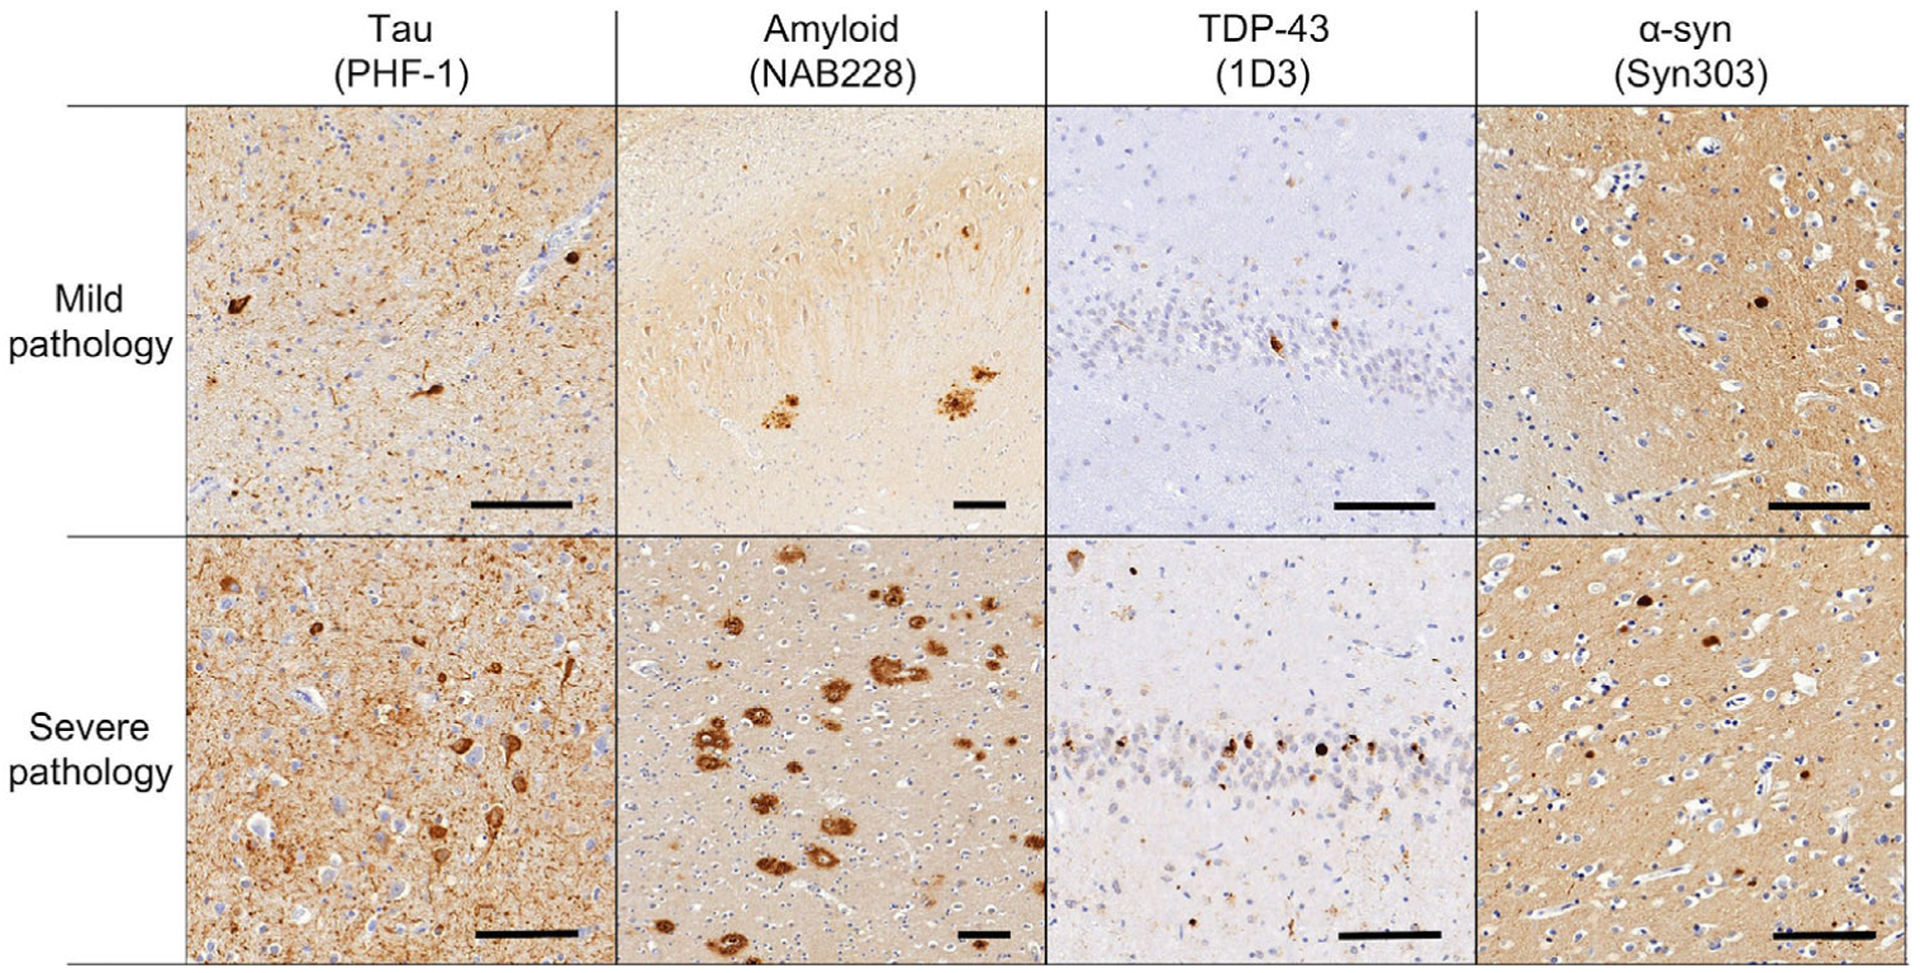
Examples of pathological assessment for each pathological lesion in the medial temporal lobe. The upper panel shows mild ratings for inclusions and the lower panel shows severe ratings. The first column shows tau pathology from the entorhinal cortex (PHF-1 antibody), the second column shows amyloid plaques in CA1 (NAB228 antibody), the third column shows TDP-43 inclusions in the dentate gyrus (pS409/410 antibody), and the fourth column shows Lewy bodies (Syn303 antibody) in the entorhinal cortex. Scale bar is 100 μm
Expert neuropathologists (EBL, JQT) applied current diagnostic criteria to assign Thal phases,28 Braak tau stages,9 and consortium to establish a registry for Alzheimer’s disease (CERAD) neuritic plaque stages.29 Based on neuropathological criteria using Aβ amyloid Thal phase, Braak tau stage, and CERAD plaque score (ie, ABC scoring—[8]), only patients with at least a low level of ADNC were included in our analyses. In addition, staging was performed for TDP-4324 and α-syn Lewy bodies30 using modified scales (see supplementary material for more details regarding the neuropathological staging).
2.3 |. MRI
Each of the 122 patients underwent antemortem T1-weighted structural MRI. MTL subregions were automatically segmented using the ASHS-T1 pipeline (https://sites.google.com/view/ashs-dox/home).7,31 This multi-atlas segmentation algorithm offers the advantage of accounting for confounds of dura mater tissue and MTL cortex anatomic variability. Briefly, six regions were segmented: the anterior and posterior hippocampus (aH and pH, respectively), the entorhinal cortex (ERC), Brodmann areas (BA) 35 and 36, and the parahippocampal cortex (PHC) (see Figure 2). Intracranial volume (ICV) was also measured using ASHS-T17 (see supplementary material for more details about ASHS). All segmentations were visually inspected. Failed segmentations were manually edited when feasible or were discarded. Note that in some individuals, a subset of regions of the MTL were of adequate quality to be included in the analyses, but others were not. As a result, the number of subjects for a given MTL measure varies.
FIGURE 2.
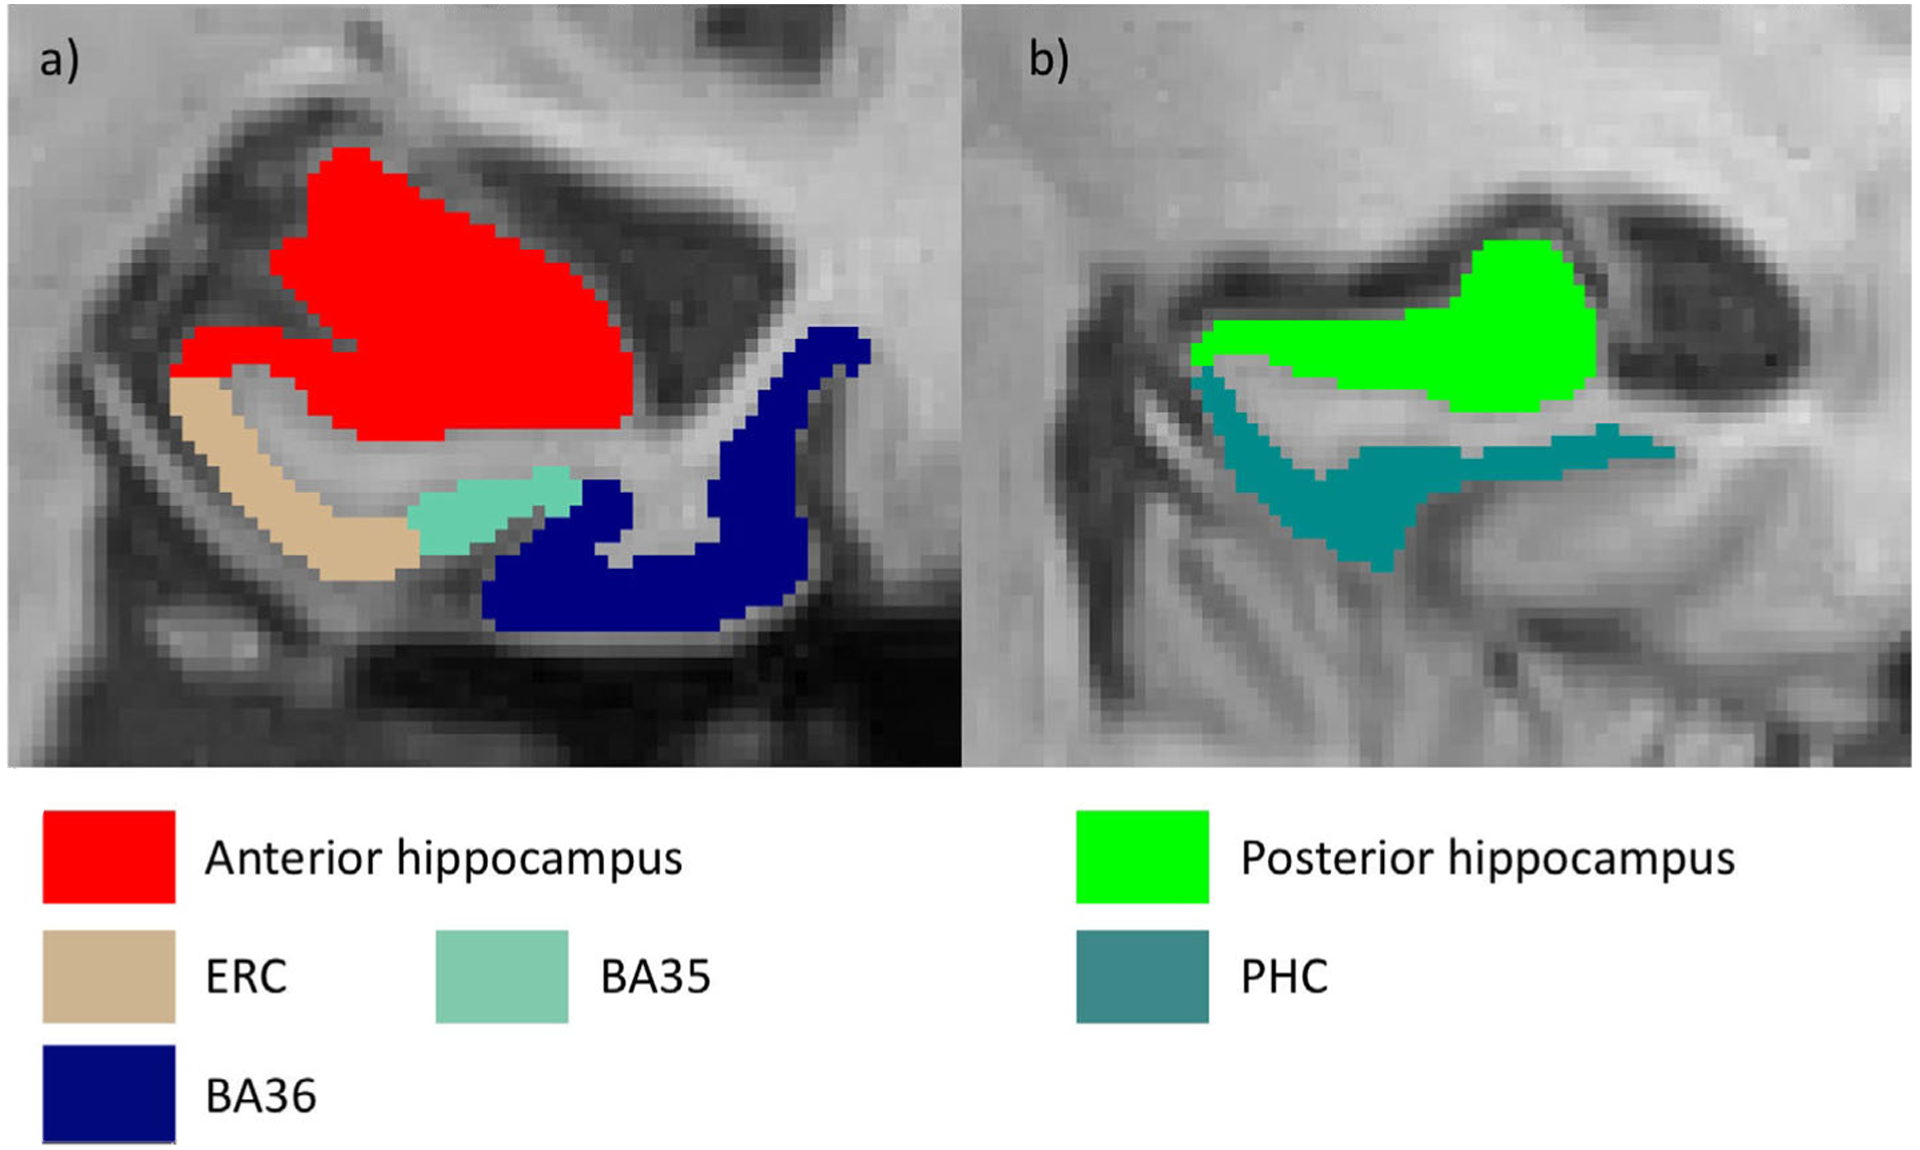
Segmentation of the medial temporal lobe using ASHS-T1 (Xie et al., 2019). An anterior (A) and posterior (B) slice from the same subject are displayed. BA, Brodmann area; ERC, entorhinal cortex; PHC, parahippocampal cortex
In order to limit the number of statistical tests, left and right measures were averaged for each MTL subregion. Anterior and posterior hippocampal volumes were then adjusted for age at MRI and ICV (based on linear regressions). For extrahippocampal regions, we used mean cortical thickness measures instead of volume because they are less sensitive to uncertainty in lateral boundary estimation between cortical regions.32 The thickness of ERC, BA35, BA36, and PHC was adjusted for age at MRI.
2.4 |. Statistics
The analyses were performed initially in patients with intermediate and high ADNC. First, the relationships between each MTL measure and scores reflecting the amount of NFT, Aβ, TDP-43, and α-syn in the MTL were investigated using separate partial Spearman rank correlation models, with time between MRI and autopsy as a covariate. In addition, the relationships between MTL measures and stage of NFT, Aβ, TDP-43, and α-syn were also investigated in the same way. To evaluate the relative contribution of the different pathologies, partial Spearman rank correlations were applied in which each proteinopathy was controlled for the others in relation to the MRI subregion measurements. To investigate the effects of sex, APOE status, or atherosclerosis on these relationships, we repeated our analyses with these variables used as additional covariates (separately). One-tailed tests were performed because negative associations between the amount of pathologies and MTL structures were expected.
TDP-43-positive and TDP-43-negative patients were compared using analyses of covariance (ANCOVAs) for each of the six subregions and the whole hippocampus with time between MRI and autopsy as a covariate. Areas under the receiver-operating characteristic (ROC) curve (AUC) were calculated to discriminate between the two groups. This graphical method is used classically to evaluate the accuracy of a classifier and consists of plotting each pair of true-positive and false-positive rates at various threshold settings. Higher AUCs reflect better discrimination. To compare the ability of each region to discriminate between TDP-43-positive and TDP-43-negative patients, AUCs were calculated only in patients with available measures for all MTL regions.
To get a broader range of AD and non-AD pathologies, we repeated the correlational analyses including individuals with low ADNC in addition to those with intermediate and high ADNC.
Finally, we performed exploratory analyses using a 3D pointwise approach to further evaluate the regional associations between pathology and MTL structures.18 Spearman rank correlation models, with time between MRI and autopsy, and age as covariates, were employed to evaluate the local association between the MTL and (1) the amount of pathology in the MTL and (2) pathological stages. Note that these analyses were performed both in the intermediate to high ADNC group and in the low to high ADNC group.
Results from correlations were considered significant after Bonferroni correction P < 2.10e-03, corresponding to 0.05/24 (6 regions × 4 pathologies). Results from group comparisons were considered significant after Bonferroni correction P < 7.10e-03, (corresponding to 0.05/7 regions). The statistics were performed using the “ppcor,” “stats,” and ”pROC” R packages.
3 |. RESULTS
3.1 |. Participants
Ninety-two subjects met criteria for intermediate or high Alzheimer’s disease neuropathologic change (ADNC) (67% were APOE ε4 carriers). Of these 92 patients, 71 were defined as transactive response DNA-binding protein 43 (TDP-43) negative (72% were APOE ε4 carriers) and 20 were defined as TDP-43 positive (55% were APOE ε4 carriers). Note that some cases that are Stage 1 or beyond did not meet our criteria for TDP-43 positive in the medial temporal lobe (MTL) due to assessments below the cutoff of <1 for the mean MTL burden. Among these 92 subjects, 78 had a primary pathological diagnosis of AD, 13 had a diagnosis of Lewy body disease, and one had a primary pathological diagnosis of frontotemporal lobar degeneration with TDP-43 inclusions (FTLD-TDP). See Table S2 for group characteristics.
3.2 |. Relationship between pathologies and MTL structures
As displayed in Table 1, the amount of TDP-43 in the MTL was correlated significantly with the volume of the anterior hippocampus (aH) (rho = −0.46, P = 4.17e-06) and correlations that did not survive correction were found for the posterior hippocampus (pH) volume (rho = −0.21, P = .03) as well as for the entorhinal cortex (ERC) thickness (rho = −0.24, P = .02). An association was also found between neurofibrillary tangle (NFT) and pH volume (rho = −0.25, P = .01), but did not survive correction for multiple comparisons. No significant correlations were found for Aβ or α-syn.
TABLE 1.
Relationship between post-mortem pathology measures and ante-mortem medial temporal lobe measures in patients with intermediate to high Alzheimer’s disease (AD) pathology
| Anterior hippocampus (n = 89) |
Posterior hippocampus (n = 89) |
ERC (n = 76) |
BA35 (n = 79) |
BA36 (n = 79) |
PHC (n = 83) |
|
|---|---|---|---|---|---|---|
| One model/proteinopathy | ||||||
| NFT | rho = −0.11 | rho = −0.24 | rho = −4.20e–03 | rho = −0.15 | rho = −0.02 | rho = −0.06 |
| P = .14 | P = .01 | P = .49 | P = .09 | P = .45 | P = .29 | |
| Amyloid β | rho = −0.09 | rho = −0.10 | rho = 0.06 | rho = −1.20e–03 | rho = 0.02 | rho = −0.11 |
| P = .22 | P = .19 | P = .31 | P = .50 | P = .44 | P = .18 | |
| TDP-43 | rho = −0.46 | rho = −0.21 | rho = −0.24 | rho = 0.03 | rho = 0.12 | rho = 0.01 |
| P = 4.17e–06 | P = .03 | P = .02 | P = .40 | P = .15 | P = .46 | |
| α-Synuclein | rho = −0.04 | rho = 0.08 | rho = −0.05 | rho = 0.02 | rho = −0.15 | rho = −0.06 |
| P = .34 | P = .23 | P = .35 | P = .43 | P = .09 | P = .31 | |
| Tau stage9 | rho = −0.09 | rho = −0.24 | rho = −0.07 | rho = −0.16 | rho = 0.11 | rho = −0.08 |
| P = .20 | P = .01 | P = .27 | P = .08 | P = .16 | P = .23 | |
| Amyloid β stage28 | rho = −0.12 | rho = 0.07 | rho = −0.04 | rho = −0.10 | rho = 0.08 | rho = −0.14 |
| P = .14 | P = .25 | P = .37 | P = .19 | P = .24 | P = .10 | |
| TDP-43 stage24 | rho = −0.42 | rho = −0.17 | rho = −0.26 | rho = −0.03 | rho = 0.18 | rho = −1.00e–04 |
| P = 4.11e–05 | P = .06 | P = .01 | P = .40 | P = .06 | P = .50 | |
| α-Synuclein stage30 | rho = −0.07 | rho = 0.09 | rho = −0.12 | rho = −0.06 | rho = −0.22 | rho = −0.13 |
| P = .28 | P = .21 | P = .16 | P = .30 | P = .03 | P = .13 | |
| All proteinopathies in one model | ||||||
| NFT | rho = −0.13 | rho = −0.24 | rho = 0.05 | rho = −0.15 | rho = −0.06 | rho = −0.05 |
| P = .14 | P = .02 | P = .34 | P = .11 | P = .32 | P = .34 | |
| Amyloid β | rho = −0.17 | rho = −0.11 | rho = 0.02 | rho = 0.03 | rho = 0.07 | rho = −0.08 |
| P = .08 | P = .18 | P = .44 | P = .42 | P = .29 | P = .27 | |
| TDP-43 | rho = −0.49 | rho = −0.24 | rho = −0.29 | rho = 0.02 | rho = 0.09 | rho = 0.02 |
| P = 4.00e–06 | P = .02 | P = .01 | P = .43 | P = .23 | P = .43 | |
| α-Synuclein | rho = −3.30e–03 | rho = 0.07 | rho = −0.03 | rho = 0.03 | rho = −0.21 | rho = −0.09 |
| P = .49 | P = .27 | P = .40 | P = .41 | P = .04 | P = .22 | |
Measurements that survived Bonferroni correction (P < 2.10e-3) are highlighted in bold font and those between P < 2.10e-3 and P < .05 are highlighted in italic. NFT, amyloid β, TDP-43, and α-synuclein were measured within the medial temporal lobe while tau stage, Aβ stage, TDP-43 stage, and α-syn stage and correspond to whole-brain staging (based on Braak et al., 2006; Thal et al., 2002; Josephs et al., 2016; McKeith et al., 2005, repectively).
Abbreviations: BA, Brodmann area; ERC, entorhinal cortex; NFT, neurofibrillary tangle; PHC, parahippocampal cortex.
Partial Spearman rank correlations, using covariates of each of the other proteinopathy scores (eg, TDP43 with covariates of Aβ, NFTs and α-syn), displayed a significant negative association between TDP-43 and the volume of aH (rho = −0.49, P = 4.00e-06). Additional associations were found for pH volume (rho = −0.24 P = .02) and ERC thickness (rho = −0.29, P = .01) with TDP43, pH volume (rho = −0.24, P = .02) with NFT, and BA36 thickness (rho = −0.21, P = .04) with α-syn.
When using global staging measures as opposed to local MTL burden, higher TDP-43 stage was significantly associated with smaller aH (rho = −0.42, P = 4.11e-05) and ERC thickness (rho = −0.26, P = .01), but the latter did not survive correction. Additional weaker correlates were found between NFT and pH volume (rho = −0.24, P = .01) and between α-syn and BA36 thickness (rho = −0.22, P = .03).
Results were essentially unchanged when controlling for sex, APOE status, and atherosclerosis (see Tables S3, S4, and S5, respectively).
3.3 |. Comparisons between TDP-43-positive and TDP-43-negative patients
All the group comparisons are reported in Table 2. Note that the number of patients varied by region (between n = 75 and n = 88, listed in the table below) based on the number of segmentations of adequate quality. When compared to TDP-43-negative patients, TDP-43-positive patients showed significantly reduced volumes for the whole hippocampus (d’ = 0.85, F(1,85) = 10.63, P = 1.60e-03) and aH (d’ = 1.02, F(1,85) = 15.25, P = 2.00e-04) as well as thinner ERC (d’ = 0.96, F(1,72) = 10.38, P = 1.90e-03). We then calculated two measures corresponding to ratios between the two subregions that differed the most (aH and ERC) and the least (parahippocampal cortex (PHC)) between the two groups. The ratios between aH/PHC and ERC/PHC were reduced in TDP-43-positive patients (d’ = 1.09, F(1,79) = 15.85, P = 2.00e-04 and d’ = 1.33, F(1,72) = 19.9, P < 1.00e-06, respectively).
TABLE 2.
Comparisons between TDP-43-negative and TDP-43-positive patients with intermediate to high AD pathology
| Values: mean ± SD (n) | Statistical comparisons | |||||
|---|---|---|---|---|---|---|
| TDP-43 − | TDP-43 + | F | P | Cohen’s d (95% CI) | AUROC (95% CI) | |
| Whole hippocampus | 2911.14 ± 422.06 (n = 69) | 2553.31 ± 425.47 (n = 19) | 10.63 | 1.60e–03 | 0.85 (0.32–1.38) | 0.72 (0.56–0.89) |
| Anterior hippocampus | 1505.87 ± 249.63 (n = 69) | 1253.19 ± 231.66 (n = 19) | 15.25 | 2.00e–04 | 1.02 (0.48–1.55) | 0.81(0.65–0.96) |
| Posterior hippocampus | 1408.27 ± 214.67 (n = 69) | 1300.12 ± 233.46 (n = 19) | 3.63 | .06 | 0.49 (−0.03–1.01) | 0.60 (0.41–0.79) |
| ERC | 1.88 ± 0.19 (n = 61) | 1.66 ± 0.36 (n = 14) | 10.38 | 1.90e–03 | 0.96 (0.35–1.57) | 0.71(0.55–0.88) |
| BA35 | 1.96 ± 0.24 (n = 64) | 1.89 ± 0.37 (n = 14) | 0.82 | .37 | 0.27 (−0.32–0.86) | 0.55 (0.37–0.74) |
| BA36 | 2.14 ± 0.24 (n = 64) | 2.12 ± 0.22 (n = 14) | 0.04 | .84 | 0.06 (−0.53–0.65) | 0.53 (0.37–0.69) |
| PHC | 1.93 ± 0.19 (n = 65) | 1.93 ± 0.22 (n = 17) | 0 | .95 | 0.02 (−0.53–0.56) | 0.58 (0.40–0.75) |
| Ratio: Anterior hippocampus/PHC | 788.21 ± 128.56 (n = 65) | 656.18 ± 86.64 (n = 17) | 15.85 | 2.00e–04 | 1.09 (0.52–1.66) | 0.84 (0.72–0.97) |
| Ratio: ERC/PHC | 0.98 ± 0.09 (n = 61) | 0.84 ± 0.14 (n = 14) | 19.9 | <1.00e–06 | 1.33 (0.7–1.96) | 0.82 (0.70–0.93) |
Hippocampal volumes are given in mm3 (adjusted for age at MRI and ICV) and extra-hippocampal thicknesses are given in mm (adjusted for age at MRI). The whole hippocampus was calculated as the sum of the anterior and posterior hippocampus. Measurements that survived Bonferroni correction (P < 7.10e-03) are highlighted in bold font.
Abbreviations: BA, Brodmann area, ERC, entorhinal cortex, PHC, parahippocampal cortex.
For comparison, ROC analyses always included the same set of 75 subjects (14 TDP-43 positive and 61 TDP-43 negative) for whom the segmentation of all regions was adequate. Among the MTL measures showing significant differences between groups, the ratio between aH and PHC was the most discriminative (AUC = 0.84, 95% confidence interval [CI]: 0.72–0.97), followed by the ratio between ERC and PHC (AUC = 0.82, 95% CI: 0.70–0.93), the aH (AUC = 0.81, 95% CI: 0.65–0.96), the whole hippocampus (AUC = 0.72, 95% CI: 0.56–0.89), and ERC (AUC = 0.71, 95% CI: 0.55–0.88). The two most discriminant and the two least discriminant ROC curves are displayed in Figure 3. Note that the group comparison analyses were repeated by removing patients with amygdala only TDP-43 pathology from the negative group such that the negative group was composed only of patients without any evidence of TDP-43 pathology. Results were similar, with a slightly better discrimination for the volume of aH and the ratio of aH/PHF or ERC/PHF (see Table S6). Moreover, to directly evaluate the contribution of amygdala TDP-43 pathology to MTL atrophy, we compared patients at stage 1 (amygdala only) as described by Josephs et al. (2016) (n = 12) with patients without any TDP-43 pathology (stage 0, n = 44). No significant differences were found between this two groups (see Table S7).
FIGURE 3.

Receiver-operating characteristic (ROC) curves for the discrimination of TDP-43-positive (n = 14) versus TDP-43-negative (n = 61) patients with Alzheimer’s disease (AD). Patients were defined as TDP-43 positive with an MTL score ≥1. The two most discriminant (ratio between aH and PHC [blue]; ratio between ERC and PHC [red]) and the two least discriminant (PHC [green]; BA36 [black]) ROC curves are displayed. A higher area under the curve (AUC) reflects better group discrimination. True positive rate: Proportion of positive patients correctly classified as positive (also corresponding to sensitivity). False positive rate: Proportion of negative patients incorrectly classified as positive (also corresponding to 1 - specificity, where specificity is the proportion of negative patients correctly classified as negative). BA, Brodmann area; ERC, entorhinal cortex; PHC, parahippocampal cortex
Note that we repeated all of these analyses (correlations and group comparisons) without the individual with a primary pathological diagnosis of FTLD-TDP, and the results were essentially unchanged.
3.4 |. Additional analyses in the low to high ADNC group
Although our above analyses focused on the associations of mixed pathologies in the context of substantial AD pathology (ie, moderate- and high-level ADNC), we repeated our analyses including this time with patients with low ADNC, in order to capture a broader variance in ADNC for path-imaging correlations. Results were essentially unchanged, showing a strong association between TDP-43 and anterior MTL regions (aH and ERC), whereas NFT pathology was relatively more associated with pH (see Table S8).
3.5 |. Pointwise analyses
Because Aβ and α-syn showed only very modest associations with MTL structures, we performed exploratory pointwise analyses for only NFT and TDP-43 pathologies. These analyses are displayed in Figure 4 and demonstrated overall similar results in comparison to those from the direct correlations with regions of interest. Although NFT pathology was negatively associated with the posterior hippocampus and, to some extent, ERC and BA35, TDP-43 was specifically correlated with the anterior portion of the hippocampus, ERC, and, to some extent, BA35. Note that the spatial distribution of these results were highly similar when considering either MTL pathology or stages, as well as when performed in individuals with intermediate and high ADNC or low to high ADNC, although effects were perhaps a bit stronger for NFT in the latter, perhaps reflecting a broader range of NFT pathology.
FIGURE 4.
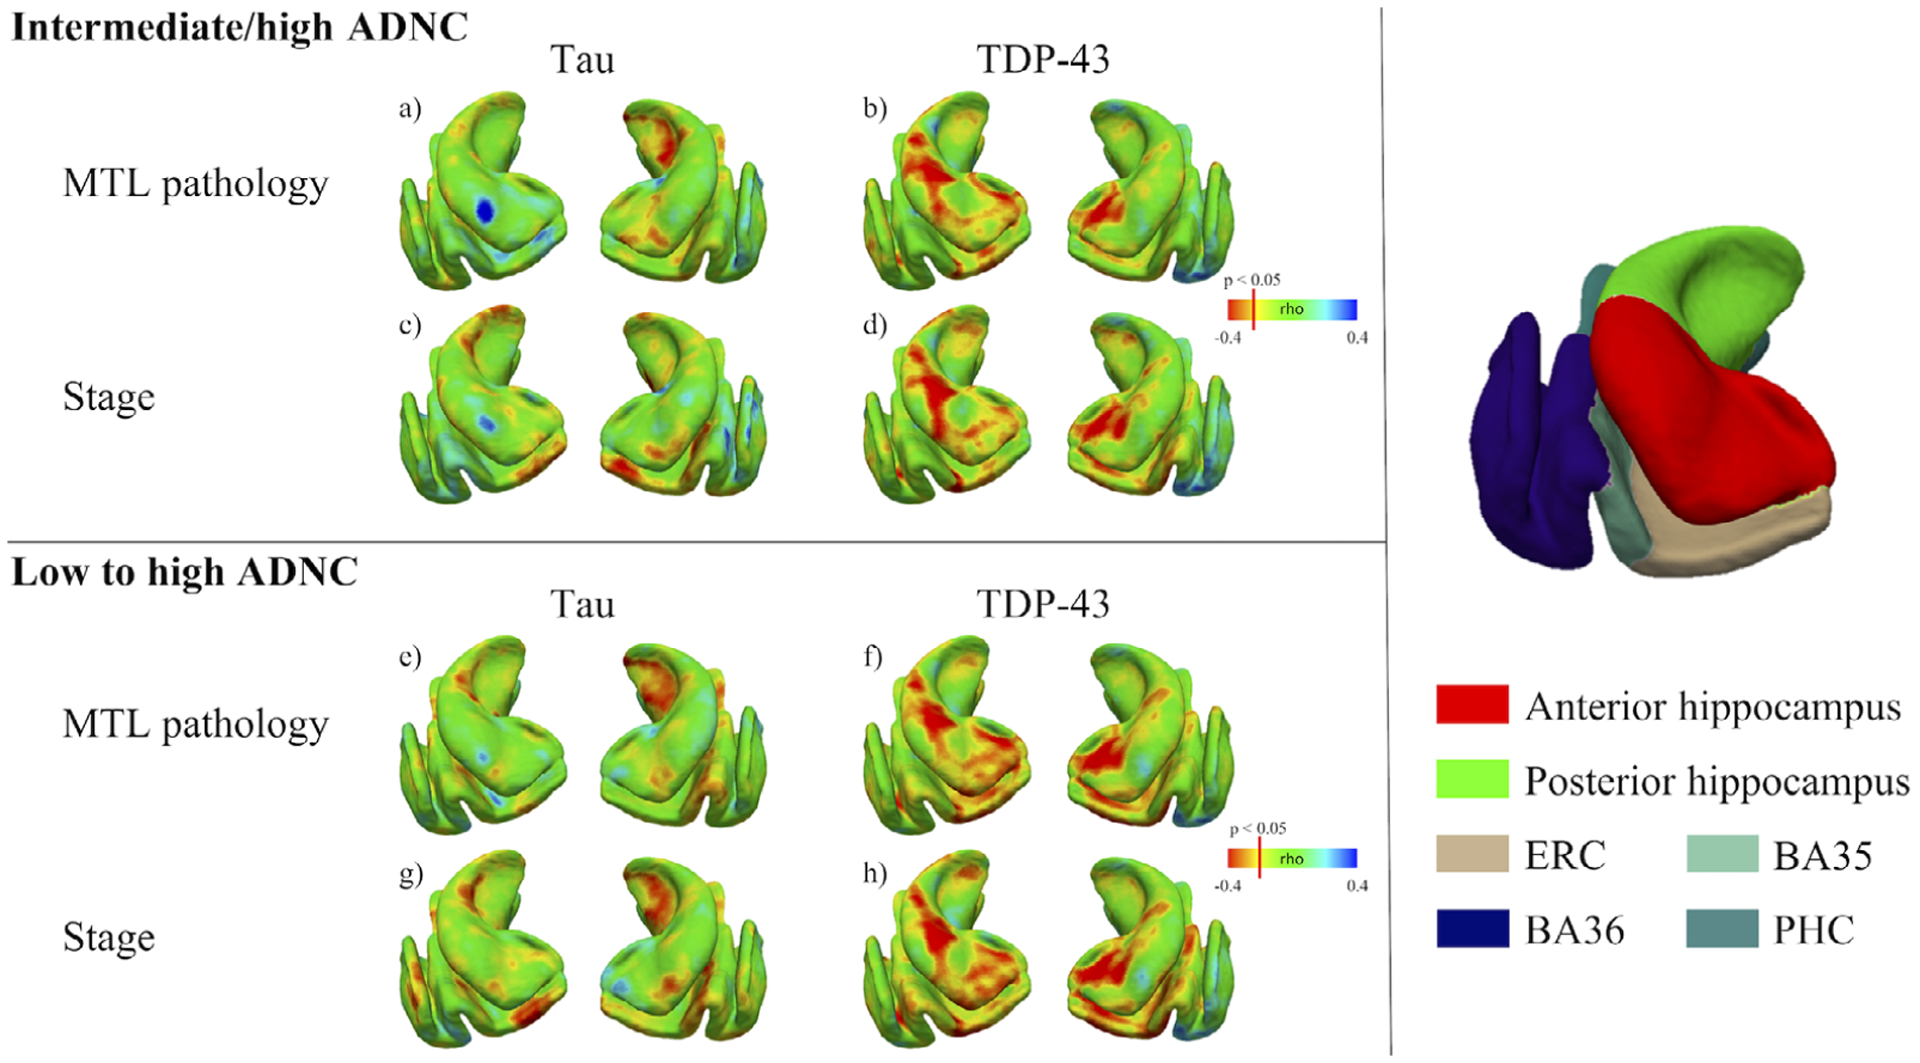
Relationship between post-mortem data and ante-mortem medial temporal lobe measures—Pointwise analyses. For tau and TDP-43 pathologies, Spearman rank correlation models, with time between magnetic resonance imaging (MRI) and autopsy and age as covariates, were employed to evaluate the local association between the MTL structure and (1) the amount of pathology in the medial temporal lobe (MTL) (A, B, E, F) and (2) pathological stages (C, D, G, H). These analyses were performed both in the intermediate to high AD neuropathologic change (ADNC) group (upper panel) as well as in the low to high ADNC group (lower panel). The three-dimensional (3D) representation of the MTL on the right panel can be used for anatomical reference. Note that NFT pathology was negatively associated with posterior hippocampal thickness and, to some extent, ERC and BA35 (A, C, E, G), whereas TDP-43 was correlated specifically with the anterior part of the hippocampus, ERC and, to some extent, BA35 (B, D, F, H). BA, Brodmann area; ERC, entorhinal cortex; PHC, parahippocampal cortex
4 |. DISCUSSION
The aim of the present study was to evaluate the relative contribution of tau, Aβ, transactive response DNA-binding protein 43 (TDP-43), and α-syn to medial temporal lobe (MTL) atrophy in patients along the Alzheimer’s disease (AD) continuum by using antemortem magnetic resonance imaging (MRI) together with measures of pathology. A second aim was to determine if regional differences or pattern of MTL atrophy could distinguish patients with AD pathology who have concomitant MTL TDP-43 pathology versus those without.
4.1 |. Relationship between pathology measures and antemortem medial temporal lobe measures
Overall, our analyses revealed a strong association between TDP-43 and anterior MTL regions (anterior hippocampus (aH) and entorhinal cortex (ERC)), whereas neurofibrillary tangle (NFT) pathology was relatively more associated with the posterior hippocampus. However, no clear relationships with either Aβ or α-syn were found. This dissociation between TDP-43 and NFT was particularly clear when patients with low to high AD pathology were considered, whereas this effect was likely blunted for NFT when only considering intermediate and high Alzheimer’s disease neuropathologic change (ADNC) cases. Moreover, it is important to note that this pattern was found when using either the amount of pathology within the MTL or whole brain pathologic staging approaches. Note that results were similar when controlling for sex, APOE status and atherosclerosis (see Tables S3, S4, and S5, respectively), as well as when performed in patients with possible primary age-related tauopathy (PART) as defined by Crary et al.33 see Table S9).
Although TDP-43 can be related to a variety of phenotypes and topography of pathology in the context of frontotemporal lobar degeneration, and as well as to the recently described limbic-predominant age-related TDP-43 encephalopathy (LATE), the current findings fit broadly with other observations comparing TDP-43 spectrum diseases with AD pathology. For example, Lladó et al.34 compared patients with likely AD based on cerebrospinal fluid (CSF) biomarkers with patients with probable TDP-43 pathology (semantic variant progressive primary aphasia (svPPA), GRN, and C9orf72 mutation carriers) across the long axis of the hippocampus. Compared to probable TDP-43 patients, patients with CSF Aβ/tau profile indicative of AD showed greater atrophy in the right posterior hippocampus, whereas the reverse contrast revealed greater atrophy in the left anterior hippocampus in the probable TDP-43 group. Similarly, other studies have reported particularly significant atrophy in the anterior hippocampus in patients with svPPA.35–37 Alternatively, AD pathology has been reported to result in more uniform atrophy along the long axis of the MTL, including both the anterior and posterior hippocampus,36,37 although some studies have reported a relative preservation of the anterior hippocampus.35 Altogether, it appears that TDP-43 pathology seems to target most specifically the anterior MTL, whereas AD-related pathology has greater relative involvement of posterior MTL structures compared to TDP-43. Recently, Hanko et al.38 evaluated the relationship between hippocampal shape measured with antemortem MRI and TDP-43, Aβ, and tau pathologies in a group of 42 individuals. The authors reported a strong association between NFT and CA1/subiculum, which persisted after accounting for coexisting pathologies, whereas TDP-43 and Aβ were not associated with structure after including covariates. Thus, these results appear somewhat inconsistent with the findings reported in the present study. However, it is important to note that the nature of the studied population is different, as the presence of ADNC was not a criteria for inclusion in the study by Hanko et al.38 As a consequence, more than half of the population was cognitively normal. Moreover, the sample size was smaller than in the present study. Note that Braak and Braak described use of only the anterior region of the hippocampus, which also captures the entorhinal and transentorhinal regions on the same section, for determination of Braak staging.9,39 Alternatively, the current result suggests that NFT pathology may have a more specific effect on posterior hippocampus, suggesting that greater examination along the long axis of the hippocampus in pathological studies may be worth exploring.
4.2 |. Comparisons between TDP-43 negative and TDP-43 positive AD patients
Many studies have shown that TDP-43 is a common comorbid lesion in patients with ADNC. Indeed, autopsy series showed that a large proportion (≈50%) of cases with ADNC also had intracellular accumulation of TDP-43.19–23 In the present study, 22% of the patients with intermediate to high AD neuropathologic change and 25% of the patients with low to high AD neuropathologic change included in this study had evidence of TDP-43 in the MTL (beyond the amygdala). This proportion appears lower than the rate of TDP-43 pathology presented in other studies. However, it is important to note that the positivity in the present study was defined on the basis of inclusions within the hippocampus and ERC, while the percentages of the prior work have included those with amygdala TDP-43, the first stage of deposition as argued by Josephs et al. (2016) and the new LATE criteria.25 The proportion in our population increased from 22% to 48% when stage 1 described by Josephs et al. (2016) was used as the criteria to define positivity. Of note, TDP-43 lesions have also been reported in individuals with PART.40,41 In addition, it has been stated that an important portion (≈15%−20%) of clinically diagnosed AD dementia might be attributable to LATE neuropathologic change.25 It is thus crucial to define biomarkers in order to differentiate ADNC and LATE-NC, as well as to discriminate pure ADNC versus ADNC with concomitant TDP-43 lesions. However, no biofluid or PET biomarker for TDP-43 pathology is available at this time.
Our results demonstrate that, when compared to TDP-43-negative patients, TDP-43-positive patients display a strong reduction of aH and ERC. This is in line with recent observations by Bejanin el al.42 showing a specific atrophy of anterior MTL regions in a whole brain, voxel-wise analysis in individuals with non-frontotemporal lobar degeneration at early TDP-43 stages. In addition, we calculated a ratio to capture the greater anterior versus posterior effect of TDP-43 including either aH or ERC in the numerator and PHC in the denominator. These ratios provided the strongest discrimination between the two groups (AUC of 0.84 and 0.82, respectively), but aH on its own showed good group discrimination (AUC of 0.81). Our analyses seem to indicate that some of these MTL volumetric measures, especially the ratio between aH and PHC, may be a sensitive biomarker to detect the presence of TDP-43 within the MTL, beyond amygdala-only pathology (ie, stage 1 described by Josephs et al. (2016)), at least in the context of ADNC. Of note, additional analyses showed that these MTL measures do not discriminate patients with TDP-43 pathology restricted to the amygdala.
The need for such biomarkers is stressed by several studies, showing that the co-occurrence of ADNC and TDP-43 has an important impact on the degree of cognitive impairment as well as hippocampal atrophy, in comparison to patients showing only ADNC.21,22,40,43–45 For example, using longitudinal antemortem MRI data, Josephs et al. (2017) showed that among individuals with an intermediate likelihood of having AD, those with concomitant hippocampal TDP-43 had faster rates of hippocampal atrophy than did those with amygdala-only TDP-43 or those without TDP-43. Moreover, Josephs et al. (2014b) showed that TDP-positive subjects with intermediate to high ADNC were ten times more likely to be cognitively impaired at death compared to their TDP-negative counterparts. It is thus crucial to be able to discriminate ADNC with and without concomitant TDP-43 lesions, especially in the context of clinical trials. Indeed, TDP-43 pathology, when coexisting with ADNC, might have the potential to obscure the effects of a potential disease-modifying agent on cognitive assessment results in living subjects.25 This is particularly true, as the primary outcome in clinical trials are cognitive and functional measures, highlighting the importance of having a sensitive marker to detect the presence of TDP-43 pathology in trial populations.
4.3 |. Limitations
Our study has some limitations. We used semi-quantitative measures of the amount of NFT, Aβ, TDP-43, and α-syn in the MTL. More quantitative measures, such as the percentage area of tissue occupied by the pathology using digital histology techniques, for example, could help to highlight more subtle associations. Another important limitation is the time between MRI and autopsy, which was on average several years, and this delay could influence the linkage between pathology observed at death and ante-mortem imaging. However, it is important to note that this bias, with a delay of several years between the two measures, is often found in the literature linking pathology to in vivo imaging.10,40,42,43,46 Furthermore, this time lag is more likely to influence null results than significant correlations, as in some cases pathology seen at autopsy may not have been present, or much less so, at the time of the MRI scan. Thus, one may have stronger confidence in the positive findings than null effects. In addition, other comorbidities, such as cerebrovascular disease, for example, are frequently observed in patients with AD pathology.47–49 Although inclusion of a score reflecting atherosclerosis in the statistical model did not change our results, these additional factors might also contribute to MTL atrophy and should be taken into account in future studies. Finally, the sample size is relatively small, limiting the ability to more precisely test the discriminative power of these MTL measures. For instance, we could not split our population in half in order to (‘) calculate a threshold value that discriminated patients with ADNC with and without TDP-43 pathology and (2) test this threshold on a new population. Further studies performed on independent populations are thus needed.
Supplementary Material
RESEARCH IN CONTEXT.
Systematic review: The authors reviewed the literature using PubMed. There has been considerable work on relating postmortem neuropathological measures with antemortem magnetic resonance imaging. These studies have been appropriately cited.
Interpretation: Our analyses showed specific contributions of different pathologies on medial temporal lobe (MTL) substructures, with TDP-43 being strongly associated with anterior MTL regions, whereas tau was relatively more associated with the posterior hippocampus. In addition, the volume of the anterior hippocampus may be a relevant tool to detect concomitant TDP-43 pathology in the MTL of patients with Alzheimer’s disease (AD).
Future directions: Replication studies in independent cohorts are needed to confirm the ability of MTL regions to discriminate AD patients with and without TDP-43 pathology.
ACKNOWLEDGMENTS
We gratefully acknowledge the tissue donors and their families. We also thank the staff at the NDRI brain bank and at CNDR for performing the autopsies and making tissue available for this project.
FUNDING INFORMATION
This work was supported by National Institutes of Health (NIH) grants AG10124, AG056014, EB017255, NS088341, AG058732; Alzheimer’s Association (AARF-19-615258); the BrightFocus Foundation; Penn Institute on Aging; 2018-NI-09; National Alzheimer’s Coordinating Center; Fondation Philippe Chatrier.
Footnotes
DISCLOSURE/CONFLICTS OF INTEREST
David A. Wolk received consultation fees from Eli Lilly, Janssen, and Merck. David A. Wolk receives grant support from Avid Radiopharmaceuticals/Eli Lilly, Biogen, Functional Neuromodulation, and Merck. John Q. Trojanowski has received research support from Eli Lilly. John Q. Trojanowski may accrue revenue in the future on patents submitted by the University of Pennsylvania wherein he is co-inventor, and he received revenue from the sale of Avid to Eli Lilly as co-inventor on imaging-related patents submitted by the University of Pennsylvania. Corey T. McMillan receives research funding from Biogen, Inc, and provides consulting services for Invicro and Axon Advisors on behalf of Translational Bioinformatics, LLC. He also receives an honorarium as Associate Editor of NeuroImage: Clinical. Long Xie received personal consulting fees from Galileo CDS, Inc.
SUPPORTING INFORMATION
Additional supporting information may be found online in the Supporting Information section at the end of the article.
REFERENCES
- 1.Pini L, Pievani M, Bocchetta M, et al. Brain atrophy in Alzheimer’s Disease and aging. Ageing Res Rev. 2016;30:1–24. [DOI] [PubMed] [Google Scholar]
- 2.Jagust W Imaging the evolution and pathophysiology of Alzheimer disease. Nat Rev Neurosci. 2018;19:687–700. [DOI] [PMC free article] [PubMed] [Google Scholar]
- 3.Tondelli M, Wilcock GK, Nichelli P, De Jager CA, Jenkinson M, Zamboni G. Structural MRI changes detectable up to ten years before clinical Alzheimer’s disease. Neurobiol Aging. 2012;33(4): 825.e25–36. [DOI] [PubMed] [Google Scholar]
- 4.Smith CD, Andersen AH, Gold BT. Structural brain alterations before mild cognitive impairment in ADNI: validation of volume. J Alzheimers Dis. 2012;l(Suppl 3):S49–S58. [DOI] [PMC free article] [PubMed] [Google Scholar]
- 5.Whitwell JL, Przybelski SA, Weigand SD, et al. 3D maps from multiple MRI illustrate changing atrophy patterns as subjects progress from mild cognitive impairment to Alzheimer’s disease. Brain. 2007;130:1777–1786. [DOI] [PMC free article] [PubMed] [Google Scholar]
- 6.Wolk DA, Das SR, Mueller SG, Weiner MW, Yushkevich PA. Medial temporal lobe subregional morphometry using high resolution MRI in Alzheimer’s disease. Neurobiol Aging. 2017;49:204–213. [DOI] [PMC free article] [PubMed] [Google Scholar]
- 7.Xie L, Wisse LEM, Pluta J, et al. Automated segmentation of medial temporal lobe subregions on in vivo T1-weighted MRI in early stages of Alzheimer’s disease. Hum Brain Mapp. 2019;40:3431–3451. [DOI] [PMC free article] [PubMed] [Google Scholar]
- 8.Montine TJ, Phelps CH, Beach TG, et al. National Institute on Aging-Alzheimer’s Association guidelines for the neuropathologic assessment of Alzheimer’s disease: a practical approach. Acta Neuropathol. 2012;123:1–11. [DOI] [PMC free article] [PubMed] [Google Scholar]
- 9.Braak H, Alafuzoff I, Arzberger T, Kretzschmar H, Tredici K. Staging of Alzheimer disease-associated neurofibrillary pathology using paraffin sections and immunocytochemistry. Acta Neuropathol. 2006;112:389–404. [DOI] [PMC free article] [PubMed] [Google Scholar]
- 10.Jack CR, Dickson DW, Parisi JE, et al. Antemortem MRI findings correlate with hippocampal neuropathology in typical aging and dementia. Neurology. 2002;58:750–757. [DOI] [PMC free article] [PubMed] [Google Scholar]
- 11.Whitwell JL, Josephs KA, Murray ME, et al. MRI correlates of neurofibrillary tangle pathology at autopsy: a voxel-based morphometry study. Neurology. 2008;71:743–749. [DOI] [PMC free article] [PubMed] [Google Scholar]
- 12.Kaur B, Himali JJ, Seshadri S, et al. Association between neuropathology and brain volume in the Framingham Heart Study. Alzheimer Dis Assoc Disord. 2014;28:219–225. [DOI] [PMC free article] [PubMed] [Google Scholar]
- 13.de Souza LC, Chupin M, Lamari F, et al. CSF tau markers are correlated with hippocampal volume in Alzheimer’s disease. Neurobiol Aging. 2012;33:1253–1257. [DOI] [PubMed] [Google Scholar]
- 14.Tardif CL, Devenyi GA, Amaral RSC, et al. Regionally specific changes in the hippocampal circuitry accompany progression of cerebrospinal fluid biomarkers in preclinical Alzheimer’s disease. Hum Brain Mapp. 2018;39:971–984. [DOI] [PMC free article] [PubMed] [Google Scholar]
- 15.Lindberg O, Mårtensson G, Stomrud E, et al. Atrophy of the posterior subiculum is associated with memory impairment, Tau- and Aβ pathology in non-demented individuals. Front Aging Neurosci. 2017;9: 1–12. [DOI] [PMC free article] [PubMed] [Google Scholar]
- 16.Harrison TM, La Joie R, Maass A, et al. Longitudinal tau accumulation and atrophy in aging and Alzheimer disease. Ann Neurol. 2019;85:229–240. [DOI] [PMC free article] [PubMed] [Google Scholar]
- 17.Das SR, Xie L, Wisse LEM, et al. Longitudinal and cross-sectional structural magnetic resonance imaging correlates of AV-1451 uptake. Neurobiol Aging. 2018;66:49–58. [DOI] [PMC free article] [PubMed] [Google Scholar]
- 18.Xie L, Das SR, Wisse LEM, Ittyerah R, Yushkevich PA, Wolk DA. Early tau burden correlates with higher rate of atrophy in transentorhinal cortex. J Alzheimer’s Dis. 2018;62:85–92. [DOI] [PMC free article] [PubMed] [Google Scholar]
- 19.Robinson JL, Lee EB, Xie SX, et al. Neurodegenerative disease concomitant proteinopathies are prevalent, age-related and APOE4-associated. Brain. 2018;141:2181–2193. [DOI] [PMC free article] [PubMed] [Google Scholar]
- 20.Davidson YS, Raby S, Foulds PG, et al. TDP-43 pathological changes in early onset familial and sporadic Alzheimer’s disease, late onset Alzheimer’s disease and Down’s syndrome: association with age, hippocampal sclerosis and clinical phenotype. Acta Neuropathol. 2011;122:703–713. [DOI] [PubMed] [Google Scholar]
- 21.Josephs KA, Whitwell JL, Knopman DS, et al. Abnormal TDP-43 immunoreactivity in AD modifies clinicopathologic and radiologic phenotype. Neurology. 2008;70:1850–1857. [DOI] [PMC free article] [PubMed] [Google Scholar]
- 22.Josephs KA, Whitwell JL, Weigand SD, et al. TDP-43 is a key player in the clinical features associated with Alzheimer’s disease. Acta Neuropathol. 2014;127:811–824. [DOI] [PMC free article] [PubMed] [Google Scholar]
- 23.Josephs KA, Murray ME, Whitwell JL, et al. Staging TDP-43 pathology in Alzheimer’s disease. Acta Neuropathol. 2014;127:441–450. [DOI] [PMC free article] [PubMed] [Google Scholar]
- 24.Josephs KA, Murray ME, Whitwell JL, et al. Updated TDP-43 in Alzheimer’s disease staging scheme. Acta Neuropathol. 2016;131:571–585. [DOI] [PMC free article] [PubMed] [Google Scholar]
- 25.Nelson PT, Dickson DW, Trojanowski JQ, et al. Limbic-predominant age-related TDP-43 encephalopathy (LATE): consensus working group report. Brain. 2019;142:1503–1527. [DOI] [PMC free article] [PubMed] [Google Scholar]
- 26.Jack CR, Bennett DA, Blennow K, et al. NIA-AA Research Framework: toward a biological definition of Alzheimer’s disease. Alzheimer’s Dement. 2018;14:535–562. [DOI] [PMC free article] [PubMed] [Google Scholar]
- 27.Toledo JB, Van Deerlin VM, Lee EB, et al. A platform for discovery: the University of Pennsylvania Integrated Neurodegenerative Disease Biobank. Alzheimer’s Dement. 2014;10:477–484.e1. [DOI] [PMC free article] [PubMed] [Google Scholar]
- 28.Thal DR, Rüb U, Orantes M, Braak H. Phases of A beta-deposition in the human brain and its relevance for the development of AD. Neurology. 2002;58:1791–1800. [DOI] [PubMed] [Google Scholar]
- 29.Mirra SS, Heyman A, McKeel D, et al. The consortium to establish a registry for Alzheimer’s disease (CERAD). Part II. Standardization of the neuropathologic assessment of Alzheimer’s disease. Neurology. 1991;41:479–486. [DOI] [PubMed] [Google Scholar]
- 30.McKeith IG, Dickson DW, Lowe J, et al. Diagnosis and management of dementia with Lewy bodies: third report of the DLB consortium. Neurology. 2005;65:1863–1872. [DOI] [PubMed] [Google Scholar]
- 31.Yushkevich PA, Pluta JB, Wang H, et al. Automated volumetry and regional thickness analysis of hippocampal subfields and medial temporal cortical structures in mild cognitive impairment. Hum Brain Mapp. 2015;36:258–287. [DOI] [PMC free article] [PubMed] [Google Scholar]
- 32.Xie L, Pluta JB, Das SR, et al. Multi-template analysis of human perirhinal cortex in brain MRI: explicitly accounting for anatomical variability. Neuroimage. 2017;144:183–202. [DOI] [PMC free article] [PubMed] [Google Scholar]
- 33.Crary JF, Trojanowski JQ, Schneider JA, et al. Primary age-related tauopathy (PART): a common pathology associated with human aging. Acta Neuropathol. 2014;128:755–766. [DOI] [PMC free article] [PubMed] [Google Scholar]
- 34.Lladó A, Tort-Merino A, Sánchez-Valle R, et al. The hippocampal longitudinal axis—relevance for underlying tau and TDP-43 pathology. Neurobiol Aging. 2018;70:1–9. [DOI] [PubMed] [Google Scholar]
- 35.Lindberg O, Walterfang M, Looi JCL, et al. Hippocampal shape analysis in Alzheimer’s disease and frontotemporal lobar degeneration subtypes. J Alzheimers Dis. 2012;30:355–365. [DOI] [PMC free article] [PubMed] [Google Scholar]
- 36.Chapleau M, Aldebert J, Montembeault M, Brambati SM. Atrophy in Alzheimer’s disease and semantic dementia: an ALE meta-analysis of voxel-based morphometry studies. J Alzheimer’s Dis. 2016;54:941–955. [DOI] [PubMed] [Google Scholar]
- 37.Chan D, Fox NC, Scahill RI, et al. Patterns of temporal lobe atrophy in semantic dementia and Alzheimer’s disease. Ann Neurol. 2001;49:433–442. [PubMed] [Google Scholar]
- 38.Hanko V, Apple AC, Alpert KI, et al. In vivo hippocampal subfield shape related to TDP-43, amyloid beta, and tau pathologies. Neurobiol Aging. 2019;74:171–181. [DOI] [PMC free article] [PubMed] [Google Scholar]
- 39.Braak H, Braak E. Neuropathological stageing of Alzheimer-related changes. Acta Neuropathol. 1991;82:239–259. [DOI] [PubMed] [Google Scholar]
- 40.Josephs KA, Murray ME, Tosakulwong N, et al. Brain atrophy in primary age-related tauopathy is linked to transactive response DNA-binding protein of 43 kDa. Alzheimer’s Dement. 2019;15:799–806. [DOI] [PMC free article] [PubMed] [Google Scholar]
- 41.Zhang X, Sun B, Wang X, et al. Phosphorylated TDP-43 Staging of primary age-related tauopathy. Neurosci Bull. 2019;35:183–192. [DOI] [PMC free article] [PubMed] [Google Scholar]
- 42.Bejanin A, Murray ME, Martin P, et al. Antemortem volume loss mirrors TDP-43 staging in older adults with non-frontotemporal lobar degeneration. Brain. 2019;142:3621–3635. [DOI] [PMC free article] [PubMed] [Google Scholar]
- 43.Josephs KA, Dickson DW, Tosakulwong N, et al. Rates of hippocampal atrophy and presence of post-mortem TDP-43 in patients with Alzheimer’s disease: a longitudinal retrospective study. Lancet Neurol. 2017;16:917–924. [DOI] [PMC free article] [PubMed] [Google Scholar]
- 44.Nag S, Yu L, Capuano AW, et al. Hippocampal sclerosis and TDP-43 pathology in aging and Alzheimer disease. Ann Neurol. 2015;77:942–952. [DOI] [PMC free article] [PubMed] [Google Scholar]
- 45.Dallaire-Théroux C, Callahan BL, Potvin O, Saikali S, Duchesne S. Radiological-Pathological correlation in Alzheimer’s disease: systematic review of antemortem magnetic resonance imaging findings. J Alzheimers Dis. 2017;57:575–601. [DOI] [PubMed] [Google Scholar]
- 46.Csernansky JG, Hamstra J, Wang L, et al. Correlations between antemortem hippocampal volume and postmortem neuropathology in AD subjects. Alzheimer Dis Assoc Disord. 2004;18:190–195. 00002093-200410000-00006[pii]. [PubMed] [Google Scholar]
- 47.Jagust WJ, Zheng L, Harvey DJ, et al. Neuropathological basis of magnetic resonance images in aging and dementia. Ann Neurol. 2008;63:72–80. [DOI] [PMC free article] [PubMed] [Google Scholar]
- 48.Kovacs GG, Milenkovic I, Wöhrer A, et al. Non-Alzheimer neurodegenerative pathologies and their combinations are more frequent than commonly believed in the elderly brain: a community-based autopsy series. Acta Neuropathol. 2013;126:365–384. [DOI] [PubMed] [Google Scholar]
- 49.Robinson JL, Corrada MM, Kovacs GG, et al. Non-Alzheimer’s contributions to dementia and cognitive resilience in The 90+ Study. Acta Neuropathol. 2018;136:377–388. [DOI] [PMC free article] [PubMed] [Google Scholar]
Associated Data
This section collects any data citations, data availability statements, or supplementary materials included in this article.