

Abstract
Our study aimed to establish and validate a multi-class scoring system for preoperative gastric gastrointestinal stromal tumors (GISTs) risk stratifications based on CT features. 150 gastric GIST patients who underwent contrast-enhanced CT examination and surgical resection from hospital 1 were retrospectively analyzed as the training cohort, and 61 patients from hospitals 2 and 3 were included as the validation cohort. A model was established by logistic regression analysis and weighted to be a scoring model. A calibration test, area under the receiver operating characteristic (ROC) curve (AUC), and cutoff points were determined for the score model. The model was also divided into three score ranges for convenient clinical evaluation. Five CT features were included in the score model, including tumor size (4 points), ill-defined margin (6 points), intratumoral enlarged vessels (5 points), heterogeneous enhancement pattern (4 points), and exophytic or mixed growth pattern (2 points). Then, based on the calibration results, performance was merely assessed as very low and high* risk. The AUCs of the score model for very low risk and high* risk were 0.973 and 0.977, and the cutoff points were 3 points (97.30%, 93.81%) and 7 points (92.19%, 94.19%), respectively. In the validation cohort, the AUCs were 0.912 and 0.972, and the cutoff values were 3 points (92.31%, 85.42%) and 5 points (100%, 87.88%), respectively. The model was stratified into 3 ranges: 0-3 points for very low risk, 4-8 points for low risk, and 9-21 points for high* risk. A concise and practical score system for gastric GISTs risk stratification was proposed.
Keywords: Gastrointestinal stromal tumors, computed tomography, risk classification, preoperative, scoring system
Introduction
Gastrointestinal stromal tumors (GISTs) are the most common mesenchymal tumors of the digestive system [1,2]. GISTs account for 1-3% of gastrointestinal tumors, and can occur in any location in the gastrointestinal tract, including the stomach (50-60%) and the small intestines (20-30%) [2]. The biological behavior of GISTs is complex and demonstrates varying malignant potential, including metastasis [3]. Given its malignant potential, the main factors affecting the quality of life and survival rate of patients with GISTs are recurrence rate and metastasis [4-6]. Therefore, it is necessary to evaluate the risk associated with the tumor and provide the necessary and effective follow-up treatment to reduce the recurrence and metastasis rates.
Current tumor recurrence risk assessment classifications, such as the National Institutes of Health (NIH) consensus criteria, the modified NIH consensus criteria, and the Chinese Expert Consensus on the Diagnosis and Treatment of Gastrointestinal Stromal Tumor Pathology Interpretation (2017 edition) are based on postoperative pathological results [7-9]. According to tumor size, tumor location, the mitosis index, and whether the tumor ruptures, the recurrence risks are divided into very low risk, low risk, intermediate risk, and high risk. Different risk categories are treated by using different therapeutic strategies, as reported in previous clinical guidelines, in which very low risk was suggested to have little recurrence risk and the intermediate, high-risk grades required postoperative adjuvant therapy [10,11]. Thus, preoperative risk evaluation systems have been proposed for evaluating the adequacy of surgical resection and the need for adjuvant treatment for effective reduction of the recurrence and metastasis rates.
As a preoperative diagnostic method for GISTs, endoscopic ultrasonography (EUS)-guided fine-needle aspiration (EUS-FNA) can clearly show the location and size of the tumor and confirm the pathological diagnosis [12]. EUS can also evaluate the necessity of surgery based on whether the tumor is involved in unclear tumor margins, necrosis, ulceration, and other adverse factors [13]. However, extraluminal growth as the main growth mode of GISTs, limits the role of EUS-FNA in the evaluation of these tumors that grow outside the cavity. The diagnostic rate of EUS-FNA biopsy samples tends to decrease diminution of the tumor diameter, and a small volume sample may cause difficulties in mitotic index assessment [14]. Furthermore, biopsy may cause the tumor to rupture or bleed, and may increase the risk of spread; it is therefore not generally recommended for patients with tumors that can be completely resected. Thus, it is clinically important and necessary to explore a noninvasive, reliable, and practical assessment system for preoperatively predicting the malignant potential in GIST patients.
Computed tomography (CT) is widely used as the main imaging method for the diagnosis, characterization, and evaluation of the curative effect in GISTs, due to its advantages of non-invasiveness and convenience moreover, it has been suggested that CT features may be more useful than EUS features for predicting the tumor mitotic index [15-18]. CT may offer clues about the aggressiveness of these lesions by demonstrating organ or peritoneal metastases, and allow assessment of tumor size, and the degree of its damage to the gastrointestinal tract and the surrounding organs [19,20], which may be helpful for preliminarily judgement of the malignancy of GISTs [21]. Furthermore, enhanced CT scanning features, such as the tumor angiogenesis and enhancement pattern, can also provide important information during malignancy assessment. Therefore, contrast-enhanced CT scanning is potentially an effective method of examination that could provide a clinical basis for early diagnosis and treatment of GISTs. In a previous study, evaluation of GISTs based on CT signs was mostly related to distinguishing low-risk and high-risk classifications, or did not use weighted scores [22,23]. The single-identification of very low-risk tumors that rarely metastasize and recur is limited.
In this study, we aimed to establish a multi-class risk stratification system based on preoperative CT signs to estimate the malignancy of gastric GISTs and to assess the necessity of surgical treatment and preoperative and postoperative adjuvant therapy. Furthermore, we assigned weighted scores to the obtained evaluation models to ensure a more concise clinical evaluation.
Materials and methods
Patients
Our study population was obtained from three independent hospitals. Overall, 211 patients with gastric GISTs were enrolled in this retrospective study. A total of 150 gastric GIST patients from the Second Affiliate Hospital of Zhejiang University Medical School (hospital 1), diagnosed between January 2010 and December 2019, were assigned as the training cohort to determine the CT features representing independent risk for establishing the scoring model. The validation cohort consisted of 61 gastric GIST patients from the Second Affiliated Hospital of Zhejiang Chinese Medical University (hospital 2) and Hubei University of Medicine affiliated Renmin Hospital (hospital 3), diagnosed between January 2015 and December 2019, to verify the performance of the scoring system. The inclusion criteria were as follows: (a) GISTs confirmed by postoperative histopathological diagnosis, including morphological and immunohistochemical assessments of specimens; (b) gastric GISTs without rupture; (c) availability of abdominal contrast-enhanced CT, performed before surgery, and detailed clinicopathological data; (d) availability of CT images containing non-enhancing phase, portal venous phase, and equilibrium phase. The exclusion criteria were as follows: (a) absence of confirmed pathological result; (b) incomplete CT images or no detailed clinical data available; (c) tumor size too small for analysis (< 0.5 cm); (d) multiple GISTs or gastric cancer detected; (e) had treatment with adjuvants or neoadjuvants prior to imaging (Scheme S1).
Post-operative pathological analysis and risk stratification
All patients were treated with surgical resection and had pathologically confirmed GISTs. The cases were divided into four groups according to the NIH consensus criteria, the modified NIH criteria (2018), and the Chinese Expert Consensus on the Diagnosis and Treatment of Gastrointestinal Stromal Tumor Pathology Interpretation (2017 edition). These were the high risk (n = 35), intermediate risk (n = 29), low risk (n = 49), and very low risk (n = 37) groups. For the convenience of statistical analysis and given the similarities in postoperative treatment, the 29 intermediate-risk cases were merged with the high-risk group, which was then termed the high* risk group (n = 64).
CT imaging acquisition
Abdominal contrast-enhanced CT examinations in hospital 1 were performed using multidetector-row CT (SOMATOM Definition Flash; Siemens Healthcare, Erlangen, Germany). Contrast-enhanced CT in hospital 2 was performed on two CT scanners: a Lightspeed VCT (GE Healthcare, Chicago, IL) and an Optima 540 (GE Healthcare). Contrast-enhanced examinations in hospital 3 were performed on a Brilliance IC (Philips, Best, the Netherlands). Patients were instructed to fast for at least 6 hours before CT examination, and 10 minutes before scanning, patients were administered 10 mg of anisodamine intramuscularly to reduce peristalsis of the gastrointestinal tract and then immediately drank 800-1000 mL water to expand the stomach fully. Patients were imaged in a supine position, and the scan range was from the diaphragmatic dome to the pubic symphysis. The CT parameters were as follows throughout: detector configuration 128 × 0.6 mm, tube voltage 120 kVp, tube current 200 mAs, slice thickness 5 mm, slice interval 5 mm, pitch 0.6 mm. The contrast agents in the three hospitals were Ultravist (Bayer Schering Pharma, Berlin, Germany), Optiray (Liebel-Flarsheim Canada Inc., Kirkland, Quebec., Canada), and Iohexol (Beijing North Road Pharmaceutical Co. Ltd., Beijing, China). A total of 100 m of iodinated contrast agent was administered with a pump injector at 5 mL/ss into an antecubital vein. The portal venous phase and the equilibrium phase were performed at 50-60 s and 100-110 s after injection of the contrast medium, respectively.
Image interpretation
The training and validation cohorts were analyzed by two board-certified abdominal radiologists (with 13 and 31 years of experience in abdominal radiology, respectively), who were blinded to the histopathological results, and who interpreted all CT images independently and retrospectively. The CT features included tumor size, location (cardia, fundus, body, and antrum), growth pattern (endophytic, exophytic, and mixed), tumor shape (regular or irregular), margin (well-defined or ill-defined), contour (round or lobulated), calcification (absent or present), surface ulceration (absent or present), necrosis (absent or present), adjacent organ invasion (absent or present), intratumoral enlarged vessels (absent or present), peritumoral enlarged vessels (absent or present), lymphadenopathy (absent or present), metastasis (absent or present), and enhancement pattern (homogeneous or heterogeneous). Attenuation values in the non-enhanced phase, portal venous phase, and equilibrium phase, and the degree of enhancement (post-enhancement CT value minus pre-enhancement CT value for the greater of either the portal venous phase or the equilibrium phase) were measured in the largest dimension of the tumor. Difference value of 1 (the portal venous phase values minus the non-enhanced phase values), difference value 2 (the equilibrium phase CT values minus the non-enhanced phase values), and difference value 3 (the equilibrium phase CT values minus the portal venous phase values) were calculated. Enhancement features and enlarged vessels were evaluated in the equilibrium phase. Necrosis was considered present when non-enhancing or hypo-attenuating foci with a CT attenuation value of 0-20 Hounsfield Units (HU) were observed within the tumor. Surface ulcerations were considered present as focal tissue defects on the endoluminal surface of the lesion.
Enhancement patterns were defined as follows: homogeneous enhancement indicated that the difference between the most strongly and weakly enhanced portion of the lesions was less than 10 HU, or indicated heterogeneous enhancement. The degree of enhancement was quantitatively judged by the difference between the post-enhancement CT attenuation value and the non-enhanced CT attenuation value. If the difference was < 20 HU, the tumor was considered to exhibit a low-mild enhancement pattern; 20-40 HU was considered to represent a moderate enhancement pattern, and > 40 HU was judged to be a strong enhancement pattern. CT attenuation values of the parenchyma in all lesions were measured in HU using a 20 mm2 circular region-of-interest (ROI). The ROI cursors were placed so as to encompass as much of the most strongly enhanced portion of the tumor as possible and to avoid calcification, hemorrhage, necrosis, cystic degeneration, and vascular travel area in tumor and adjacent structures. The quantitative analysis was tested three times for each feature and the averaged values were used. In cases of initial disagreement, the two radiologists discussed findings to consensus. The three-dimensional (3D) tumor segmentations were performed by the two experienced abdominal radiologists with 3D Slicer (version 4.10.2). The 3D tumor segmentations on CT images were established after sketching the region of interest (ROI) layer by layer, and related morphological characteristics including tumor volume (TV) and stomach volume (SV) were obtained.
Statistical analysis
Data distributions were measured using the Kolmogorov-Smirnov test or the Shapiro-Wilk test. Continuous data with normal distribution are shown as mean ± standard deviation and data with a non-normal distribution are shown as median (interquartile range). Categorical data are expressed as frequencies (percentages). In univariate analysis, categorical variables were compared using the chi-square test or Fisher’s exact test, and continuous data were compared using one-way analysis of variance (ANOVA), Welch’s ANOVA test, or the Kruskal-Wallis test. Data were analyzed using one-way ANOVA followed by least significant difference (LSD) multiple comparisons (equal variances) or Welch’s ANOVA test followed by Dunnett’s T3 test (unequal variances). Subsequently, variables considered to be significantly different in univariate analysis were obtained on ridge regression analysis to minimize multicollinearity, and then multinomial and ordinal logistic regression was used for multivariate analysis to identify independent predictors of GIST risk. The regression coefficients were evaluated by a simple weighting algorithm that divided each regression coefficient by one-half of the smallest coefficient and rounding to the nearest integer, or taking the integer part to obtain the optimal score [24,25].
We considered the ordered multi-classification model as three binary classification models when evaluating its performance. Calibration was assessed using the Hosmer-Lemeshow goodness-of-fit test, and P > 0.05 indicated insignificant deviance from the theoretical perfect calibration in the training and validation sets. The receiver operating characteristic (ROC) curves were used to evaluate the model performance, and the discriminatory ability of the model was evaluated through the area under the ROC curve (AUC). The AUC values of different models were compared with Delong nonparametric method (DeLong and others 1988). An optimal cutoff value, with the largest Youden index, and the associated specificity and sensitivity were calculated for all models. Precision (the true positive events proportion in all the predicted positive events) and recall (presenting and the true positive events proportion in all the actual positive events) of the risk-grades relevant score ranges were calculated. F1 scores presenting the balanced point of precision and recall were assessed, and the higher F1 scores indicated the model a better predictivity [26].
All statistical analyses were performed using SPSS software (version 25.0, IBM Inc., Armonk, NY, USA), with a two-sided p value < 0.05 considered statistically significant. The comparison of AUCs was performed using MedCalc statistical software (version 19.0.4, MedCalc Software Bvba, Ostend, Belgium).
Results
Clinical characteristics and CT values
A total of 150 gastric GIST patients, comprising 37 with very low risk, 49 with low risk, and 64 with high* risk, were enrolled as the training cohort. The clinical and demographic characteristics of the three risk categories in the training cohort were summarized and compared in Table 1. There were no significant differences among the three grades with regard to age and gender. There were also no significant differences in the non-enhanced phase CT values and difference values among the groups. Tumor size, CT values of portal venous phase and equilibrium phase, difference value 1, and difference value 2 differed significantly among the three risk grades, according to univariate analysis (P < 0.05). Furthermore, multiple tests were performed between paired groups.
Table 1.
Clinical characteristics and CT values three risk categories in the training cohort
| characteristics | n | Risk category | P | ||
|---|---|---|---|---|---|
|
| |||||
| very low risk (n = 37) | low risk (n = 49) | high* risk (n = 64) | |||
| Age | 150 | 57 (14) | 61 (17) | 60 (16) | 0.693 |
| Gender | 0.329 | ||||
| Male | 75 | 17 (22.67) | 24 (32.00) | 34 (45.33) | |
| Female | 75 | 20 (26.67) | 25 (33.33) | 30 (40.00) | |
| Tumor size | 150 | 1.39 ± 0.355a | 3.34 ± 0.937b | 8.25 ± 4.893b,c | < 0.001 |
| Non-enhanced phase | 150 | 33.29 (12.56)a,b | 34.20 (4.57)a,b | 34.33 (5.53)a | 0.016 |
| Portal venous phase | 150 | 51.90 (15.16) | 57.79 (22.82) | 54.55 (11.34) | 0.058 |
| Equilibrium phase | 150 | 61.48 (16.67)a,b | 66.89 (28.47)a | 62.58 (9.93)a,b | 0.016 |
| Difference value 1 | 150 | 13.83 (11.60)a | 21.71 (22.08)b | 19.10 (13.57)a,b | 0.010 |
| Difference value 2 | 150 | 23.89 (19.84)a | 33.80 (27.21)b | 27.63 (11.00)a,b | 0.018 |
| Difference value 3 | 150 | 9.07 (12.54) | 10.07 (14.72) | 8.55 (10.50) | 0.544 |
a, b, c: the same letter markers indicated no statistical differences.
Sixty-one of gastric GIST patients were studied as the validation cohort, which contained 13 very low risk, 20 low risk, and 28 high* risk patients. The tumor size showed significant differences among the three groups, and between each pair of groups. However, differences were not statistically significant for age, gender and all CT values among the very low-risk, low-risk, and high* risk groups according to univariate analysis (P > 0.05). Table 2 present the clinical characteristics and CT values of the three-class classification.
Table 2.
Clinical characteristics and CT values of three risk categories in the validation cohort
| characteristics | n | Risk category | P | ||
|---|---|---|---|---|---|
|
| |||||
| very low risk (n = 13) | low risk (n = 20) | high* risk (n = 28) | |||
| Age | 61 | 57 (5) | 66 (14) | 64 (10) | 0.321 |
| Gender | |||||
| Male | 29 | 5 (38.46) | 10 (50.00) | 14 (50.00) | 0.799 |
| Female | 32 | 8 (61.54) | 10 (50.00) | 14 (50.00) | |
| Tumor size | 61 | 1.57 ± 0.335a | 2.91 ± 0.920b | 7.78 ± 4.87c | < 0.001 |
| non-enhanced phase | 61 | 36.79 (3.64) | 37.92 (9.15) | 34.30 (10.53) | 0.109 |
| Portal venous phase | 61 | 58.25 (13.61) | 53.48 (15.37) | 48.99 (14.47) | 0.177 |
| Equilibrium phase | 61 | 67.75 (7.52) | 74.44 (19.52) | 66.36 (15.62) | 0.284 |
| Difference value 1 | 61 | 15.67 (12.60) | 15.33 (9.22) | 14.90 (9.30) | 0.720 |
| Difference value 2 | 61 | 29.81 (13.02) | 34.18 (10.18) | 32.23 (14.41) | 0.686 |
| Difference value 3 | 61 | 14.82 (6.90) | 19.21 (9.15) | 15.70 (10.44) | 0.287 |
a, b, c: the same letter markers indicated no statistical differences.
CT features comparison among three risk categories
Univariate analysis of the CT features was used to determine the most relevant predictors of recurrence risk potential using the chi-square test or Fisher’s exact test in the training set. As shown in Table 3, 11 CT signs showed statistically significant differences among the three risk grades, including location, growth pattern, tumor shape, ulceration, margin, contour, adjacent organ invasion, necrosis, intratumoral enlarged vessels, peritumoral enlarged vessels, and enhancement pattern (P < 0.05). To identify the relevant predictors in the validation cohort, the same analysis methods were used as the training cohort. Apart from the growth pattern, all relevant predictors in the training set retained statistical differences in the validation set (Table 4).
Table 3.
The univariate analysis of CT features among three risk categories in the training cohort
| characteristics | n | Risk category | P | ||
|---|---|---|---|---|---|
|
| |||||
| very low risk (n = 37) | low risk (n = 49) | high* risk (n = 64) | |||
| Location | 0.047 | ||||
| Cardia | 8 (5.33) | 1 (12.50) | 2 (25.00) | 5 (62.50) | |
| Fundus | 62 (41.33) | 22 (35.48) | 16 (25.81) | 24 (38.71) | |
| Body | 62 (41.33) | 9 (14.52) | 22 (35.48) | 31 (50.00) | |
| Antrum | 18 (12.00) | 5 (27.78) | 9 (50.00) | 4 (22.22) | |
| Growth pattern | < 0.001 | ||||
| Endophytic | 61 (40.67) | 25 (40.98)a | 21 (34.43)a,b | 15 (24.59)b | |
| Exophytic | 60 (40.00) | 7 (11.67)a | 16 (26.67)a | 37 (61.67)b | |
| Mixed | 29 (19.33) | 5 (17.24)a | 12 (41.38)a | 12 (41.38)a | |
| Tumor shape | < 0.001 | ||||
| Regular | 114 (76.00) | 36 (31.58)a | 45 (39.47)a | 33 (28.95)b | |
| Irregular | 36 (24.00) | 1 (2.78) | 4 (11.11) | 31 (86.11) | |
| Surface ulceration | < 0.001 | ||||
| Absent | 115 (76.67) | 36 (31.30)a | 39 (33.91)b | 40 (34.78)b | |
| Present | 35 (23.33) | 1 (2.86) | 10 (28.57) | 24 (68.57) | |
| Margin | < 0.001 | ||||
| well-defined | 112 (74.67) | 37 (33.04)a | 47 (41.96)a | 28 (25.00)b | |
| Ill-defined | 38 (25.33) | 0 (0.00) | 2 (5.26) | 36 (94.74) | |
| Contour | < 0.001 | ||||
| Round | 116 (77.33) | 36 (31.03)a | 44 (37.93)a | 36 (31.03)b | |
| Lobulated | 34 (22.67) | 1 (2.94) | 5 (14.71) | 28 (82.35) | |
| Calcification | 0.067 | ||||
| Absent | 131 (87.33) | 32 (24.43) | 47 (35.88) | 52 (39.69) | |
| Present | 19 (12.67) | 5 (26.32) | 2 (10.53) | 12 (63.16) | |
| Adjacent organs invasion | < 0.001 | ||||
| Absent | 40 (26.67) | 1 (2.50)a | 5 (12.50)b | 34 (85.00)b | |
| Present | 110 (73.33) | 36 (32.73) | 44 (40.00) | 30 (27.27) | |
| Necrosis | < 0.001 | ||||
| Absent | 88 (58.67) | 36 (40.91)a | 35 (39.77)b | 17 (19.32)c | |
| Present | 62 (41.33) | 1 (1.61) | 14 (22.58) | 47 (75.81) | |
| Intratumoral enlarged vessels | 0.001 | ||||
| Absent | 123 (82.00) | 37 (30.08)a | 45 (36.59)b | 41 (33.33)b | |
| Present | 27 (18.00) | 0 (0.00) | 4 (14.81) | 23 (85.19) | |
| Peritumoral enlarged vessels | < 0.001 | ||||
| Absent | 99 (66.00) | 37 (37.37)a | 34 (34.34)b | 28 (28.28)c | |
| Present | 51 (34.00) | 0 (0.00) | 15 (29.41) | 36 (70.59) | |
| Metastasis | 0.507 | ||||
| Absent | 148 (98.67) | 37 (25.00) | 49 (33.11) | 62 (41.89) | |
| Present | 2 (1.33) | 0 (0.00) | 0 (0.00) | 2 (100.00) | |
| Lymphadenopathy | 0.088 | ||||
| Absent | 145 (96.67) | 37 (25.52) | 48 (33.10) | 60 (41.38) | |
| Present | 5 (3.33) | 0 (0.00) | 1 (20.00) | 4 (80.00) | |
| Enhancement pattern | < 0.001 | ||||
| Homogeneous | 73 (48.67) | 36 (49.32)a | 24 (32.88)b | 13 (17.80)c | |
| Heterogeneous | 77 (51.33) | 1 (1.30) | 25 (32.47) | 51 (66.23) | |
| Enhancement degree | 0.103 | ||||
| Low-mild | 33 (22.00) | 11 (33.33) | 8 (24.24) | 14 (42.42) | |
| Moderate | 70 (46.67) | 16 (22.86) | 19 (27.14) | 35 (50.00) | |
| Strong | 47 (31.33) | 10 (21.28) | 22 (46.81) | 15 (31.91) | |
a, b, c: the same letter markers indicated no statistical differences.
Table 4.
The univariate analysis of CT features among three risk categories in the validation cohort
| characteristics | n | Risk category | P | ||
|---|---|---|---|---|---|
|
| |||||
| very low risk (n = 13) | low risk (n = 20) | High* risk (n = 28) | |||
| Location | 0.012 | ||||
| Cardia | 3 (4.92) | 2 (66.67)a | 0 (0.00)a | 1 (33.33)a | |
| Fundus | 34 (55.74) | 10 (29.41)a | 13 (38.24)a | 11 (32.35)a | |
| Body | 21 (34.43) | 1 (4.76)a | 5 (23.81)a,b | 15 (71.43)b | |
| Antrum | 3 (4.92) | 0 (0.00)a | 2 (66.67)a | 1 (33.33)a | |
| Growth pattern | 0.123 | ||||
| Endophytic | 27 (44.26) | 7 (25.93) | 10 (37.04) | 10 (37.04) | |
| Exophytic | 13 (21.31) | 4 (30.77) | 1 (7.69) | 8 (61.54) | |
| Mixed | 21 (34.43) | 2 (9.52) | 9 (42.86) | 10 (47.62) | |
| Tumor shape | < 0.001 | ||||
| Regular | 43 (70.49) | 13 (30.23)a | 17 (39.53)a | 13 (30.23)b | |
| Irregular | 18 (29.51) | 0 (0.00) | 3 (16.67) | 15 (83.33) | |
| Surface ulceration | 0.092 | ||||
| Absent | 52 (85.25) | 13 (25.00) | 18 (34.62) | 21 (40.38) | |
| Present | 9 (14.75) | 0 (0.00) | 2 (22.22) | 7 (77.78) | |
| Margin | < 0.001 | ||||
| well-defined | 44 (72.13) | 13 (29.55)a | 19 (43.18)a | 12 (27.27)b | |
| Ill-defined | 17 (27.87) | 0 (0.00) | 1 (5.88) | 16 (94.12) | |
| Contour | 0.001 | ||||
| Round | 42 (68.85) | 13 (30.95)a | 16 (38.10)a,b | 13 (30.95)b | |
| Lobulated | 19 (31.15) | 0 (0.00) | 4 (21.05) | 15 (78.95) | |
| Calcification | 0.922 | ||||
| Absent | 49 (80.33) | 11 (22.45) | 16 (32.65) | 22 (44.90) | |
| Present | 12 (19.67) | 2 (16.67) | 4 (33.33) | 6 (50.00) | |
| Adjacent organs invasion | 0.006 | ||||
| Absent | 48 (78.69) | 13 (27.08)a | 18 (37.50)a,b | 17 (35.42)a | |
| Present | 13 (21.31) | 0 (0.00) | 2 (15.38) | 11 (84.62) | |
| Necrosis | 0.001 | ||||
| Absent | 36 (59.02) | 12 (33.33)a | 14 (38.89)a,b | 10 (27.78)b | |
| Present | 25 (40.98) | 1 (4.00) | 6 (24.00) | 18 (72.00) | |
| Intratumoral enlarged vessels | 0.001 | ||||
| Absent | 49 (80.33) | 13 (26.53)a | 19 (38.78)a | 17 (34.69)b | |
| Present | 12 (19.67) | 0 (0.00) | 1 (8.33) | 11 (91.67) | |
| Peritumoral enlarged vessels | 0.003 | ||||
| Absent | 47 (77.05) | 13 (27.66)a | 18 (38.30)a | 16 (34.04)b | |
| Present | 14 (22.95) | 0 (0.00) | 2 (14.29) | 12 (85.71) | |
| Metastasis | 0.257 | ||||
| Absent | 56 (91.80) | 13 (23.21) | 20 (35.71) | 23 (41.07) | |
| Present | 5 (8.20) | 0 (0.00) | 0 (0.00) | 5 (100.00) | |
| Lymphadenopathy | 0.694 | ||||
| Absent | 59 (96.72) | 13 (22.03) | 20 (33.90) | 26 (44.07) | |
| Present | 2 (3.28) | 0 (0.00) | 0 (0.00) | 2 (100.00) | |
| Enhancement pattern | < 0.001 | ||||
| Homogeneous | 33 (54.10) | 12 (36.36)a | 13 (39.39)a | 8 (24.24)b | |
| Heterogeneous | 28 (45.90) | 1 (3.57) | 7 (25.00) | 20 (71.43) | |
| Enhancement degree | 0.073 | ||||
| Low-mild | 5 (8.20) | 0 (0.00) | 1 (20.00) | 4 (80.00) | |
| Moderate | 27 (44.26) | 7 (25.93) | 5 (18.52) | 15 (55.56) | |
| Strong | 29 (47.54) | 6 (20.69) | 14 (48.28) | 9 (31.03) | |
a, b: the same letter markers indicated no statistical differences.
Establishment of a predictive model
Variables considered statistically different in the univariate analysis were tested in mono-factor regression analysis. The significant CT features were included in the ridge regression analysis to minimize multicollinearity in multivariate analysis. As presented in the ridge trace curve (Figure S1), when the K value was 0.20, the ridge trace presented with the standardized coefficients of variables was stable, and the model was significant (P < 0.001). At this point, six CT features showed positive correlation with GIST risk classifications, including tumor size (P < 0.001), growth pattern (P = 0.048), ambiguous margin (P < 0.001), the presence of necrosis (P = 0.036), intratumoral enlarged vessels (P = 0.001), and enhancement pattern (P = 0.002) (Table S1).
For further verification, multivariate logistic regression was performed to select independent predictors of GIST risk classifications (Table 5). We found that tumor size (P < 0.001), exophytic or mixed growth pattern (P = 0.015; P = 0.033, respectively), ill-defined margin (P = 0.002), presence of intratumoral enlarged vessels (P = 0.007), and heterogeneous enhancement pattern (P = 0.007) remained significant independent risk factors. However, the presence of necrosis (P = 0.12) was not an independent risk factor. The statistically significant predictors remained significant in the final risk predictive model.
Table 5.
The results of ordinal logistic regression and weighted scores
| B | P | OR | 95% C.I. for OR | Weighted score | ||
|---|---|---|---|---|---|---|
|
| ||||||
| Lower | Upper | |||||
| Tumor size | 2.026 | < 0.001 | 7.58 | 4.09 | 14.06 | 4 |
| Margin (Ill-defined) | 3.405 | 0.002 | 30.11 | 3.66 | 247.89 | 6 |
| Necrosis (Presence) | 1.221 | 0.12 | 3.39 | 0.73 | 15.80 | |
| Intratumoral enlarged vessels (Presence) | 2.826 | 0.007 | 16.88 | 2.18 | 130.71 | 5 |
| Enhancement pattern (Heterogeneous) | 2.377 | 0.007 | 10.77 | 1.92 | 60.46 | 4 |
| Growth pattern (Mixed) | 1.093 | 0.033 | 2.98 | 1.09 | 8.17 | 2 |
| Growth pattern (Exophytic) | 1.188 | 0.015 | 3.28 | 1.26 | 8.52 | 2 |
| Constant 1 | 0.76 | 0.023 | 2.14 | |||
| Constant 2 | 4.881 | < 0.001 | 131.76 | |||
Parallel line test: P = 0.078.
Establishment of score model
To provide a quantitative tool for predicting risk classification, a score predictive model based on multivariate analysis in the training cohort was proposed. Weighted scores were assigned to independent predictors associated with GISTs, as follows: tumor size: < 2.76 (M - SD), 0 points; ≥ 2.76 and ≤ 4.95 (M), 1 point; > 4.95 and ≤ 7.12 (M + SD), 2 points; > 7.13 and ≤ 9.32 (M + 2SD), 3 points; and > 9.32, 4 points; ambiguous tumor margin: 6 points; the presence of intratumoral enlarged vessels: 5 points; heterogeneous enhancement pattern: 4 points; exophytic growth pattern: 2 points; mixed growth pattern: 2 points (Table 5). A score predictive model with a total of 21 points was produced, in which the individual scores corresponding to all the independent predictors were summed for each patient.
Predictive performance of models in the training cohort
For the convenience of evaluation, the ordered multi-classification model/score model was considered as three binary classification models, which were labeled the very low-risk model/score model, low-risk model/score model, and high* risk model/score model. Calibration was assessed using the Hosmer-Lemeshow goodness-of-fit test in these logistic models. In both the predictive model and the score model for the low-risk grade, the results of the Hosmer-Lemeshow test showed a significant deviance between the prediction and the theoretical perfect calibration (P < 0.05). On the other hand, the Hosmer-Lemeshow calibration curves indicated good calibration in the very low-risk and high* risk models (P > 0.05) (Figure S2).
Given the calibration results, the prediction performances were evaluated only for the very low-risk models and high* risk models by means of ROC curves (Table S2; Figure 1A, 1B). Comparison of the AUCs verified by the DeLong test showed no statistically significant difference between the two models at very low-risk and high* risk (P = 0.254 and P = 0.950, respectively), which revealed that the score model made full use of the information of the predictive model and provided a concise very-low and high* risk classification model for GISTs. For the very low-risk grade, the AUC of the score model was 0.973 (95% CI, 0.932-0.992; P < 0.001), similar to the predictive model (AUC, 0.986; 95% CI, 0.952-0.998; P < 0.001), indicating highly effective distinction of very low-risk GISTs. For the high* risk grade, the AUC of the score model was 0.977 (95% CI, 0.938-0.994; P < 0.001), similar to that of the predictive model (AUC, 0.976; 95% CI, 0.937-0.994; P < 0.001), which also suggested high efficacy of distinguishing high* risk GISTs. The cutoff points with the related sensitivity and specificity of very low and high* risk in the training cohort were 3 points (97.30%, 93.81%) and 7 points (92.19%, 94.19%), respectively.
Figure 1.
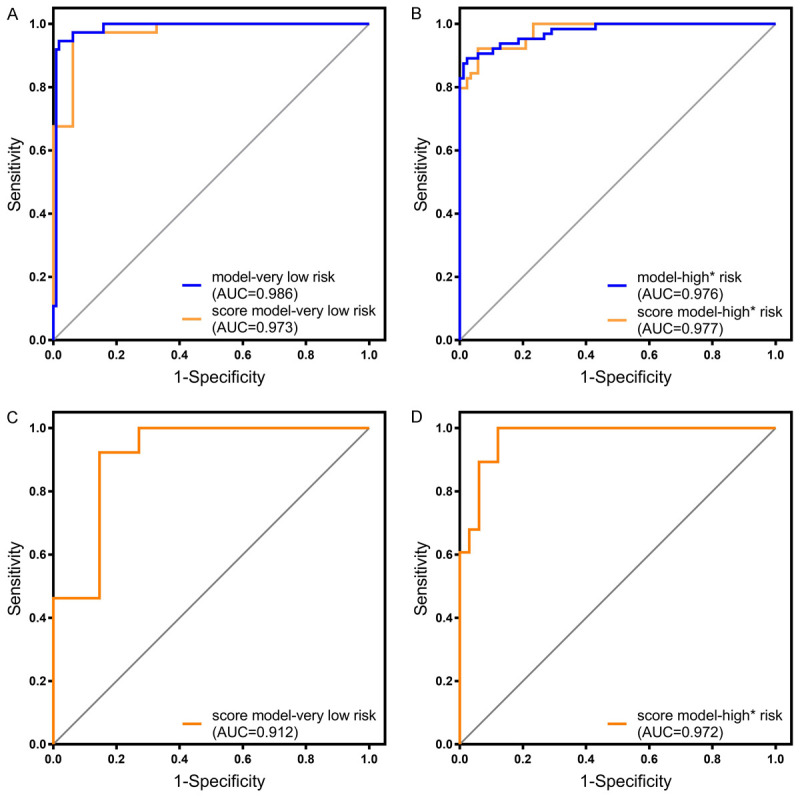
A. ROC curve of the predictive model and score model in very low risk classification prediction with the training cohort (P < 0.001). B. ROC curve of the predictive model and score model in high* risk classification prediction with the training cohort (P < 0.001). C. ROC curve of score model in very low risk classification prediction with validation cohort (P < 0.001). D. ROC curve of score model in high* risk classification prediction with validation cohort (P < 0.001).
Score ranges exploration
To apply the 21-point scoring system conveniently for diagnostic classification, we further divided it into three score ranges to present three risk-predictive categories: 0-3 points for very low risk, 4-8 points for low risk, and 9-21 points for high* risk. The frequency distribution according to the score assigned of three risk groups were shown in the Figure 2. The positive-predictive rates of the three ranges are summarized in Table S3. The CT images of the very low-risk, low-risk, and high* risk patients are shown in Figure 3, and patients were assigned scores according to the score models. And ROI and 3D images of tumor segmentations were also added in the Figure 3, which demonstrated the relationship between stomach and tumor better and clearly.
Figure 2.
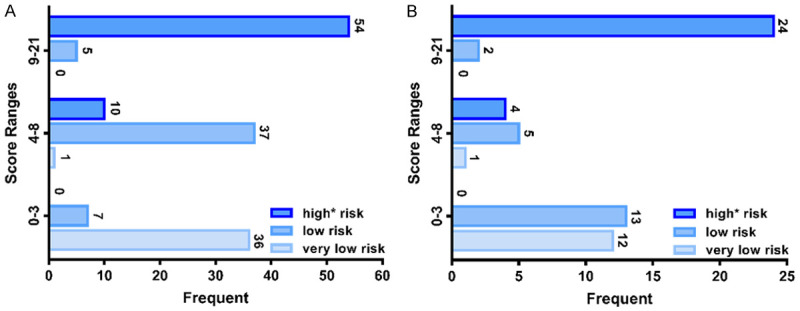
A. The rad-score frequency distribution in training cohort. B. The rad-score frequency distribution in validation cohort.
Figure 3.
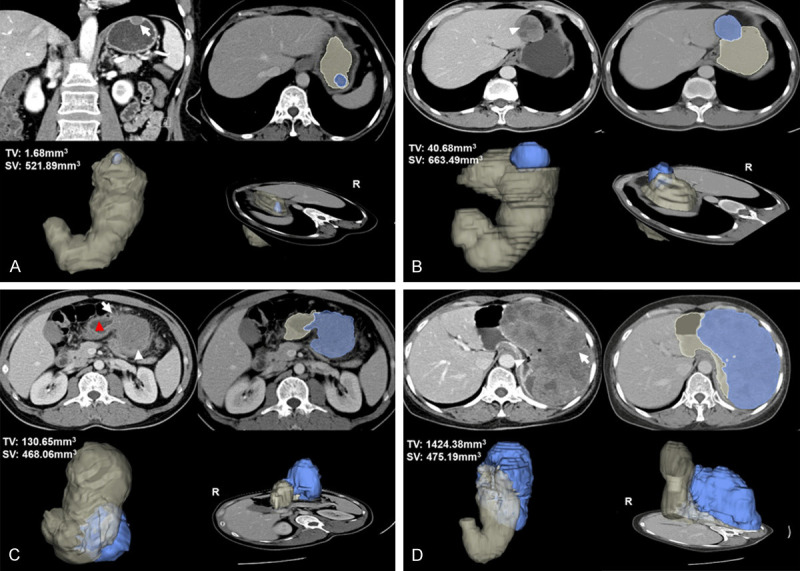
A. 2D image, tumor ROI and 3D tumor segmentation shown in the very low risk gastric GIST, a 65-year-old woman with a 1.7 cm-sized tumor. Coronal Portal venous phase contrast-enhanced CT image shows a regular, well-defined and hypodense mass with endophytic growth pattern (arrow), and the image illustrates the lesion with homogenous enhancement and mild enhancement degree. 0 point was assigned in this patient and presented as one of the minimum values. B. 2D image, tumor ROI and 3D tumor segmentation shown in the low risk gastric GIST, a 39-year-old man with a 4.9 cm-sized tumor. Transverse portal venous phase contrast-enhanced CT image shows a well-defined, intraluminal and mixed-density mass with intralesional necrosis (arrowhead), heterogeneous enhancement and mild enhancement degree. A score of 5 points was assigned. C. 2D image, tumor ROI and 3D tumor segmentation shown in the high* risk (intermediate risk actually) gastric GIST, a 44-year-old man with a 6.5 cm-sized tumor. Transverse portal venous phase contrast-enhanced CT image shows an irregular shape, extraluminal and mixed-density mass with necrosis (arrowhead), heterogeneous and mild enhancement. The margin between the lesion and the stomach (red-arrowhead) is ill-defined (arrow). A score of 14 points was assigned. D. 2D image, tumor ROI and 3D tumor segmentation shown in the high* risk (high risk actually) gastric GIST, a 59-year-old woman with a 15.9 cm-sized tumor. Transverse portal venous phase contrast-enhanced CT image shows a huge, ill-defined margin, and extraluminal mass with surface ulceration (arrowhead). The mass also presents the intratumoral enlarges vessel (arrow), severe necrosis, showing a moderate and heterogeneous enhancement. 21 points was assigned and presented as one of the maximum values.
External validation of the established scoring system
The calibration test was assessed using the Hosmer-Lemeshow test in the validation cohort, and the results revealed that the model fit well with the theoretical calibration in the validation cohort for the very-low and high* risk grades (P > 0.05) (Figure S3). Moreover, the discrimination ability of models was also identified by ROC curve analysis in the validation cohort. As shown in Figure 1C, 1D, the AUC of the very low-risk grade was 0.912 (95% CI, 0.839-0.985; P < 0.001), and the AUC was 0.972 (95% CI, 0.937-1.00, P < 0.001) in the high* risk grade. The cutoff values with the related sensitivity and specificity were 3 points (92.31%, 85.42%) and 5 points (100%, 87.88%), respectively. The positive-predictive rates were also validated and are summarized in Table S4.
Discussion
In this study, a preoperative risk stratification scoring system was established and validated in gastric GIST patients. The scoring system included two risk classification score models and 3 score ranges, consisting of five CT features (tumor size, margin, intratumoral enlarged vessels, enhancement pattern, and growth pattern), which were easily obtained preoperatively. This scoring system successfully predicted the malignant potential of gastric GIST patients.
The choice of treatment for GISTs is closely related to their risk stratification, emphasizing the important role of risk classification [8,27]. GISTs are classified into four risk categories, determined by the tumor size, location, and mitotic index of postoperative pathology. Previous studies and clinical guidelines have shown that tumor treatment strategies for different risk classifications vary, and surgical resection remains the main method for treating GISTs, and is applicable to most localized lesions [27,28]. The follow-up results of the guidelines indicated that very low-risk tumors rarely metastasize or recur, while intermediate- and high-risk tumors require adjuvant therapy after surgical resection to prevent metastasis or postoperative recurrence [11,28]. Thus, in this study, we merged the intermediate-risk and high-risk patients into a high* risk group for analysis, and aimed to establish a preoperative risk classification system to provide a basis for optimal treatment decisions for the subsequent surgical treatment and adjuvant therapy.
Univariate analyses were performed to obtain the relevant predictors that were statistically significantly different among the three GIST risk classes used in this study. The predictors obtained in this study were similar to those reported in previous studies, including tumor location, growth pattern, irregular tumor shape and contour, presence of necrosis and ulceration, ambiguous margin, invasion of adjacent organs, presence of intratumoral/peritumoral angiogenesis, and heterogeneous enhancement [29]. However, the relevant predictive factors obtained by univariate analyses were not independent risk factors. Thus, we performed multiple regression analyses.
Ridge regression was performed to reduce the multicollinearity, and the factors showing statistical significance in ridge regression analysis were incorporated into ordinal multinomial logistic regression analysis. As the final independent risk factors, tumor size, growth pattern (exophytic or mixed), margin, intratumoral enlarged vessels, and enhancement pattern were included in the risk classification regression model. Tumor size has been confirmed to be positively correlated with the malignancy of GISTs [2,5,8]. The mean values of maximum tumor diameter increased gradually as the malignant risk of tumors increased in both the training and validation sets, which was consistent with previous reports. Tumor size was divided into five layers according to the mean values and standard deviation. Because extremely small tumor sizes (below 0.5 cm) were excluded in patient selection, the first size layer was set to below 2.76 cm (mean - SD) rather than 0.58 cm (mean - 2SD). The growth pattern was also included as an independent risk factor, and the endophytic, mixed growth pattern was inclined to be associated with reduced malignancy, while the exophytic growth pattern tended to be associated with increased malignancy in our study [2]. Tumor margins were the most heavily weighted predictors in this model. A well-defined margin is considered to be a characteristic of a benign, non-infiltrative growing tumor, whereas an ill-defined margin is often indicative of surrounding tissue invasion [15,17,30]. The irregular margin was considered to be caused by varying rates of tumor proliferation in different parts, and is associated with malignant behavior [31]. The presence of enlarged vessels within tumors is considered to a reliable index for evaluating GIST malignancy, which may be because additional and adequate blood supply is crucial to tumor proliferation and metastasis. In addition, high* risk GIST patients usually exhibit heterogeneous enhancement, as compared to a lower malignancy tumor [2]. A heterogeneous enhancement pattern is considered to correlate positively with tumor malignancy [17,32,33]. This could be explained by the fact that, as the malignancy and tumor sizes increase, the rate of differentiation and proliferation is accelerated and the possibility of necrosis is improved. These three CT features (ill-defined margin, intratumoral enlarged vessels, and heterogeneous enhancement pattern) reflected the high level of intratumoral heterogeneity associated with malignant potential.
Then, in order to make it easier to evaluate the performance of the models, we divided both the ordered three-class regression model and the score model into three binary-classification models. After assessing the calibration with the Hosmer-Lemeshow test, we found that the calibration of the models was statistically significant in the very low-risk and high* risk grades. While there was no statistical significance in both the predictive model and score model of low-risk grade, the subsequent ROC curve had no significance for the discriminative evaluation. ROC showed that both the predictive models and score models had good predictive ability for very low risk and for high* risk, and the DeLong nonparametric test evaluating the AUCs between the score model and the regression model showed that there was no difference between the two models in discrimination of very low risk and high* risk, which suggested that the score models could replace the predictive model effectively and provide a more convenient evaluation. Stratification of the scoring system was also necessary to offer assistance for radiological analysis and accurate evaluation. The cutoff values were set at 3 points and 8 points to partition the very low risk, low risk, and high* risk. The precision and recall of these stratifications demonstrated good prediction accuracy for very low risk and high* risk. The above results demonstrate the great individualized prediction of the score models for GIST patients and are valuable for personalized medicine. In the very low-risk range, at most, tumor size and growth pattern were independent risk factors, which can be a good basis for follow-up clinical decisions.
To assess the generalizability of the scoring system, an external validation set was substituted into both score models and score ranges to verify the calibration, discrimination ability, and accuracy. The Hosmer-Lemeshow test results revealed that the score model showed good correspondence between predicted and actual risk distribution. The AUCs reflected the discrimination ability of the score model in the validation set; at the same time, the scoring system also demonstrated satisfactory risk classification accuracy. The results revealed that the scoring system we established had promising classification potential in very low-risk and high* risk GISTs, respectively.
Thus, we established a score model and stratified the model into scoring ranges to predict gastric GIST risk, based on CT signs, through univariate and multivariate regression analyses. The predictive model and score model both demonstrated good discriminative ability for very low-risk and high* risk tumors. Such prediction and classification can markedly facilitate clinical-making. Although our models lack the directive distinguishability in low-risk tumors, this class can be obtained upon accurate exclusion of very low-risk and high* risk tumors.
However, the present study had several limitations. First, this was a retrospective study with the inherent potential for bias, and a prospective study is required. Second, the data were not sufficient and evenly distributed in different risk categories of both the training and validation cohorts, which may have caused some bias. Thus, a larger-scale trial is required. Third, the patients of the established models in our study had gastric GISTs, and thus the significance of assessment of intestinal GISTs is unclear. A study including intestinal stromal tumors is required to establish more comprehensive classification efficiency. Fourth, owing to the inherent defects of imaging including resolution and subjective diagnosis, texture analysis is needed for model establishment in our further study.
Conclusions
In brief, a convenient and efficient multi-class gastric GIST risk stratification scoring system, based on preoperative CT signs was established. The system not only provides assistance for radiologists in terms of accurate diagnosis, but also facilitates preoperative individualized prediction of malignant potential for gastric GIST patients and lays the basis for individual treatment decisions.
Acknowledgements
This study was supported by the Construction of Major Disease Diagnosis and Treatment Technology Research Center (17-2018-%s-0077).
Disclosure of conflict of interest
None.
Abbreviations
- GISTs
gastrointestinal stromal tumors
- CT
computed tomography
Supporting Information
References
- 1.Lai EC, Lau SH, Lau WY. Current management of gastrointestinal stromal tumors--a comprehensive review. Int J Surg. 2012;10:334–340. doi: 10.1016/j.ijsu.2012.05.007. [DOI] [PubMed] [Google Scholar]
- 2.Zhou C, Duan X, Zhang X, Hu H, Wang D, Shen J. Predictive features of CT for risk stratifications in patients with primary gastrointestinal stromal tumour. Eur Radiol. 2016;26:3086–3093. doi: 10.1007/s00330-015-4172-7. [DOI] [PubMed] [Google Scholar]
- 3.Kang TW, Kim SH, Jang KM, Choi D, Ha SY, Kim KM, Kang WK, Kim MJ. Gastrointestinal stromal tumours: correlation of modified NIH risk stratification with diffusion-weighted MR imaging as an imaging biomarker. Eur J Radiol. 2015;84:33–40. doi: 10.1016/j.ejrad.2014.10.020. [DOI] [PubMed] [Google Scholar]
- 4.Mei L, Du W, Idowu M, von Mehren M, Boikos SA. Advances and challenges on management of gastrointestinal stromal tumors. Front Oncol. 2018;8:135. doi: 10.3389/fonc.2018.00135. [DOI] [PMC free article] [PubMed] [Google Scholar]
- 5.DeMatteo RP, Lewis JJ, Leung D, Mudan SS, Woodruff JM, Brennan MF. Two hundred gastrointestinal stromal tumors recurrence patterns and prognostic factors for survival. Ann Surg. 2000;231:51–58. doi: 10.1097/00000658-200001000-00008. [DOI] [PMC free article] [PubMed] [Google Scholar]
- 6.D’Ambrosio L, Palesandro E, Boccone P, Tolomeo F, Miano S, Galizia D, Manca A, Chiara G, Bertotto I, Russo F, Campanella D, Venesio T, Sangiolo D, Pignochino Y, Siatis D, De Simone M, Ferrero A, Pisacane A, Dei Tos AP, Aliberti S, Aglietta M, Grignani G. Impact of a risk-based follow-up in patients affected by gastrointestinal stromal tumour. Eur J Cancer. 2017;78:122–132. doi: 10.1016/j.ejca.2017.03.025. [DOI] [PubMed] [Google Scholar]
- 7.Joensuu H. Risk stratification of patients diagnosed with gastrointestinal stromal tumor. Hum Pathol. 2008;39:1411–1419. doi: 10.1016/j.humpath.2008.06.025. [DOI] [PubMed] [Google Scholar]
- 8.Joensuu H, Vehtari A, Riihimäki J, Nishida T, Steigen SE, Brabec P, Plank L, Nilsson B, Cirilli C, Braconi C, Bordoni A, Magnusson MK, Linke Z, Sufliarsky J, Federico M, Jonasson JG, Dei Tos AP, Rutkowski P. Risk of recurrence of gastrointestinal stromal tumour after surgery: an analysis of pooled population-based cohorts. Lancet Oncol. 2012;13:265–274. doi: 10.1016/S1470-2045(11)70299-6. [DOI] [PubMed] [Google Scholar]
- 9.Li J, Ye Y, Wang J, Zhang B, Qin S, Shi Y, He Y, Liang X, Liu X, Zhou Y, Wu X, Zhang X, Wang M, Gao Z, Lin T, Cao H, Shen L Chinese Society Of Clinical Oncology Csco Expert Committee On Gastrointestinal Stromal Tumor. Chinese consensus guidelines for diagnosis and management of gastrointestinal stromal tumor. Chin J Cancer Res. 2017;29:281–293. doi: 10.21147/j.issn.1000-9604.2017.04.01. [DOI] [PMC free article] [PubMed] [Google Scholar]
- 10.Nishida T, Blay JY, Hirota S, Kitagawa Y, Kang YK. The standard diagnosis, treatment, and follow-up of gastrointestinal stromal tumors based on guidelines. Gastric Cancer. 2016;19:3–14. doi: 10.1007/s10120-015-0526-8. [DOI] [PMC free article] [PubMed] [Google Scholar]
- 11.Li J, Gong JF, Wu AW, Shen L. Post-operative imatinib in patients with intermediate or high risk gastrointestinal stromal tumor. Eur J Surg Oncol. 2011;37:319–324. doi: 10.1016/j.ejso.2011.01.005. [DOI] [PubMed] [Google Scholar]
- 12.Nakano A, Nakamura M, Watanabe O, Yamamura T, Funasaka K, Ohno E, Kawashima H, Miyahara R, Goto H, Hirooka Y. Endoscopic characteristics, risk grade, and prognostic prediction in gastrointestinal stromal tumors of the small bowel. Digestion. 2017;95:122–131. doi: 10.1159/000454728. [DOI] [PubMed] [Google Scholar]
- 13.Akahoshi K, Sumida Y, Matsui N, Oya M, Akinaga R, Kubokawa M, Motomura Y, Honda K, Watanabe M, Nagaie T. Preoperative diagnosis of gastrointestinal stromal tumor by endoscopic ultrasound-guided fine needle aspiration. World J Gastroenterol. 2007;13:2077–82. doi: 10.3748/wjg.v13.i14.2077. [DOI] [PMC free article] [PubMed] [Google Scholar]
- 14.Attila T, Aydin O. Lesion size determines diagnostic yield of EUS-FNA with onsite cytopathologic evaluation for upper gastrointestinal subepithelial lesions. Turk J Gastroenterol. 2018;29:436–441. doi: 10.5152/tjg.2018.17876. [DOI] [PMC free article] [PubMed] [Google Scholar]
- 15.Ghanem N, Altehoefer C, Furtwangler A, Winterer J, Schafer O, Springer O, Kotter E, Langer M. Computed tomography in gastrointestinal stromal tumors. Eur Radiol. 2003;13:1669–1678. doi: 10.1007/s00330-002-1803-6. [DOI] [PubMed] [Google Scholar]
- 16.Mathew RP, Xavier JV, Babukumar SM, Basti RS, Suresh HB. Clinicopathological and morphological spectrum of gastrointestinal stromal tumours on multi-detector computed tomography. Pol J Radiol. 2018;83:e545–e553. doi: 10.5114/pjr.2018.81362. [DOI] [PMC free article] [PubMed] [Google Scholar]
- 17.Liu M, Liu L, Jin E. Gastric sub-epithelial tumors: identification of gastrointestinal stromal tumors using CT with a practical scoring method. Gastric Cancer. 2019;22:769–777. doi: 10.1007/s10120-018-00908-6. [DOI] [PubMed] [Google Scholar]
- 18.Chen T, Xu L, Dong X, Li Y, Yu J, Xiong W, Li G. The roles of CT and EUS in the preoperative evaluation of gastric gastrointestinal stromal tumors larger than 2 cm. Eur Radiol. 2019;29:2481–2489. doi: 10.1007/s00330-018-5945-6. [DOI] [PubMed] [Google Scholar]
- 19.Buckley JA, Fishman EK. CT evaluation of small bowel neoplasms: spectrum of disease. Radiographics. 1998;18:379–392. doi: 10.1148/radiographics.18.2.9536485. [DOI] [PubMed] [Google Scholar]
- 20.Laurent F, Raynaud M, Biset JM, Boisserielacroix M, Grelet P, Drouillard J. Diagnosis and categorization of small-bowel neoplasms-role of computed-tomography. Gastrointest Radiol. 1991;16:115–119. doi: 10.1007/BF01887323. [DOI] [PubMed] [Google Scholar]
- 21.Tateishi U, Hasegawa T, Satake M, Moriyama N. Gastrointestinal stromal tumor. Correlation of computed tomography findings with tumor grade and mortality. J Comput Assist Tomogr. 2003;27:792–8. doi: 10.1097/00004728-200309000-00018. [DOI] [PubMed] [Google Scholar]
- 22.Li H, Ren G, Cai R, Chen J, Wu X, Zhao J. A correlation research of Ki67 index, CT features, and risk stratification in gastrointestinal stromal tumor. Cancer Med. 2018;7:4467–4474. doi: 10.1002/cam4.1737. [DOI] [PMC free article] [PubMed] [Google Scholar]
- 23.Ren C, Wang S, Zhang S. Development and validation of a nomogram based on CT images and 3D texture analysis for preoperative prediction of the malignant potential in gastrointestinal stromal tumors. Cancer Imaging. 2020;20:5. doi: 10.1186/s40644-019-0284-7. [DOI] [PMC free article] [PubMed] [Google Scholar]
- 24.Ayed HB, Koubaa M, Hammami F, Marrakchi C, Rekik K, Jemaa TB, Maaloul I, Yaich S, Damak J, Jemaa MB. Performance of an easy and simple new scoring model in predicting multidrug-resistant enterobacteriaceae in community-acquired urinary tract infections. Open Forum Infect Dis. 2019;6:ofz103. doi: 10.1093/ofid/ofz103. [DOI] [PMC free article] [PubMed] [Google Scholar]
- 25.Sullivan LM, Massaro JM, D’Agostmo RB. Presentation of multivariate data for clinical use: the Framingham study risk score functions. Stat Med. 2004;23:1631–1660. doi: 10.1002/sim.1742. [DOI] [PubMed] [Google Scholar]
- 26.Powers DMW. Evaluation: from precision, recall and f-factor to ROC, informedness, markedness & correlation. Technical Report. 2007 [Google Scholar]
- 27.Koo DH, Ryu MH, Kim KM, Yang HK, Sawaki A, Hirota S, Zheng J, Zhang B, Tzen CY, Yeh CN, Nishida T, Shen L, Chen LT, Kang YK. Asian consensus guidelines for the diagnosis and management of gastrointestinal stromal tumor. Cancer Res Treat. 2016;48:1155–1166. doi: 10.4143/crt.2016.187. [DOI] [PMC free article] [PubMed] [Google Scholar]
- 28.Dematteo RP, Heinrich MC, El-Rifai WM, Demetri G. Clinical management of gastrointestinal stromal tumors: before and after STI-571. Hum Pathol. 2002;33:466–477. doi: 10.1053/hupa.2002.124122. [DOI] [PubMed] [Google Scholar]
- 29.Iannicelli E, Carbonetti F, Federici GF, Martini I, Caterino S, Pilozzi E, Panzuto F, Briani C, David V. Evaluation of the relationships between computed tomography features, pathological findings, and prognostic risk assessment in gastrointestinal stromal tumors. J Comput Assist Tomogr. 2017;41:271–278. doi: 10.1097/RCT.0000000000000499. [DOI] [PubMed] [Google Scholar]
- 30.Hasegawa S, Semelka RC, Noone TC, Woosley JT, Marcos HB, Kenney PJ, Siegelman ES. Gastric stromal sarcomas: correlation of MR imaging and histopathologic findings in nine patients. Radiology. 1998;208:591–595. doi: 10.1148/radiology.208.3.9722833. [DOI] [PubMed] [Google Scholar]
- 31.Novitsky YW, Kercher KW, Sing RF, Heniford BT. Long-term outcomes of laparoscopic resection of gastric gastrointestinal stromal tumors. Ann Surg. 2006;243:738–747. doi: 10.1097/01.sla.0000219739.11758.27. [DOI] [PMC free article] [PubMed] [Google Scholar]
- 32.Ganeshan B, Panayiotou E, Burnand K, Dizdarevic S, Miles K. Tumour heterogeneity in non-small cell lung carcinoma assessed by CT texture analysis: a potential marker of survival. Eur Radiol. 2012;22:796–802. doi: 10.1007/s00330-011-2319-8. [DOI] [PubMed] [Google Scholar]
- 33.Lin YC, Lin G, Hong JH, Lin YP, Chen FH, Ng SH, Wang CC. Diffusion radiomics analysis of intratumoral heterogeneity in a murine prostate cancer model following radiotherapy: pixelwise correlation with histology. J Magn Reson Imaging. 2017;46:483–489. doi: 10.1002/jmri.25583. [DOI] [PubMed] [Google Scholar]
Associated Data
This section collects any data citations, data availability statements, or supplementary materials included in this article.