

Abstract
MOB kinase activator 1A (MOB1A) plays an important role in many diseases and cancers. Here, we observed that MOB1A was substantially overexpressed in gallbladder carcinoma (GBC) tissues compared with nontumor tissues. The high expression of MOB1A was closely associated with poor survival in patients with GBC at advanced TNM stages. Furthermore, our study indicated that MOB1A promoted autophagy by activating the IL6/STAT3 signaling pathway and regulating the chemosensitivity to gemcitabine under glucose deprivation conditions both in vitro and in vivo. In conclusion, these findings suggested that MOB1A is critical for the development of GBC via the MOB1A-IL6/STAT3-autophagy axis.
Keywords: MOB1A, gallbladder carcinoma, glucose-deprivation, autophagy, IL6-STAT3 pathways
Introduction
Gallbladder carcinoma (GBC) is the most common biliary tract cancer, accounting for 80-95% of all biliary tract cancers [1,2] and is known to have poor prognosis with, most patients only receive chemotherapy and other comprehensive treatments. However, the efficacy of those therapies is known to be limited, as demonstrated by the rapid recurrence and concomitant chemoresistance in such patients [4]. Therefore, in order to treat patients with GBC more effectively, novel and effective potential biomarkers and therapeutic targets are urgently needed to be identified and facilitate the increased understanding of the molecular mechanisms supporting the malignant transformation of this deadly disease [5,6].
In cancers, autophagy might take part in suppressing the earliest stages of tumorigenesis; however, it might also play an opposite role and favor tumor progression by coping with intracellular and microenvironment stresses, such as hypoxia [7,8], nutrient shortage [9], or chemotherapy [10]. Autophagy is known to be induced by starvation in order for cells to collect and degrade intracellular dysfunctional proteins and organelles into lysosomes, and to sustain metabolism and survival by recycling intracellular components [11]. Meanwhile, autophagy might also play an important role in the chemoresistance of the tumor to chemotherapy [12]. The role of autophagy in the development of GBC remains unknown.
MOB kinase activator 1A (MOB1A), one of the members of the family of Mps One binder (MOB) coactivator proteins, was first explored in 2004 [13]. MOB1A, a member of the conserved MOB proteins, is a mainly cytoplasmic protein that is known to control organ size and tumor growth [14]. It has been reported to be involved in the Hippo signaling pathway, which can hyperactivate NDR/LATS kinases [15]. Furthermore, MOB1A has also been reported to be associated with various proteins, such as S100 Calcium Binding Protein A8 (S100A8), Thyroid Hormone Receptor Interactor 6 (TRIP6), Histone Deacetylase 3 (HDAC3), and TNF Receptor Associated Factor 6 (TRAF6) [16]. However, the mechanisms underlying these interactions have not yet been confirmed. Dysregulation of MOB1A has been reported in many cancer cells, and thus the functional role of MOB1A in specific tumors needs to be further studied.
Although MOB1A was reported to be involved in many other cancers [17], its roles in cancer development and progress are still poorly understood. However, in our previous study that involved sequencing of gallbladder cancer samples using microarrays, we found that MOB1A was significantly upregulated in GBC tissues compared with the corresponding adjacent nontumor tissues [18]. Therefore, the present study aimed to investigate the role of MOB1A in GCB. Further, considering the established roles of autophagy and glucose-deprivation in cancer cells, we also investigated their interaction with MOB1A.
Material and methods
Human sample and clinicopathological data collection
This study was received the approval of the Ethics Committee of Xinhua Hospital. Tissue specimens were collected from 45 patients with GBC and the patients with cholecystitis who had radical cholecystectomy without any therapy before surgery between 2015 and 2018 at the Department of General Surgery, Xinhua Hospital, Shanghai Jiao Tong University, Shang Hai, China. The corresponding clinicopathological information including age, sex, tumor size, regional lymph node status, TNM stage were also obtained, and all patients provided informed consent. Then, the survival information of patients was gained through phone calls. All specimens were confirmed by pathologists and staged according to the 7th AGCC-TNM Classification of Malignant Tumors.
Cell culture and reagents
The human Gallbladder cancer cell line GBC-SD was purchased from the cell bank of the Shanghai Institute for Biological Science, Chinese Academy of Sciences (Shanghai, China). NOZ and OCUG were obtained from the Health Science Research Resources Bank (Osaka, Japan). SGC996 was a gift from the Tongji University School of Medicine (Shanghai, China). The GBC cell lines were cultured in high-glucose Dulbecco’s Modified Eagle Medium (DMEM) (Gibco) and William’s Medium (Gibco) supplemented with 10% FBS (Gibco), 1% penicillin/streptomycin. These cells were cultured at 37°C in a stable humidified atmosphere of 5% CO2. HCQ and Gemcitabine were purchased from MedChemExpress.
Plasmid construction and stable cell line establishment
The complete coding sequence of the human MOB1A gene (NM-018221) was cloned into the hU6-MCS-CBh-gcGFP-IRES-puromycin vectors (genechem), Lentiviruses were produced in 293T cells for the stable transfection of the cell lines, per the manufacturer’s instructions, and an empty vector was transfected into cells to be used as a control. A total of 1 × 10⁵ tumor cells in 2 mL medium with 8 μg/mL polybrene were infected with 1 mL lentivirus supernatant. After 48 hours, puromycin (solarbio) was added for selection.
The RNA interference target sequences of Human MOB1A (NM-018221) were AGAUGGUACUAAUAUUAAA and cloned into the hU6-MCS-CBh-EGFP-IRES-puromycin. Lentiviruses were produced in 293T cells and scrambled sequences were transfected into the cells to be used as controls. Then, after 48 hours, puromycin (solarbio) was added for selection.
Immunohistochemistry and immunofluorescence
The Immunohistochemistry (IHC) staining was performed to detect MOB1A in tumor tissues following the standard procedure. Paraffin-embedded sections of tumor tissues were heated in a ventilated and heated box for 2 hours to deparaffinized. Then, the sections were putted into the Leica BOND RXm automatic scientific research staining platform. These sections were sealed and observed under a microscope. The intensity of IHC staining was graded as 0 for no, 1 for weak, 2 for medium, 3 for strong; and the positive area of staining was evaluated as 0, 0% stained; 1, 1%-25% stained; 2, 26-50% stained; 3, 51%-100% stained. The final score of sections were got by multiplying stain area coefficient and stain intensity coefficient and divided into four groups: 0, absent (-); 1 to 2, weak (+); 3 to 5, moderate (++); 6 to 9, strong (+++).
Immunofluorescence staining was performed on the GBC cells. The cells were seed in 12-well plates, washed with PBS three times for 5 minutes each and fixed with 4% polyformaldehyde. Then, the cells were sealed at room temperature with 1% BSA for 1 hour. After adding the primary antibody against LC3 I/II (1:100) at 4°C overnight, the cells were incubated with fluorescent dye-labelled secondary antibody at room temperature for 1 hour and cultured with anti-fluorescence quenching of sealing solution containing DAPI. Finally, the cells were visualized under a microscope.
Quantitative real-time PCR and ELISA
The total RNA of tissues and cells were isolated by Trizol reagent (Invitrogen, Carlsbad, CA, USA) according to the manufacturer’s instructions. Then, the cDNA was synthesized through a reverse transcription reagent kit (TaKaRa, China). The StepOnePlus™ Real-Time PCR system was performed to detect the expression of the candidate genes. GAPDH was used as an internal reference. All reactions were run from three independent experiments and the primers were list in Table S2. ELISA for cell lysates was performed using a commercial kit, according to the manufacturer’s protocol (human IL6 kit was purchased from ABclonal).
Western blotting
Total proteins from cell lysates were extracted in RIPA lysis buffer and three proteinase inhibiter cocktails. 20 ug proteins per sample were separated by 10%-12.5% SDS-PAGE (EpiZyme, China) and next transferred on 0.20 and 0.45 um PVDF membranes under 100 V constant voltage for 120 minutes. The membranes were blocked with 5% skim milk (Yeasen, China) for 120 minutes and then incubated at 4°C overnight with a series of primary antibodies. After three times washing with TBST (TBS with 0.5% Tween) buffer, the membranes were incubated with HRP-conjugated secondary antibody for 1 hour at room temperature. The information of primary antibodies and secondary antibodies were showed in Table S1 and the bands were visualized with chemiluminescent detection reagent from Pierce.
Cell viability assays
Cell viability assays were examined by Flow cytometry and Cell Counting Kit-8 (CCK8) (Yeasen, China). CCK8 was according to the manufacturer’s instructions. Flow cytometry was performed to detect cell apoptosis with a FITC Annexin V Apoptosis Detection Kit (BD PharmingenTM). All the supernatants and precipitates of the cells were collected and centrifuged. After washed by PBS and resuspended in 100 ul Binding buffer, the cells were incubated with 5 ul Annexin V and 5 ul PI solution for 15 minutes at room temperature in the dark. Then, supplemented with 400 ul binding buffer, the cells were detected by using a Flow cytometry.
Nude mouse model of subcutaneous xenograft
All animal studies were approved by the Xinhua Hospital Ethics Committee Affiliated and operated by skilled experimenters. 1 × 10⁶ NOZ or SGC996 cells resuspended with 100 ul serum-free William’s Medium were injected subcutaneously into the right abdomen regions of the nude mice (4 weeks old, male, BALB/c). Tumor size was measured twice a week with the tumor development. The tumor volume was calculated according to the formula: tumor volume (mm3) = 1/2 × length (mm) × width (mm2). The nude mice were sacrificed after 6 weeks, and the tumor tissues were performed to IHC analysis.
Statistical analysis
Statistical analysis was performed with the IBM SPSS Statistics Program (version 22.0) and GraphPad Prism software (version 6.0). All the data were presented as the mean ± SD and analyzed by Student’s t test. Kaplan-Meier curves and log-rank test were used for the survival analysis. For the Cancer Genome Atlas (TCGA) data analysis, the log-rank test was performed to determine the survival of patients with different expression of MOB1A in PAAD. P < 0.05 was considered as statistically significant.
Results
MOB1A was overexpressed in gallbladder carcinoma
According to the results of our previous microarrays, MOB1A was upregulated in GBC tissues compared with the corresponding adjacent nontumor tissues (P = 4.11 × 10⁻⁵, Figures 1A and S1A) [18]. To explore the roles of MOB1A in gallbladder carcinoma, the expression of MOB1A was identified in 10 pairs of fresh GBC tissues and their corresponding adjacent nontumor tissues using qPCR analysis (Figure 1B) and western blotting (Figure 1C). From our data, we observed that MOB1A was overexpressed in GBC tissues (P = 0.0180, Figure S1B). Consistent with the level of MOB1A noted in tumor tissues, we also found that MOB1A was overexpressed in GBC cell lines both at the protein and mRNA levels (Figure S2A, S2B).
Figure 1.

The expression and clinical significance of MOB1A in GBC tissues. (A) Part of the cluster analysis of miRNA expression profiles of GBC tissues and nontumor tissues from our previous microarray results. (B, C) Ten pairs of fresh GBC tissues and corresponding adjacent nontumor tissues were used for qRT-PCR analysis (B) and western blotting (C) to compare the expression levels of MOB1A. (D) Distribution of IHC results in 45 GBC tissues. (E) Sections used for the analysis of the expression levels of MOB1A in GBC tumor and cholecystitis tissues. Representative images of cholecystitis and GBC tissues are shown for weak (+), moderate (++), and strong (+++) staining. (F) Kaplan-Meier overall survival curve of patients with GBC based on different levels of MOB1A. Tests of significance were two-sided; *P < 0.05; **P < 0.01; ***P < 0.001.
To illustrate the clinical significance of MOB1A in GBC, we further determined the its expression using immunohistochemistry (IHC) in 45 human GBC samples (Figure 1D). As shown in Figure 1E, MOB1A was higher expressed in GBC tissues than in normal cholecystitis samples. Meanwhile, the overall survival time of patients with high expression of MOB1A were shown to be clearly shorter than those with low expression of MOB1A (P = 0.019; Figure 1F). As shown in Table 1, the high level of MOB1A was obviously related to the advanced tumor T stage (P = 0.014) and pTNM staging (P = 0.033).
Table 1.
Association between MOB1A expression and clinicopathological features of patients with GBC
| Total (n = 45) | MOB1A expression | χ2 | P value | ||
|---|---|---|---|---|---|
|
| |||||
| Low (n = 20) | High (n = 25) | ||||
| Gender | 0.799 | 0.371 | |||
| Male | 17 | 9 | 8 | ||
| Female | 28 | 11 | 17 | ||
| Age (year) | 0.161 | 0.688 | |||
| < 65 | 21 | 10 | 11 | ||
| ≥ 65 | 24 | 10 | 14 | ||
| Tumor size (cm) | 0.602 | 0.438 | |||
| ≤ 3.5 cm | 11 | 6 | 5 | ||
| > 3.5 cm | 34 | 14 | 20 | ||
| T staging | 6.000 | 0.014* | |||
| T1-T2 | 18 | 12 | 6 | ||
| T3-T4 | 27 | 8 | 19 | ||
| Nodal staging | 1.500 | 0.221 | |||
| N0 | 27 | 14 | 13 | ||
| N1 | 18 | 6 | 12 | ||
| TNM | 4.543 | 0.033* | |||
| I/II | 17 | 11 | 6 | ||
| III/IV | 28 | 9 | 19 | ||
P < 0.05 (Chi-Square Tests).
Similarly, the clinical significance and expression level of MOB1A were also confirmed in pancreatic ductal adenocarcinoma (PDAC). We analyzed the data obtained from The Cancer Genome Atlas (TCGA) and demonstrated that MOB1A was overexpressed in PDAC (Figure S3A; P < 0.01), with high levels of MOB1A being apparently correlated with poor overall survival of patients (Figure S3B; P = 0.034). Consistent with this observation, the level of MOB1A detected in 3 PDAC cell lines was shown to be higher than that in normal human pancreatic epithelial cells (HPNE) (Figure S4A).
MOB1A promoted the survival of GBC cells in a glucose-deprivation microenvironment
To further investigate the role of MOB1A in the development of GBC, we constructed stable cell lines that either overexpressed MOB1A or had MOB1A knocked down (Figure 2A, 2B). Subsequently, we established nude mice transplanted with GBC cell lines with a MOB1A knockdown. Mice were sacrificed, and the tumors harvested (Figure 2C) and assessed by IHC staining, which indicated that the level of Ki-67 in the scramble group was higher than that in the shMOB1A group (Figure 2D). As shown in Figure 2E, we found that the tumor volume and weight in the shMOB1A group were significantly inhibited. Thus, these data indicated that MOB1A was important for the growth of GBC.
Figure 2.

MOB1A promotes the survival of cancer cells in a glucose-deprivation microenvironment. (A) Protein expression of MOB1A in GBC cells lines, including NOZ, GCB-SD, OCUG, and SGC996, as well as in normal gallbladder cells, HGEPC. (A, B) Indicated GBC cells were transfected with lentiviruses to knockdown (A) or upregulate (B) the expression of MOB1A. Western blotting was performed to verify the stable cell lines. (C, D) Representative image (C) and expression levels of MOB1A and Ki-67 detected in a GBC subcutaneous xenograft model by IHC (D) after scarification (scale bar, 100 μm). (E) The tumor size and weight formed in nude mice injected with either scramble or shMOB1A-NOZ expressing cells, were measured. (F, G) Flow cytometry analysis (F) was used to detect cell apoptosis (G) of GBC-SD, and NOZ scramble, or shMOB1A cells under nutritional-deprived conditions (**P < 0.01).
Our data indicated that MOB1A may play a vital role in the progression of GBC. As is known, the growth of a tumor needs many nutrients, especially that of advanced tumors; however, glucose-deprivation is a common factor affecting the development of tumor. To better simulate the role of MOB1A in the actual environment of GBC, we explored the role of MOB1A in GBC under glucose deprivation conditions. Therefore, we cultured GBC cells in medium with decreased glucose concentration (0.75 mmol/L) to mimic the glucose deprivation conditions. As shown in Figure 2F and 2G, MOB1A markedly promoted the survival of GBC-SD and NOZ cells under a glucose deprivation situation. Based on these data, we inferred that MOB1A promoted the survival of GBC cells under glucose deprivation conditions.
MOB1A promoted autophagy and protected cancer cells from apoptosis under a glucose-deprivation condition
When GBC cells were cultured under glucose deprivation conditions, we found that they exhibited a higher expression of autophagy molecules compared with cells under normal conditions. As shown in Figure 3A, analysis of western blotting revealed a significant increase in the ratio of LC3-I to LC3-II in GBC-SD and NOZ cells in response to the glucose deprivation conditions. Similar results were showed in our immunofluorescence analysis (Figure S5A, S5B). With respect to the relation between glucose-deprived environment and autophagy, we investigated whether MOB1A regulated autophagy. As shown in Figure 3B, 3C, our results indicated that the level of autophagy in the scramble group was higher than that in the shMOB1A group, and similar results were obtained in SGC996 and OCUG cells. We also found that MOB1A promoted autophagy in vivo (Figure 5E). Furthermore, to more clearly observe the activation of autophagy, we performed immunofluorescence analysis of LC3 (Figure 3D). And observed that the GBC-SD scramble group had more LC3-II expression puncta than the shMOB1A group (P < 0.001; Figure 3E). Meanwhile, we also examined the promotion of autophagy by MOB1A in PDAC cells (Figure S4D). Our data indicated that MOB1A promoted autophagy in a nutrition-limited environment. As shown in Figure S5C, S5D, cancer cells with high autophagy activity had more power to defend against the pressure from the nutritional limited conditions and decelerated the apoptosis of cells. Therefore, we hypothesized that MOB1A promoted the survival of cells under the stress of nutritional limited conditions via upregulating autophagy. To test this hypothesis, we performed flow cytometry analysis and western blotting. Our results confirmed that MOB1A promoted autophagy to protect cells in a glucose-deprived environment (Figure 3F-I). Similar results were also obtained from our in vivo studies, where the expression of cleaved-caspase 3 in the shMOB1A group was shown to be much higher than that in the scramble group (Figure 5E). Based on our data, we pondered whether the expression of MOB1A was affected by different nutritional environments. Both SGC996 and OCUG cells were treated with the indicated conditions, and we found that the level of MOB1A in glucose- deprived environment group was much higher than that in the group grown under normal conditions (Figure S5E). Further, we found that the expression of MOB1A was regulated in the low-glucose condition through the ERK signal pathway (Figure S5F). This is supported by previous studies that reported the activation of ERK signal pathway in a low-glucose environment, which in turn regulated the expression of many genes [19-22].
Figure 3.

MOB1A promotes autophagy and protects cancer cells from apoptosis in glucose-deprivation conditions. (A) Indicated GBC cells were incubated with or without glucose for 24 h and then collected for western blotting to detect the level of LC3, SQSTM1, and BECN1. (B, C) Cells were treated with glucose-free medium for 24 h and then collected to detect the level of LC3, SQSTM1, and BECN1, following downregulation (B) or upregulation (C) of MOB1A. (D, E) The level of LC3 in GBC-SD cells was visualized by immunofluorescent staining (D). GBC-SD cells expressing scramble or shMOB1A, cultured in glucose-free medium for 24 h, and analyzed for LC3-expressing puncta (E) (**P < 0.01). (F) Following incubation with glucose-free medium for 24 h indicated MOB1A-overexpressing GBC cells prevented cell apoptosis induced by the glucose deprivation conditions. Western blotting was performed to detect the levels of cleaved-PARP and cleaved-caspase 3. (G) Following treatment with HCQ (10 μM) to block autophagy and incubated in glucose-free medium for 24 h, the inhibition effect of MOB1A on apoptosis was abolished. The levels of cleaved-PARP and cleaved-caspase 3 were detected by western blotting. (H, I) Following incubation in glucose-free medium for 24 h, MOB1A-overexpressing GBC cells exhibited increased cell viability; when treated with HCQ (10 μM), no difference was observed between the EV and the MOB1A group. Flow cytometry analysis (H) was used to detect cell viability (I). **P < 0.01; ***P < 0.001.
Figure 5.

MOB1A promotes autophagy under glucose-deprivation conditions via the IL6-STAT3 pathway. (A, B) Indicated GBC cells either downregulated (A) or upregulated (B) for the expression of MOB1A were subjected to western blotting to detect the expression level of LC3, IL6, and p-STAT3. (C) Indicated MOB1A-overexpressing GBC cells were transfected with anti-IL6 silencing RNA (IL6 siRNA) or control RNA. (D) The expression level of LC3 was detected by western blotting in MOB1A-downregulated GBC-SD cells following treatment with or without rhIL-6. (E) IHC was used to detect the expression of LC3-II, p-STAT3, cleave-cas3, and IL6 in the scramble and shMOB1A groups in vivo.
MOB1A regulated the chemosensitivity to gemcitabine via autophagy in GBC cells
Considerable evidence has shown that autophagy plays an important role in the chemoresistance observed following cancer chemotherapy. Here, we investigated whether MOB1A regulated the chemosensitivity to gemcitabine via autophagy in GBC cells. To test this, GBC cells either with MOB1A knocked down or overexpressing it were treated with different concentrations of gemcitabine in a no-glucose environment for 48 h. As shown in Figure 4A, 4B, the high level of MOB1A markedly increased the viability of cells under treatment with gemcitabine. When hydroxychloroquine (HCQ) was used to block autophagy, the effect of MOB1A in promoting the resistance of cells to gemcitabine was abrogated. In addition, flow cytometry analysis confirmed this result (Figure 4C, 4D). To verify our hypothesis, we established nude mice transplanted with empty vector (EV) or MOB1A-overexpressing cells treated with or without gemcitabine, and subsequently harvested the tumors for TUNEL analysis. Figure 4E-G shows that the MOB1A groups treated with gemcitabine had increased cell viability compared with the EV groups treated with gemcitabine. These data suggested that MOB1A could regulate the chemosensitivity to gemcitabine via promoting autophagy in GBC cells.
Figure 4.

MOB1A regulates the chemosensitivity to gemcitabine via autophagy in GBC cells. (A, B) Indicated MOB1A-overexpressing GBC cells exhibited resistance to GEM, as assessed by a cell viability assay following treatment with GEM for 48 h at indicated doses (B); shMOB1A cells showed a corresponding tendency (A). (C) Indicated GBC cells either expressing scramble or shMOB1A assessed by apoptotic assay for flow cytometry after treatment with GEM for 48 h. (D) Following treatment with or without HCQ to block autophagy, MOB1A-overexpressing SGC996 cells were subjected to flow cytometry to detect their apoptotic level. (E-G) Overexpression of MOB1A prevented the growth inhibition of the xenograft and apoptosis induced by intraperitoneal injection (i.p.) of GEM in SGC996 MOB1A-overexpressing cell xenografts, as evaluated by representative images (E), tumor growth volume (F), and Ki-67 (upper) and TUNEL (down) staining in xenograft tissues after scarification (G). *P < 0.05; **P < 0.01; ***P < 0.001.
MOB1A promoted autophagy through the IL6-STAT3 pathway
The regulatory network of autophagy is very complex, with many signaling pathways participating in it. It has been reported that the IL6/STAT3 signaling pathway plays an important role in the adaptation of cells to a glucose-depleted environment, participating also in autophagy. To determine whether this pathway was involved in MOB1A-promoted autophagy, we performed a series of assays. The expression levels of interleukin 6 (IL6) and phospho- signal transducer and activator of transcription 3 (p-STAT3) were shown to be markedly decreased in GBC-SD and NOZ shMOB1A cells, whereas the scramble group exerted an opposite tendency (Figure 5A). Similar results were also observed in SGC996 and OCUG cells (Figure 5B). Moreover, IHC staining of IL6 and p-STAT3 in mice tumors (Figure 5E) also supported that the IL6/STAT3 signaling pathway participated in MOB1A-mediated autophagy during the progression of GBC. To further support the role of the IL6/STAT3 pathway in MOB1A-regulated autophagy, as shown in Figure 5C, the effect of MOB1A in regulating autophagy was abrogated following treatment with siRNA-IL6. Similar results are also presented in Figure 5D; and it was observed that the effect of MOB1A in autophagy was markedly suppressed by rhIL6. In order to further explore how MOB1A regulates the expression of IL6, we referred to the TCGA database and found that MOB1A had a close relationship with NFκB (Figure S6B), and western blot was used to verify it (Figure S6C, S6D). The NFκB signal pathway reportedly plays an important role in the transcriptional expression of IL6 [23-26]. Therefore, we hypothesized that MOB1A promoted autophagy by activating the IL6/STAT3 signaling pathway (Figure 6).
Figure 6.
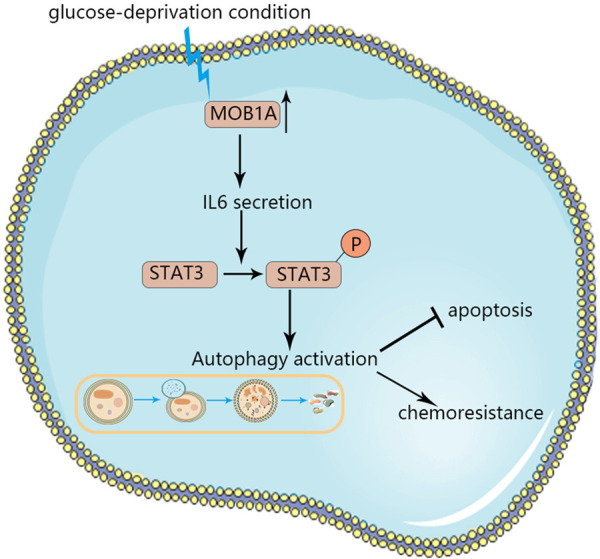
Schematic of the role of MOB1A in the survival of GBC cells under glucose-deprivation conditions. MOB1A promoted autophagy via the IL6/STAT3 signaling pathway to attenuate cell apoptosis, regulate the chemoresistance to GEM, and then help cells survive in glucose deprivation conditions.
Discussion
In previous studies, MOB1A was considered to have a tumor suppressive role in the development of many tumors [27,28], playing a role in cell proliferation [29], and apoptosis signaling [30]. However, the exact role of MOB1A in specific forms of tumors has been poorly understood, and its involvement in the progression of GBC has not been previously investigated. Intriguingly, we identified that the expression of MOB1A in GBC tissues was higher than that in the corresponding nontumor tissues from our previous microarrays [18] and based on TCGA data further found that the mRNA levels of MOB1A were higher in pancreatic cancer than normal tissues. Consistently, MOB1A was shown to be positively correlated with T stage, pTNM stage, and shorter overall survival (OS) time based on clinicopathological data. In this study, we also demonstrated that MOB1A promoted the survival of GBC cells both in vitro and in vivo. Therefore, MOB1A may play a critical role in the development of GBC.
During tumor progression, with the increase in metabolic requisition, the nutritional limited stress has always been commonly considered as an inevitable characteristic of tumors. Moreover, cancer cells have to regulate their complex metabolic network to cope with this harsh environment [31]. However, there is still much uncertainty regarding this network in GBC. In the present study, we incubated cancer cells with glucose-deprived medium to mimic a nutritional deprived situation. We found that GBC-SD and NOZ cells with knockdown of MOB1A exhibited increased cell apoptosis when grown in the glucose-free medium. This result was reversed when MOB1A was overexpressed in SGC996 cells. Based on these data, we hypothesized that MOB1A could promote the survival of cancer cells in a glucose-deprived environment.
While adapting to nutritional deprivation and tolerance to chemotherapy, tumor cells adjust to a series of activities, such as autophagy [32], apoptosis [33], and increased demand of nitrogen [31]. It has been reported that autophagy has a crosstalk with apoptosis under harsh conditions [33,34]. Similarly, our data also indicated that autophagy induced by glucose-deprivation attenuated cell apoptosis. Furthermore, our results suggested that the role of MOB1A in the survival of cancer cells was to promote autophagy and increase the resistance to gemcitabine under a nutrient limited environment.
Mechanistically, MOB1A promoted autophagy via the IL6/STAT3 pathway. IL6, a biomarker that is overexpressed in many cancers and is related to poor prognosis [35,36], has been reported to exert tumor-promoting effects and be upregulated under conditions of harsh microenvironment, such as starvation, hypoxia, and other stressful conditions [37]. In addition, STAT3 is a latent transcription factor that is activated primarily by tyrosine phosphorylation [38]. Recently reports have identified that STAT3 is involved in the regulation of autophagy [39,40]. Our results showed that when the IL6/STAT3 pathway was inhibited, the MOB1A-regulated autophagy was abolished, indicating that MOB1A regulated autophagy through the IL6/STAT3 pathway. Further research is required to elucidate the precise mechanism.
There are many limitations in the present study. Though our study found that GBC cells in glucose-deprived conditions had higher expression of MOB1A than those in normal conditions, further exploration of the relationship between them is required. Moreover, there are many signaling pathways involved in the regulation of autophagy, and hence other signaling pathways that influence the regulation of autophagy by MOB1A may exist.
In conclusion, the present study is the first to explore the clinical and biological significance of MOB1A in the progression of GBC. Our findings revealed that MOB1A promoted the survival of GBC cells via upregulating autophagy to reduce cellular apoptosis and increase the chemoresistance to gemcitabine through the IL6/STAT3 signaling pathway under glucose deprivation conditions. Therefore, MOB1A may be used as a potential biomarker for the diagnosis and treatment of GBC in the future.
Acknowledgements
This study was supported by Shanghai Key Laboratory of Biliary Tract Disease Research Foundation (17DZ2260200), the National Natural Science Foundation of China (No. 91440203, 31620103910, 31601021, 81773043), the development fund for Shanghai talents (No. 201608), and the Precision Medicine Research Program of Shanghai Jiao Tong University School of Medicine (No. 15ZH4003, DKY201507).
Disclosure of conflict of interest
None.
Supporting Information
References
- 1.Li M, Liu F, Zhang F, Zhou W, Jiang X, Yang Y, Qu K, Wang Y, Ma Q, Wang T, Bai L, Wang Z, Song X, Zhu Y, Yuan R, Gao Y, Liu Y, Jin Y, Li H, Xiang S, Ye Y, Zhang Y, Jiang L, Hu Y, Hao Y, Lu W, Chen S, Gu J, Zhou J, Gong W, Zhang Y, Wang X, Liu X, Liu C, Liu H, Liu Y, Liu Y. Genomic ERBB2/ERBB3 mutations promote PD-L1-mediated immune escape in gallbladder cancer: a whole-exome sequencing analysis. Gut. 2019;68:1024–1033. doi: 10.1136/gutjnl-2018-316039. [DOI] [PubMed] [Google Scholar]
- 2.Oneda E, Abu Hilal M, Zaniboni A. Biliary tract cancer: current medical treatment strategies. Cancers. 2020;12:1237. doi: 10.3390/cancers12051237. [DOI] [PMC free article] [PubMed] [Google Scholar]
- 3.Xiang S, Wang Z, Ye Y, Zhang F, Li H, Yang Y, Miao H, Liang H, Zhang Y, Jiang L, Hu Y, Zheng L, Liu X, Liu Y. E2F1 and E2F7 differentially regulate KPNA2 to promote the development of gallbladder cancer. Oncogene. 2019;38:1269–1281. doi: 10.1038/s41388-018-0494-7. [DOI] [PubMed] [Google Scholar]
- 4.Hu YP, Jin YP, Wu XS, Yang Y, Li YS, Li HF, Xiang SS, Song XL, Jiang L, Zhang YJ, Huang W, Chen SL, Liu FT, Chen C, Zhu Q, Chen HZ, Shao R, Liu YB. LncRNA-HGBC stabilized by HuR promotes gallbladder cancer progression by regulating miR-502-3p/SET/AKT axis. Mol Cancer. 2019;18:167. doi: 10.1186/s12943-019-1097-9. [DOI] [PMC free article] [PubMed] [Google Scholar]
- 5.Li M, Zhang Z, Li X, Ye J, Wu X, Tan Z, Liu C, Shen B, Wang XA, Wu W, Zhou D, Zhang D, Wang T, Liu B, Qu K, Ding Q, Weng H, Ding Q, Mu J, Shu Y, Bao R, Cao Y, Chen P, Liu T, Jiang L, Hu Y, Dong P, Gu J, Lu W, Shi W, Lu J, Gong W, Tang Z, Zhang Y, Wang X, Chin YE, Weng X, Zhang H, Tang W, Zheng Y, He L, Wang H, Liu Y, Liu Y. Whole-exome and targeted gene sequencing of gallbladder carcinoma identifies recurrent mutations in the ErbB pathway. Nat Genet. 2014;46:872–876. doi: 10.1038/ng.3030. [DOI] [PubMed] [Google Scholar]
- 6.Zhang Y, Du P, Li Y, Zhu Q, Song X, Liu S, Hao J, Liu L, Liu F, Hu Y, Jiang L, Ma Q, Lu W, Liu Y. TASP1 promotes gallbladder cancer cell proliferation and metastasis by up-regulating FAM49B via PI3K/AKT pathway. Int J Biol Sci. 2020;16:739–751. doi: 10.7150/ijbs.40516. [DOI] [PMC free article] [PubMed] [Google Scholar]
- 7.Qureshi-Baig K, Kuhn D, Viry E, Pozdeev VI, Schmitz M, Rodriguez F, Ullmann P, Koncina E, Nurmik M, Frasquilho S, Nazarov PV, Zuegel N, Boulmont M, Karapetyan Y, Antunes L, Val D, Mittelbronn M, Janji B, Haan S, Letellier E. Hypoxia-induced autophagy drives colorectal cancer initiation and progression by activating the PRKC/PKC-EZR (ezrin) pathway. Autophagy. 2020;16:1436–1452. doi: 10.1080/15548627.2019.1687213. [DOI] [PMC free article] [PubMed] [Google Scholar]
- 8.Jing X, Yang F, Shao C, Wei K, Xie M, Shen H, Shu Y. Role of hypoxia in cancer therapy by regulating the tumor microenvironment. Mol Cancer. 2019;18:157. doi: 10.1186/s12943-019-1089-9. [DOI] [PMC free article] [PubMed] [Google Scholar]
- 9.Yang B, Ding L, Chen Y, Shi J. Augmenting tumor-starvation therapy by cancer cell autophagy inhibition. Adv Sci (Weinh) 2020;7:1902847. doi: 10.1002/advs.201902847. [DOI] [PMC free article] [PubMed] [Google Scholar]
- 10.Amaravadi RK, Kimmelman AC, Debnath J. Targeting autophagy in cancer: recent advances and future directions. Cancer Discov. 2019;9:1167–1181. doi: 10.1158/2159-8290.CD-19-0292. [DOI] [PMC free article] [PubMed] [Google Scholar]
- 11.Amaravadi R, Kimmelman AC, White E. Recent insights into the function of autophagy in cancer. Genes Dev. 2016;30:1913–1930. doi: 10.1101/gad.287524.116. [DOI] [PMC free article] [PubMed] [Google Scholar]
- 12.Xiong H, Ni Z, He J, Jiang S, Li X, He J, Gong W, Zheng L, Chen S, Li B, Zhang N, Lyu X, Huang G, Chen B, Zhang Y, He F. LncRNA HULC triggers autophagy via stabilizing Sirt1 and attenuates the chemosensitivity of HCC cells. Oncogene. 2017;36:3528–3540. doi: 10.1038/onc.2016.521. [DOI] [PubMed] [Google Scholar]
- 13.Bichsel SJ, Tamaskovic R, Stegert MR, Hemmings BA. Mechanism of activation of NDR (nuclear Dbf2-related) protein kinase by the hMOB1 protein. J Biol Chem. 2004;279:35228–35235. doi: 10.1074/jbc.M404542200. [DOI] [PubMed] [Google Scholar]
- 14.Hergovich A. MOB control: reviewing a conserved family of kinase regulators. Cell Signal. 2011;23:1433–1440. doi: 10.1016/j.cellsig.2011.04.007. [DOI] [PMC free article] [PubMed] [Google Scholar]
- 15.Hong AW, Meng Z, Guan KL. The Hippo pathway in intestinal regeneration and disease. Nat Rev Gastroenterol Hepatol. 2016;13:324–337. doi: 10.1038/nrgastro.2016.59. [DOI] [PMC free article] [PubMed] [Google Scholar]
- 16.Ewing RM, Chu P, Elisma F, Li H, Taylor P, Climie S, McBroom-Cerajewski L, Robinson MD, O’Connor L, Li M, Taylor R, Dharsee M, Ho Y, Heilbut A, Moore L, Zhang S, Ornatsky O, Bukhman YV, Ethier M, Sheng Y, Vasilescu J, Abu-Farha M, Lambert JP, Duewel HS, Stewart II, Kuehl B, Hogue K, Colwill K, Gladwish K, Muskat B, Kinach R, Adams SL, Moran MF, Morin GB, Topaloglou T, Figeys D. Large-scale mapping of human protein-protein interactions by mass spectrometry. Mol Syst Biol. 2007;3:89. doi: 10.1038/msb4100134. [DOI] [PMC free article] [PubMed] [Google Scholar]
- 17.Wang L, Li B, Zhang L, Li Q, He Z, Zhang X, Huang X, Xu Z, Xia Y, Zhang Q, Li Q, Xu J, Sun G, Xu Z. miR-664a-3p functions as an oncogene by targeting Hippo pathway in the development of gastric cancer. Cell Prolif. 2019;52:e12567. doi: 10.1111/cpr.12567. [DOI] [PMC free article] [PubMed] [Google Scholar] [Retracted]
- 18.Wu X, Wang F, Li H, Hu Y, Jiang L, Zhang F, Li M, Wang X, Jin Y, Zhang Y, Lu W, Wu W, Shu Y, Weng H, Cao Y, Bao R, Liang H, Wang Z, Zhang Y, Gong W, Zheng L, Sun S, Liu Y. LncRNA-PAGBC acts as a microRNA sponge and promotes gallbladder tumorigenesis. EMBO Rep. 2017;18:1837–1853. doi: 10.15252/embr.201744147. [DOI] [PMC free article] [PubMed] [Google Scholar]
- 19.Eckert A, Bock BC, Tagscherer KE, Haas TL, Grund K, Sykora J, Herold-Mende C, Ehemann V, Hollstein M, Chneiweiss H, Wiestler OD, Walczak H, Roth W. The PEA-15/PED protein protects glioblastoma cells from glucose deprivation-induced apoptosis via the ERK/MAP kinase pathway. Oncogene. 2008;27:1155–1166. doi: 10.1038/sj.onc.1210732. [DOI] [PubMed] [Google Scholar]
- 20.Fu LN, Wang YQ, Tan J, Xu J, Gao QY, Chen YX, Fang JY. Role of JMJD2B in colon cancer cell survival under glucose-deprived conditions and the underlying mechanisms. Oncogene. 2018;37:389–402. doi: 10.1038/onc.2017.345. [DOI] [PubMed] [Google Scholar]
- 21.Tan J, Wang HL, Yang J, Liu QQ, Li CM, Wang YQ, Fu LN, Gao QY, Chen YX, Fang JY. JMJD2B-induced amino acid alterations enhance the survival of colorectal cancer cells under glucose-deprivation via autophagy. Theranostics. 2020;10:5763–5777. doi: 10.7150/thno.38087. [DOI] [PMC free article] [PubMed] [Google Scholar]
- 22.Zhang P, Sun Y, Peng R, Chen W, Fu X, Zhang L, Peng H, Zhang Z. Long non-coding RNA Rpph1 promotes inflammation and proliferation of mesangial cells in diabetic nephropathy via an interaction with Gal-3. Cell Death Dis. 2019;10:526. doi: 10.1038/s41419-019-1765-0. [DOI] [PMC free article] [PubMed] [Google Scholar]
- 23.Hao J, Yan F, Zhang Y, Triplett A, Zhang Y, Schultz DA, Sun Y, Zeng J, Silverstein KAT, Zheng Q, Bernlohr DA, Cleary MP, Egilmez NK, Sauter E, Liu S, Suttles J, Li B. Expression of adipocyte/macrophage fatty acid-binding protein in tumor-associated macrophages promotes breast cancer progression. Cancer Res. 2018;78:2343–2355. doi: 10.1158/0008-5472.CAN-17-2465. [DOI] [PMC free article] [PubMed] [Google Scholar]
- 24.Huang X, Xiao S, Zhu X, Yu Y, Cao M, Zhang X, Li S, Zhu W, Wu F, Zheng X, Jin L, Xie C, Huang X, Zou P, Li X, Cui R. miR-196b-5p-mediated downregulation of FAS promotes NSCLC progression by activating IL6-STAT3 signaling. Cell Death Dis. 2020;11:785. doi: 10.1038/s41419-020-02997-7. [DOI] [PMC free article] [PubMed] [Google Scholar]
- 25.Kim JY, Jeon S, Yoo YJ, Jin H, Won HY, Yoon K, Hwang ES, Lee YJ, Na Y, Cho J, Lee YS. The Hsp27-mediated IkBalpha-NFkappab signaling axis promotes radiation-induced lung fibrosis. Clin Cancer Res. 2019;25:5364–5375. doi: 10.1158/1078-0432.CCR-18-3900. [DOI] [PubMed] [Google Scholar]
- 26.Zhang H, McCarty N. Tampering with cancer chemoresistance by targeting the TGM2-IL6-autophagy regulatory network. Autophagy. 2017;13:627–628. doi: 10.1080/15548627.2016.1271516. [DOI] [PMC free article] [PubMed] [Google Scholar]
- 27.Kosaka Y, Mimori K, Tanaka F, Inoue H, Watanabe M, Mori M. Clinical significance of the loss of MATS1 mRNA expression in colorectal cancer. Int J Oncol. 2007;31:333–8. [PubMed] [Google Scholar]
- 28.Lignitto L, Arcella A, Sepe M, Rinaldi L, Delle Donne R, Gallo A, Stefan E, Bachmann VA, Oliva MA, Tiziana Storlazzi C, L’Abbate A, Brunetti A, Gargiulo S, Gramanzini M, Insabato L, Garbi C, Gottesman ME, Feliciello A. Proteolysis of MOB1 by the ubiquitin ligase praja2 attenuates Hippo signalling and supports glioblastoma growth. Nat Commun. 2013;4:1822. doi: 10.1038/ncomms2791. [DOI] [PMC free article] [PubMed] [Google Scholar]
- 29.Praskova M, Xia F, Avruch J. MOBKL1A/MOBKL1B phosphorylation by MST1 and MST2 inhibits cell proliferation. Curr Biol. 2008;18:311–321. doi: 10.1016/j.cub.2008.02.006. [DOI] [PMC free article] [PubMed] [Google Scholar]
- 30.Zhou D, Conrad C, Xia F, Park JS, Payer B, Yin Y, Lauwers GY, Thasler W, Lee JT, Avruch J, Bardeesy N. Mst1 and Mst2 maintain hepatocyte quiescence and suppress hepatocellular carcinoma development through inactivation of the Yap1 oncogene. Cancer Cell. 2009;16:425–438. doi: 10.1016/j.ccr.2009.09.026. [DOI] [PMC free article] [PubMed] [Google Scholar]
- 31.Pavlova NN, Thompson CB. The Emerging Hallmarks of Cancer Metabolism. Cell Metab. 2016;23:27–47. doi: 10.1016/j.cmet.2015.12.006. [DOI] [PMC free article] [PubMed] [Google Scholar]
- 32.Kimmelman AC, White E. Autophagy and tumor metabolism. Cell Metab. 2017;25:1037–1043. doi: 10.1016/j.cmet.2017.04.004. [DOI] [PMC free article] [PubMed] [Google Scholar]
- 33.Wu W, Wang X, Berleth N, Deitersen J, Wallot-Hieke N, Bohler P, Schlutermann D, Stuhldreier F, Cox J, Schmitz K, Seggewiss S, Peter C, Kasof G, Stefanski A, Stuhler K, Tschapek A, Godecke A, Stork B. The autophagy-initiating kinase ULK1 Controls RIPK1-mediated cell death. Cell Rep. 2020;31:107547. doi: 10.1016/j.celrep.2020.107547. [DOI] [PubMed] [Google Scholar]
- 34.Goodall ML, Fitzwalter BE, Zahedi S, Wu M, Rodriguez D, Mulcahy-Levy JM, Green DR, Morgan M, Cramer SD, Thorburn A. The autophagy machinery controls cell death switching between apoptosis and necroptosis. Dev Cell. 2016;37:337–349. doi: 10.1016/j.devcel.2016.04.018. [DOI] [PMC free article] [PubMed] [Google Scholar]
- 35.Xue H, Yuan G, Guo X, Liu Q, Zhang J, Gao X, Guo X, Xu S, Li T, Shao Q, Yan S, Li G. A novel tumor-promoting mechanism of IL6 and the therapeutic efficacy of tocilizumab: hypoxia-induced IL6 is a potent autophagy initiator in glioblastoma via the p-STAT3-MIR155-3p-CREBRF pathway. Autophagy. 2016;12:1129–1152. doi: 10.1080/15548627.2016.1178446. [DOI] [PMC free article] [PubMed] [Google Scholar]
- 36.New J, Arnold L, Ananth M, Alvi S, Thornton M, Werner L, Tawfik O, Dai H, Shnayder Y, Kakarala K, Tsue TT, Girod DA, Ding WX, Anant S, Thomas SM. Secretory autophagy in cancer-associated fibroblasts promotes head and neck cancer progression and offers a novel therapeutic target. Cancer Res. 2017;77:6679–6691. doi: 10.1158/0008-5472.CAN-17-1077. [DOI] [PMC free article] [PubMed] [Google Scholar]
- 37.Yoon S, Woo SU, Kang JH, Kim K, Shin HJ, Gwak HS, Park S, Chwae YJ. NF-kappaB and STAT3 cooperatively induce IL6 in starved cancer cells. Oncogene. 2012;31:3467–3481. doi: 10.1038/onc.2011.517. [DOI] [PubMed] [Google Scholar]
- 38.You L, Wang Z, Li H, Shou J, Jing Z, Xie J, Sui X, Pan H, Han W. The role of STAT3 in autophagy. Autophagy. 2015;11:729–739. doi: 10.1080/15548627.2015.1017192. [DOI] [PMC free article] [PubMed] [Google Scholar]
- 39.Kroemer G, Marino G, Levine B. Autophagy and the integrated stress response. Mol Cell. 2010;40:280–293. doi: 10.1016/j.molcel.2010.09.023. [DOI] [PMC free article] [PubMed] [Google Scholar]
- 40.Meng J, Liu K, Shao Y, Feng X, Ji Z, Chang B, Wang Y, Xu L, Yang G. ID1 confers cancer cell chemoresistance through STAT3/ATF6-mediated induction of autophagy. Cell Death Dis. 2020;11:137. doi: 10.1038/s41419-020-2327-1. [DOI] [PMC free article] [PubMed] [Google Scholar]
Associated Data
This section collects any data citations, data availability statements, or supplementary materials included in this article.