

Abstract
Introduction
Hippocampal volume (HV) and cortical thickness are commonly used imaging biomarkers in Alzheimer's disease (AD) trials, and may have utility as selection criteria for enrichment strategies. Atrophy rates of these measures, in the high‐risk apolipoprotein E (APOE) ε4/ε4 homozygous AD subjects are unknown.
Methods
Data from Alzheimer's Disease Neuroimaging Initiative (ADNI‐1) and a tramiprosate trial were analyzed in APOE ε4/ε4 and APOE ε3/ε3 subjects with mild cognitive impairment (MCI) or mild AD. Magnetic resonance imaging (MRI) data were centrally processed using FreeSurfer; total HV and composite average cortical thickness were derived and adjusted for age, head size, and education. Volumetric changes from baseline were assessed using Boundary Shift Integral, and correlated with cognitive changes.
Results
APOE ε4/ε4 MCI subjects showed significantly higher % HV atrophy and cortical thinning at 12 months (4.4%, 3.1%, n = 29) compared to APOE ε3/ε3 subjects (2.8%, 1.8%, n = 93) and similarly in mild AD (7.4%, 4.7% n = 21 vs 5.4%, 3.3% n = 29). Differences were all significant at 24 months. Over 24 months, HV atrophy and cortical thinning correlated significantly with Alzheimer's Disease Assessment Scale‐Cognitive subscale worsening in APOE ε4/ε4 MCI subjects, but not in mild AD.
Discussion
Correlation of volumetric measures to cognitive change in APOE ε4/ε4 subjects with early AD supports their role as efficacy biomarkers. If confirmed in a Phase 3 trial with ALZ‐801 (pro‐drug of tramiprosate) in APOE ε4/ε4 early AD subjects, it may allow their use as surrogate outcomes in future treatment or prevention trials in AD.
Keywords: ALZ‐801, Alzheimer's disease, amyloid beta, amyloid oligomers, apolipoprotein E ε4/ε4 homozygotes, biomarkers, cortical thickness, hippocampus atrophy, tramiprosate
1. INTRODUCTION
Demonstration of clinical efficacy with therapeutic agents for Alzheimer's disease (AD) has been challenging. AD patients show considerable variability in their clinical trajectories that reflect heterogeneity of underlying neuropathologies and their relative contribution to the clinical progression. 1 Despite the use of biomarker‐based diagnosis of AD that requires the presence of amyloid and tau pathologies, 2 such variability in disease course has added substantial burden to the development of treatments for AD, in particular drugs that strive to change the course of the disease.
Variability in a patient's disease course can be minimized through enrichment strategies using a genetic marker, cerebrospinal fluid (CSF) or plasma biomarkers, or imaging techniques. Hippocampal volume (HV) atrophy has been suggested by both the U.S. Food and Drug Administration and the European Medicines Agency as a relevant biomarker of neurodegeneration in AD in recent draft guidances. 3 , 4 Understanding the progression of HV atrophy in specific AD populations can inform its application as either an enrollment criterion or as an efficacy biomarker in enriched study populations.
Precision medicine in drug development, in which trial populations are selected based on high‐risk genetic variants, has proven very successful in a number of therapeutic areas. Apolipoprotein ε4 allele (APOE ε4) is the major genetic risk factor for AD, 5 , 6 with ε4 carriers comprising 65% to 70% of patients in AD clinical trials. A single APOE ε4 gene increases the risk of AD four‐fold, and two genes increase it 14‐fold compared to noncarriers. 7 , 8 A more striking relative risk of AD was reported from a large neuropathological study, in which APOE ε3/ε4 heterozygotes had six‐fold higher, and APOE ε4/ε4 homozygotes 31‐fold higher relative risk compared to the APOE ε3/ε3 genotype. 9 APOE ε4/ε4 homozygotes comprise approximately 10% to 15% of AD patients and represent the highest risk group with earlier onset of symptoms, 5 , 8 and higher burden of aggregated amyloid beta (Aβ) pathology. 10 , 11 APOE ε4/ε4 homozygotes are reported to have a high burden of soluble synaptotoxic Aβ42 oligomers that correlate with cognitive loss. 12 , 13 , 14 This high burden of toxic amyloid oligomers makes APOE ε4/ε4 homozygotes an ideal population for drugs that target soluble Aβ oligomers, such as ALZ‐801. 15 , 16 , 17
RESEARCH IN CONTEXT
Systematic Review: Rates of hippocampal atrophy and cortical thinning in Alzheimer's Disease Neuroimaging Initiative (ADNI‐1) and a tramiprosate clinical trial were analyzed. Apolipoprotein E (APOE) ε4/ε4 homozygotes with mild cognitive impairment (MCI) or mild Alzheimer's disease (AD) exhibited significantly smaller baseline hippocampal volumes, and accelerated hippocampal atrophy and cortical thinning rates over 12 months, compared to APOE ε3/ε3 subjects. These atrophy rates were significantly correlated with cognitive decline in MCI, but not in mild AD.
Interpretation: These imaging‐cognitive correlations in MCI support the utility of these imaging biomarkers in early AD trials. Rates of hippocampal atrophy or cortical thinning can be used as main outcomes in Phase 2 drug trials of ≥12 months, to predict clinical effects in early AD.
Future directions: Correlation of drug effects on hippocampal atrophy or cortical thinning to cognitive benefits in early AD would support their use as potential surrogate outcomes in prevention trials of presymptomatic subjects, allowing trials of shorter duration.
ALZ‐801 is an oral prodrug of the active agent tramiprosate, 18 which has shown meaningful cognitive benefits in the APOE ε4 carrier subgroup of a Phase 3 trial. 19 , 20 ALZ‐801/tramiprosate fully inhibits the formation of Aβ42 oligomers at the planned Phase 3 clinical dose. 15 , 16 , 21 Efficacy of ALZ‐801 will be confirmed in a Phase 3 trial of APOE ε4/ε4 subjects with early AD. 17 Because APOE ε4/ε4 subjects also show early and prominent hippocampus atrophy, 22 , 23 HV could be a suitable imaging biomarker to support clinical efficacy in AD trials. Cortical thickness is another neurodegeneration biomarker with potential utility in treatment trials. 24 , 25 In this study, we analyzed the rates of hippocampal atrophy and cortical thinning in APOE ε4/ε4 subjects with early AD compared to APOE ε3/ε3 subjects, in two independent volumetric magnetic resonance imaging (MRI) datasets. We also investigated the correlation of these brain atrophy rates with cognitive decline over 24 months.
2. METHODS
2.1. ADNI‐1 study population
The first volumetric MRI (vMRI) and clinical datasets were from the observational Alzheimer's Disease Neuroimaging Initiative (ADNI‐1) study, which was designed to evaluate multiple biomarkers at the early stages of the AD spectrum, including cognitively normal elderly, late mild cognitive impairment (LMCI), and mild AD. 26 , 27 The biomarkers included vMRI measures and CSF assays of amyloid and tau levels. The ADNI‐1 cognitively normal group (n = 255) had very few APOE ε4/ε4 subjects with serial MRIs and was not included in this analysis. ADNI‐1 enrolled 301 subjects with LMCI and 166 subjects with mild AD. From these groups, we selected subjects with the APOE ε3/ε3 and APOE ε4/ε4 genotypes, who had serial MRIs. This included 122 subjects with LMCI (29 with APOE ε4/ε4), and 50 with mild AD (21 with APOE ε4/ε4). The Mini‐Mental State Examination (MMSE) scores were 20 to 26 in mild AD and ≥24 in LMCI groups. The number of APOE ε3/ε3 and APOE ε4/ε4 subjects with LMCI and mild AD in the overall clinical, vMRI, and CSF datasets are shown in Table 1.
TABLE 1.
ADNI dataset: Number of APOE ε3/ε3 and APOE ε4/ε4 subjects with LMCI and mild AD
| Population | LMCI N = 301 | Mild AD N = 166 | ||
|---|---|---|---|---|
| Genotype | APOE ε3/ε3 | APOE ε4/ε4 | APOE ε3/ε3 | APOE ε4/ε4 |
| Overall sample | 228 | 73 | 101 | 65 |
| MRI subgroup | 93 | 29 | 29 | 21 |
| CSF+ subgroup | 46 | 21 | 22 | 23 |
Abbreviations: AD, Alzheimer's disease; ADNI‐1, Alzheimer's Disease Neuroimaging Initiative 1; APOE, apolipoprotein E; CSF, cerebrospinal fluid; LMCI, late mild cognitive impairment; MCI, mild cognitive impairment; MRI, magnetic resonance imaging. CSF+ subgroup: subjects had positive cerebrospinal fluid amyloid assay at baseline.
2.2. ADNI‐1 clinical dataset
Details of the ADNI‐1 clinical assessments were previously described. 27 Cognitive scales included the 13‐item Alzheimer's Disease Assessment Scale‐Cognitive subscale 13‐item scale (ADAS‐Cog13) and the MMSE. The composite cognitive‐functional scale was the Clinical Dementia Rating Sum of Boxes (CDR‐SB). Assessments were collected at baseline and months 3, 6, 9, 12, 18, and 24. APOE ε3/ε3 and APOE ε4/ε4 subjects in the MRI subgroup were included in this analysis (Table 1).
2.3. ADNI‐1 volumetric MRI dataset
In the LMCI and mild AD groups, a total of 172 subjects had the genotypes of interest and serial MRIs at baseline, 12, and 24 months (http://adni.loni.ucla.edu). The number of APOE ε3/ε3 and APOE ε4/ε4 subjects with MRIs is shown in Table 1. A subset of subjects also had CSF assays for Aβ42 and tau at baseline. Of the APOE ε3/ε3 subjects, 56% of LMCI and 74% of mild AD had CSF positive for AD pathology, while all APOE ε4/ε4 subjects were CSF positive (Table 1).
2.4. Volumetric MRI analysis methods
The vMRI data included 3D T1‐weighted images, which were acquired at 1.5T, and consisted of MP RAGE (Siemens), 3D TFE (Philips), and 3D Fast SPGR (General Electric) pulse sequences, with a 1.25 × 1.25 × 1.2 mm3 voxel resolution in a sagittal orientation.
All MRI analyses were performed by Bioclinica. These analyses included assessments of total hippocampal volume (HV = left + right volume), cortical thickness, and whole brain volume (WBV). All vMRI data were processed centrally with fully automated methods using FreeSurfer v5.2 for brain segmentation at baseline. 28 , 29 Hippocampal volume, cortical thickness, and WBV were derived. Volume changes at follow‐up timepoints were assessed using boundary shift integral. 30 For cortical thickness, a composite average thickness was derived as the Mayo Index. 31 , 32 Changes in cortical thickness (Mayo Index) were analyzed by a Jacobian‐based method. 33 Volumetric measures were adjusted for age, years of education, and head size. HV is presented in mm3, and cortical thickness in mm. HV and cortical thickness atrophy rates are presented as percent decrease from baseline.
2.5. vMRI dataset from a tramiprosate Phase 3 trial (placebo arm)
The second vMRI dataset is from a Phase 3 trial of oral tramiprosate in mild to moderate AD that included an MRI substudy. 34 APOE ε4/ε4 homozygotes with mild AD, MMSE 20 to 26 inclusive, had shown dose‐dependent cognitive benefit on tramiprosate. 20 This mild AD group with serial MRIs included 28 APOE ε4/ε4 and 62 APOE ε3/ε3 subjects of whom 15 and 16, respectively, were on placebo (Table 3). Images were obtained using mostly 1.5 Tesla MRI at baseline and 18 months. MRI analysis methods were similar to those of the ADNI‐1 dataset.
TABLE 3.
Tramiprosate data: baseline characteristics of APOE ε3/ε3 and APOE ε4/ε4 subjects with mild AD
| APOE ε3/ε3 | APOE ε4/ε4 | ||
|---|---|---|---|
| Characteristics | N = 62 | N = 28 | P value |
| Age (years) | 71.9 (9.8) | 70.1 (7.5) | NS |
| Sex (% male) | 55% | 43% | |
| Education (years) | 13.8 (3.6) | 13.7 (2.5) | NS |
| MMSE | 23.2 (1.89) | 23.3 (1.97) | NS |
| ADAS‐Cog11 | 17.9 (6.02) | 17.5 (5.24) | NS |
| CDR‐SB | 4.8 (1.77) | 4.6 (1.84) | NS |
| Hippocampus volume (cc) | 3.5 (0.79) | 3.1 (0.78) | .026 |
| Whole brain volume (cc) | 1074.4 (92.21) | 1076.3 (104.60) | NS |
Abbreviation: AD, Alzheimer's disease; ADAS‐Cog13, Alzheimer's Disease Assessment Scale‐Cognitive subscale 13‐item scale; APOE, apolipoprotein E; CDR‐SB, Clinical Dementia Rating Sum of Boxes; MMSE, Mini‐Mental State Examination; NS, not significant; vMRI, volumetric magnetic resonance imaging.
Notes: All vMRI measures were adjusted for age, years of education, and head size. Cortical thickness was not measured in this dataset.
2.6. Statistical methods
For each imaging endpoint, change from baseline was calculated at 12 and 24 months. A mixed‐effects model was defined to assess the relationship among effects of age, education, head size, APOE ε4/ε4 as covariates, and their interactions with time from baseline scan. Likelihood ratio test was used to assess the significance of APOE ε4/ε4 × time interactions. Only APOE ε4/ε4 × time interaction was retained given the smaller sample size. APOE ε4/ε4 effects on imaging endpoints were assessed at baseline and month 24 using a two‐sample t test, after adjusting for age, education, and head size. All analyses were performed using the R package (R Foundation for Statistical Computing, Vienna, Austria: https://www.R-project.org).
For each clinical endpoint, changes from baseline in clinical scores were estimated by fitting a linear model for each subject. APOE ε4/ε4 effects on clinical scores were assessed at baseline and month 24 using a two‐sample t test, after adjusting for age and years of education. A mixed‐effects model was defined to assess the relationship among effects of age, education, APOE ε4/ε4, and their interactions with time from baseline visit. The likelihood ratio test was used to assess the significance of APOE ε4/ε4 × time interactions. vMRI changes from baseline were correlated with ADAS‐Cog13, MMSE, and CDR‐SB changes from baseline using Pearson's correlations.
3. RESULTS
3.1. Demographics and baseline characteristics
For the ADNI dataset, results are shown in Table 2. The MCI groups showed similar baseline characteristics between APOE ε3/ε3 and APOE ε4/ε4 subjects, except that APOE ε4/ε4 subjects were approximately 5 years younger, with smaller HV, and higher (worse) ADAS‐Cog13 scores than APOE ε3/ε3 subjects. The mild AD group showed similar age and HV differences between APOE ε3/ε3 and APOE ε4/ε4 subjects, but no difference on ADAS‐Cog13 scores. Tramiprosate study data of the placebo arm are shown in Table 3. The mild AD groups showed similar baseline characteristics, except for significantly smaller HV in APOE ε4/ε4 than APOE ε3/ε3 subjects.
TABLE 2.
ADNI: baseline characteristics of APOE ε3/ε3 and APOE ε4/ε4 subjects with LMCI and mild AD
| LMCI | Mild AD | |||||
|---|---|---|---|---|---|---|
| APOE ε3/ε3 | APOE ε4/ε4 | APOE ε3/ε3 | APOE ε4/ε4 | |||
| Characteristics | N = 93 | N = 29 | P | N = 29 | N = 21 | P |
| Age (years) | 75.96 (7.56) | 71.22 (5.88) | .002 | 76.47 (8.79) | 71.63 (7.53) | .047 |
| Sex (% male) | 67% | 62% | NA | 48% | 57% | NA |
| Education (years) | 15.86 (2.96) | 15.76 (2.40) | NS | 15.52 (3.31) | 14.52 (2.04) | NS |
| MMSE | 27.08 (1.84) | 26.69 (1.77) | NS | 23.34 (2.09) | 23.43 (1.86) | NS |
| ADAS‐Cog13 | 17.38 (5.90) | 20.39 (5.53) | 0.016 | 29.39 (8.91) | 29.32 (6.08) | NS |
| CDR‐SB | 1.45 (0.83) | 1.57 (0.87) | NS | 4.26 (1.49) | 4.57 (1.54) | NS |
| Hippocampus volume (cc) | 6.26 (0.95) | 5.46 (0.73) | <.001 | 5.95 (1.26) | 4.82 (0.76) | <.001 |
| Cortical thickness (mm) | 2.61 (0.18) | 2.62 (0.16) | NS | 2.50 (0.24) | 2.46 (0.16) | NS |
| Whole brain volume (cc) | 995.35 (56.12) | 975.02 (58.26) | .094 | 963.47 (59.08) | 933.54 (56.12) | .077 |
Abbreviations: AD, Alzheimer's disease; ADAS‐Cog13, Alzheimer's Disease Assessment Scale‐Cognitive subscale 13‐item scale; ADNI, Alzheimer's Disease Neuroimaging Initiative; APOE, apolipoprotein E; CDR‐SB, Clinical Dementia Rating Sum of Boxes; LMCI, late mild cognitive impairment; MCI, mild cognitive impairment; MMSE, Mini‐Mental State Examination; NA, not applicable; NS, not significant; vMRI, volumetric magnetic resonance imaging.
Note: All vMRI measures were adjusted for age, years of education, and head size.
3.2. Comparison of vMRI change rates in APOE ε4/ε4 and APOE ε3/ε3 subjects
APOE ε4/ε4 homozygotes with LMCI showed significantly higher % HV atrophy and cortical thinning at 12 months, compared to APOE ε3/ε3 subjects (Table 4). At 24 months, HV, cortical thickness, and WBV all showed significantly higher % decrease in APOE ε4/ε4 compared to APOE ε3/ε3 subjects (Table 4, WBV not shown).
TABLE 4.
ADNI dataset: Hippocampus volume and cortical thickness change rates in APOE ε4/ε4 and APOE ε3/ε3 subjects
| Panel A: Change rates (% atrophy) in LMCI subjects | ||||||
|---|---|---|---|---|---|---|
| HV (cc) | Cortical thickness (mm) | |||||
| APOE ε4/ε4 | APOE ε3/ε3 | APOE ε4/ε4 | APOE ε3/ε3 | |||
| Timepoint | N = 29 | N = 93 | P value* | N = 29 | N = 93 | P value* |
| Baseline | 5.46 | 6.26 | < .001 | 2.62 | 2.61 | .898 |
| Mean (SD) | (0.73) | (0.95) | (0.16) | (0.18) | ||
| 12‐month change | –4.41% | –2.76% | .006 | –3.13% | –1.79% | < .001 |
| (SD) | (2.62) | (3.03) | (1.24) | (1.60) | ||
| 24‐month change | –9.73% | –6.17% | .001 | –6.03% | –3.51% | < .001 |
| (SD) | (4.67) | (5.14) | (2.16) | (2.54) | ||
| Panel B: Change rates (% atrophy) in mild AD subjects | ||||||
|---|---|---|---|---|---|---|
| HV (cc) | Cortical thickness (mm) | |||||
| APOE ε4/ε4 | APOE ε3/ε3 | APOE ε4/ε4 | APOE ε3/ε3 | |||
| Timepoint | N = 21 | N = 29 | P * | N = 21 | N = 29 | P * |
| Baseline | 4.82 | 5.95 | <. 001 | 2.46 | 2.50 | .479 |
| Mean (SD) | (0.78) | (1.26) | (0.16) | (0.24) | ||
| 12‐month change | –7.44% | –5.43% | .06 † | –4.68% | –3.28% | .011 |
| (SD) | (3.73) | (3.38) | (2.28) | (1.50) | ||
| 24‐month change | –16.10% | –10.74% | .005 | –8.62% | –6.55% | .025 |
| (SD) | (6.60) | (5.73) | (3.22) | (3.00) | ||
Abbreviations: AD, Alzheimer's disease; ADNI, Alzheimer's Disease Neuroimaging Initiative; APOE, apolipoprotein E; CDR‐SB, Clinical Dementia Rating Sum of Boxes; HV, hippocampus volume; LMCI, late mild cognitive impairment; MCI, mild cognitive impairment; SD, standard deviation; vMRI, volumetric magnetic resonance imaging.
Note: HV shown in mm3, cortical thickness in mm. P‐values that are either statistically significant or a positive trend are bolded.
P < 0.05 is considered statistically significant.
P < 0.1 is considered a positive trend.
APOE ε4/ε4 homozygotes with mild AD showed significantly higher % cortical thinning and a trend to higher % HV atrophy at 12 months (P < 0.1). At 24 months, both cortical thickness and HV showed significantly more % atrophy in APOE ε4/ε4 than APOE ε3/ε3 subjects (Table 4). In contrast, WBV atrophy rates in mild AD were not significantly different between APOE ε4/ε4 and APOE ε3/ε3 groups at either 12 or 24 months (data not shown). The vMRI atrophy rate comparisons showed similar results in the CSF positive subgroup.
3.3. Correlations of vMRI changes with cognitive decline in APOE ε4/ε4 homozygotes
In the LMCI group, both HV and cortical thickness changes were significantly correlated with cognitive worsening on ADAS‐Cog13 and MMSE over 24 months, but not with CDR‐SB changes. In contrast, none of the vMRI changes were significantly correlated with the cognitive decline in the mild AD group (Table 5).
TABLE 5.
Correlations of hippocampal atrophy and cortical thinning with clinical score changes over 24 months in APOE ε4/ε4 subjects with LMCI
| Characteristics | HV | Cortical thickness | ||
|---|---|---|---|---|
| r | P | r | P | |
| ADAS‐Cog13 | –0.55 | 0.002 | –0.59 | < 0.001 |
| MMSE | 0.39 | 0.037 | 0.38 | 0.041 |
| CDR‐SB | – | NS | – | NS |
Abbreviations: AD, Alzheimer's disease; ADAS‐Cog13, Alzheimer's Disease Assessment Scale‐Cognitive subscale 13‐item scale; APOE, apolipoprotein E; CDR‐SB, Clinical Dementia Rating Sum of Boxes; HV, hippocampus volume; LMCI, late mild cognitive impairment; MMSE, Mini‐Mental State Examination; NS, not significant.
Notes: r denotes Pearson's Correlation. In mild AD, none of the correlations were significant.
3.4. Comparison of HV atrophy rates in APOE ε4/ε4 group from ADNI‐1 and tramiprosate data
To allow comparisons between ADNI data at 12 and 24 months and tramiprosate placebo at 18 months, annualized HV atrophy rates were calculated. In the tramiprosate placebo group, annualized HV atrophy rates were significantly higher in the APOE ε4/ε4 group (5.8%, standard deviation [SD] = 5, n = 15) than the APOE ε3/ε3 group (3.4%, SD = 2.0, n = 14). The annualized rates in the ADNI APOE ε4/ε4 groups were: LMCI at 12 and 24 months (4.4%, SD = 2.6; 4.9%, SD = 2.3; n = 27), and mild AD at 12 and 24 months (7.4%, SD = 3.7; 8.1%, SD = 3.3; n = 21). In APOE ε4/ε4 subjects, the annualized atrophy rate in the tramiprosate placebo group was not significantly different from those in the ADNI dataset (Figure 1).
FIGURE 1.
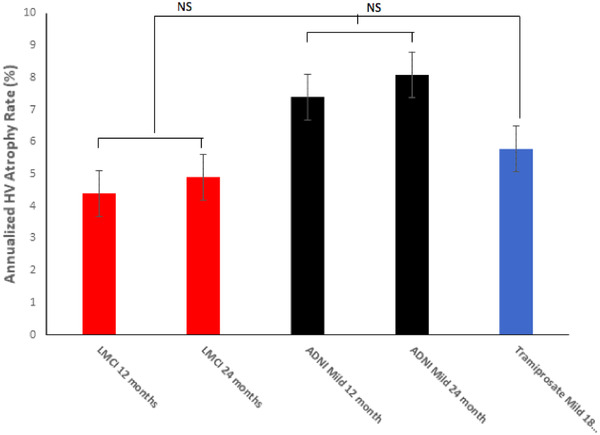
Mean annualized hippocampus volume change rates (% atrophy) in apolipoprotein E ε4/ε4 homozygotes from Alzheimer's Disease Neuroimaging Initiative (ADNI) and tramiprosate datasets. NS, not significant. Error bars are standard errors of the mean. Tramiprosate annualized atrophy rate at 18 months was intermediate between the late mild cognitive impairment and mild Alzheimer's disease rates in ADNI
4. DISCUSSION
HV and cortical thickness are considered physical biomarkers of neurodegeneration in AD, 22 , 23 , 24 , 25 , 35 and have potential to show objective effects in drug trials, supporting disease modification. These biomarkers may also serve as selection criteria to enrich prevention trials with presymptomatic subjects who are fast progressors, and most likely to convert to AD.
The key finding of this study is that APOE ε4/ε4 homozygotes with late MCI and mild AD show accelerated hippocampal atrophy and cortical thinning compared to APOE ε3/ε3 subjects. The differences in atrophy rates between these two genotypes are apparent after 1 year of follow‐up. The second main finding is the significant correlation of both hippocampal atrophy and cortical thinning with cognitive decline on ADAS‐Cog13 and MMSE in APOE ε4/ε4 homozygotes. This significant correlation was observed at the MCI, but not mild AD, stage. These findings suggest that HV and cortical thickness may be of value for trials at the early symptomatic phase of AD (MCI or earlier), for selecting subjects who are likely to decline cognitively over 78 weeks. This would be especially helpful for prevention studies in presymptomatic subjects, who would otherwise require studies of at least 3 years’ duration to show cognitive decline. The population of MCI and mild AD subjects is now collectively called early AD and is considered a suitable population for amyloid‐targeted therapies. To date, two amyloid immunotherapies, aducanumab and BAN2401, have shown promising clinical efficacy and fluid biomarker effects in early AD trials. 36 , 37
Previous AD studies have shown accelerated hippocampal atrophy rates in APOE ε4 carriers compared to noncarriers, 23 , 38 , 39 but none have analyzed APOE ε4/ε4 homozygotes specifically. A unique strength of this study is that we focused on APOE ε4/ε4 and compared them to APOE ε3/ε3 subjects, rather than all APOE ε4 noncarriers. This approach provides the best contrast between the effects of APOE ε4 versus APOE ε3 alleles on disease progression by avoiding the protective effect of APOE ε2 allele in APOE ε2/ε3 subjects. 9 , 40 Another strength of this study is that the HV atrophy rates from the ADNI‐1 dataset were similar to placebo rates from the tramiprosate trial, 34 supporting the relevance of this data to the design of future AD therapeutic trials.
The observed differences in HV atrophy between APOE ε4/ε4 and APOE ε3/ε3 subjects were more significant at the MCI than mild AD stage, suggesting that hippocampus changes may start at the presymptomatic stage in APOE ε4/ε4 homozygotes. This is consistent with the early impairment of hippocampus‐dependent memory reported in APOE ε4 carriers, 41 , 42 early amyloid deposition, 40 and prominent tau pathology in the medial temporal lobe. 43
Both the U.S. Food and Drug Administration and the European Medicines Agency support the use of HV as a biomarker of neurodegeneration in AD in their recent draft guidances. 3 , 4 A critical consideration in biomarker selection as an outcome measure is its responsiveness to drug effects. In the tramiprosate Phase 3 MRI substudy, a dose‐dependent decrease in HV atrophy over 18 months of treatment was reported, 34 suggesting that HV could be useful as a tramiprosate efficacy biomarker. HV atrophy rates from this analysis can be used to design efficient studies with HV as the primary outcome. In APOE ε4/ε4 subjects, the mean rates of HV atrophy over 12 months were 4.41% in MCI, and 7.44% in mild AD.
For a study in early AD, it can be assumed that over 18 months the rate of HV atrophy would be ≈6%. Tramiprosate study data from the APOE ε4/ε4 placebo arm showed baseline HV of 2870 mm3 with SD of 699, and decline to 2736 mm3 with SD of 661, over 18 months. Based on these data, a placebo‐controlled biomarker study with a single active treatment arm, with 150 patients per arm and 18 months follow‐up, can detect 30% reduction in HV atrophy with > 80% power, and can detect 50% reduction with > 95% power, at two‐sided alpha of 0.05.
To our knowledge, this is the first report describing longitudinal changes in the composite average cortical thickness 32 in APOE ε4/ε4 homozygotes. Cortical thickness is less affected by head size or sex than HV 26 and may have methodological advantages. Again, the rates of cortical thinning were higher in APOE ε4/ε4 than APOE ε3/ε3 subjects, and these differences were especially prominent at the MCI stage. Cortical thickness differences between the genotypes were even more significant than the HV differences. Therefore, cortical thickness may complement HV assessments and merits inclusion as an imaging biomarker in future AD trials. These HV and cortical thickness findings suggest that homozygotes represent a distinct biological phenotype of AD with clear differences from APOE ε3/ε3 subjects, making it prudent to evaluate them in separate clinical trials.
An important finding from our analyses is the correlation of hippocampus atrophy and cortical thinning with cognitive changes on ADAS‐Cog13 and MMSE. Both HV atrophy and cortical thinning showed significant correlations to cognitive decline, but only at the MCI stage. This suggests that these MRI changes may be early harbingers of impending cognitive symptoms at the presymptomatic stage and could have utility as entry criteria in prevention trials in presymptomatic APOE ε4/ε4 homozygotes, and possibly other AD populations. Current presymptomatic AD trials require treatment duration of 3 to 5 years to show a delay in conversion to symptomatic AD. 44 , 45 Enrollment of APOE ε4/ε4 subjects at the highest risk of conversion to AD, based on their HV and/or cortical thickness status, would allow for shorter and more efficient trials. Based on prior studies, it is likely that a longitudinal decline in these imaging biomarkers, rather than a specific cut‐off, may be a better predictor of impending cognitive decline.
Potential limitations of our analyses include the small sample size of APOE ε4/ε4 groups, and the applicability of the U.S. ADNI population to a more diverse AD population in global clinical trials. The differences between APOE genotypes were significant despite the limited sample size of APOE ε4/ε4 subjects. However, the imaging–cognitive correlations may be more robust in a larger dataset. Replication of these findings in a larger and more diverse dataset would be helpful.
Another approach to identifying APOE ε4/ε4 subjects at risk of impending cognitive decline incorporates the use of plasma or CSF AD biomarkers. 46 Recent studies highlighted the diagnostic value of plasma phosphorylated tau protein (p‐tau) in MCI and preclinical AD, and its potential in predicting disease progression. 47 , 48 In addition, plasma neurofilament light chain (NfL) was found to reflect early neuronal injury in MCI, and to correlate well with CSF levels of NfL. 49 , 50 , 51 However, these plasma measures show some overlap between cognitively normal elderly subjects with negative and positive amyloid status. Adding HV and cortical thickness to this plasma panel of p‐tau and NfL may allow better selection of APOE ε4/ε4 subjects at the highest risk of AD for clinical trials, and guide future therapeutic and preventive treatment regimens.
The ALZ‐801 program in APOE ε4/ε4 subjects with early AD is an example of a precision medicine approach guided by genetics and disease biomarkers. ALZ‐801 is a prodrug formulation of tramiprosate with substantially improved oral absorption, safety, and tolerability. 18 ALZ‐801 inhibits the formation of Aβ oligomers and fully blocks oligomer formation at the planned clinical dose. 15 , 16 , 17 , 21 The planned 78‐week Phase 3 study will have ADAS‐Cog13 as a primary cognitive outcome. The study will include serial vMRI measurements and a CSF substudy (for CSF Aβ42/40, p‐tau, NfL, total‐tau, neuroinflammatory markers), and extensive sampling for plasma biomarkers including p‐tau and NfL. Analyses of MRI and plasma biomarkers from progressors versus non‐progressors can further inform a non‐invasive enrichment scheme for prevention trials in presymptomatic AD.
In conclusion, accelerated hippocampus atrophy and cortical thinning in APOE ε4/ε4 homozygotes with early AD supports the distinct biological profile of this population. If hippocampus volume and cortical thickness effects correlate with cognitive benefit of ALZ‐801/tramiprosate in the upcoming Phase 3 trial of APOE ε4/ε4 homozygotes, this can support their use as either selection criteria or surrogate endpoints in prevention trials of APOE ε4/ε4 homozygotes and potentially other AD populations. This unique clinical and biomarker profile of the APOE ε4/ε4 patients makes them an optimal population for therapeutic as well as preventive trials in AD.
CONFLICTS OF INTEREST
Dr. Susan Abushakra serves as the chief medical officer of Alzheon, Inc. and holds stock and stock options of Alzheon, Inc. Dr. Martin Tolar serves as the founder, president, and chief executive officer of Alzheon, Inc. and holds stock and stock options of Alzheon, Inc. Dr. John A. Hey serves as the chief scientific officer of Alzheon, Inc. and holds stock and stock options of Alzheon, Inc. Dr. Aidan Power serves as a vice president at Alzheon, Inc. and holds stock and stock options of Alzheon, Inc. Dr. Anton Porsteinsson receives research support from the National Institutes of Health and U.S. Department of Defense. He also receives grants from AstraZeneca, Avanir, Biogen, Biohaven, Eisai, Eli Lilly, Genentech/Roche, Janssen, Novartis, Merck, and Toyama. He receives personal fees from Acadia Pharmaceuticals, Avanir, BioXcel, Eisai, Functional Neuromodulation, Grifols, Lundbeck, Merck, Neurim Pharmaceuticals, Pfizer, Tetra Discovery Partners, and Toyama. Dr. Marwan Sabbagh receives research support from the NIH and the Keep Memory Alive Foundation. He has consulting agreements with Allergan, Biogen, Bracket, Cortexyme, Grifols, Sanofi, Neurotrope, and Roche‐Genentech. He has ownership interest in Brain Health Inc., Versanum Inc., Neurotrope Inc., and uMethod Health. Drs. Joyce Suhy, Luc Bracoud, Joel Schaerer, and David Scott serve as full‐time employees of Bioclinica Inc. and have no competing interest in Alzheon Inc.
ETHICS APPROVAL AND INFORMED CONSENT
Subjects from the ADNI‐1 study and tramiprosate North American study had provided informed consent that was approved by the respective study investigational review boards.
Abushakra S, Porsteinsson AP, Sabbagh M, et al. APOE ε4/ε4 homozygotes with early Alzheimer's disease show accelerated hippocampal atrophy and cortical thinning that correlates with cognitive decline. Alzheimer's Dement. 2020;6:e12117 10.1002/trc2.12117
Alzheimer's Disease Neuroimaging Initiative: Data used in preparation of this article were obtained from the Alzheimer's Disease Neuroimaging Initiative (ADNI) database (adni.loni.usc.edu). As such, the investigators within the ADNI contributed to the design and implementation of ADNI and/or provided data but did not participate in analysis or writing of this report. A complete listing of ADNI investigators can be found at: http://adni.loni.usc.edu/wp-content/uploads/how_to_apply/ADNI_Acknowledgement_List.pdf
Funding information
Supported by Alzheon Inc., NIH COBRE 5P20GM109025, NIH R01 AG059008, and the Keep Memory Alive Foundation (Dr. Sabbagh).
REFERENCES
- 1. Veitch DP, Weiner MW, Aisen PS, et al. Understanding disease progression and improving Alzheimer's disease clinical trials: recent highlights from the Alzheimer's Disease Neuroimaging Initiative. Alzheimers Dement. 2019;15:106‐152. [DOI] [PubMed] [Google Scholar]
- 2. Jack CR Jr, Bennett DA, Blennow K, et al. NIA‐AA Research Framework: toward a biological definition of Alzheimer's disease. Alzheimers Dement. 2018;14:535‐562. [DOI] [PMC free article] [PubMed] [Google Scholar]
- 3. US Dept. of Health and Human Services, FDA Draft Guidance for Industry, Feb 2018: Early Alzheimer's Disease: Developing Drugs for Treatment.
- 4. European Medicines Agency , Committee for Medicinal Products for Human Use, CPMP/EWP/553/95 Rev2. 2018. Guideline on the Clinical Investigation of Medicines for the Treatment of Alzheimer's Disease.
- 5. Corder EH, Saunders AM, Strittmatter WJ, et al. Gene dose of apolipoprotein E type 4 allele and the risk of Alzheimer's disease in late onset families. Science. 1993;261:921‐923. [DOI] [PubMed] [Google Scholar]
- 6. Roses AD. Apolipoprotein E alleles as risk factors in Alzheimer's disease. Annu Rev Med. 1996;47:387‐400. [DOI] [PubMed] [Google Scholar]
- 7. Farrer LA, Cupples LA, Haines JL, et al. Effects of age, sex, and ethnicity on the association between apolipoprotein E genotype and Alzheimer disease. A meta‐analysis. APOE and Alzheimer Disease Meta Analysis Consortium. JAMA. 1997;278:1349‐1356. [PubMed] [Google Scholar]
- 8. Sando SB, Melquist S, Cannon A, et al. APOE ε4 lowers age at onset and is a high risk factor for Alzheimer's disease: a case control study from central Norway. BMC Neurology. 2008;8:9. [DOI] [PMC free article] [PubMed] [Google Scholar]
- 9. Reiman EM. Exceptionally low likelihood of Alzheimer's dementia in APOE2 homozygotes from a 5,000‐person neuropathological study. Nature Communications. 2020;11:667 10.1038/s41467-019-14279-8. [DOI] [PMC free article] [PubMed] [Google Scholar]
- 10. Ossenkoppele R, Jansen WJ, Rabinovici GD, et al. Prevalence of amyloid PET positivity in dementia syndromes: a meta‐analysis. JAMA. 2015;313:1939‐1949. [DOI] [PMC free article] [PubMed] [Google Scholar]
- 11. Degenhardt EK, Witte MM, Case MG, et al. Florbetapir F18 PET amyloid neuroimaging and characteristics in patients with mild and moderate Alzheimer dementia. Psychosomatics. 2016;57:208‐216. [DOI] [PubMed] [Google Scholar]
- 12. Hashimoto T, Serrano‐Pozo A, Hori Y, et al. Apolipoprotein E, especially apolipoprotein E4, increases the oligomerization of amyloid β peptide. J Neurosci. 2012;32:15181‐15192. [DOI] [PMC free article] [PubMed] [Google Scholar]
- 13. Viola KL, Klein WL. Amyloid β oligomers in Alzheimer's disease pathogenesis, treatment, and diagnosis. Acta Neuropathol. 2015;129:183‐206. [DOI] [PMC free article] [PubMed] [Google Scholar]
- 14. Hong W, Wang Z, Liu W, et al. Diffusible, highly bioactive oligomers represent a critical minority of soluble Aβ in Alzheimer's disease brain. Acta Neuropathol. 2018;136:19‐40. [DOI] [PMC free article] [PubMed] [Google Scholar]
- 15. Kocis P, Tolar M, Yu J, et al. Elucidating the Aβ42 anti‐aggregation mechanism of action of tramiprosate in Alzheimer's disease: integrating molecular analytical methods, pharmacokinetic and clinical data. CNS Drugs. 2017;31:495‐509. [DOI] [PMC free article] [PubMed] [Google Scholar]
- 16. Hey JA, Kocis P, Hort J, et al. Discovery and identification of an endogenous metabolite of tramiprosate and its prodrug ALZ‐801 that inhibits beta amyloid oligomer formation in the human brain. CNS Drugs. 2018;32:849‐861. [DOI] [PMC free article] [PubMed] [Google Scholar]
- 17. Tolar M, Abushakra S, Sabbagh. The path forward in Alzheimer's disease therapeutics: Reevaluating the amyloid cascade hypothesis. Alzheimers Dement. 2019. Available at: 10.1016/j.jalz.2019.09.075 [Epub ahead of print]. Accessed 14 July 2020. [DOI] [PubMed]
- 18. Hey JA, Yu J, Versavel M, et al. Clinical pharmacokinetics and safety of ALZ‐801, a novel prodrug of tramiprosate in development for the treatment of Alzheimer's disease. Clin Pharmacokinet. 2018;57:315‐333. [DOI] [PMC free article] [PubMed] [Google Scholar]
- 19. Abushakra S, Porsteinsson A, Vellas B, et al. Clinical benefits of tramiprosate in Alzheimer's disease are associated with higher number of APOE4 alleles: the “APOE4 gene‐dose effect. J Prev Alz Dis. 2016;3:219‐228. [DOI] [PubMed] [Google Scholar]
- 20. Abushakra S, Porsteinsson A, Scheltens P, et al. Clinical Effects of Tramiprosate in APOE4/4 Homozygous Patients with Mild Alzheimer's Disease Suggest Disease Modification Potential. J Prev Alz Dis. 2017;4:149‐156. [DOI] [PubMed] [Google Scholar]
- 21. Liang C, Savinov SN, Fejzo J, Eyles SJ, Chen J. Modulation of Amyloid‐β42 Conformation by Small Molecules Through Non‐Specific Binding. J Chem Theory Comput. 2019;15(10):5169‐5174. [DOI] [PMC free article] [PubMed] [Google Scholar]
- 22. Reiman EM, Uecker A, Caselli RJ, et al. Hippocampal volumes in cognitively normal persons at genetic risk for Alzheimer's disease. Ann Neurol. 1998;44:288‐291. [DOI] [PubMed] [Google Scholar]
- 23. Schuff N, Woerner N, Boreta L, et al. MRI of hippocampal volume loss in early Alzheimer's disease in relation to APOE genotype and biomarkers. Brain. 2009;132:1067‐1077. [DOI] [PMC free article] [PubMed] [Google Scholar]
- 24. Racine AM, Brickhouse M, Wolk DA. Dickerson BC for the ADNI Study Group. The personalized Alzheimer's disease cortical thickness index predicts likely pathology and clinical progression in mild cognitive impairment. Alzheimers Dement. 2018;10:301‐310. [DOI] [PMC free article] [PubMed] [Google Scholar]
- 25. Ossenkoppele R, Smith R, Ohlsson T, et al. Associations between tau, Aβ, and cortical thickness with cognition in Alzheimer disease. Neurology. 2019;92:e601‐e612. [DOI] [PMC free article] [PubMed] [Google Scholar]
- 26. Jack CR Jr, Bernstein MA, Fox NC, et al. The Alzheimer's Disease Neuroimaging Initiative (ADNI): mRI methods. J Magn Reson Imaging. 2008;27:685‐691. [DOI] [PMC free article] [PubMed] [Google Scholar]
- 27. Petersen RC, Aisen PS, Beckett LA, et al. Alzheimer's Disease Neuroimaging Initiative (ADNI): clinical characterization. Neurology. 2010;74:201‐209. [DOI] [PMC free article] [PubMed] [Google Scholar]
- 28. Fischl B, Salat DH, Busa E, et al. Whole brain segmentation: automated labeling of neuroanatomical structures in the human brain. Neuron. 2002;33:341‐355. [DOI] [PubMed] [Google Scholar]
- 29. Fischl B, van der Kouwe A, Destrieux C, et al. Automatically parcellating the human cerebral cortex. Cereb Cortex. 2004;14:11‐22. [DOI] [PubMed] [Google Scholar]
- 30. Leung KK, Ridgway GR, Ourselin S, Fox NC. Consistent multi‐time‐point brain atrophy estimation from the boundary shift integral. NeuroImage. 2012;59:3995‐4005. [DOI] [PubMed] [Google Scholar]
- 31. Li Y, Wang Y, Xue Z, et al. Consistent 4D Cortical Thickness Measurement for Longitudinal Neuroimaging Study. Med Image Comput Comput Assist Interv. 2010;13(2):133‐142. [DOI] [PMC free article] [PubMed] [Google Scholar]
- 32. Jack CR Jr, Wiste HJ, Weigand SD, et al. Defining imaging biomarker cut‐points for brain aging and Alzheimer's disease. Alzheimers Dement. 2017;13:205‐216. [DOI] [PMC free article] [PubMed] [Google Scholar]
- 33. Schwarz CG, Gunter JL, Wiste HJ, et al. A large‐scale comparison of cortical thickness and volume methods for measuring Alzheimer's Disease Severity. Neuroimage Clin. 2016;11:802‐881. [DOI] [PMC free article] [PubMed] [Google Scholar]
- 34. Gauthier S, Aisen PS, Ferris SH, et al. Effect of tramiprosate in patients with mild‐to‐moderate Alzheimer's disease: exploratory analyses of the MRI sub‐group of the Alphase study. J Nutr Health & Aging. 2009;13:550‐557. [DOI] [PubMed] [Google Scholar]
- 35. Gutierrez‐Galve L, Lehmann N, Hobbs NZ, et al. Patterns of cortical thickness according to APOE genotype in Alzheimer's disease. Dement Geriatr Cogn Disord. 2009;28(5):476‐485. [DOI] [PubMed] [Google Scholar]
- 36. Swanson CJ, Zhang Y, Dhadda S, et al. Clinical and Biomarker Updates from BAN2401 Study 201 in Early AD. 11th CTAD Conference. October 2018. Available at: https://www.eisai.com/ir/library/presentations/pdf/e4523_181025.pdf.
- 37. Budd‐Haeberlein S, Von Hein C, Tian Y, et al. EMERGE and ENGAGE topline results: Two Phase 3 studies to evaluate aducanumab in patients with Early Alzheimer's Disease. 12th CTAD Conference. 5 December 2019. Available at: https://www.investors.biogen.com/events-and-presentations/presentations.
- 38. Pievani M, Galluzzi S, Thompson PM, Rasser PE, Bonetti M, Frisoni GB. APOE4 is associated with greater atrophy of the hippocampal formation in Alzheimer's disease. NeuroImage. 2011;55:909‐919. [DOI] [PubMed] [Google Scholar]
- 39. Li B, Shi J, Gutman BA, et al. Influence of APOE genotype on hippocampal atrophy over time ‐ an N = 1925 surface‐based ADNI study. PLoS ONE. 2016;11:e0152901. [DOI] [PMC free article] [PubMed] [Google Scholar]
- 40. Jansen WJ, Ossenkoppele R, Knol DL, et al. Prevalence of cerebral amyloid pathology in persons without dementia: a meta‐analysis. JAMA. 2015;313:1924‐1938. [DOI] [PMC free article] [PubMed] [Google Scholar]
- 41. Bailey HR, Sargent JQ, Flores S, Nowotny P, Goate A, Zacks JM. APOE ε4 genotype predicts memory for everyday activities. Neuropsychol Dev Cogn B Aging Neuropsychol Cogn. 2015;22(6):639‐666. [DOI] [PMC free article] [PubMed] [Google Scholar]
- 42. Zimmermann J, Alain C, Butler C. Impaired memory‐guided attention in asymptomatic APOE4 carriers. Sci Rep. 2019;9:8138. [DOI] [PMC free article] [PubMed] [Google Scholar]
- 43. Therriault J, Benedet AL, Pascoal TA, et al. Association of apolipoprotein E ε4 with medial temporal tau independent of amyloid‐β. JAMA Neurol. 2020;77(4):470‐479. 10.1001/jamaneurol.2019.4421. [DOI] [PMC free article] [PubMed] [Google Scholar]
- 44. Qian J, Wolters FJ, Beiser A, et al. APOE‐related risk of mild cognitive impairment and dementia for prevention trials: an analysis of four cohorts. PLoS Med. 2017;14(3):e1002254. [DOI] [PMC free article] [PubMed] [Google Scholar]
- 45. Lopez CL, Tariot PN, Caputo A, et al. The Alzheimer's Prevention Initiative Generation Program: study design of two randomized controlled trials for individuals at risk for clinical onset of Alzheimer's disease. Alzheimers Dement. 2019;5:216‐227. [DOI] [PMC free article] [PubMed] [Google Scholar]
- 46. Molinuevo JL, Ayton S, Batrla R, et al. Current state of Alzheimer's fluid biomarkers. Acta Neuropathol. 2018;136(6):821‐853. 10.1007/s00401-018-1932. [DOI] [PMC free article] [PubMed] [Google Scholar]
- 47. Janelidze S, Mattsson N, Palmqvist S, et al. Plasma P‐tau181 in Alzheimer's disease: relationship to other biomarkers, differential diagnosis, neuropathology and longitudinal progression to Alzheimer's dementia. Nat Med. 2020;26(3):379‐386. 10.1038/s41591-020-0755-1. [DOI] [PubMed] [Google Scholar]
- 48. Karikari TK, Pascoal TA, Ashton NJ, et al. Blood phosphorylated tau181 as a biomarkers in Alzheimer's disease: a diagnostic performance and prediction modelling study using data from four prospective cohorts. Lancet Neurol. 2020;19(5):422‐433. [DOI] [PubMed] [Google Scholar]
- 49. Mattsson N, Andreasson U, Zetterberg H, Blennow K. Association of plasma neurofilament light with neurodegeneration in patients with Alzheimer disease. JAMA Neurol. 2017;74(5):557‐566. 10.1001/jamaneurol.2016.6117. [DOI] [PMC free article] [PubMed] [Google Scholar]
- 50. Ashton NJ, Leuzy A, Lim YM, et al. Increased plasma neurofilament light chain concentration correlates with severity of post‐mortem neurofibrillary tangle pathology and neurodegeneration. Acta Neuropathol Commun. 2019;7(1):5 10.1186/s40478-018-0649-3. [DOI] [PMC free article] [PubMed] [Google Scholar]
- 51. Olsson B, Porteluis E, Cullen NC, Sandelius A, Zetterberg H. Association of cerebrospinal fluid neurofilament light protein levels with cognition in patients with dementia, motor neuron disease, and movement disorders. JAMA Neurol. 2019;76(3):318‐325. [DOI] [PMC free article] [PubMed] [Google Scholar]