Abstract
Oxidative stress contributes to acetaminophen (APAP) hepatotoxicity. Since lipid peroxidation produces reactive aldehydes, we investigated whether activation of mitochondrial aldehyde dehydrogenase-2 (ALDH2) with Alda-1 decreases liver injury after APAP. Male C57BL/6 mice fasted overnight received Alda-1 (20 mg/kg, i.p.) or vehicle 30 min before APAP (300 mg/kg, i.p.). Blood and livers were collected 2 or 24 h after APAP. Intravital multiphoton microscopy of rhodamine 123 (Rh123) and propidium iodide (PI) fluorescence was conducted 6 h after APAP administration to detect mitochondrial polarization status and cell death. 4-Hydroxynonenal protein adducts were present in 0.1% of tissue area without APAP treatment but increased to 7% 2 h after APAP treatment, which Alda-1 blunted to 1%. Serum alanine and aspartate aminotransferases increased to 7594 and 9768 U/L at 24 h respectively, which decreased ≥72% by Alda-1. Alda-1 also decreased centrilobular necrosis at 24 h after APAP from 47% of lobular areas to 21%. N-acetyl-p-benzoquinone imine protein adduct formation and c-Jun-N-terminal kinase phosphorylation increased after APAP as expected, but Alda-1 did not alter these changes. Without APAP, no mitochondrial depolarization was detected by intravital microscopy. At 6 h after APAP, 62% of tissue area showed depolarization, which decreased to 33.5% with Alda-1. Cell death as detected by PI labeling increased from 0 to 6.8 cells per 30× field 6 h after APAP, which decreased to 0.6 cells by Alda-1. In conclusion, aldehydes are important mediators of APAP hepatotoxicity. Accelerated aldehyde degradation by ALDH2 activation with Alda-1 decreases APAP hepatotoxicity by protection against mitochondrial dysfunction.
Keywords: Acetaminophen, Alda-1, Aldehyde dehydrogenase-2, Aldehydes, Hepatotoxicity, Mitochondrial depolarization
1. Introduction
Acetaminophen (N-acetyl-p-aminophenol, paracetamol, Tylenol®, APAP) is a widely used effective over-the-counter analgesic and anti-pyretic. In cases of overdose, APAP metabolism produces a hepatic injury that can lead to acute liver failure requiring transplantation and is the primary cause of acute liver failure worldwide (Bunchorntavakul and Reddy, 2018; Hinson et al., 2010; Ramachandran and Jaeschke, 2019; Yoon et al., 2016; Lancaster et al., 2015). Sensitivity to APAP toxicity can be increased by various conditions, including chronic alcohol use, poor nutrition, use of herbal or other medications that affect APAP metabolism, chronic liver injury, and age (Bunchorntavakul and Reddy, 2018; Yoon et al., 2016; Lancaster et al., 2015). The glutathione (GSH) precursor, N-acetylcysteine (NAC), is currently used as an anti-dote to treat APAP-induced liver injury (Corcoran et al., 1985a; Corcoran et al., 1985b; Lauterburg et al., 1983). However, NAC becomes ineffective at longer periods after APAP overdose, and additional approaches to improve therapy of APAP hepatotoxicity are needed.
APAP is metabolized by glucuronidation and sulfation, producing roughly 90% of metabolites. Cytochrome P450s, primarily Cyp2E1, also metabolize APAP to form an N-acetyl-p-benzoquinone imine (NAPQI) intermediate, which accounts for roughly 10% of metabolites (Bunchorntavakul and Reddy, 2018; Hinson et al., 2010; Ramachandran and Jaeschke, 2019; Lancaster et al., 2015). Conjugation with GSH is the principal route of NAPQI detoxification. At high APAP doses, glucuronidation and sulfation pathways become saturated, and a greater proportion of APAP is converted to NAPQI. Excessive NAPQI depletes GSH. After GSH depletion, NAPQI forms adducts with proteins and nucleic acids, leading to cell damage (Hinson et al., 2010; Ramachandran and Jaeschke, 2019; Yoon et al., 2016; Lancaster et al., 2015; Bunchorntavakul and Reddy, 2013). Mitochondrial NAPQI-protein adduct formation increases superoxide formation from the respiratory chain, thus increasing mitochondrial oxidative stress (Ramachandran and Jaeschke, 2019; Yan et al., 2010). Lipid peroxidation damages mitochondrial membranes and forms aldehydes (Anderson et al., 2012). Previous studies also show that the mitochondrial permeability transition (MPT) occurs after APAP overdose and that the MPT inhibitors cyclosporin A and NIM811 decrease APAP hepatotoxicity (Chaudhuri et al., 2012; Hu et al., 2016a). Activation of the c-Jun N-terminal kinase (JNK) pathway is also implicated in APAP hepatotoxicity (Han et al., 2013; Ramachandran and Jaeschke, 2019; Yoon et al., 2016). Activation of apoptosis signal-regulating kinase 1 (ASK1) and mixed-lineage protein kinase 3 (MLK3) by reactive oxygen species (ROS) is possibly responsible for JNK activation (Ramachandran and Jaeschke, 2019).
Although it is well accepted that ROS play a role in APAP hepatotoxicity, whether aldehyde formation subsequent to lipid peroxidation contributes to APAP hepatotoxicity remains unclear. Alda-1 (N-(1,3-benzodioxol-5-ylmethyl)-2,6-dichlorobenzamide) is an activator of mitochondrial aldehyde dehydrogenase-2 (ALDH2) responsible for aldehyde degradation. Previous studies show that Alda-1 decreases injury in high-ROS environments, such as experimental radiodermatitis and experimental ischemia-reperfusion injury in multiple organs (Chen et al., 2008; Ding et al., 2016; Fu et al., 2014; Liu et al., 2018; Ning et al., 2012; Panisello-Rosello et al., 2018; Perez-Miller et al., 2010; Stachowicz et al., 2016; Zhang et al., 2018; Zhu et al., 2017). Moreover, Alda-1 attenuates cardiac abnormalities in models of endotoxemia, obesity, aging, and diabetes (Pang et al., 1865; Wang et al., 2018; Zhang et al., 2012; Zhang et al., 2014). Therefore, Alda-1 provides a powerful tool to determine whether aldehydes play a role in the pathogenesis of hepatotoxicity. Here, we show that Alda-1 pretreatment markedly decreases mitochondrial dysfunction and liver injury in a mouse model of APAP toxicity.
2. Experimental procedures
2.1. Synthesis of Alda-1
Alda-1 was synthesized as described (Wimborne et al., 2019). The product was shown to be > 99% pure by HPLC chromatography, and the structure was verified by NMR spectroscopy.
2.2. Acetaminophen and Alda-1 administration
Male C57BL/6 mice (20–22 g) were purchased from the Jackson Laboratory (Bar Harbor, MA) and maintained on a 12-h light/dark cycle with ad libitum food and water. All animal procedures followed the NIH “Guide for the Care and Use of Laboratory Animals” and were pre-approved by the Institutional Animal Care and Use Committee at the Medical University of South Carolina. After fasting overnight (15–18 h), Alda-1 (20 mg/kg) or equal volume of vehicle (Neobee M-5, Stephan
Lipid Nutrition, Maywood, NJ) was administered intraperitoneally. APAP (300 mg/kg i.p.) dissolved in saline (20 mg/mL) was injected 30 min later. Food was returned to the animals 30 min after APAP treatment. Vehicle control animals were fasted and received saline and Neobee M-5 injections.
2.3. Tissue harvest and histology
At 2 h and 24 h after APAP administration, blood and liver were harvested under pentobarbital anesthesia (100 mg/kg, i.p.). Blood was collected from the inferior vena cava. Liver were perfused with 5 mL normal saline via the portal vein before removal of left lateral lobes. Half of each left lateral lobe was snap frozen in liquid nitrogen for storage at −80 °C for biochemical analysis. The remainder was trimmed, washed in PBS and fixed in 10% formalin for 24 h. After processing and embedding in paraffin, 5-μm sections were cut on a rotary microtome. Xylene and alcohol were used to deparaffinize and rehydrate sections before H&E staining. Images were captured using a 10× objective. Necrotic areas were identified from ten random 10× fields and quantified using ImageJ (FIJI, Madison, WI) (Schindelin et al., 2012).
2.4. Serum alanine and aspartate aminotransferase measurement
Serum alanine and aspartate aminotransferases (ALT and AST) were measured using analytical kits (Pointe Scientific, Canton, MI) according to the manufacturer’s instructions (Krishnasamy et al., 2016).
2.5. NAPQI-protein adducts assay
NAPQI-protein adducts in liver tissue were measured by HPLC as previously described (McGill et al., 2012).
2.6. Immunoblotting
JNK, phospho-JNK and β-actin immunoblotting was performed as previously described (Akakpo et al., 2019; Akakpo et al., 2018). Primary antibodies were rabbit anti-JNK (cat. no. 9252, Cell Signaling Technology, Danvers, MA), rabbit anti-phospho-JNK (cat. no. 4668) and rabbit anti β-actin (cat. no 4967). Secondary antibody was an HRP-conjugated anti-rabbit IgG (1:5000, Santa Cruz Biotechnology, Dallas TX). Chemiluminescence was imaged using a LICOR Odyssey imaging system (LICOR Biosciences, Lincoln NE).
2.7. Immunohistochemistry
Liver sections were deparaffinized and rehydrated, followed by blocking in 2.5% normal horse serum supplied in a Vector IMMPress HRP polymer Kit (MP-7401, Vector Laboratories, Burlingame CA). Primary antibody was Alpha Diagnostics rabbit anti-4-HNE (4-hydro-xynonenal, HNE11-S Alpha Diagnostics, San Antonio, TX), applied at 1:600 in PBS at 4 °C overnight. Vector IMMPress HRP polymer secondary antibody (Vector Laboratories, Burlingame, CA) was applied, and the sections were incubated for 30 min at room temperature. Cy3-conjugated anti-HRP antibody (1:500 in PBS, 123–165–021, Jackson Immunoresearch, West Grove, PA) was incubated with sections for 1 h before coverslipping with VectaShield Hard Set with DAPI mounting media (Vector Laboratories). Ten random images were collected using a 20× objective. 4-HNE immunofluorescence images were converted to 8-bit grayscale in Adobe Photoshop CS4 (Adobe, San Jose CA), and non-tissue background areas were set to a pixel value of 5 to normalize black levels. All images were then rescaled to the same levels. The images were then analyzed in ImageJ using thresholding of pixel values 35–255. Pixels within the threshold range were counted. Non-tissue regions in the image were excluded from analysis.
2.8. Intravital multiphoton microscopy
At 6 h after vehicle or APAP administration, mice were anesthetized with ketamine and xylazine (100 and 10 mg/kg, i.p., respectively), intubated with a 20-gauge catheter inserted into the trachea, and connected to a small animal ventilator. Rhodamine 123 (Rh123, 2 μmol/mouse), a green-fluorescing mitochondrial polarization indicator, and propidium iodide (PI, 0.4 μmol/mouse), which labels the nuclei of non-viable cells, were infused via the femoral vein using polyethylene-10 tubing over 10 min.
After midline laparotomy, the liver was gently withdrawn from the abdominal cavity and placed over a no. 1.5 glass coverslip mounted on the stage of an Olympus Fluoview 1200 MPE multiphoton microscope (Olympus, Center Valley, PA) equipped with a Spectra Physics Mai Tai Deep Sea tunable multiphoton laser (Newport, Irvine, CA). Rh123 and PI fluorescence was imaged simultaneously using 820-nm multiphoton excitation and a 30 × 1.05 N.A. silicone oil objective lens. The respirator was turned off for 5–10 s to eliminate breathing artifacts during imaging. Ten or more random images were collected for each mouse. Bright punctate Rh123 fluorescence signified hepatocytes with polarized mitochondria, whereas dimmer diffuse cytosolic fluorescence signified cells with depolarized mitochondria. Percent area of mitochondrial depolarization was analyzed using ImageJ distributed by Fiji (Schindelin et al., 2012). Nonviable, PI-positive cells were counted in 10 random images per animal.
2.9. Statistics
Differences between two groups were analyzed by the Student’s t-test. One-way ANOVA followed by the Bonferroni post-hoc test was used for comparison of differences of > 2 groups. p < .05 was considered statistically significant. Groups sizes were 3 or more.
3. Results
3.1. Alda-1 decreases serum alanine and aspartate aminotransferase release after acetaminophen treatment
After 2 h, ALT averaged 20 ± 2 U/L in vehicle only-treated mice compared to 129 ± 64 U/L in APAP-treated mice and 93 ± 44 U/L in APAP plus Alda-1-treated mice (n = 5 per group). Although there was a trend towards increased ALT release at 2 h after APAP and protection by Alda-1, these differences were not statistically significant (ANOVA, p = .257). At 24 h after APAP treatment, ALT increased to 7594 ± 1255 U/L (p < .01 vs vehicle at 24 h). Pretreatment with Alda-1 before APAP decreased serum ALT by more than two-thirds to 2132 ± 883 U/L compared to APAP alone (p < .01 vs APAP at 24 h) (Fig. 1A). Changes of serum AST after APAP mirrored the changes of ALT. After 2 h, AST averaged 42 ± 1.1 U/L in vehicle only-treated mice compared to 1424 ± 786 U/L in APAP-treated mice and 988 ± 534 U/L in APAP plus Alda-1-treated mice (n = 5 per group), but again these differences were not statistically significant (ANOVA, p = .231). At 24 h, AST increased to 9768 ± 1035 U/L in APAP-treated mice (p < .01 vs vehicle at 24 h). Pretreatment with Alda-1 before APAP decreased serum AST by more than three-quarters to 2300 ± 704 U/L compared to APAP alone (p < .01 vs APAP at 24 h) (Fig. 1B).
Fig. 1.
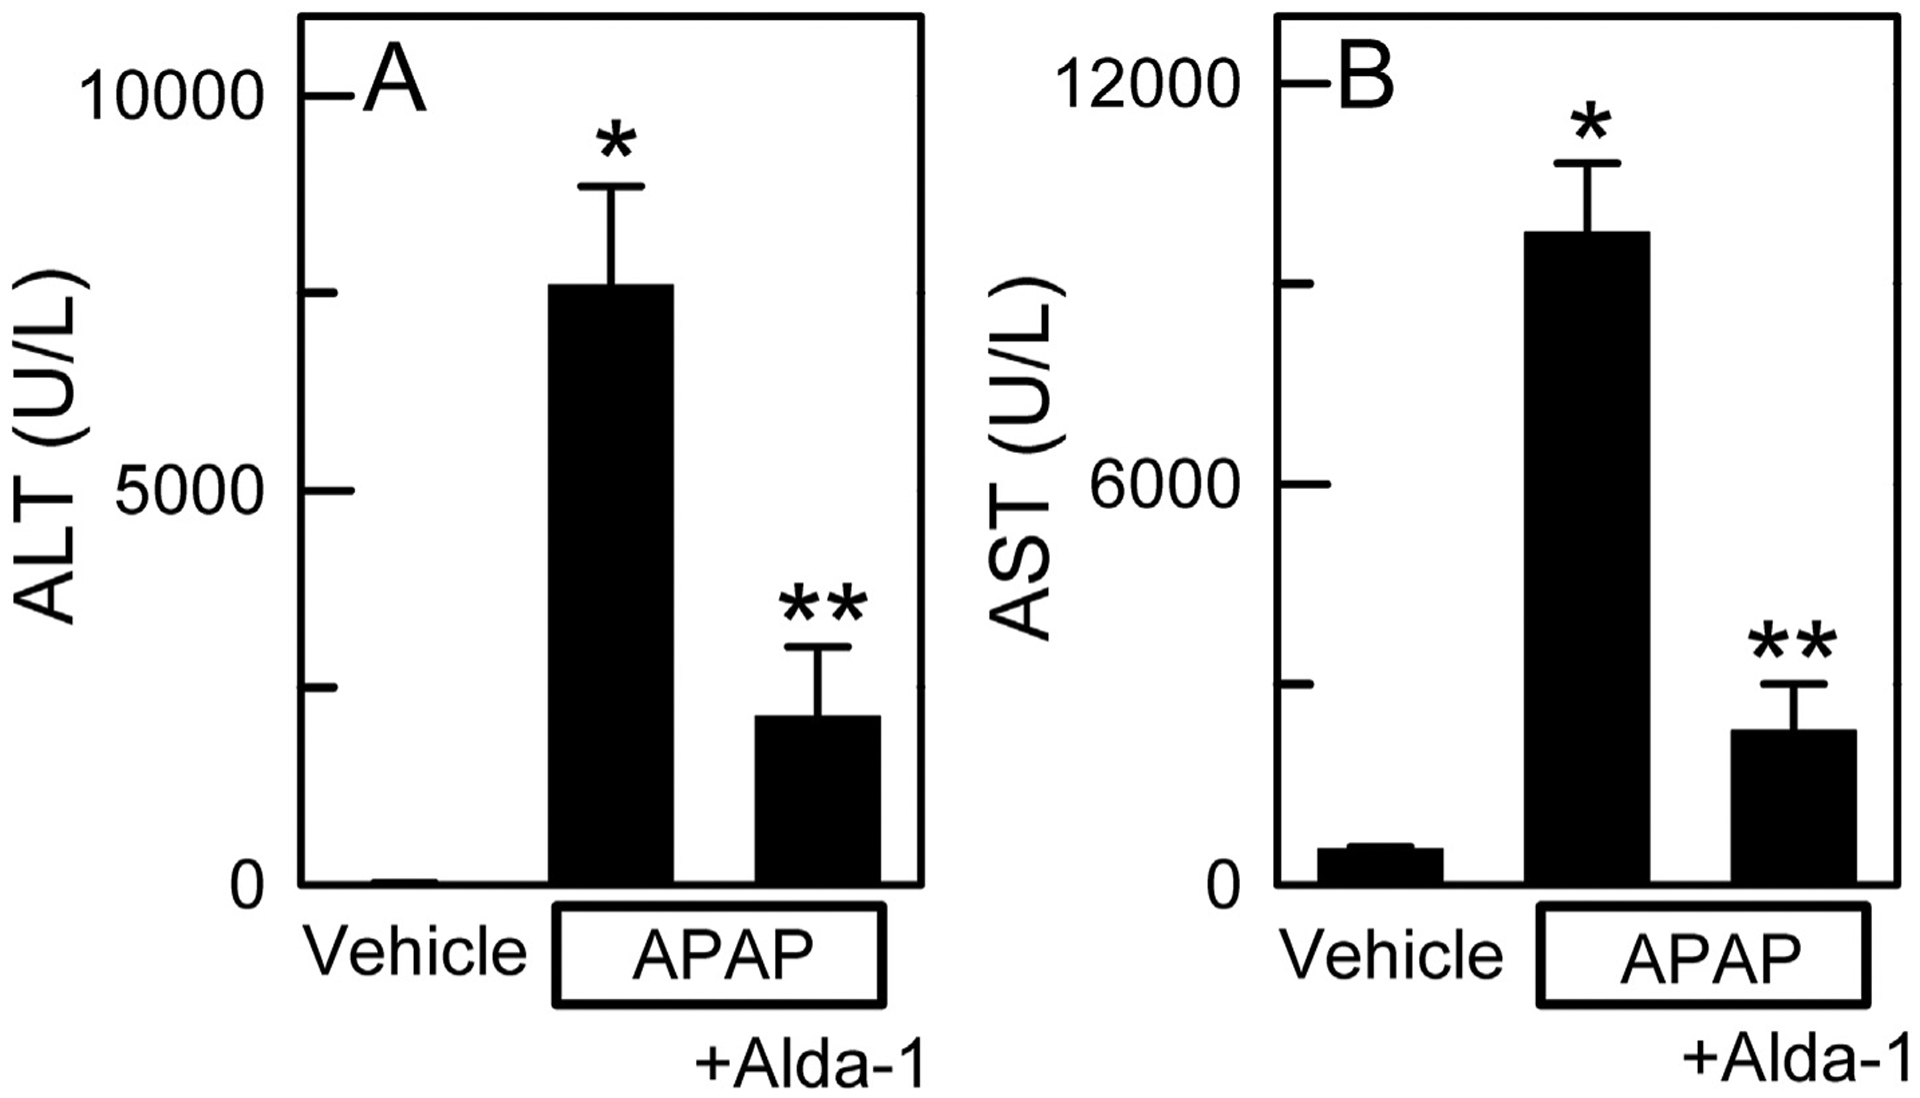
Alda-1 decreases alanine and aspartate aminotransferase release after acetaminophen overdose. Serum ALT (A) and AST (B) were measured 24 h after treatment with vehicle only, APAP, and APAP plus Alda-1. Values are means ± SEM (n = 4 per group for ALT values and n = 5 per group for AST values). *, p < .01 vs. Vehicle; **, p < .01 vs. APAP.
3.2. Alda-1 decreases centrilobular necrosis after acetaminophen treatment
Histology was assessed in H&E-stained liver sections at 2 h and 24 h after APAP treatment. At 2 h, virtually no hepatic necrosis was observed after either APAP treatment alone or APAP plus Alda-1 (data not shown). At 24 h, vehicle-treated control mice without APAP treatment showed no necrosis (Fig. 2A). By contrast, animals receiving APAP showed widespread centrilobular necrosis in 47.1 ± 2.8% of cross-sectional area (Fig. 2B and D). Alda-1 treatment before APAP decreased necrosis to 20.7 ± 6.0% (p < .01 vs APAP) (Fig. 2C and D).
Fig. 2.
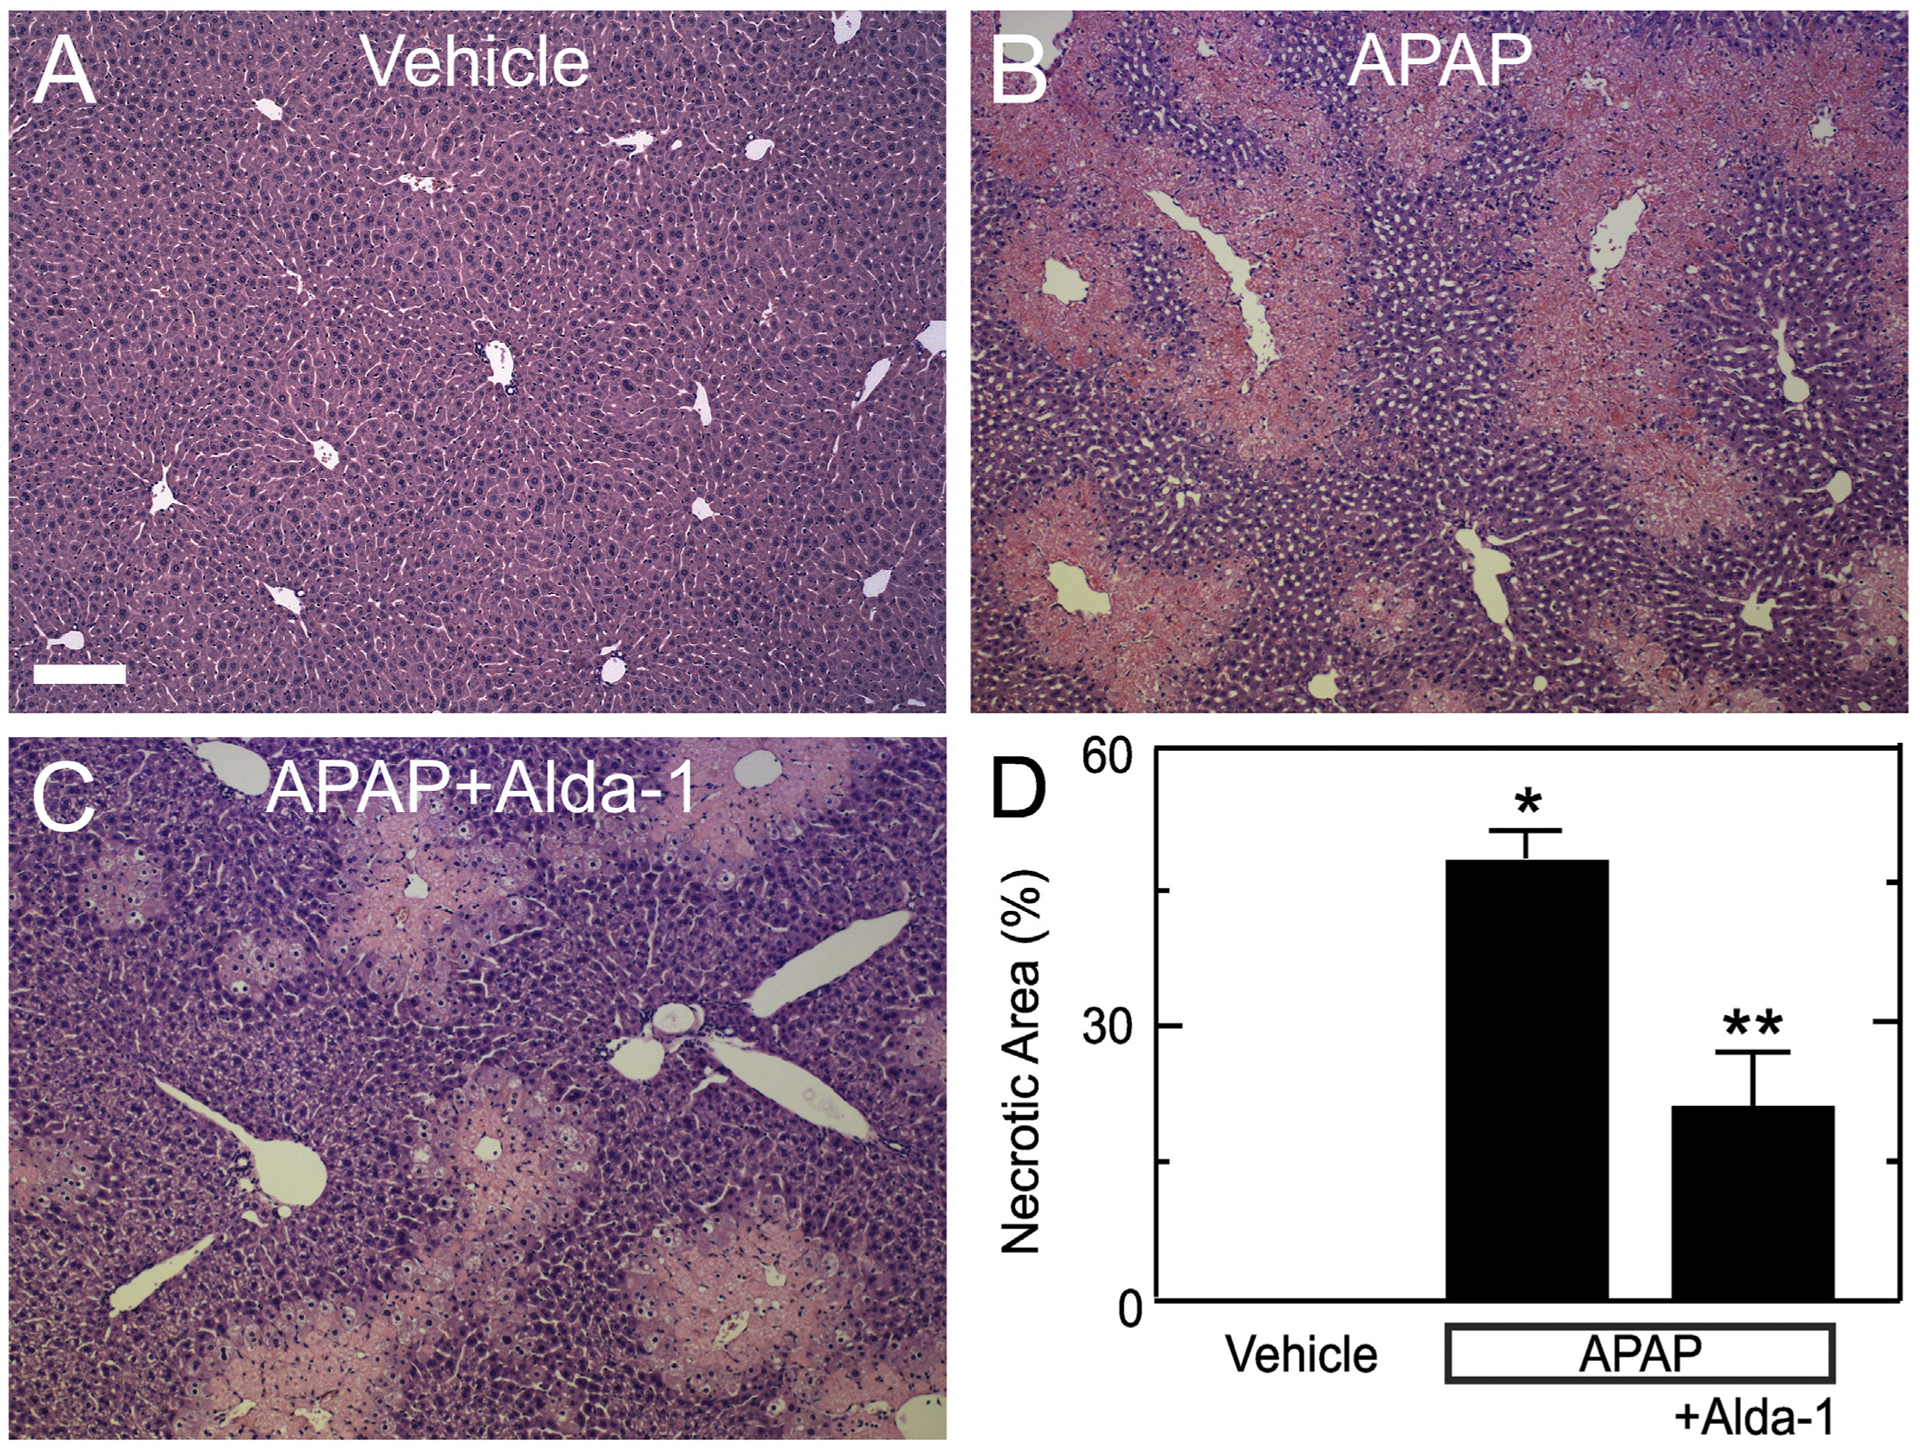
Alda-1 decreases centrilobular necrosis after acetaminophen overdose. Livers were harvested for H&E histology 24 h after treatment with vehicle only (A), APAP (B) and APAP plus Alda-1 (C). Ten random images were collected per slide using a 10× objective, and necrotic areas were quantified (D). Values are means ± SEM (n = 4, 3 and 4, respectively, for Vehicle, APAP and APAP plus Alda-1). Bar is 200 μm. *, p < .01 vs. Vehicle; **, p < .01 vs. APAP.
3.3. Alda-1 does not alter formation of NAPQI-protein adducts after APAP
The NAPQI intermediate of APAP metabolism is detoxified by conjugation with glutathione, but after the glutathione pool becomes depleted, NAPQI forms adducts with proteins (Bunchorntavakul and Reddy, 2018; Hinson et al., 2010; Ramachandran and Jaeschke, 2019; Yoon et al., 2016; Lancaster et al., 2015; Jaeschke et al., 2012). Accordingly, we measured NAPQI adducts to cysteine residues of proteins after APAP. As expected, NAPQI-protein adducts were undetectable in animals not given APAP (Fig. 3). After APAP, NAPQI-protein adducts increased to 0.34 ± 0.03 ng/mg protein (p < .01 vs no APAP, Fig. 3). With Alda-1 pretreatment before APAP, NAPQI-protein adducts remained high at 0.38 ± 0.03 ng/mg protein, which was not significantly different from APAP alone.
Fig. 3.
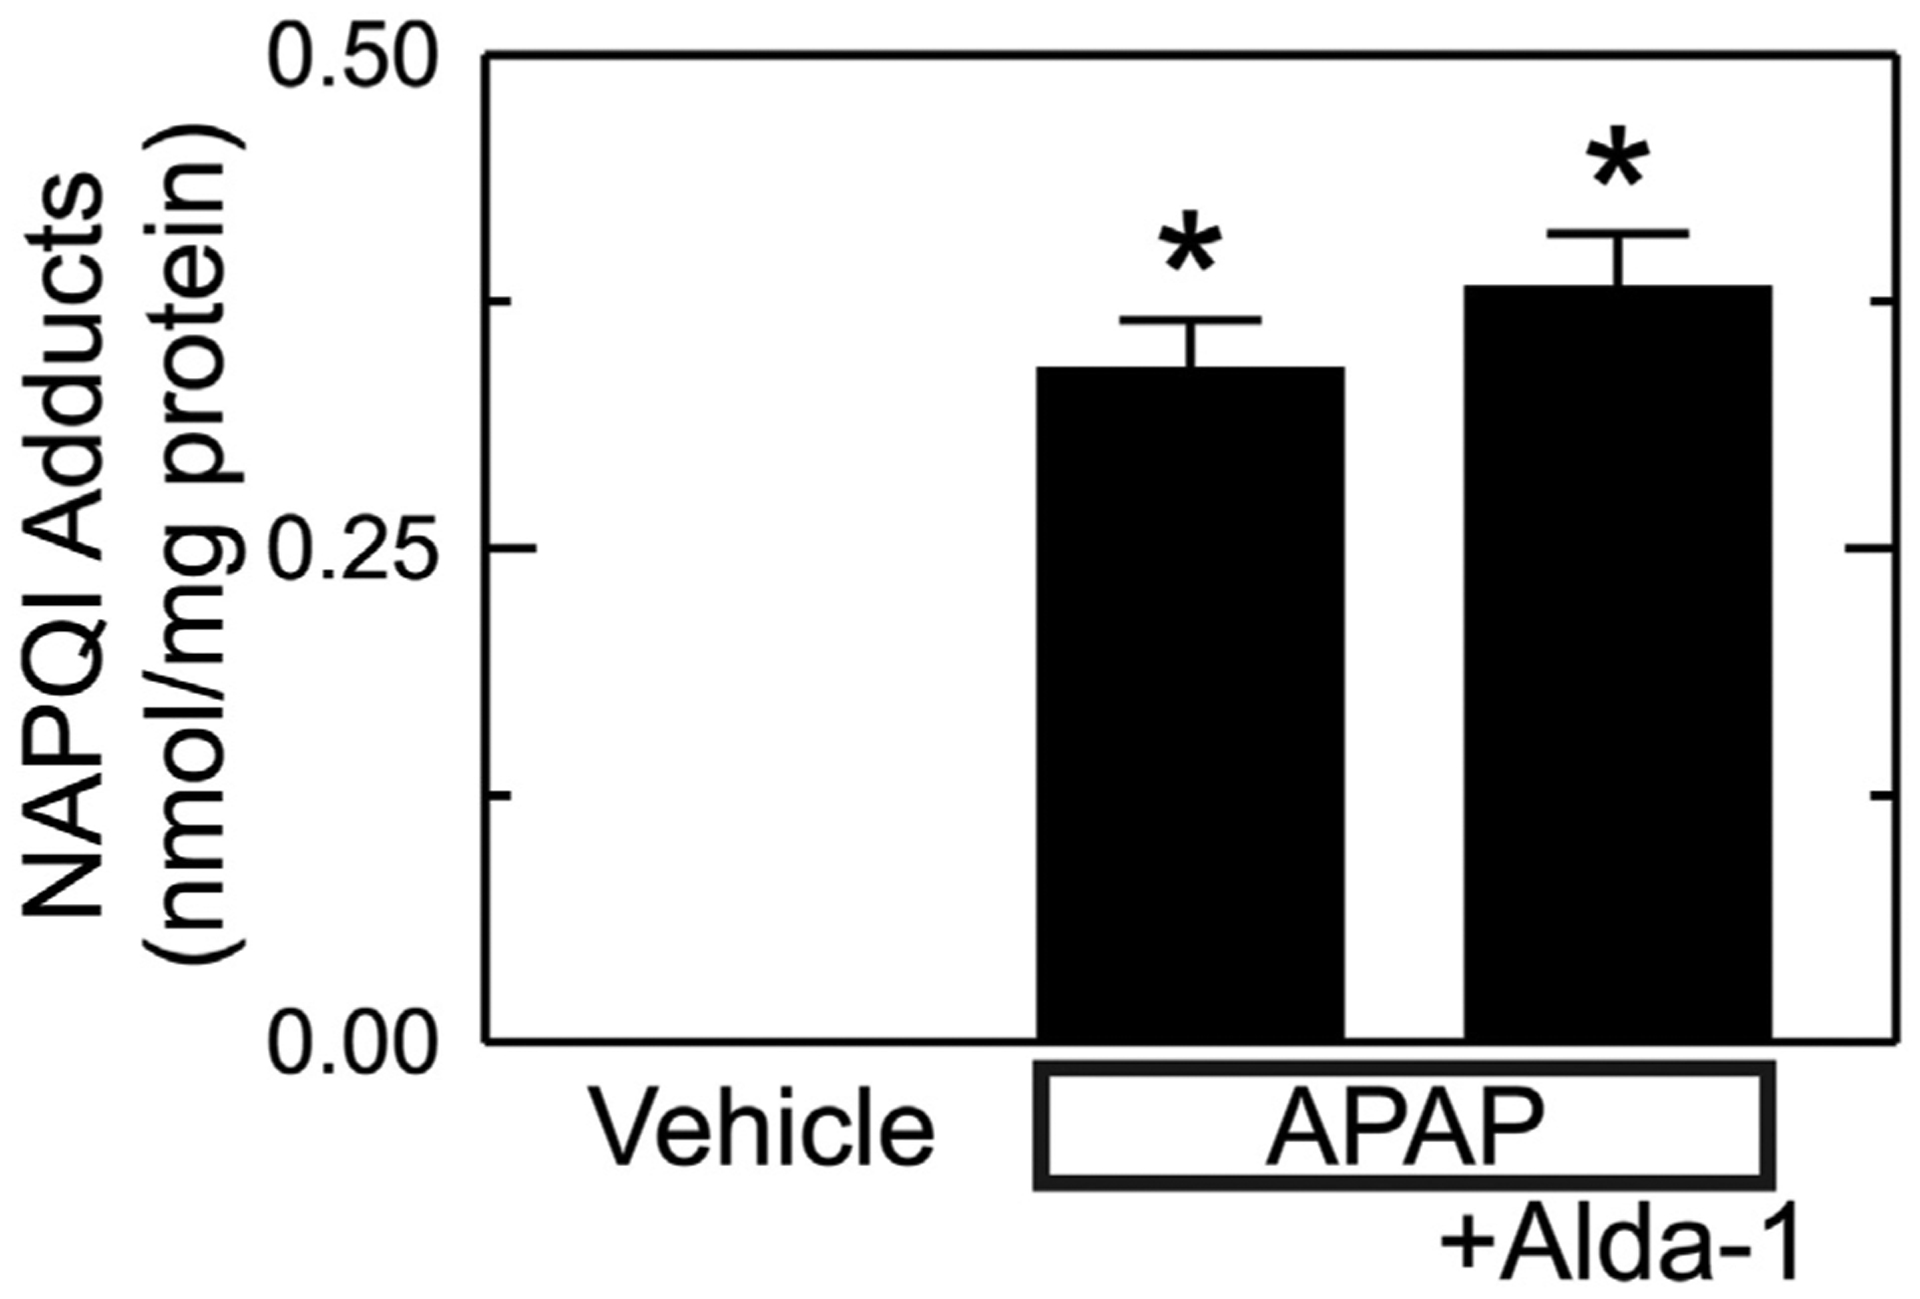
Alda-1 does not alter formation of NAPQI-protein adducts after APAP. Livers were harvested 2 h after vehicle only, APAP and APAP plus Alda-1 treatments. NAPQI-protein adducts were measured by HPLC. Values are mean ± SEM (n = 5/group). *, p < .01 vs. Vehicle.
3.4. Alda-1 does not decrease JNK activation after APAP
Previous studies show that JNK activation is involved in cell death after acetaminophen overdose (Han et al., 2013; Ramachandran and Jaeschke, 2019; Yoon et al., 2016). Accordingly, we assessed JNK and phospho-JNK (p-JNK) by immunoblotting. With vehicle only treatment, p-JNK was almost undetectable, and the ratio of p-JNK to JNK was0.10 ± 0.03 (Fig. 4). This ratio increased to 0.63 ± 0.06 after APAP treatment (p < .01 vs no APAP, Fig. 4). Alda-1 treatment did not significantly change JNK activation after APAP with p-JNK/JNK averaging0.56 ± 0.06.
Fig. 4.
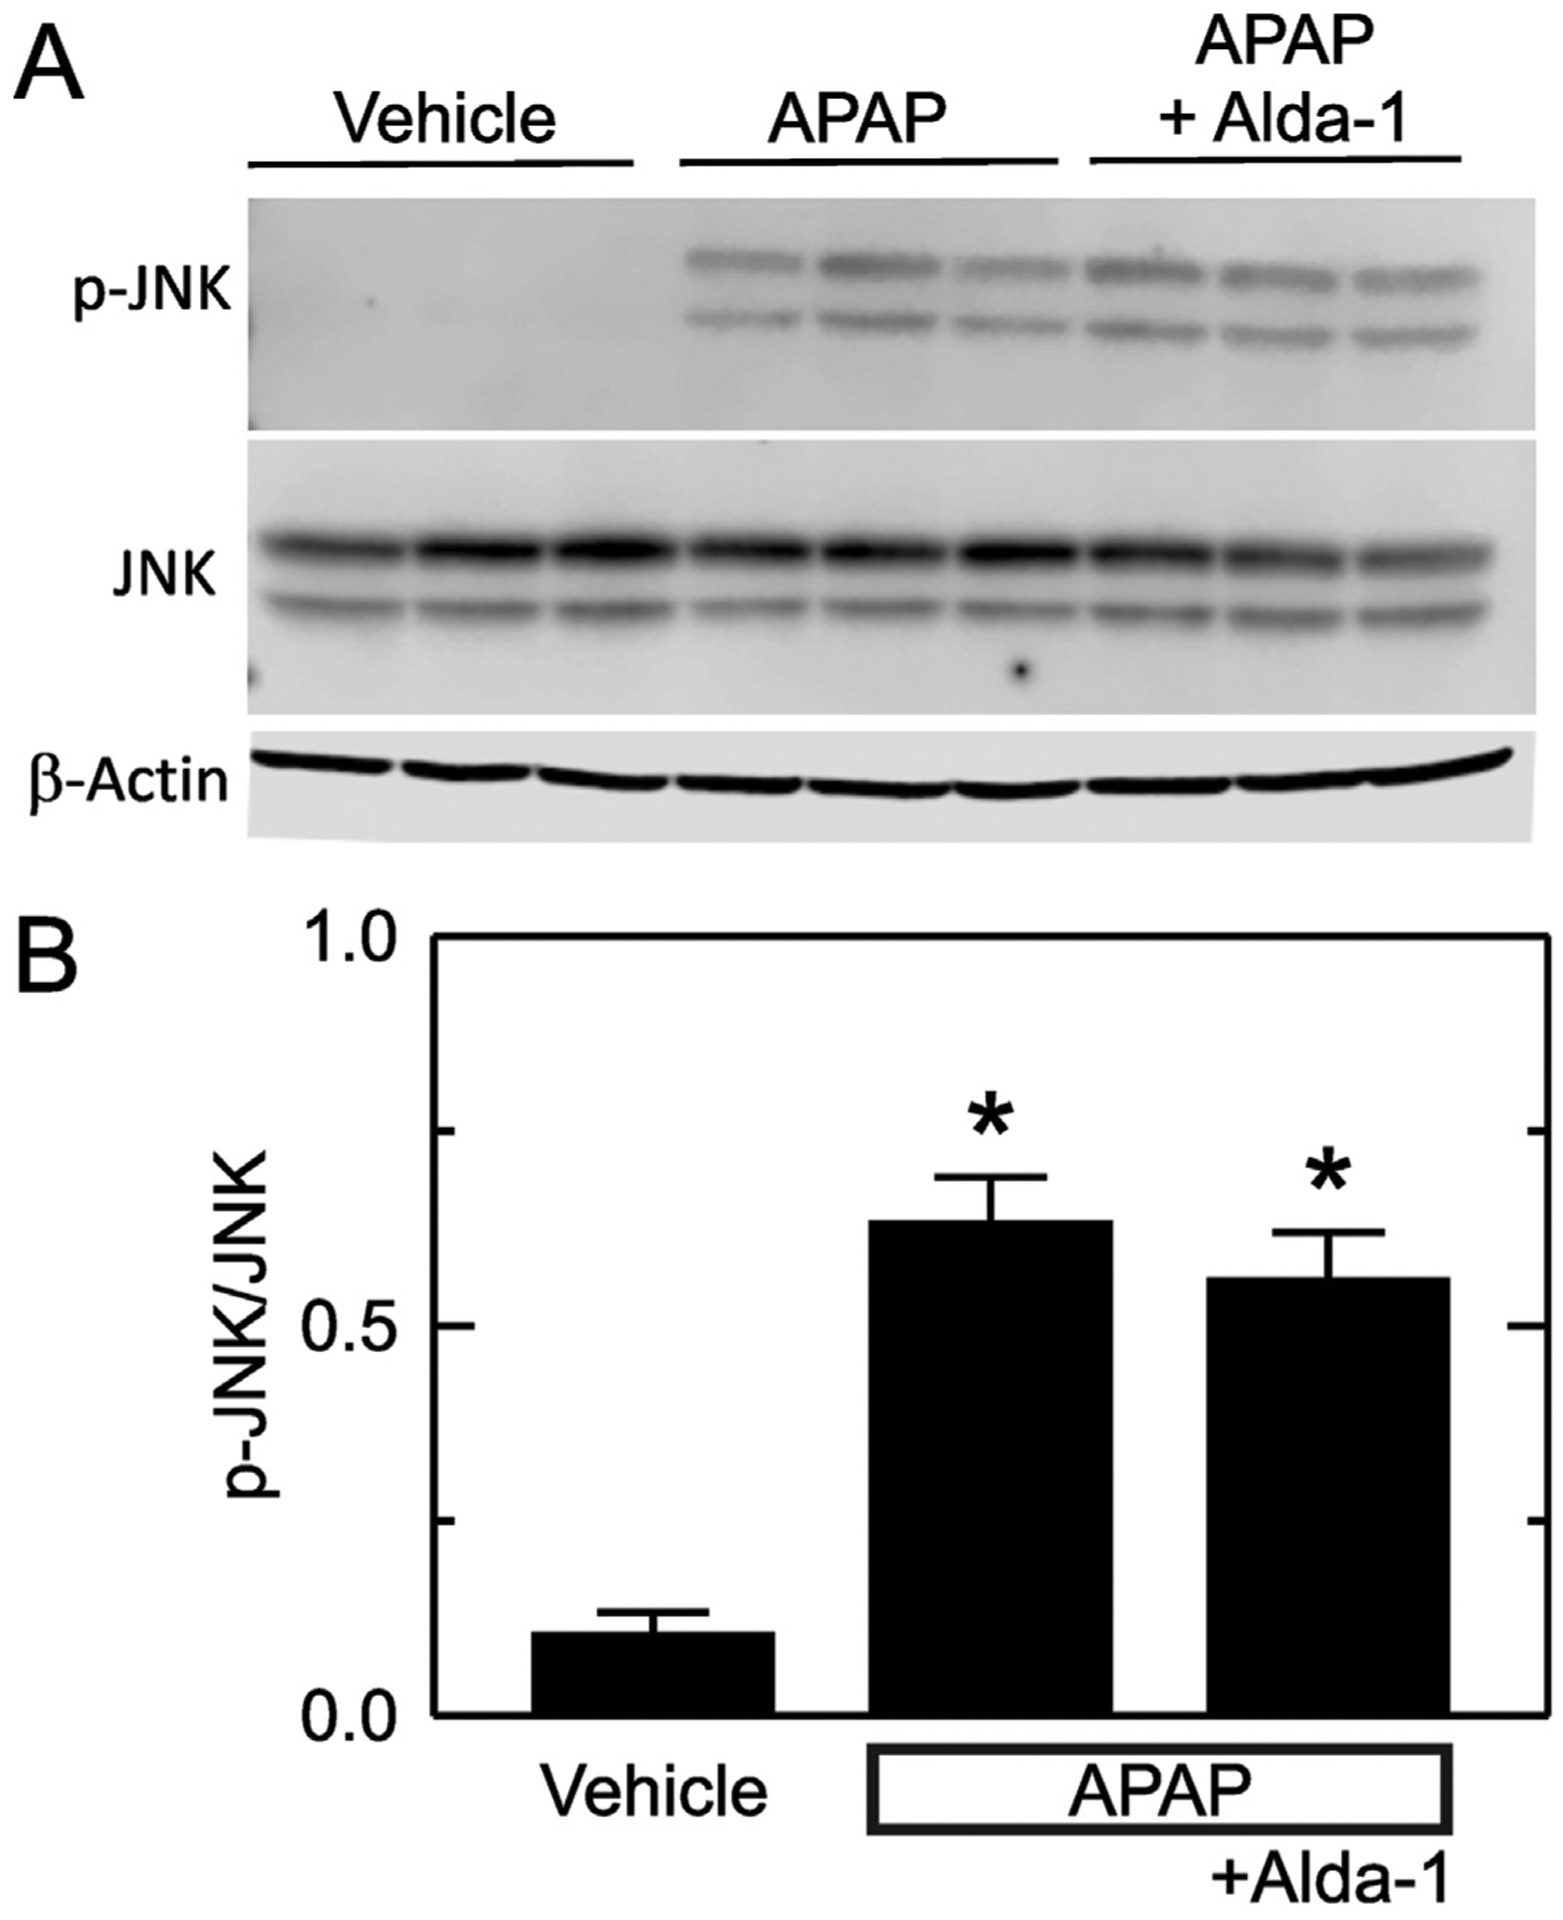
Alda-1 does not alter JNK activation after APAP. Livers were harvested 2 h after treatment with vehicle only, APAP and APAP plus Alda-1. JNK, p-JNK and β-actin were detected by immunoblotting, quantified by densitometry, and reported as p-JNK/JNK ratios. A shows representative images of p-JNK, JNK and β-actin immunoblots with n = 3/group. B shows quantified values as means ± SEM (n = 5/group). *, p < .05 vs. Vehicle.
3.5. Alda-1 decreases 4-hydroxynonenal-protein adduct formation after APAP
Lipid peroxidation produces aldehydes including 4-HNE. 4-HNE forms adducts with proteins that can be detected by immunohistochemistry. Without APAP, 4-HNE immunostaining was weak and corresponded to 0.13 ± 0.07% of the cross-sectional area (Fig. 5A and D). At 2 h after APAP, adducts increased to 7.3 ± 1.7% of area (p < .01 vs vehicle) (Fig. 5B and D). At this early time point, transaminases were not significantly increased, and no necrosis was evident by histology, which indicated that aldehyde production preceded cell death. Moreover, Alda-1 treatment decreased 4-HNE adducts at this 2 h timepoint to 1.0 ± 0.3% of area (p < .05 vs APAP) (Fig. 5C and D).
Fig. 5.
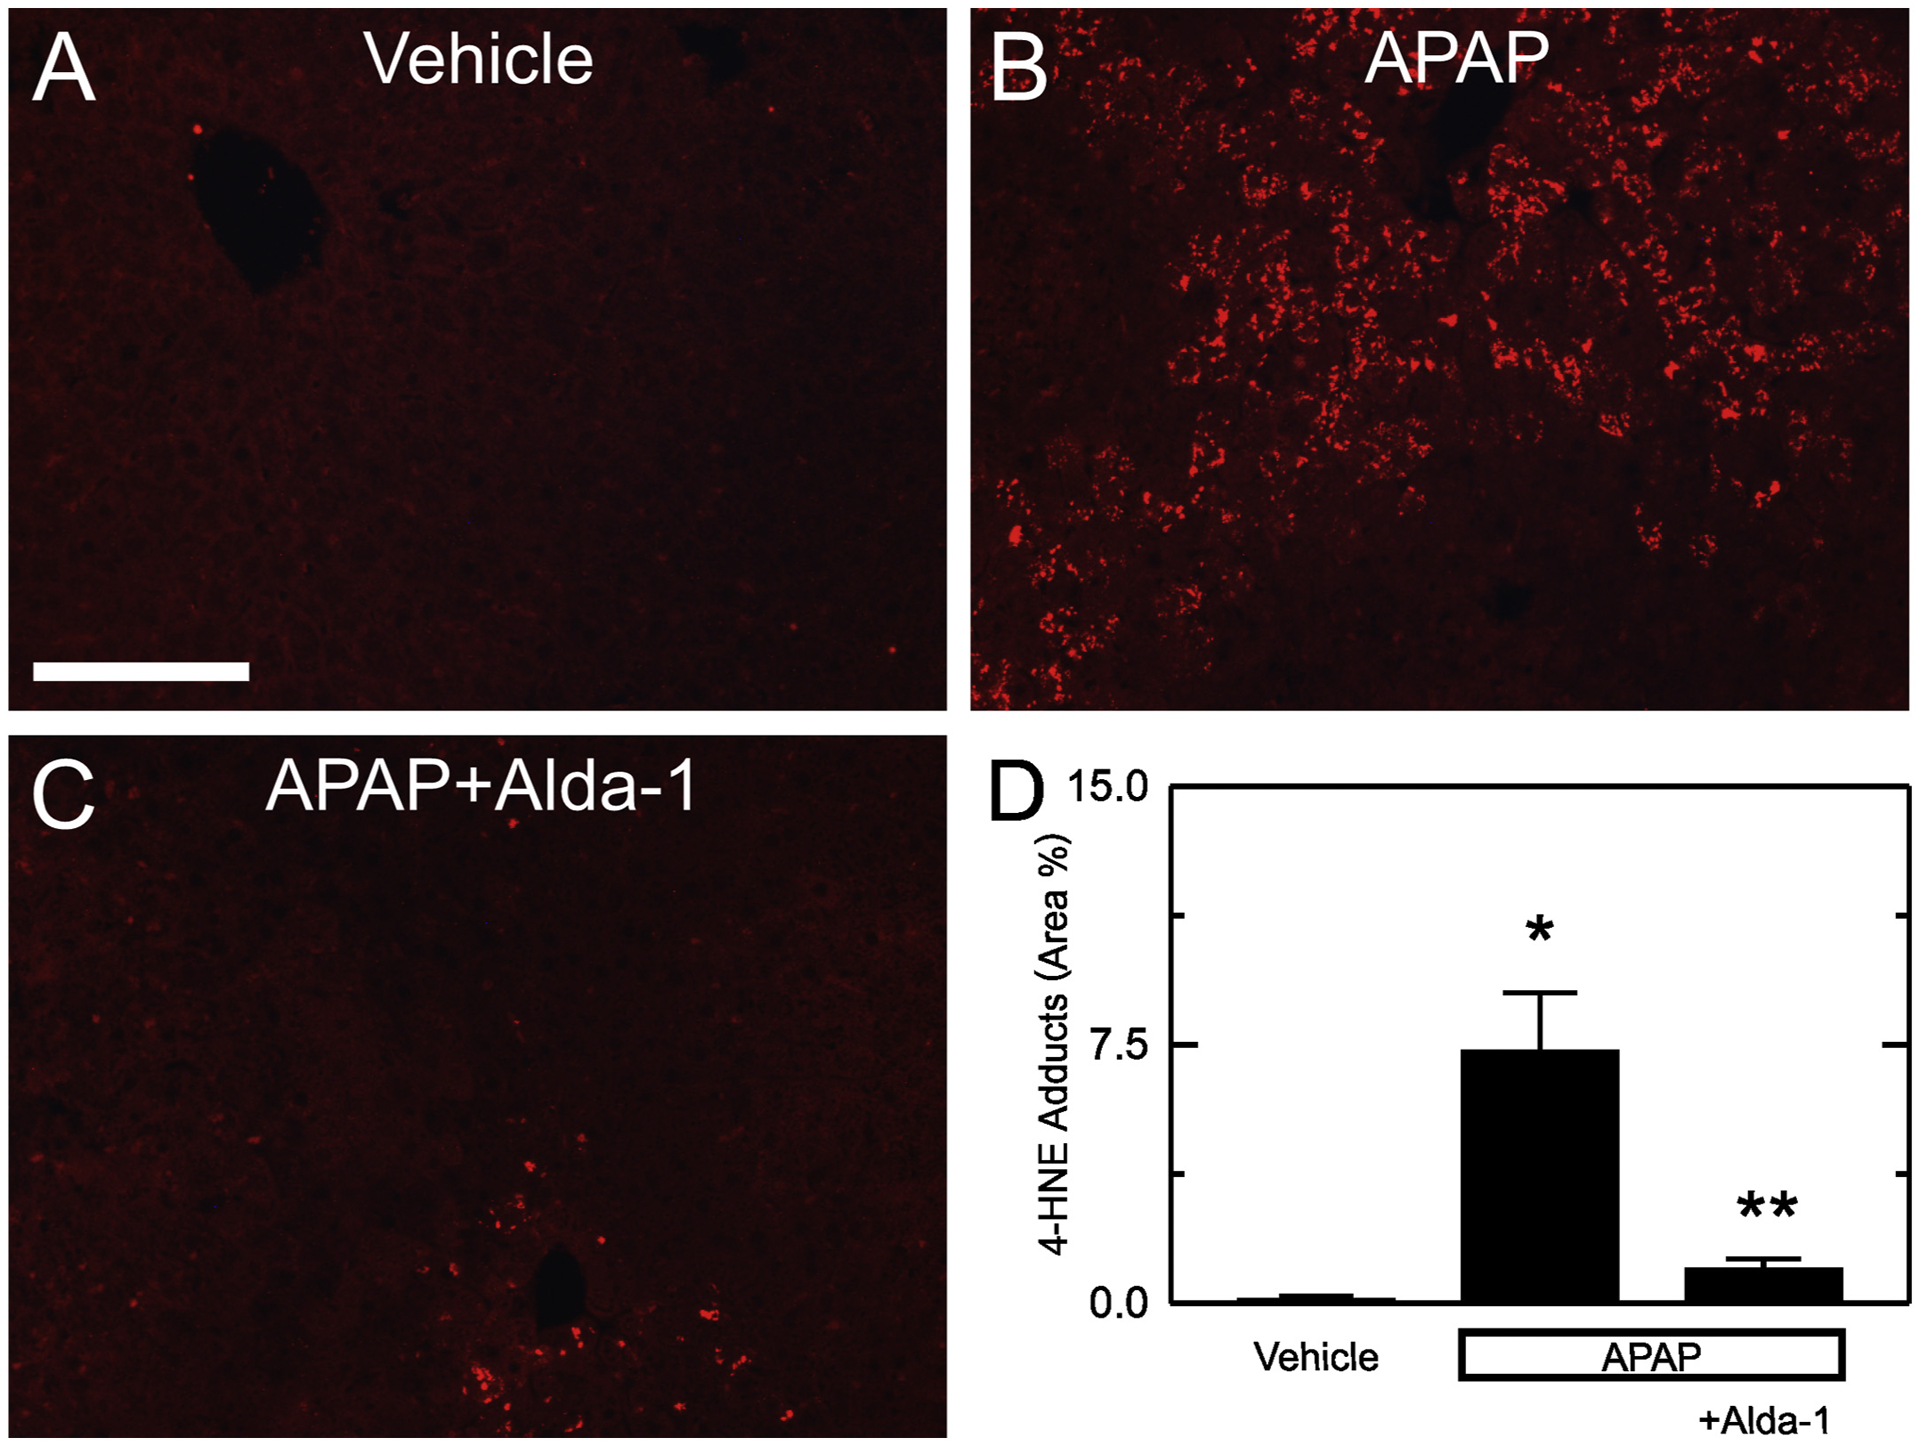
Alda-1 decreases 4-HNE adducts after APAP overdose. Livers were harvested for 4-HNE immunohistochemistry 2 h after treatment with vehicle only, APAP and APAP plus Alda-1. Shown are representative images of Vehicle only (A), APAP (B) and APAP plus Alda-1 (C). Ten random images were collected per slide using a 10× objective, and 4-HNE positive areas were quantified (D). Values are means ± SEM (n = 5/group). *, p < .05 vs. vehicle alone; **, p < .05 vs. APAP.
3.6. Alda-1 decreases mitochondrial depolarization and cell death after APAP
The mitochondrial permeability transition leads to mitochondrial depolarization and cell death after APAP overdose (Kon et al., 2004, 2010; Ramachandran and Jaeschke, 2019; Hu et al., 2016a; Jaeschke et al., 2012; Hu et al., 2016b). Accordingly, we measured mitochondrial depolarization and cell death using intravital microscopy of Rh123 and PI fluorescence at 6 h after vehicle or APAP administration. In mice without APAP treatment, green Rh123 fluorescence was punctate in virtually every hepatocyte, indicating mitochondrial polarization, and red PI labeling of nuclei was absent (Fig. 6A). After APAP treatment, depolarization increased to 62.3 ± 2.0% of cross-sectional area (p < .01 vs. vehicle only) (Fig. 6B and D), and the number of PI-labeled cells per 30× field increased to 6.8 ± 2.3 (p < .01 vs. vehicle) (Fig. 6B and E). With Alda-1 pretreatment, the area of mitochondrial depolarization after APAP decreased to 33.5 ± 3.4% (p < .01 vs APAP alone) (Fig. 6C and D), and the number of PI-labeled cells per field decreased to 0.6 ± 0.1 (p < .05 vs APAP alone) (Fig. 6C and E).
Fig. 6.
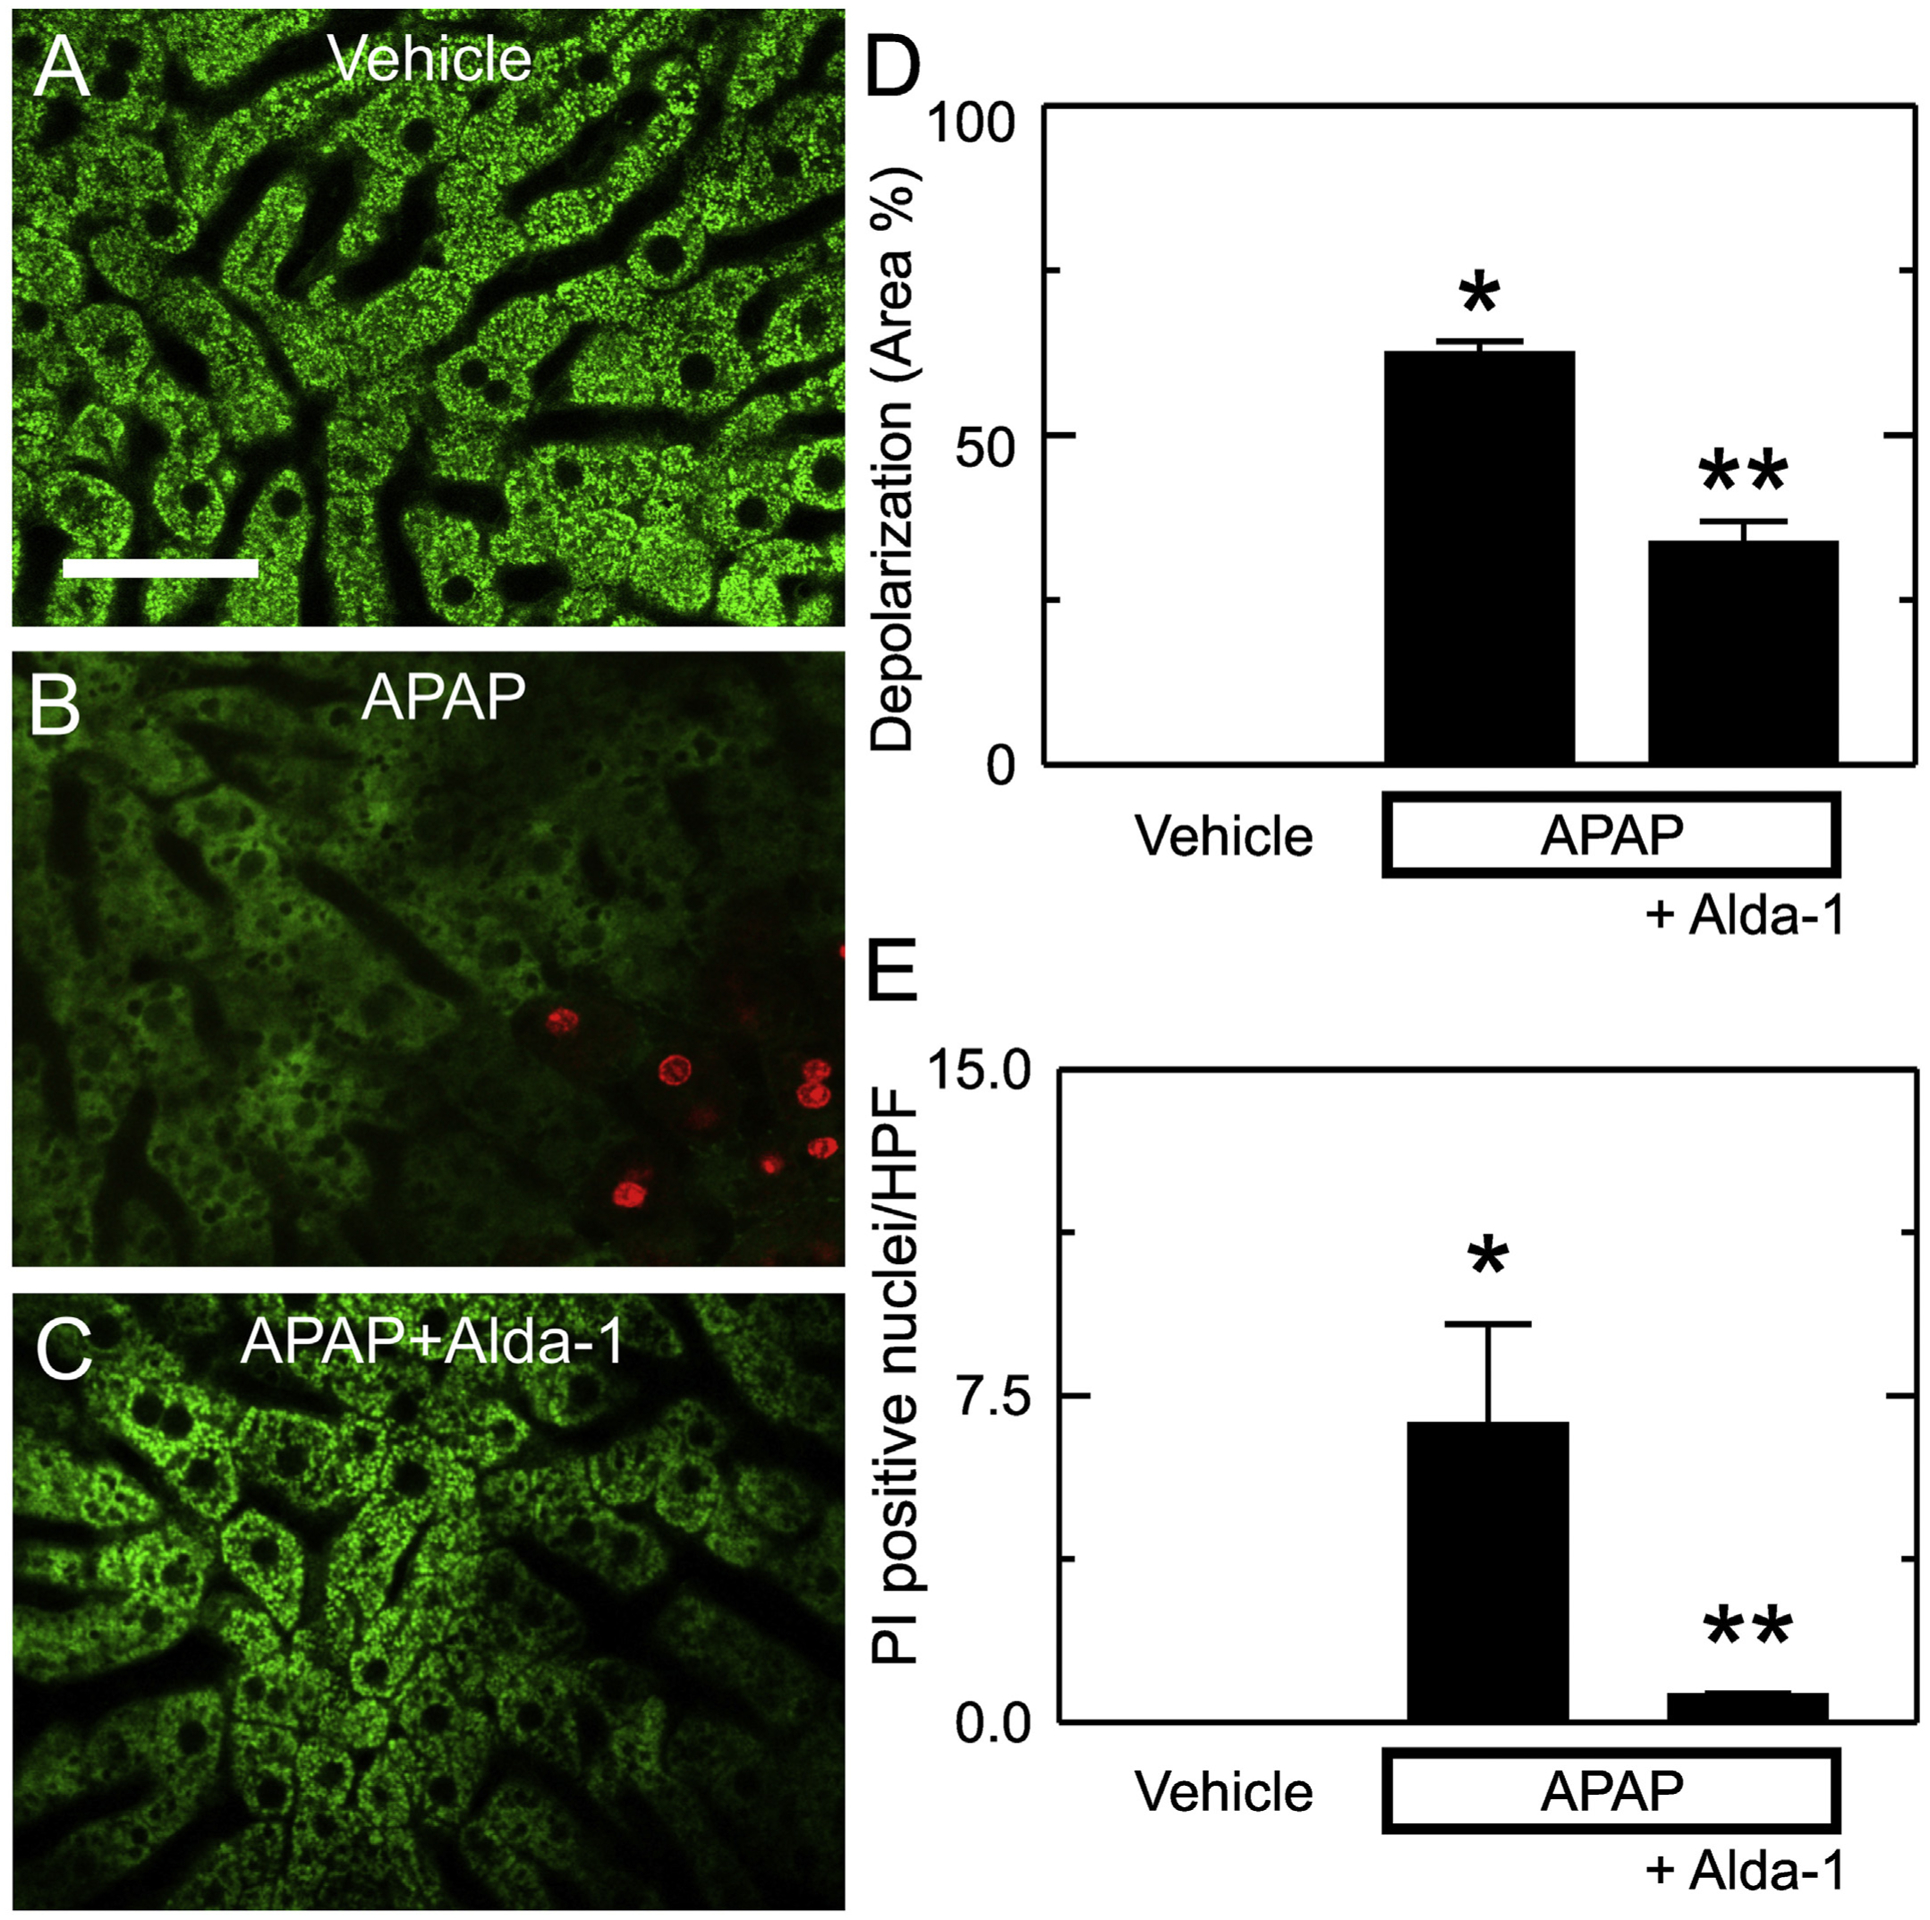
Alda-1 decreases mitochondrial depolarization and cell death after APAP overdose. Animals were infused with rhodamine 123 (green fluorescence) and PI (red fluorescence) 6 h after treatment with vehicle only, APAP, and APAP plus Alda-1. Livers were imaged 10 min later using two-photon intravital microscopy. Shown are representative images of Vehicle (A), APAP (B) and APAP plus Alda-1 (C). Bar is 100 μm. For each liver imaged, 10 random images were obtained using a 30× objective lens and quantified for depolarized area (D) and PI-positive nuclei per high power field (E). Values are means ± SEM (n = 3/group). *, p < .05 vs. Vehicle; **, p < .05 vs. APAP.
4. Discussion
4.1. Aldehydes are important mediators of acetaminophen hepatotoxicity
Despite the introduction of NAC treatment, APAP hepatotoxicity is still the most common cause of acute liver failure worldwide (Bunchorntavakul and Reddy, 2018; Hinson et al., 2010; Ramachandran and Jaeschke, 2019; Yoon et al., 2016). NAC, a glutathione precursor that promotes NAPQI detoxification (Corcoran et al., 1985a; Corcoran et al., 1985b; Lauterburg et al., 1983), is most effective in early stages of APAP hepatotoxicity. When administered at later stages, the therapeutic effect of NAC markedly decreases, although some protection can still be achieved, possibly through the antioxidant effect of NAC (Bunchorntavakul and Reddy, 2018). Additional studies are needed to further elucidate the mediators of APAP hepatotoxicity so that new therapeutic targets can be identified. While previous studies have demonstrated that ROS play a role in APAP hepatotoxicity, the specific contribution of aldehydes, products of lipid peroxidation, remains unclear. Free aldehydes readily form adducts with proteins and nucleic acids, disrupting their function (Panisello-Rosello et al., 2018). The electron transport chain of mitochondria is a main source of ROS underlying oxidant stress. The mitochondrial isoform of aldehyde dehydrogenase, ALDH2, detoxifies aldehydes including acetaldehyde, malondialdehyde, and 4-hydroxynonenal (4-HNE) among others (Chen et al., 2008; Perez-Miller et al., 2010; Klyosov, 1996).
Although Alda-1 has been studied in multiple models of liver injury, the effects of Alda-1 on APAP hepatotoxicity have never been reported. Since the mechanisms that underlie APAP hepatotoxicity (e.g., formation of NAPQI, activation of JNK, activation of ASK1, insufficient repair, etc.) are different qualitatively and quantitatively from those causing injury from ischemia/reperfusion, cholestasis and other stresses, the question of whether Alda-1 is protective in APAP hepatotoxicity could only be answered empirically. In this study, we investigated the role of aldehydes in APAP hepatotoxicity by using Alda-1, an ALDH2 activator, to enhance detoxification of aldehydes in mice that received an overdose of APAP.
Our results showed that 4-HNE protein adducts, an indicator of aldehyde production by beta-scission of peroxidized lipids (Novo and Parola, 2008; Di Meo et al., 2016), increased as early as 2 h after APAP administration (Fig. 5B and D) and preceded transaminase release and onset of necrosis. Notably, Alda-1 markedly blunted this increase of 4-HNE protein adducts at this early stage after APAP (Fig. 5C and D). These findings demonstrate that 1) 4-HNE adduct formation caused by APAP precedes liver damage; 2) activation of ALDH2 by Alda-1 decreases toxic aldehyde adduct formation caused by APAP to blunt subsequent liver damage; and 3) Alda-1 is not working by enhancing recovery but rather by preventing injury, since overt liver damage had not yet occurred at this very early timepoint. These data are consistent with the hypothesis that oxidative stress after APAP increases generation of toxic aldehydes that subsequently cause liver injury and that activation of ALDH2 accelerates degradation of these aldehydes, thus decreasing liver injury.
Serum ALT and AST increased markedly at later stages after APAP, changes that were strongly blunted by Alda-1 pretreatment (Fig. 1). Moreover, centrilobular necrosis occurring after APAP overdose was decreased by more than half with Alda-1 pretreatment (Fig. 2). These data clearly demonstrate that APAP-induced liver injury is associated with markedly increased reactive aldehyde production and that acceleration of aldehyde degradation effectively decreases APAP hepatotoxicity. This study showed for the first time that toxic aldehydes are responsible, at least in part, for liver damage caused by APAP overdose and represent a novel therapeutic target for APAP hepatotoxicity.
4.2. Acceleration of aldehyde detoxification decreases acetaminophen hepatotoxicity by protecting against mitochondrial dysfunction but not by altering acetaminophen metabolism or JNK activation
We explored how Alda-1 protects against APAP hepatotoxicity. Many events after APAP intoxication help mediate the pathogenesis of liver injury, such as NAPQI protein adduct formation, JNK activation, and onset of the MPT (Kon et al., 2004, 2010; Bunchorntavakul and Reddy, 2018; Hinson et al., 2010; Ramachandran and Jaeschke, 2019; Yoon et al., 2016; Lancaster et al., 2015; Jaeschke et al., 2012). Previous studies show that APAP overdose increases the proportion of APAP metabolized to NAPQI by cytochrome P450 (Bunchorntavakul and Reddy, 2018; Ramachandran and Jaeschke, 2019). Once GSH is depleted and can no longer detoxify NAPQI, NAPQI begins to form adducts with proteins and nucleic acids, altering their functions. This NAPQI adduct formation is a crucial step in APAP-induced liver injury (Bunchorntavakul and Reddy, 2018; Hinson et al., 2010; Ramachandran and Jaeschke, 2019; Yoon et al., 2016). Therefore, we explored whether Alda-1 decreases APAP hepatotoxicity by alteration of APAP metabolism. We showed that NAPQI-protein adduct formation markedly increased after APAP treatment, but NAPQI-protein adduct formation was not decreased by Alda-1 (Fig. 3). Therefore, Alda-1 protection is not due to alteration of APAP metabolism (Fig. 7).
Fig. 7.
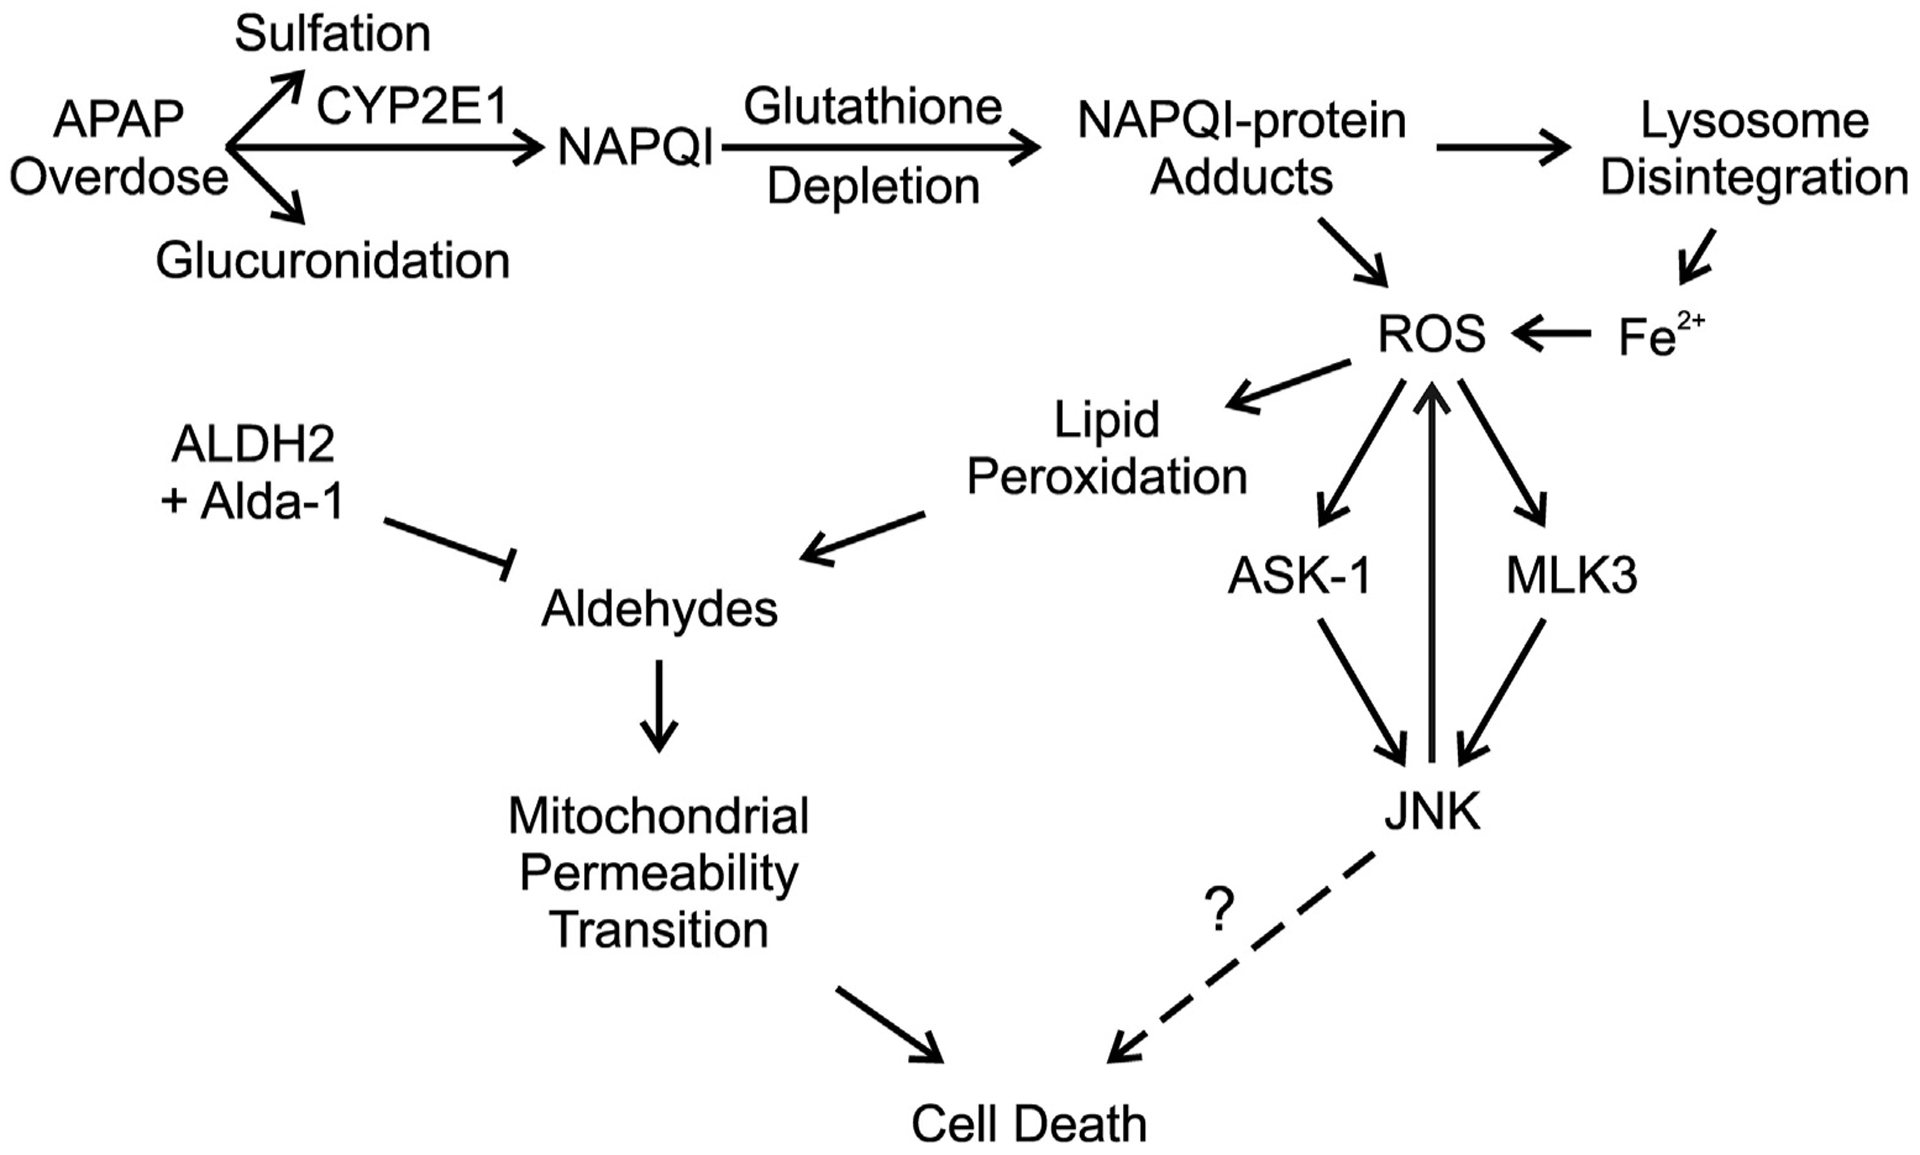
Aldehyde dehydrogenase-2 activation by Alda-1 decreases acetaminophen hepatotoxicity by detoxifying aldehydes and preventing the mitochondrial permeability transition. An overdose of APAP saturates the sulfation and glucuronidation pathways causing a greater proportion of APAP to be metabolized to NAPQI. Excess NAPQI causes depletion of GSH, leading to the formation of NAPQI protein adducts in mitochondria and promoting lysosomal disruption with release of Fe2+, which translocates into mitochondria. The resulting increase of iron-catalyzed mitochondrial ROS formation causes JNK activation via the ASK1 and MLK3 pathways. Activated JNK also promotes increased mitochondrial ROS formation, which feeds back to cause more stimulation of ASK1 and MLK3. ROS formation then causes lipid peroxidation, leading to aldehyde formation. These aldehydes promote onset of the MPT and cell death. Detoxification of aldehydes by ALDH2 activated by Alda-1 decreases cell death by preventing the MPT.
JNK activation is also linked to APAP hepatotoxicity, and previous studies show that JNK inhibitors decrease APAP-induced liver injury (Hu et al., 2016a; Ramachandran and Jaeschke, 2019; Han et al., 2013). NAPQI forms adducts with mitochondrial proteins of the electron transport chain, leading to increased ROS production. Apoptosis signal-regulating kinase 1 (ASK1, MAP3K5) and mitogen-activated protein kinase kinase kinase 11 (MLK3, MAP3K11) are the upstream kinases that activate JNK and are themselves activated by increased ROS (Ramachandran and Jaeschke, 2019). JNK activation is associated with prevention of apoptosis but potentiation of necrosis (Ventura et al., 2004). This may explain why the dominant form of cell death is necrosis rather than apoptosis in APAP hepatotoxicity. Furthermore, persistent JNK activation can also increase ROS production thus further exacerbating necrosis (Ventura et al., 2004). Since JNK activation is associated with ROS formation, we explored whether aldehydes mediate JNK activation. JNK activation increased as early as 2 h after APAP administration. However, Alda-1 did not alter JNK activation (Fig. 4). These data showed that Alda-1 protection against APAP hepatotoxicity is not due to inhibition of JNK activation (Fig. 7). A possible explanation for this phenomenon is that ASK1 and MLK3 are activated by ROS but not by aldehydes.
Previous studies demonstrate that onset of the MPT plays a critical role in APAP hepatotoxicity (Ramachandran and Jaeschke, 2019; Hu et al., 2016a; Jaeschke et al., 2012; Hu et al., 2016b; Kon et al., 2004). The MPT is caused by opening of permeability transition (PT) pores in the mitochondrial inner membrane, leading to collapse of mitochondrial membrane potential, decreased ATP production and necrotic cell death (Ramachandran and Jaeschke, 2019; Hu et al., 2016a; Jaeschke et al., 2012; Kon et al., 2004; Kim et al., 2003). The MPT can also trigger apoptosis by causing release of proapoptotic factors such as cytochrome c (Kim et al., 2003). APAP causes onset of the MPT in both cultured hepatocytes and in vivo (Hu et al., 2016a; Kon et al., 2004). The MPT inhibitors cyclosporin A and NIM811 decrease APAP-induced necrotic cell death (Hu et al., 2016a; Kon et al., 2004). ROS, JNK activation with translocation to mitochondria, and iron movement from lysosomes into mitochondria all help trigger the MPT (Han et al., 2013; Hu et al., 2016a; Hu et al., 2016b; Kon et al., 2004, 2010) (Fig. 7). The present study confirmed that mitochondrial depolarization occurs after APAP, indicating onset of the MPT (Fig. 6). Importantly, Alda-1 decreased mitochondrial depolarization and subsequent cell death (Fig. 6). These results show that aldehydes contribute to initiating the onset of the MPT, thus leading to liver injury after APAP overdose (Fig. 7). Aldehydes including 4-HNE are previously reported to promote the MPT in isolated liver mitochondria and to be involved in the pathogenesis of cardiovascular diseases (Kristal et al., 1996; Mali and Palaniyandi, 2014). Overall, we showed that Alda-1 protects against APAP hepatotoxicity by preventing the MPT and mitochondrial depolarization but not by decreasing NAPQI formation or activation of JNK.
Taken together, this study demonstrates for the first time that aldehydes are important mediators of APAP hepatotoxicity and that acceleration of aldehyde degradation is a promising approach to decrease APAP-induced liver injury. Moreover, this study demonstrates that Alda-1 protection is not due to decreased APAP metabolism or inhibition of JNK activation but is mediated by prevention of aldehyde-induced mitochondrial dysfunction after APAP overdose (Fig. 7). Mitochondria are at particular risk of lipid peroxidation due to active production of ROS from the respiratory chain and the high content of unsaturated phospholipids in mitochondrial membranes. Therefore mitochondria are likely exposed to high levels of reactive aldehydes (Murphy, 2009). Overall, activation of ALDH2 to increase the rate of aldehyde detoxification is a promising therapeutic strategy to prevent mitochondrial dysfunction and protect cells in high ROS environments, such as occurs in APAP hepatotoxicity. Future studies will be needed to determine the dose and time dependency for efficacy of Alda-1 to treat rather than prevent APAP hepatotoxicity in comparison with NAC, the currently approved therapy.
Acknowledgement
This work was supported, in part, by grants F31DK108570, T32DK083262, AA021191, AA025379, and DK073336, DK102142 from the National Institutes of Health. The Cell & Molecular Imaging Shared Resource of the Hollings Cancer Center at the Medical University of South Carolina was supported by NIH Grant 1 P30 CA138313, and Shared Instrumentation Grant 1S10 OD018113 provided instrumentation for microscopy. Granting agencies were not involved in the study design, collection, analysis, data interpretation, preparation of the manuscript or other aspects of the study beyond funding.
Abbreviations:
- 4-HNE
4-hydroxynonenal
- Alda-1
N-(1,3-benzodioxol-5-ylmethyl)-2,6-dichlorobenzamide
- ALT
alanine aminotransferase
- ALDH2
aldehyde dehydrogenase-2
- APAP
acetaminophen
- ASK1
apoptosis signal-regulating kinase 1
- AST
aspartate aminotransferase
- Cyp2E1
cytochrome P450 2E1
- GSH
glutathione
- H&E
hematoxylin and eosin
- JNK
c-Jun N-terminal kinase
- MAP3K11
mitogen-activated protein kinase kinase kinase 11
- MDA
malondialdehyde
- MPT
mitochondrial permeability transition
- MLK3
mixed-lineage protein kinase 3
- NAC
N-acetylcysteine
- NAPQI
N-acetyl-p-benzoquinone imine
- PI
propidium iodide
- Rh123
rhodamine 123
- ROS
reactive oxygen species
Footnotes
Declaration of Competing Interest
The authors declare that they have no competing financial interests or personal relationships that could have appeared to influence the work reported in this paper.
References
- Akakpo JY, Ramachandran A, Kandel SE, Ni HM, Kumer SC, Rumack BH,Jaeschke H, 2018. 4-Methylpyrazole protects against acetaminophen hepatotoxicity in mice and in primary human hepatocytes. Hum. Exp. Toxicol 37, 1310–1322. [DOI] [PMC free article] [PubMed] [Google Scholar]
- Akakpo JY, Ramachandran A, Duan L, Schaich MA, Jaeschke MW, Freudenthal BD, Ding WX, Rumack BH, Jaeschke H, 2019. Delayed treatment with 4-Methylpyrazole protects against acetaminophen hepatotoxicity in mice by inhibition of c-Jun N-terminal kinase. Toxicol. Sci [DOI] [PMC free article] [PubMed] [Google Scholar]
- Anderson EJ, Katunga LA, Willis MS, 2012. Mitochondria as a source and target of lipid peroxidation products in healthy and diseased heart. Clin. Exp. Pharmacol. Physiol 170, 57–68. [DOI] [PMC free article] [PubMed] [Google Scholar]
- Bunchorntavakul C, Reddy KR, 2013. Acetaminophen-related hepatotoxicity. ClinLiver Dis 17, 587–607 (viii). [DOI] [PubMed] [Google Scholar]
- Bunchorntavakul C, Reddy KR, 2018. Acetaminophen (APAP or N-acetyl-p-aminophenol) and acute liver failure. Clin Liver Dis 22, 325–346. [DOI] [PubMed] [Google Scholar]
- Chaudhuri S, McCullough SS, Hennings L, Brown AT, Li SH, Simpson PM,Hinson JA, James LP, 2012. Effect of trifluoperazine on toxicity, HIF-1alpha induction and hepatocyte regeneration in acetaminophen toxicity in mice. Toxicol. Appl. Pharmacol 264, 192–201. [DOI] [PMC free article] [PubMed] [Google Scholar]
- Chen CH, Budas GR, Churchill EN, Disatnik MH, Hurley TD, Mochly-Rosen D, 2008. Activation of aldehyde dehydrogenase-2 reduces ischemic damage to the heart. Science 321, 1493–1495. [DOI] [PMC free article] [PubMed] [Google Scholar]
- Corcoran GB, Racz WJ, Smith CV, Mitchell JR, 1985a. Effects of N-acetylcysteine on acetaminophen covalent binding and hepatic necrosis in mice. J. Pharmacol. Exp. Ther 232, 864–872. [PubMed] [Google Scholar]
- Corcoran GB, Todd EL, Racz WJ, Hughes H, Smith CV, Mitchell JR, 1985b. Effects of N-acetylcysteine on the disposition and metabolism of acetaminophen in mice. J. Pharmacol. Exp. Ther 232, 857–863. [PubMed] [Google Scholar]
- Di Meo S, Reed TT, Venditti P, Victor VM, 2016. Role of ROS and RNS sources in physiological and pathological conditions. Oxidative Med. Cell. Longev 2016, 1245049. [DOI] [PMC free article] [PubMed] [Google Scholar]
- Ding J, Zhang Q, Luo Q, Ying Y, Liu Y, Li Y, Wei W, Yan F, Zhang H, 2016. Alda-1 attenuates lung ischemia-reperfusion injury by reducing 4-hydroxy-2-nonenal in alveolar epithelial cells. Crit. Care Med 44, e544–e552. [DOI] [PubMed] [Google Scholar]
- Fu SH, Zhang HF, Yang ZB, Li TB, Liu B, Lou Z, Ma QL, Luo XJ, Peng J, 2014. Alda-1 reduces cerebral ischemia/reperfusion injury in rat through clearance of reactive aldehydes. Naunyn Schmiedeberg’s Arch. Pharmacol 387, 87–94. [DOI] [PubMed] [Google Scholar]
- Han D, Dara L, Win S, Than TA, Yuan L, Abbasi SQ, Liu ZX, Kaplowitz N, 2013. Regulation of drug-induced liver injury by signal transduction pathways: critical role of mitochondria. Trends Pharmacol. Sci 34, 243–253. [DOI] [PMC free article] [PubMed] [Google Scholar]
- Hinson JA, Roberts DW, James LP, 2010. Mechanisms of acetaminophen-induced liver necrosis. Handb. Exp. Pharmacol 369–405. [DOI] [PMC free article] [PubMed] [Google Scholar]
- Hu J, Ramshesh VK, McGill MR, Jaeschke H, Lemasters JJ, 2016a. Low dose acetaminophen induces reversible mitochondrial dysfunction associated with transient c-Jun n-terminal kinase activation in mouse liver. Toxicol. Sci 150, 204–215. [DOI] [PMC free article] [PubMed] [Google Scholar]
- Hu J, Kholmukhamedov A, Lindsey CC, Beeson CC, Jaeschke H, Lemasters JJ, 2016b. Translocation of iron from lysosomes to mitochondria during acetaminophen-induced hepatocellular injury: protection by starch-desferal and minocycline. Free Radic. Biol. Med 97, 418–426. [DOI] [PMC free article] [PubMed] [Google Scholar]
- Jaeschke H, McGill MR, Ramachandran A, 2012. Oxidant stress, mitochondria, and cell death mechanisms in drug-induced liver injury: lessons learned from acetaminophen hepatotoxicity. Drug Metab. Rev 44, 88–106. [DOI] [PMC free article] [PubMed] [Google Scholar]
- Kim JS, He L, Lemasters JJ, 2003. Mitochondrial permeability transition: a common pathway to necrosis and apoptosis. Biochem. Biophys. Res. Commun 304, 463–470. [DOI] [PubMed] [Google Scholar]
- Klyosov AA, 1996. Kinetics and specificity of human liver aldehyde dehydrogenases toward aliphatic, aromatic, and fused polycyclic aldehydes. Biochemistry 35, 4457–4467. [DOI] [PubMed] [Google Scholar]
- Kon K, Kim JS, Jaeschke H, Lemasters JJ, 2004. Mitochondrial permeability transition in acetaminophen-induced necrosis and apoptosis of cultured mouse hepatocytes. Hepatology 40, 1170–1179. [DOI] [PubMed] [Google Scholar]
- Kon K, Kim JS, Uchiyama A, Jaeschke H, Lemasters JJ, 2010. Lysosomal iron mobilization and induction of the mitochondrial permeability transition in acetaminophen-induced toxicity to mouse hepatocytes. Toxicol Sci. 117, 101–108. [DOI] [PMC free article] [PubMed] [Google Scholar]
- Krishnasamy Y, Ramshesh VK, Gooz M, Schnellmann RG, Lemasters JJ, Zhong Z, 2016. Ethanol and high cholesterol diet causes severe steatohepatitis and early liver fibrosis in mice. PLoS One 11, e0163342. [DOI] [PMC free article] [PubMed] [Google Scholar]
- Kristal BS, Park BK, Yu BP, 1996. 4-Hydroxyhexenal is a potent inducer of the mitochondrial permeability transition. J. Biol. Chem 271, 6033–6038. [DOI] [PubMed] [Google Scholar]
- Lancaster EM, Hiatt JR, Zarrinpar A, 2015. Acetaminophen hepatotoxicity: an updated review. Arch. Toxicol 89, 193–199. [DOI] [PubMed] [Google Scholar]
- Lauterburg BH, Corcoran GB, Mitchell JR, 1983. Mechanism of action of N-acetylcysteine in the protection against the hepatotoxicity of acetaminophen in rats in vivo. J. Clin. Invest 71, 980–991. [DOI] [PMC free article] [PubMed] [Google Scholar]
- Liu X, Jin G, Fan B, Xing Y, Wang L, Wang M, Yuan Y, Zhu Q, 2018. The impact of ALDH2 activation by Alda-1 on the expression of VEGF in the hippocampus of a rat model of post-MI depression. Neurosci. Lett 674, 156–161. [DOI] [PubMed] [Google Scholar]
- Mali VR, Palaniyandi SS, 2014. Regulation and therapeutic strategies of 4-hydroxy-2-nonenal metabolism in heart disease. Free Radic. Res 48, 251–263. [DOI] [PubMed] [Google Scholar]
- McGill MR, Williams CD, Xie Y, Ramachandran A, Jaeschke H, 2012Acetaminophen-induced liver injury in rats and mice: comparison of protein adducts, mitochondrial dysfunction, and oxidative stress in the mechanism of toxicity. Toxicol. Appl. Pharmacol 264, 387–394. [DOI] [PMC free article] [PubMed] [Google Scholar]
- Murphy MP, 2009. How mitochondria produce reactive oxygen species. Biochem. J 417, 1–13. [DOI] [PMC free article] [PubMed] [Google Scholar]
- Ning S, Budas GR, Churchill EN, Chen CH, Knox SJ, Mochly-Rosen D, 2012. Mitigation of radiation-induced dermatitis by activation of aldehyde dehydrogenase 2 using topical alda-1 in mice. Radiat. Res 178, 69–74. [DOI] [PMC free article] [PubMed] [Google Scholar]
- Novo E, Parola M, 2008. Redox mechanisms in hepatic chronic wound healing and fibrogenesis. Fibrogenesis Tissue Repair 1, 5. [DOI] [PMC free article] [PubMed] [Google Scholar]
- Pang J, Peng H, Wang S, Xu X, Xu F, Wang Q, Chen Y, Barton LA, Chen Y, Zhang Y, Ren J, 1865. Mitochondrial ALDH2 protects against lipopolysaccharide-induced myocardial contractile dysfunction by suppression of ER stress and autophagy. Biochim. Biophys. Acta Mol. basis Dis 2019, 1627–1641. 10.1186/1755-1536-1-5. [DOI] [PubMed] [Google Scholar]
- Panisello-Rosello A, Lopez A, Folch-Puy E, Carbonell T, Rolo A, Palmeira C, Adam R, Net M, Rosello-Catafau J, 2018. Role of aldehyde dehydrogenase 2 in ischemia reperfusion injury: an update. World J. Gastroenterol 24, 2984–2994. [DOI] [PMC free article] [PubMed] [Google Scholar]
- Perez-Miller S, Younus H, Vanam R, Chen CH, Mochly-Rosen D, Hurley TD, 2010. Alda-1 is an agonist and chemical chaperone for the common human aldehyde dehydrogenase 2 variant. Nat. Struct. Mol. Biol 17, 159–164. [DOI] [PMC free article] [PubMed] [Google Scholar]
- Ramachandran A, Jaeschke H, 2019. Mechanisms of acetaminophen hepatotoxicity and their translation to the human pathophysiology. Acetaminophen hepatotoxicity. Semin. Liver Dis 39, 221–234. [DOI] [PMC free article] [PubMed] [Google Scholar]
- Schindelin J, Arganda-Carreras I, Frise E, Kaynig V, Longair M, Pietzsch T,Preibisch S, Rueden C, Saalfeld S, Schmid B, Tinevez JY, White DJ, Hartenstein V, Eliceiri K, Tomancak P, Cardona A, 2012. Fiji: an open-source platform for biological-image analysis. Nat. Methods 9, 676–682. [DOI] [PMC free article] [PubMed] [Google Scholar]
- Stachowicz A, Glombik K, Olszanecki R, Basta-Kaim A, Suski M, Lason W, Korbut R, 2016. The impact of mitochondrial aldehyde dehydrogenase (ALDH2) activation by Alda-1 on the behavioral and biochemical disturbances in animal model of depression. Brain Behav. Immun 51, 144–153. [DOI] [PubMed] [Google Scholar]
- Ventura JJ, Cogswell P, Flavell RA, Baldwin AS Jr., Davis RJ, 2004. JNK potentiates TNF-stimulated necrosis by increasing the production of cytotoxic reactive oxygen species. Genes Dev. 18, 2905–2915. [DOI] [PMC free article] [PubMed] [Google Scholar]
- Wang S, Wang C, Turdi S, Richmond KL, Zhang Y, Ren J, 2018. ALDH2 protects against high fat diet-induced obesity cardiomyopathy and defective autophagy: role of CaM kinase II, histone H3K9 methyltransferase SUV39H, Sirt1, and PGC-1alpha deacetylation. Int. J. Obes 42, 1073–1087. [DOI] [PubMed] [Google Scholar]
- Wimborne HJ, Takemoto K, Woster PM, Rockey DC, Lemasters JJ, Zhong Z, 2019. Aldehyde dehydrogenase-2 activation by Alda-1 decreases necrosis and fibrosis after bile duct ligation in mice. Free Radic. Biol. Med 145, 136–145. [DOI] [PMC free article] [PubMed] [Google Scholar]
- Yan HM, Ramachandran A, Bajt ML, Lemasters JJ, Jaeschke H, 2010. The oxygen tension modulates acetaminophen-induced mitochondrial oxidant stress and cell injury in cultured hepatocytes. Toxicol. Sci 117, 515–523. [DOI] [PMC free article] [PubMed] [Google Scholar]
- Yoon E, Babar A, Choudhary M, Kutner M, Pyrsopoulos N, 2016. Acetaminophen-induced hepatotoxicity: a comprehensive update. J Clin Transl Hepatol 4, 131–142. [DOI] [PMC free article] [PubMed] [Google Scholar]
- Zhang T, Zhao Q, Ye F, Huang CY, Chen WM, Huang WQ, 2018. Alda-1, an ALDH2 activator, protects against hepatic ischemia/reperfusion injury in rats via inhibition of oxidative stress. Free Radic. Res 52, 629–638. [DOI] [PubMed] [Google Scholar]
- Zhang Y, Babcock SA, Hu N, Maris JR, Wang H, Ren J, 2012. Mitochondrial aldehyde dehydrogenase (ALDH2) protects against streptozotocin-induced diabetic cardiomyopathy: role of GSK3beta and mitochondrial function. BMC Med. 10, 40 10.1186/1741-7015-10-40. [DOI] [PMC free article] [PubMed] [Google Scholar] [Retracted]
- Zhang Y, Mi SL, Hu N, Doser TA, Sun A, Ge J, Ren J, 2014. Mitochondrial aldehyde dehydrogenase 2 accentuates aging-induced cardiac remodeling and contractile dysfunction: role of AMPK, Sirt1, and mitochondrial function. Free Radic. Biol. Med 71, 208–220. [DOI] [PMC free article] [PubMed] [Google Scholar]
- Zhu Q, He G, Wang J, Wang Y, Chen W, 2017. Pretreatment with the ALDH2 agonist Alda-1 reduces intestinal injury induced by ischaemia and reperfusion in mice. Clin. Sci. (Lond.) 131, 1123–1136. [DOI] [PMC free article] [PubMed] [Google Scholar]


