Abstract
Background and aim of the work:
Coronary heart disease is the leading cause of morbidity and mortality in developed countries and its association with LDL-cholesterol has been well established. During the last decades statin therapy, and an healthy lifestyle, has proven highly effective in reducing cardiovascular event rates. Yet, there is still controversy among national guidelines and clinical practice with regard to LDL-cholesterol measurements. The aim of this study was to verify whether significant changes in cholesterol levels were observed over a relatively long (12 years) period. We also compared the Friedewald-calculated with directly-measured LDL cholesterol in order to verify whether the two methods were equivalent.
Methods:
We retrospectively analyzed 288000 data (total cholesterol, HDL, LDL both directly-measured and Friedewald-calculated, and triglycerides), from 57600 individuals, collected at the San Raffaele Hospital in Milan between 2007 and 2018. Data were statistically analyzed using a linear regression over the 12 years long period of time.
Results:
We observed a general decreasing trend in total cholesterol (and an increasing trend in HDL) and a decrease in triglycerides only in the male group. Directly-measured LDL did not correlate well with calculated LDL.
Conclusion:
The total cholesterol decrease and the corresponding increment in HDL was attributed to either an increased use of statin and/or an improvement of the general population dietary habits. The latter was further confirmed by the decrease in triglycerides observed in the male group. Based on our data, an alternative method for assessing atherogenics lipoproteins level has been proposed. (www.actabiomedica.it)
Keywords: cholesterol, low-density lipoproteins, friedewald equation, coronary heart disease
1. Introduction
Prolonged exposure to high concentrations of total cholesterol (TC) is associated with an increased risk of developing coronary heart diseases (CHD)(1). Cholesterol is transported through plasma as hydrophobic cholesteryl esters carried by lipoprotein particles. Lipoproteins are traditionally classified according to their size and density: chylomicrons, chylomicron remnants and VLDL are larger and lighter whereas IDL, LDL and HDL are sequentially smaller and heavier (2). Most of the circulating cholesterol is carried by LDL. Epidemiological evidence conclusively showed that this type of lipoprotein is primarily responsible for the association with CHD like an increased risk of myocardial infarction and vascular death (3). Findings from genetic studies suggest that exposure to excessive LDL cholesterol (LDLC) early in life results in markedly atherothrombosis already in the 3rd or 4th decades (4). These led to the concept of so-called cholesterol years of exposure and suggest that reduction of LDL early in life might strongly delay CHD events. Intervention studies aimed at lowering the LDLC concentration in patients with and without clinically manifested CHD clearly demonstrated the efficacy of lipid-lowering therapies (5, 6).
In the last twenty years national cholesterol education programs have been implemented worldwide with the aim of communicating the message that an healthy diet, exercise, and smoking cessation are highly effective in reducing both hyperlipidaemia and LDLC (7). On the other hand, pathological conditions that do not benefit enough from an healthy life style, may achieve LDLC reduction with statin agents that block the rate-limiting step in cholesterol biosynthesis (8). Statins progress was rapid in the last decade and their used increased during this time interval (9, 10). Although LDLC plays a crucial role as a risk factor for CHD, controversy remains in clinical practice with regard to its measurement. The gold standard for measuring LDLC is β-quantitation (11) which requires the time-intensive and expensive ultracentrifugation and is not feasible in laboratory routine analysis. Thus, the most common approach to determining LDLC for general purposes in the clinical laboratory is the Friedewald calculation (12). The equation subtracts HDL-cholesterol and a fixed ratio of triglycerides/5 (as an estimate of VLDL cholesterol), from total cholesterol to provide an estimate of LDLC. Despite economically convenient, the Friedewald calculation is prone to inaccuracies at high triglyceride levels (>400 mg/dL) but also at low LDLC levels (13, 14). An improved version of the Friedewald equation was developed by Martin and colleagues (15) by replacing the fixed ratio of 5 for VLDL cholesterol estimation with a personalized ratio (ranging from 3.1 to 11.9). Although the improvement was significant, the accuracy, when compared to the gold standard, was still in the 90% range (15).
Recently, several homogeneous methods have been developed by different manufacturers for the direct measurement of LDLC levels (16). These methods involve two steps: in the first one different surfactants, ionic polymers, and other components selectively prevent measurement of LDLC while non LDL lipoproteins are solubilized and the released cholesterol is enzymatically converted and then eliminated. In the second step the remaining LDLC is then solubilized and measured upon enzymatic reaction (17). However, homogenous LDLC assays are not necessarily reliable and, in some cases, can be even less accurate than the Friedewald equation (18, 19). Because a large number of factors related to genetics, nutrition, diseases and therapy may affect the composition of lipoproteins, the same surfactants mixture might not be able to selectively prevent or enable the measurement of the cholesterol content of one lipoprotein class in the presence of other types of lipoproteins. Consequently, it has been challenging to manufacture direct methods with adequate specificity (16).
In our study we retrospectively analyzed the association between TC, HDL cholesterol (HDLC), LDLC calculated from the Friedewald equation (LDLC-CAL) or from homogenous assay (LDLC-HOMO), and triglycerides (TG) collected at the San Raffaele Hospital laboratory, in the Milan area, from 57600 individuals who performed routine clinical analysis between January 2007 and December 2018. The aims of the study were to evaluate: a) whether the advertising campaign directed at lowering cholesterol levels combined with an increased used of statins during the last decade (10) determined a decreasing trend in the amount of total cholesterol during the 2007-2018 time interval; b) whether LDLC-CAL and LDLC-HOMO could be considered as equivalent methods during this 12 years long period. A high correlation between LDLC-CAL and LDLC-HOMO (r >0.9) has been observed previously (20) for short period but, to the best of our knowledge, never for a 12 years long interval.
Exact LDLC estimation is essential and critically important for the correct classification of patients into an appropriate risk category. Comparing the two most common methods for LDLC measurements over a long period of time might answer the important questions on whether homogeneous assays can be recommended to replace the Friedewald calculation. At the light of these results, alternative methods to assess cholesterol associated CHD risk, which are likely to improve overall patients care, will be discussed.
2. Materials and methods
2.1. Clinical data
TC, HDLC, LDLC-CAL, LDLC-HOMO and TG were evaluated each on 57600 individuals, 28800 females (two hundred per month) and 28800 males (two hundred per month), 18 years old or older, who had their blood tested, for routine clinical analysis, between January 2007 and December 2018 at the laboratory of the San Raffaele Hospital in Milan, Italy as described earlier (21,22).
In total 288000 (57600x5) data were analyzed. A small percent (<5%) of the individuals tested were hospitalized patients. Furthermore individuals with TG > 500 mg/dL (267 individuals), for which the Friedewald equation is not reliable, were excluded from the study. Thus the collected data might be considered as general routine analysis data and not affected by pathological conditions. The females monthly averaged ages, calculated for each of the 144 months, ranged from 48.2 to 58.3 years, 48.4 to 58.7 years, 42.9 to 57.9 years, 51.0 to 61.2 years and 46.1 to 58.1 years for TC, HDLC, LDLC-CAL, LDLC-HOMO and TG respectively. The corresponding standard deviations (SDs) ranged from ±13.0 to ±17.8 years, ±13.4 to ±17.4 years, ±9.0 to ±20.1 years, ±12.8 to ±16.6 years and ±13.9 to ±17.3 years for TC, HDLC, LDLC-CAL, LDLC-HOMO and TG respectively. The males monthly averaged ages, calculated for each of the 144 months, ranged from 46.3 to 56.6 years, 47.7 to 56.8 years, 42.9 to 63.1 years, 48.7 to 59.5 years and 46.2 to 55.3 years for TC, HDLC, LDLC-CAL, LDLC-HOMO and TG respectively. The corresponding standard deviations (SDs) ranged from ±11.9 to ±16.5 years, ±11.4 to ±15.8 years, ±8.6 to ±16.9 years, ±11.5 to ±15.4 years and ±11.5 to ±15.7 years for TC, HDLC, LDLC-CAL, LDLC-HOMO and TG respectively.
TC, HDLC, LDLC-HOMO and TG were measured from January 2007 to January 2016, on a Advia 2400 (Siemens Healthcare Diagnostic, Victoria, Australia) and from January 2016 to December 2018 on a Roche COBAS 8000 (Roche, Basel, Switzerland). For both instrumentation analyte levels were evaluated by a colorimetric enzymatic assay. After an in-house evaluation, no significance differences were observed between the two instrumentations. LDLC-CAL was calculated using the Friedewald equation (12). For each analytes the instrumental errors was calculated by averaging approximately 25-28 measurements per month (one each working day) of standard solution at low (L1) and high (L2) concentrations.
All individuals involved in the study gave an informed consent authorizing the use of their anonymously collected data for retrospective observational studies (with reference to article 9.2.j of the EU general data protection regulation 2016/679 [GDPR]), according to the San Raffaele Hospital internal policy (IOG075/2016).
2.2. Statistical analysis
For each months (144), from January 2007 to December 2018, 400 values (200 males and 200 females) from each analytes (TC, HDLC, LDLC-CAL, LDLC-HOMO and TG) were randomly extracted from the San Raffaele Hospital internal database. Measurements for the different analytes were extracted from different days of the month in order to avoid the comparison of data from the same pool of individuals. In other words we preferred not to compare TC, HDL and TG from the same individuals because, for mathematical reason, they will be highly correlated with the resulted Friedewald-calculated LDLC. In contrast, comparing the Friedewald equation data with TC, HDL and TG from different pools of individuals reveals whether the cholesterol and TG data are a good representation of the cholesterol situation in the general population. TC was extracted from day 1 to 3 of the month, HDLC was extracted from day 4 to 6, LDLC-CAL was extracted from day 7 to 15, LDLC-HOMO was extracted from day 16 to 25 and TG was extracted from day 26 to 30.
Monthly averaged values for TC, HDLC, LDLC-CAL, LDLC-HOMO and TG, and their corresponding SDs, were calculated for both the female and male groups. The correlation between time and the analytes levels were evaluated by a statistical linear regression using the software Sigmaplot (Systat software, San Jose, CA, USA). Within the same month no duplicates (i.e. different data from the same individual) were present.
3. Results
The female and male monthly averaged TC observed between January 2007 and December 2018 showed a constant decreasing trend (Figure 1) of approximately 10% from January 2007 to December 2018. The statistical linear regression showed a significant correlation between time and TC for both groups, with R2 of 0.61 and 0.64 for the female and male groups respectively (Table 1). The two intercepts of 213 and 203 mg/dL for the female and male groups respectively were consistent with an approximately 5% less TC in the female population whereas the almost identical slopes (-0.14 and -0.15 mg/dL*t for the female and male groups, respectively) (Table 1) reveals a general population tendency in reducing their TC levels over time.
Figure 1.
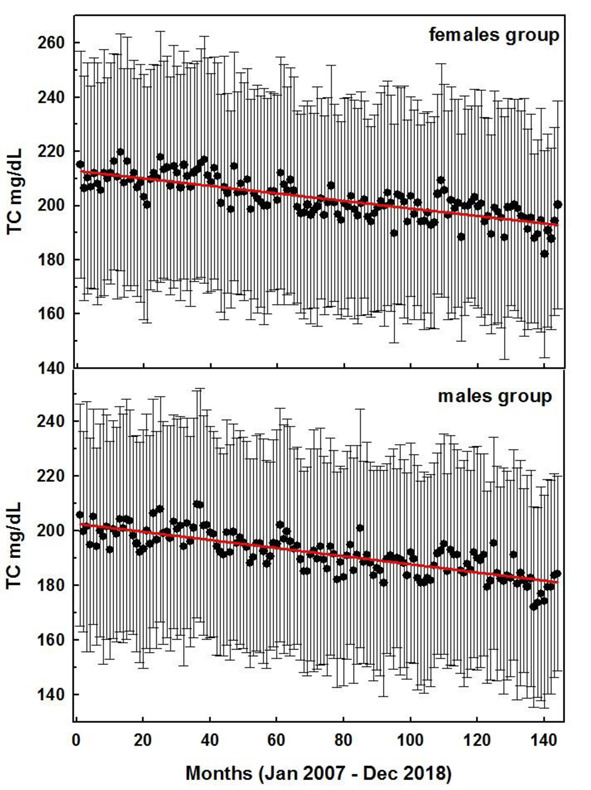
Monthly averaged TC values for the female (top) and male groups during the 144 months interval between January 2007 and December 2018. Red lines represent the statistical linear regressions (see parameters in Table 1). Error bars represent the corresponding standard deviation
Table 1.
Parameters obtained from the statistical linear regressions of the monthly averaged values
| Analyte | Gender | R2 | Intercept | slope | 95% CI | P Value | Deviation |
| TC | Females | 0.61 | 213 | -0.14 | -0.157 to -0.120 | < 0.0001 | Signific. |
| Males | 0.64 | 203 | -0.15 | -0.167 to -0.130 | < 0.0001 | Signific. | |
| HDLC | Females | 0.27 | 60 | 0.04 | 0.032 to 0.056 | < 0.0001 | Signific. |
| Males | 0.32 | 46 | 0.04 | 0.027 to -0.044 | < 0.0001 | Signific. | |
| LDLC-CAL | Females | 0.60 | 124 | -0.11 | -0.130 to -0.099 | < 0.0001 | Signific. |
| Males | 0.60 | 131 | -0.15 | -0.168 to -0.128 | < 0.0001 | Signific. | |
| LDLC-HOMO | Females | 0.04 | 130 | -0.02 | -0.040 to -0.004 | 0.0180 | Signific. |
| Males | 0.06 | 126 | -0.03 | -0.051 to -0.011 | 0.0025 | Signific. | |
| TG | Females | 0.02 | 105 | -0.02 | -0.056 to 0.001 | 0.0565 | Not. Signific. |
| Males | 0.20 | 137 | -0.10 | -0.142 to -0.072 | < 0.0001 | Signific. |
In contrast HDLC showed a positive trend during the 12 years observation period (Figure 2). The statistical linear regression showed a correlation between time and HDLC consistent with R2 of 0.27 and 0.32 for the female and male groups, respectively (Table 1). The two intercepts of 60 (female) and 46 (male) mg/dL showed that males had approximately 25% less HDLC than the female population. The identical slopes of 0.04 mg/dL*t (Table 1) observed in both groups revealed a general population trend consistent with an increase in HDLC concentration of approximately 10% during the last 12 years.
Figure 2.
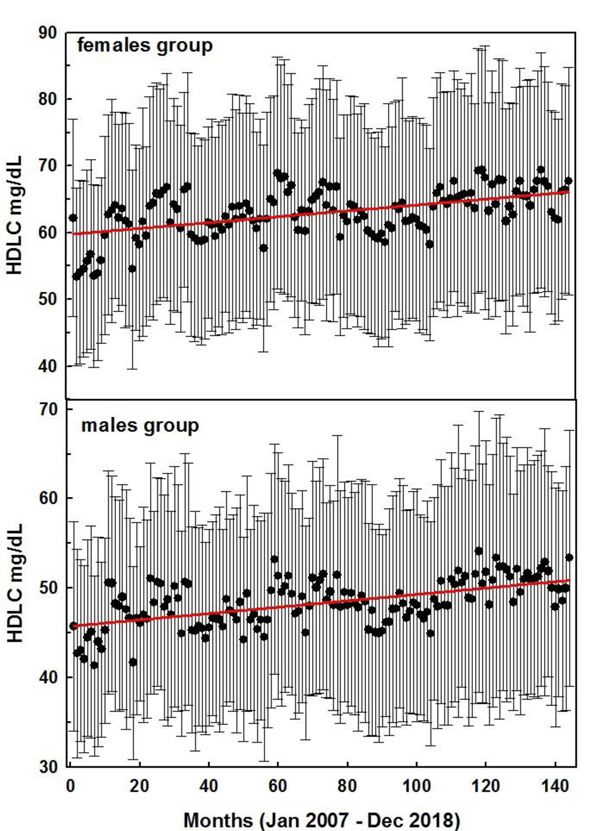
Monthly averaged HDLC values for the female (top) and male groups during the 144 months interval between January 2007 and December 2018. Red lines represent the statistical linear regressions (see parameters in Table 1). Error bars represent the corresponding standard deviation
Differences between the female and male groups were observed for TG as well. During the 12 years interval the females group showed a relatively constant level of TG of approximately 105 mg/dL (Figure 3). Thus the slope of the statistical linear regression is close to zero and a poor correlation (R2 = 0.02) between TG and time was observed (Table 1). In contrast, the males group showed, at the beginning of the study (January 2007), a 30% higher level of TG (intercepts 137 and 105 mg/dL for the males and females group respectively, Table 1). This gap became smaller (~15%) at the end of the study (December 2017) revealing that during the observed 12 years interval, a clear tendency in lowering the TG level was present in the male population (slope -0.10 mg/dL*t, Figure 3). This was confirmed by the statistical linear regression which, in contrast with the females group, showed a higher correlation between time and TG levels (R2 = 0.20, Table 1).
Figure 3.
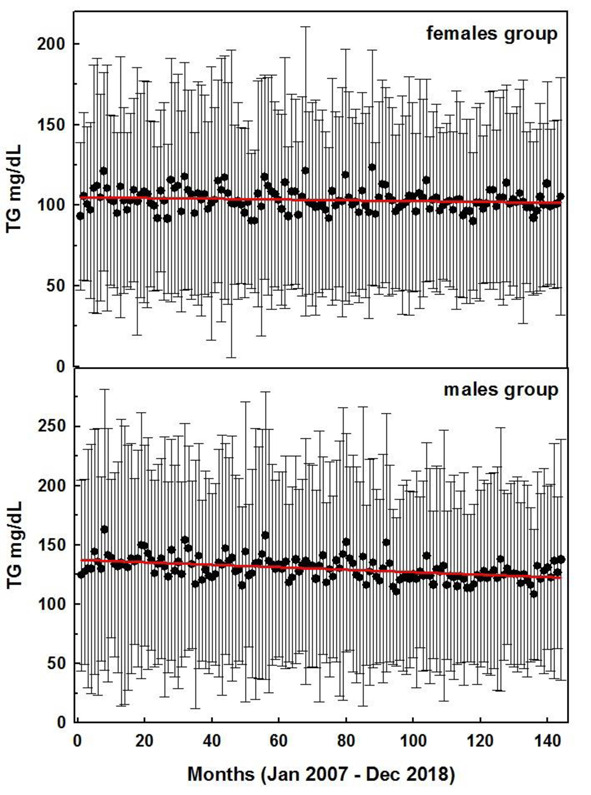
Monthly averaged TG values for the female (top) and male groups during the 144 months interval between January 2007 and December 2018. Red lines represent the statistical linear regressions (see parameters in Table 1). Error bars represent the corresponding standard deviation
Figure 4.
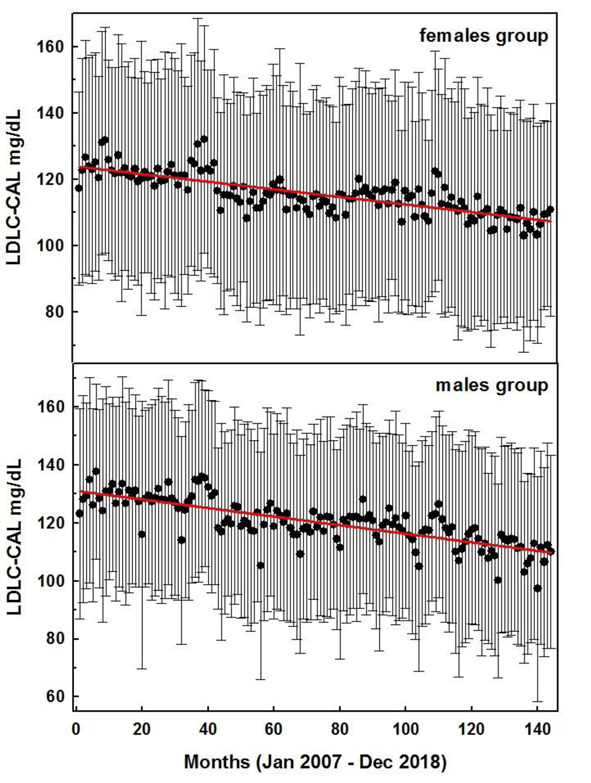
Monthly averaged LDLC-CAL values for the female (top) and male groups during the 144 months interval between January 2007 and December 2018. Red lines represent the statistical linear regressions (see parameters in Table 1). Error bars represent the corresponding standard deviation
Figure 5.
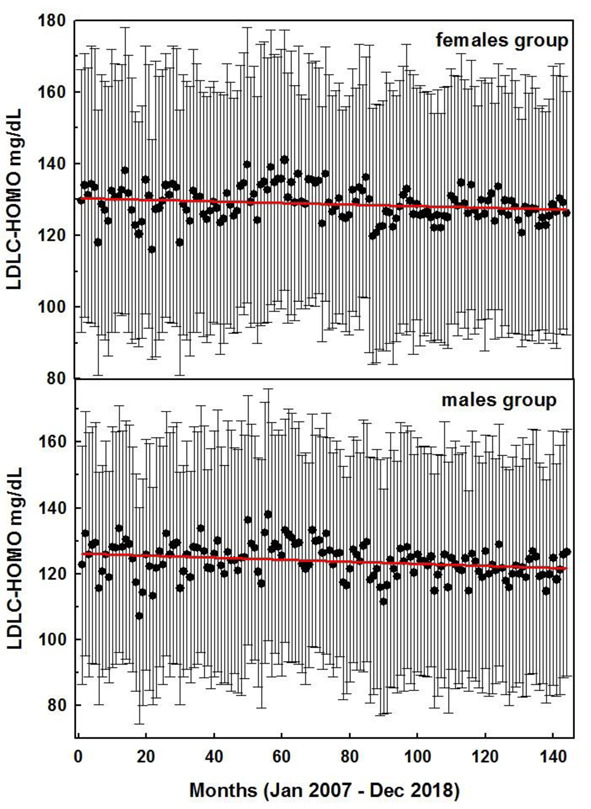
Monthly averaged LDLC-HOMO values for the female (top) and male groups during the 144 months interval between January 2007 and December 2018. Red lines represent the statistical linear regressions (see parameters in Table 1). Error bars represent the corresponding standard deviation
The LDLC calculated with the Friedewald equation showed a progressive decrease in LDLC from 2007 to 2018 for both males and females. The statistical linear regression confirmed a high correlation between LDLC-CAL and time for both genders (R2 =0.60 for both groups, Table 1). Data showed that males had a slightly higher LDLC value at the beginning of the study (intercepts of 124 and 131 mg/dL for the females and males groups respectively) however, because of the different slopes (-0.11 and -0.15 for females and males respectively), the LDLC-CAL intercepts at the end of the study were identical (109 mg/dL). Although LDLC-CAL data were from individuals different from those of the TC, HDLC and TG (which were also different from each other), the slopes obtained with the statistical linear regression were very similar to those obtained by subtracting the HDLC slope and one fifth of the TG slope to the TC slope (-0.10 vs -0.11 mg/dL*t and -0.13 vs -0.15 mg/dL*t for the female and male groups, respectively).
In contrast to LDLC-CAL, the statistical linear regression for LDLC-HOMO showed a poor yet significant correlation (R2 <0.10 for both groups, Table 1) between LDLC levels and time (P values of 0.018 and 0.0025 for the female and male groups respectively, Table 1). For both groups the slopes were close to zero (-0.02 and -0.03 mg/dL*t for the female and male groups, respectively) indicating an approximately constant levels of LDLC-HOMO during the 12 years interval (Table 1).
It must be noted that the observed differences were not arising from the instrumental errors because they were <2.5% for TC, HDLC and LDLC-HOMO and <3% for TG.
4. Discussion
The study showed that between January 2007 and December 2018 a significant decrease, of about 10%, in TC is observed in the general population of the Milan area for both males and females. Such decrease was likely related to either the well reported increase in statin consumption (10) during the last decade and/or to the educational food campaigns that reached the general population during this time interval. About to the latter, Milan hosted the EXPO exhibition in 2015 which focused mainly on food and health. Since 2008, when EXPO was assigned to the city of Milan, this area has been the target of several campaigns which promoted healthy food behaviors. We might speculate that such campaigns further improved an already existing trend, however, comparisons with data from similar areas not influenced by the aforesaid promotions are needed to confirm or infirm this hypothesis. A partial confirmation of the improvement in the eating habits of the people involved in our study came from the analysis of TG levels. Its level significantly decreased in the male group indicating a likely positive change in the dietary pattern of this part of the population. The lack of correlation between TG and time in the female group was likely the consequence of this genders’ lifestyle. Females traditionally eat healthier and pay more attention to physical fitness (23, 24).
The HDLC increased, during the considered 12 years interval, which was consistent with the corresponding TC decrease. The study also highlighted an higher TC level in the female population, if compared with the male ones, which was associated to an higher level of HDL in this gender. TG was 30% higher in the male group at the beginning of the study but the gap was reduced to 15% after 12 years. If this trend will continue, we might observe in the following two decades similar averaged TG values for both males and females.
As expected the Friedewald calculated LDLC decreased between 2007 and 2018 and was significantly correlated with time. As a consequence of the observed decrease in TG in the male, which was absent in the female group, the lowering trend was more pronounced in the former group. Although TC, HDLC, TG and LDLC-CAL data were from different pools of individuals, their calculated linear regression parameters correlates well indicating that the 57600 individuals involved in the study can be considered as a good approximation of the general population in the Milan area.
In contrast LDLC-HOMO had a poor correlation with time. Both the female and male groups’ slopes were close to zero thus in contrast with the evident TC and HDL trends. A closer analysis of the LDLC-HOMO data revealed that, when looking at the single individual, about 10-20% of the LDLC-HOMO values were higher than their corresponding TC minus HDLC values (data not shown). Although these latter values might be considered as a nonsense, such data were also included in the study because, clinically, they were treated as reliable and released to the patients.
Thus it appears that despite the instrumental internal controls were always within the limit, during the 12 years interval the LDLC-HOMO measurement was prone of inaccuracy and did not reflect the real patients’ status.
We might speculate that the source of inaccuracy lays in the first step of the assay where a mixture of surfactants, ionic polymers and other components selectively solubilized both high density lipoproteins and very low density lipoproteins without affecting LDL (17). Because of the biological variability in lipoprotein composition, the surfactants mixture may not always solubilize efficiently such polypeptides, with the results that a small amount of non-LDL cholesterol will contribute to LDLC-HOMO measurements.
Despite LDLC is the most extensively studied risk factor for CHD, substantial controversy remains in clinical practice with regard to its measurement. The Friedewald equation is economically convenient but suffers from several limitations especially when dealing with pathological patients. Our study seems to confirm that direct methods suffer from an high inaccuracy as well (even in non-pathological individuals) which is likely linked to the analytical procedure and is not associated to the instrumental error.
Many of the limitations associated with LDLC measurement can be avoided by simply measuring non-HDL-cholesterol (25). Non-HDL-cholesterol is not dependent on VLDL cholesterol estimation and reduces the discordance difficulties observed for direct LDLC measurements. Furthermore non-HDL cholesterol measurement is based on a calculation and thus is cost effective avoiding the need for advanced lipid testing. As suggested in previous studies, movement towards non-HDLC will take time but is likely to improve overall patient care (2,15).
5. Conclusion
Our data indicated that during the last 12 years an increasing awareness of food nutritive value and eating practices in adjunction with an increased used of statin has lowered the TC and LDLC-CAL values for both females and males. The LDLC-CAL decrease was more pronounced in the latter group because of a significant decrease in TG, which was absent in the female group, and was likely related to healthier eating habit implemented during this time interval. Consistently HDLC increases in both groups.
In contrast LDLC_HOMO was poorly correlated with time and could not explain the approximately 10% decrease in TC observed during the 12 years’ time interval. We suggested that measurements of non-HDLC might represent a better estimation of the atherogenics lipoproteins level associated with CHD risk by reducing the discordances associated with both the Friedewald equation and the direct LDLC measurements.
Author Contributions:
D.F. analyzed the data and wrote the paper; A.M and M.S. provided the data through an home-made software, M.L. helped in discussing the data and writing the paper.
Conflict of interest:
Each author declares that he or she has no commercial associations (e.g. consultancies, stock ownership, equity interest, patent/licensing arrangement etc.) that might pose a conflict of interest in connection with the submitted article
References
- 1.Syed S. Mahmooda. The Framingham Heart Study and the Epidemiology of Cardiovascular Diseases: A Historical Perspective. 2014;383(9921):1933–45. doi: 10.1016/S0140-6736(13)61752-3. [DOI] [PMC free article] [PubMed] [Google Scholar]
- 2.Ridker PM. LDL cholesterol: Controversies and future therapeutic directions. Lancet [Internet] 2014;384(9943):607–17. doi: 10.1016/S0140-6736(14)61009-6. Available from: http://dx.doi.org/10.1016/S0140-6736(14)61009-6 . [DOI] [PubMed] [Google Scholar]
- 3.MacMahon S, Duffy S, Rodgers , et al. A. Blood cholesterol and vascular mortality by age, sex, and blood pressure: A meta-analysis of individual data from 61 prospective studies with 55 000 vascular deaths. Lancet. 2007;370(9602):1829–39. doi: 10.1016/S0140-6736(07)61778-4. [DOI] [PubMed] [Google Scholar]
- 4.Ference BA, Yoo W, Alesh I, et al. Effect of Long-Term Exposure to Lower Low-Density Lipoprotein Cholesterol Beginning Early in Life on the Risk of Coronary Heart Disease. J Am Coll Cardiol. 2012;60(25):2631–9. doi: 10.1016/j.jacc.2012.09.017. [DOI] [PubMed] [Google Scholar]
- 5.Sacks FM, Pfeffer M a, Moye L a, et al. The effect of pravastatin on coronary events after myocardial infarction in patients with average cholesterol levels. Cholesterol and Recurrent Events Trial investigators. N Engl J Med [Internet] 1996;335(14):1001–9. doi: 10.1056/NEJM199610033351401. Available from: http://www.ncbi.nlm.nih.gov/pubmed/8801446 . [DOI] [PubMed] [Google Scholar]
- 6.Frick MH, Elo O, Haapa K, et al. Helsinki Heart Study: primary-prevention trial with gemfibrozil in middle-aged men with dyslipidemia. Safety of treatment, changes in risk factors, and incidence of coronary heart disease. N Engl J Med [Internet] 1987;317:1237–45. doi: 10.1056/NEJM198711123172001. Available from: http://www.ncbi.nlm.nih.gov/pubmed/3313041 . [DOI] [PubMed] [Google Scholar]
- 7.Ference BA, Yoo W, Alesh I, et al. Effect of long-term exposure to lower low-density lipoprotein cholesterol beginning early in life on the risk of coronary heart disease: A Mendelian randomization analysis. Ration Pharmacother Cardiol. 2013;9(1):90–8. doi: 10.1016/j.jacc.2012.09.017. [DOI] [PubMed] [Google Scholar]
- 8.Mihaylova B, Emberson J, et al. Blackwell L. The effects of lowering LDL cholesterol with statin therapy in people at low risk of vascular disease: Meta-analysis of individual data from 27 randomised trials. Lancet. 2012;380(9841):581–90. doi: 10.1016/S0140-6736(12)60367-5. [DOI] [PMC free article] [PubMed] [Google Scholar]
- 9.Peter P, Toth MB. Statins: Then and Now. Methodist Debakey Cardiovasc J. 2019;15(1):23–31. doi: 10.14797/mdcj-15-1-23. [DOI] [PMC free article] [PubMed] [Google Scholar]
- 10.Vancheri F, Backlund L, Strender LE, Godman B, Wettermark B. Time trends in statin utilisation and coronary mortality in Western European countries. BMJ Open. 2016;6(3) doi: 10.1136/bmjopen-2015-010500. [DOI] [PMC free article] [PubMed] [Google Scholar]
- 11.Rifai N, Warnick GR, McNamara JR, Belcher JD, Grinstead GF, Frantz ID. Measurement of low-density-lipoprotein cholesterol in serum: A status report. Clin Chem. 1992;38(1):150–60. [PubMed] [Google Scholar]
- 12.Friedewald WT, Levy RI, Fredrickson DS. Estimation of the concentration of low-density lipoprotein cholesterol in plasma, without use of the preparative ultracentrifuge. Clin Chem [Internet] 1972;18(6):499–502. Available from: http://www.ncbi.nlm.nih.gov/pubmed/4337382 . [PubMed] [Google Scholar]
- 13.Martin SS, Blaha MJ, Elshazly MB, et al. Friedewald-estimated versus directly measured low-density lipoprotein cholesterol and treatment implications. J Am Coll Cardiol. 2013;62(8):732–9. doi: 10.1016/j.jacc.2013.01.079. [DOI] [PubMed] [Google Scholar]
- 14.Cordova CMM, De Schneider CR, Juttel ID, Cordova MM De. Comparison of LDL-cholesterol direct measurement with the estimate using the Friedewald formula in a sample of 10,664 patients. Arq Bras Cardiol [Internet] 2004;83(6):482-7-81. doi: 10.1590/s0066-782x2004001800006. Available from: http://www.ncbi.nlm.nih.gov/pubmed/15654445 . [DOI] [PubMed] [Google Scholar]
- 15.Martin SS, Blaha MJ, Elshazly MB, et al. Comparison of a novel method vs the Friedewald equation for estimating low-density lipoprotein cholesterol levels from the standard lipid profile. JAMA - J Am Med Assoc. 2013;310(19):2061–8. doi: 10.1001/jama.2013.280532. [DOI] [PMC free article] [PubMed] [Google Scholar]
- 16.Miller WG, Myers GL, Sakurabayashi I, Bachmann LM, Caudill SP, Dziekonski A, et al. Seven direct methods for measuring HDL and LDL cholesterol compared with ultracentrifugation reference measurement procedures. Clin Chem. 2010;56(6):977–86. doi: 10.1373/clinchem.2009.142810. [DOI] [PMC free article] [PubMed] [Google Scholar]
- 17.Fawwad A, Sabir R, Riaz M, Moin H. Measured versus calculated LDL-cholesterol in subjects with type 2 diabetes. Pakistan J Med Sci. 2016;32(4):955–60. doi: 10.12669/pjms.324.9896. [DOI] [PMC free article] [PubMed] [Google Scholar]
- 18.Nauck M, Warnick GR, Rifai N. Methods for measurement of LDL-cholesterol: a critical assessment of direct measurement by homogeneous assays versus calculation. Clin Chem [Internet] 2002;48(2):236–54. Available from: http://www.ncbi.nlm.nih.gov/pubmed/11805004 . [PubMed] [Google Scholar]
- 19.Evans SR, Fichtenbaum CJ, Aberg JA. Comparison of Direct and Indirect Measurement of LDL-C in HIV-Infected Individuals: ACTG 5087. HIV Clin Trials. 2007;8(1):45–52. doi: 10.1310/hct0801-45. [DOI] [PMC free article] [PubMed] [Google Scholar]
- 20.Mora S, Rifai N, Buring JE, Ridker PM. Comparison of LDL cholesterol concentrations by Friedewald calculation and direct measurement in relation to cardiovascular events in 27 331 women. Clin Chem. 2009;55(5):888–94. doi: 10.1373/clinchem.2008.117929. [DOI] [PMC free article] [PubMed] [Google Scholar]
- 21.Ferrari D, Manca M, Banfi G, Locatelli M. Alcohol and illicit drugs in drivers involved in road traffic crashes in the Milan area. A comparison with normal traffic reveals the possible inadequacy of current cut-off limits. Forensic Sci Int. 2018;282:127–32. doi: 10.1016/j.forsciint.2017.11.005. [DOI] [PubMed] [Google Scholar]
- 22.Ferrari D, Manca M, Premaschi S, Banfi G, Locatelli M. Toxicological investigation in blood samples from suspected impaired driving cases in the Milan area : Possible loss of evidence due to late blood sampling. Forensic Sci Int. 2018;288:211–7. doi: 10.1016/j.forsciint.2018.04.038. [DOI] [PubMed] [Google Scholar]
- 23.Martin S. Surprise! Women eat healthier than men. C Can Med Assoc J = J l”Association medicale Can. 2002;167(8):913. [PMC free article] [PubMed] [Google Scholar]
- 24.Kant AK, Graubard BI. Within-person comparison of eating behaviors, time of eating, and dietary intake on days with and without breakfast: NHANES 2005-2010. Vol. 102. American Journal of Clinical Nutrition. 2015:661–70. doi: 10.3945/ajcn.115.110262. [DOI] [PMC free article] [PubMed] [Google Scholar]
- 25.Boekholdt MS, Arsenault BJ, Mora S, et al. Association of LDL Cholesterol , Non - HDL Cholesterol , and Apolipoprotein B Levels With Risk of Cardiovascular Events. J Am Med Assoc. 2012;307(12):1302–9. doi: 10.1001/jama.2012.366. [DOI] [PubMed] [Google Scholar]


