

Abstract
Background and aim of the work:
The ongoing pandemic has elicited an increasing interest regarding the SARS-CoV-2 viral RNA detection in saliva specimens rather than through nasopharyngeal swabs. Our aim was to conduct a meta-analysis on the sensitivity and specificity of SARS-CoV-2 viral RNA detection through RT-qPCR based on salivary specimens compared to conventional nasopharyngeal swabs.
Methods:
We reported our meta-analysis according to the PRISMA statement. We searched Pubmed, Embase, and pre-print archive medRxiv.og for eligible studies published up to June 1st, 2020. Raw data included true/false positive and negative tests, and the total number of tests. Sensitivity and specificity data were calculated for every study, and then pooled in a random-effects model. Heterogeneity was assessed using the I2 measure. Reporting bias was assessed by means of funnel plots and regression analysis.
Results:
The systematic review eventually retrieved 14 studies including a total of 15 estimates, the were included in quantitative synthesis. We found a pooled specificity of 97.7% (95%CI 93.8-99.2) and a pooled sensitivity of 83.4% (95%CI 73.1–90.4), with an overall agreement assessed by means of Cohen’s kappa equals to 0.750, 95%CI 0.62-0.88 (i.e. moderate agreement), with high heterogeneity and risk of reporting bias.
Conclusions:
In conclusion, diagnostic tests based on salivary specimens are somewhat reliable, but relatively few studies have been carried out. Moreover, such studies are characterized by low numbers and low sample power. Therefore, the of salivary samples is currently questionable for clinical purposes and cannot substitute other more conventional RT-qPCR based on nasopharyngeal swabs. (www.actabiomedica.it)
Keywords: SARS-CoV-2, COVID-19, RT-qPCR diagnostics, nasopharyngeal swabs, systematic review and meta-analysis
Introduction
The “Severe Acute Respiratory Syndrome coronavirus type 2” (SARS-CoV-2) is an enveloped, single-stranded, positive-sense RNA beta-coronavirus that was discovered in late December 2019. Since then, it has spread out from Wuhan, Hubei province, People’s Republic of China, resulting in a global pandemic: the managing of the clinical syndrome elicited by SARS-CoV-2 infection (coronavirus disease 19 or COVID-19) has rapidly become a main stressor for all healthcare systems around the world (1–3).
Timely and accurate COVID-19 laboratory testing is an essential step in the management of the COVID-19 outbreak (4–8). To date, both the “European Centre for Disease Prevention and Control” (ECDC) and the “World Health Organization” (WHO) have recommended the use of an assay based on the reverse-transcription polymerase chain reaction (RT-qPCR) in respiratory samples as gold standard for the COVID-19 diagnosis (4,5,7,9,10). Unfortunately, RT-qPCR is usually performed on nasopharyngeal specimens, whose collection requires the use of swabs that is affected by several practical limitations. First at all, nasopharyngeal swabs are relatively invasive, whose collection requires specialized operators as may elicit cough and bleeding, which may increase the risk of healthcare workers infection (11). Moreover, RT-qPCR is a time-consuming procedure, needing specialized operators and certified laboratories (10). Such limitation has elicited interest in alternative methodologies for sample collection, and particularly on the use of oral fluids, and particularly saliva (12). Saliva can be provided by the patients not requiring specialized personnel for its collection, with a more comfortable procedure (13,14). Not coincidentally, the US Food and Drug Administration has recently authorized the emergency repurposed use of a RT-qPCR test for assessing the RNA in saliva samples (15), and there is an increasing number of reports focusing on the repurposing of available diagnostic kits on conventional nasopharyngeal swabs on saliva/oral fluids.
Even though a growing body of documents addresses the use of saliva as diagnostic sample, performance characteristics of salivary-based RT-qPCR for SARS-CoV-2 diagnosis remain largely uncertain (12,16,17). As conflicting results have been reported, an updated synthesis of the literature is urgently needed to better inform health policies and guidelines. Therefore, the present systematic review and meta-analysis was undertaken to explore the reliability of RT-qPCR diagnostic tests for SARS-CoV-2 based on salivary specimens.
Materials and Methods
This systematic review and meta-analysis of the literature has been conducted following the “Preferred Reporting Items for Systematic Reviews and Meta-Analysis” (PRISMA) guidelines (18). We searched different scholarly databases (namely, PubMed/MEDLINE and EMBASE) as well as pre-print servers including medrxiv.org for relevant studies from inception up to June 1st, 2020, without applying any backward chronological restrictions. The search strategy was a combination of the following keywords (free text and Medical Subject Heading [MeSH] terms, where appropriate): (saliva OR oral fluid) AND (COVID-19 OR SARS-CoV-2 OR Coronarivus) AND (diagnostic OR diagnostic test OR screening).
Records were handled using references management software (Mendeley Desktop Version 1.19.5, Mendeley Ltd, London, UK, 2019), and duplicates were removed. Articles eligible for review were original research publications available online or through inter-library loan. A language filter was applied, by retaining articles written in Italian, English, German, French or Spanish, the languages spoken by the investigators.
Only articles (a) dealing with COVID-19 cases diagnosed by means of conventional RT-qPCR tests on rhinopharyngeal swabs (5); (b) analyzing saliva by means of RT-qCPR; (c) reporting the raw number of true positive/true negative, and false positive/false negative results were eligible for the full review. Two independent reviewers (M.V. and S.R.) reviewed titles, abstracts, and the full text of articles. Titles were screened for relevance with respect to the subject under study.
Any articles reporting original results, which met one or more of the inclusion criteria, were retained for the full-text review. The investigators independently read full-text versions of eligible articles. Disagreements were resolved by consensus between the two reviewers; when it was not possible to reach consensus, input from a third investigator (M.R.) was searched and obtained. Further studies were retrieved from reference lists of relevant articles and consultations with experts in the field. Data extracted included:
(1) Settings and characteristics of the study (i.e. diachronous vs. synchronous regarding the original diagnosis for SARS-CoV-2 positivity; case control vs. case-crossover study);
(2) Characteristics of reference cases where available;
(3) Characteristics of reference diagnostic test;
(4) Characteristics of the RT-qPCR test employed;
(5) Total number of true positive, true negative, false positive, false negative cases.
We first performed a descriptive analysis to report the characteristics of the included studies. The accuracy of each study was measured as sensitivity (Se), specificity (Sp), positive and negative likelihood ratio (PLR and NLR), diagnostic odds ratio (DOR), accuracy and Cohen’s “kappa”. Sensitivity can be defined as the proportion of positive cases among people with a given disease, and specificity as the proportion of negative cases among people without that disease.
The likelihood ratios express the likelihood that a given test result would be expected in a patient with a certain disorder compared to the likelihood of that same result among subjects without that disorder; PLR was calculated by dividing the pooled Se by 1 – Sp; NLR was calculated by dividing 1 – Se by Sp. The DOR expresses how much greater the odds of having the disorder are for the people with a positive test result than for the people with a negative test result. It is a single measure of diagnostic test performance that combines both likelihood ratios by dividing PLR by NLR. Cohen’s kappa coefficient is a statistical measure that is used to quantitatively assess inter-rater reliability (and also intra-rater reliability) for qualitative (i.e., categorical) items. In other words, it measures the agreement between two raters who each classify N items into C mutually exclusive categories. Cohen’s kappa values < 0.600 suggest “weak” to “none” agreement, while values 0.600 to 0.799 suggest a “moderate” agreement, 0.800 to 0.900 a “strong” agreement, and >0.900 an “almost perfect” agreement.
Pooled Se, Sp, PLR, NLR, accuracy, Cohen’s kappa and DOR were calculated by combining each study’s results, using a random-effects model. For DOR, a correction factor of one half was added to each cell to avoid calculation problems by having a value of zero in the 2 × 2 table.
Potential heterogeneity for threshold effect (i.e., differences in Se and Sp occurring because of different cut-offs used in different diagnostic kits) was assessed by reporting accuracy estimates from each study in a summary receiver operating characteristic (sROC) space and subsequent visual inspection of the resulting curves: i.e., a substantial difference in curves suggested a possible heterogeneity for threshold effect, while the overlap of curves was reported as a sign of its absence (19).
I2 statistics were then calculated to quantify the amount of inconsistency between included studies; it estimates the percentage of total variation across studies that is due to heterogeneity rather than to chance. I2 values ranging from 0% to 25% were considered to represent low heterogeneity, from 26% to 50% moderate heterogeneity and above 50% substantial heterogeneity, being pooled using a fixed-effects model because of the reduced number of samples eventually included.
To investigate publication bias, contour-enhanced funnel plots were initially generated: publication bias was evaluated by testing the null hypothesis that publication bias does not exist by means of the regression test for funnel plot asymmetry. The null hypothesis was rejected if the p-value was less than 0.10.
All calculations were performed in R (version 3.6.1; R Core Team, 2017. R: A language and environment for statistical computing. R Foundation for Statistical Computing, Vienna, Austria. URL https://www.R-project.org/) and RStudio (version 1.2.5019, RStudio PBC, 250 Northern Ave, Boston, MA, USA) software by means of meta (version 4.9-9), mada (version 0.5-9), and nsROC (version 1.1) packages. All packages are open-source add-ons for conducting meta-analyses.
Results
The initial literature search yielded a pool of 261 items. After removing duplicates (n = 20), 232 articles were screened by title and abstract. Two hundred articles were removed after title screening, and 32 were subsequently screened by abstract. Seventeen articles were excluded based on abstract screening and, finally, 15 articles were assessed for eligibility, reviewed by full-text. As one article did not report on RT-qPCR analysis of salivary fluids, it was ultimately excluded. Fourteen studies were eventually retrieved (14,20–32). One of the studies reported data on two diagnostic kits, with two estimates (20): as a consequence, the present systematic review and meta-analysis included a total of 15 estimates. The process of studies retrieval and inclusion is pictorially shown in Figure 1.
Figure 1.
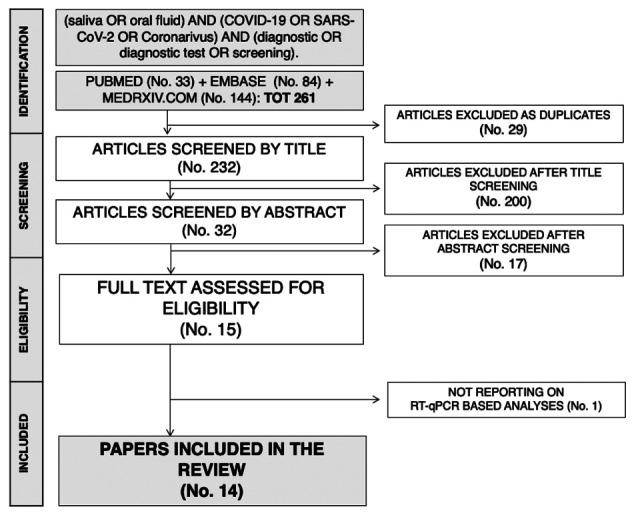
The process of studies retrieval and inclusion adopted in the present systematic review and meta-analysis. A total of 14 studies with 15 estimates were retrieved
The main characteristics of the studies included in the present systematic review and meta-analysis are reported in Table 1. Briefly, six of the included reports were preprints (20,21,26–29), while 8 studies had received a full peer-review process (14,22–25,30–32). Overall, 9 studies had a case-control design as included both COVID-19 positive and negative cases (20,21,23,25,26,29–32), while 5 studies included only patients having received a previous diagnosis of COVID-19 (14,22,24,27,28). As a consequence, while sensitivity of tests was assessed on a total of 15 estimates, specificity included only 10 of them, and DOR as well.
Table 1.
Summary of studies included in the meta-analysis (Note: TP = No. of True Positive Cases; FP = No. of False Positive Cases; FN = No. of False Negative Cases; TP = No. of True Positive Cases; Se. = sensitivity; Sp. = specificity; PPV = predicted positive value; PNV = predicted negative value; Cohen’s Kappa values should be interpreted as follows: 0.0–0.20 no agreement, 0.21–0.39 minimal agreement, 0.40–0.59 weak agreement, 0.60–0.79 moderate agreement, 0.80–0.90 strong agreement, >0.90 almost perfect agreement)
| Reference | Study design | Collection of the specimens vs. COVID-19 diagnosis | Manufacturer | Characteristics of the sample | No. Of samples | TP | FP | FN | TN | Se. | Sp. | PPV | PNV | Accuracy | Cohen’s Kappa |
| Azzi et al. (14) | Cohort | Diachronous | Qiagen QIAmp Viral RNA mini kit | 25 SARS-CoV-2 infected patients with severe or very severe disease | 25 | 25 | 0 | 0 | 0 | 100.0% | N/A | 100% | N/A | 100.0% | N/A |
| Becker et al. (20) | Case-Control | Synchronous | TaqPath RT-qPCR with US-CDC primer | 88 patients undergoing paired collection of saliva and NS | 67 | 5 | 4 | 11 | 47 | 31.3% | 92.2% | 55.6% | 81.0% | 77.6% | 0.275 |
| Becker et al. (20) | Case-Control | Synchronous | Helix Primer Design | 88 patients undergoing paired collection of saliva and NS | 85 | 11 | 2 | 10 | 62 | 52.4% | 96.9% | 84.6% | 86.1% | 85.9% | 0.565 |
| Chen et al. (24) | Cohort | Synchronous | Cepheix Xpert Xpress | 58 COVID+ patients | 58 | 49 | 3 | 6 | 0 | 89.1% | N/A | 94.2% | N/A | 84.5% | N/A |
| Fang et al. (22) | Cohort | Diachronous | undisclosed | 32 COVID-19 patients | 32 | 25 | 0 | 7 | 0 | 78.1% | N/A | 100% | N/A | 78.1% | N/A |
| Iwasaki et al. (26) | Case-Control | Synchronous | StepOnePlus Real Time PCR System with TaqPath primer | 9 patients with COVID-19 + 24 suspected | 34 | 9 | 0 | 1 | 24 | 90.0% | 100% | 100% | 96.0% | 97.1% | 0.927 |
| Jamal et al. (28) | Cohort | Diachronous | Allplex 2019-nCov assay kit | 53 in-patients with previously confirmed COVID-19 | 53 | 31 | 5 | 11 | 6 | 73.8% | 54.6% | 86.1% | N/A | 69.8% | N/A |
| Kojima et al. (32) | Case-Control | Diachronous | TaqPath RT-qPCR with US-CDC primer | 177 samples from 45 participants. 29 positive for SARS-CoV-2; conventional RT-qPCR; salivary vs. nasal specimens | 45 | 23 | 6 | 1 | 15 | 95.8% | 71.4% | 79.3% | 93.8% | 84.4% | 0.683 |
| L’Helgouach et al. (21) | Case-Control | Diachronous | Allplex 2019-nCov assay kit | 93 healthcare workers of unknown status vs. 30 COVID pateints (20 late cases and 10 actively infected) | 123 | 10 | 5 | 9 | 99 | 52.6% | 95.2% | 66.7% | 91.7% | 88.6% | 0.523 |
| McCormick-Baw et al. (31) | Case-Control | Synchronous | Cepheix Xpert Xpress | 156 paired NPS and saliva specimen | 156 | 47 | 1 | 3 | 105 | 94.0% | 99.1% | 97.9% | 97.2% | 97.4% | 0.941 |
| Pasomsub et al. (30) | Case-Control | Synchronous | CFX96 Real-Time Detection System with SARS-CoV-2 Nucleic Acid Diagnostic Kit | 200 patients under investigation for respiratory disorder; paired samples. | 200 | 16 | 2 | 3 | 179 | 84.2% | 98.9% | 88.9% | 98.4% | 97.5% | 0.851 |
| SoRelle et al. (29) | Case-Control | Diachronous | Abbott ID NOW | 96 consecutive patients | 67 | 18 | 0 | 5 | 44 | 78.3% | 100% | 100% | 89.8% | 92.5% | 0.825 |
| Williams et al. (23) | Case-Control | Synchronous | Qiagen EZ platform | 522 consecutive patients from a COVID Screening clinic; the sample did not include all consecutive samples. but only positive samples at nasal swabs and 50 ramdom negative ones | 90 | 33 | 1 | 6 | 50 | 84.6% | 98.0% | 97.1% | 89.3% | 92.2% | 0.839 |
| To et al. (25) | Case-Control | Diachronous | QuantiNova SYBR Green RT-PCR Kit (Qiagen) | 12 COVID-19 patients + 33 COVID-19 negative subjects | 45 | 11 | 0 | 1 | 33 | 91.7% | 100% | 100% | 97.1% | 97.8% | 0.942 |
| Wyllie et al. (27) | Cohort | Diachronous | MagMAX Viral/Pathogen Nucleic Acid Isolation kit (ThermoFisher) with US-CDC primer | 38 samples from 29 COVID-19 patients | 38 | 26 | 8 | 3 | 1 | 89.7% | 11.1% | 76.5% | N/A | 71.1% | N/A |
Overall, we retrieved two estimates from the study of Becker et al. (20), while all other studies includes a single estimate each (14,21-24,26-32). In seven estimates (20,23,24,26,30,31), collection of salivary samples was synchronous with diagnostic nasopharyngeal swabs, while in the remaining samples collection of oral fluids followed initial diagnosis of COVID-19 (i.e. diachronous samples) (14,21,22,27–29,32,33).
Overall, our meta-analysis included a total of 1118 samples (376 SARS-CoV-2 positive samples vs. 742 SARS-CoV-2 negative samples): the numerosity of every single estimate ranged from 32 to 200.
Concerning specificity, as shown in Figure 2, the value ranged from 71.4 to 100%. The pooled estimate was 97.7% (95%CI 93.8–99.2), without significant differences between synchronous (98.0%, 95%CI 95.5 – 99.1) and diachronous studies (97.7%, 95%CI 72.6-99.0). The heterogeneity was substantial (I2 = 74%, p < 0.01), being moderate (I2 = 31%, p = 0.02) for synchronous studies and again substantial for diachronous ones (I2 = 89%, p = 0.019).
Figure 2.
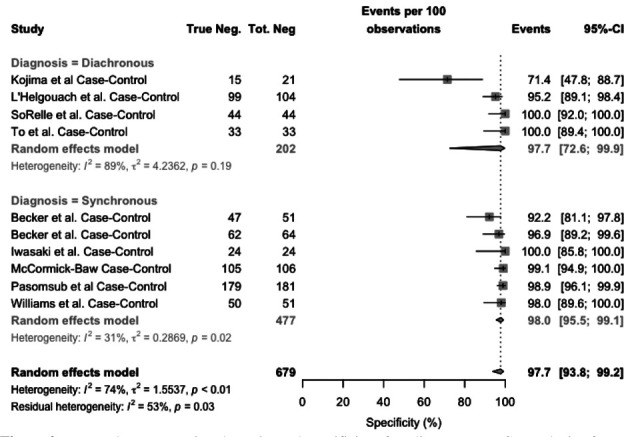
Forest plot representing the estimated specificity of studies on RT-qPCR analysis of salivary fluid for SARS-CoV-2 RNA 2. Mean specificity is 97.7% (95%CI 93.8–99.2), resulting from 97.7% (95%CI 72.6-99.9) for diachronous studies, and 98.0% (95%CI 95.5-99.1) for synchronous studies. Heterogeneity was substantial (I2, 74%), for diachronous studies (I2 = 89%), while it was moderated (I2, 31%) for synchronous studies
As shown in Figure 3, the value of sensitivity ranged from 31.3% to 100%. Pooled sensitivity was 83.4% (95%CI 73.1–90.4), resulting from 85.7% (95%CI 72.6-93.2) for diachronous studies, and 80.3% (95%CI 61.8-91.1) for synchronous studies. Heterogeneity was substantial (I2, 79%), for both synchronous (I2, 81%) and diachronous studies (I2 = 73%).
Figure 3.
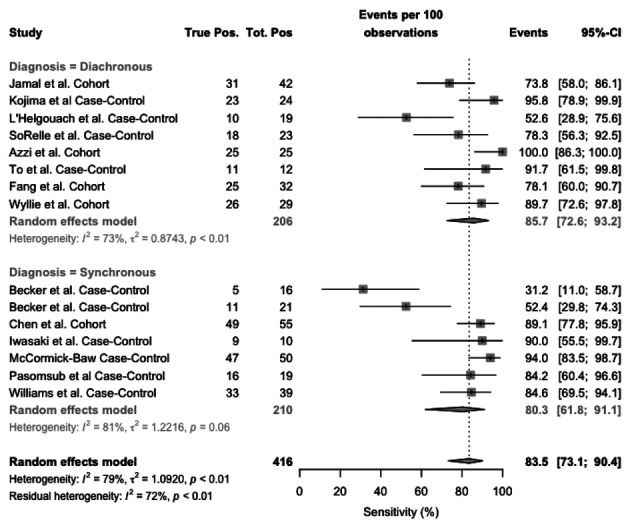
Forest plot representing the estimated sensitivity of studies on RT-qPCR analysis of salivary fluid for SARS-CoV-2 RNA. Pooled sensitivity was 83.4% (95%CI 73.1–90.4), resulting from 85.7% (95%CI 72.6-93.2) for diachronous studies, and 80.3% (95%CI 61.8-91.1) for synchronous studies. Heterogeneity was substantial (I2, 79%), for both synchronous (I2, 81%) and diachronous stusies (I2 = 73%)
Focusing on case-control studies, Figure 4, sensitivity ranged from 31.2% and 94.0%, with a pooled sensitivity estimated in 80.4% (95%CI 53.9–90.1), resulting from 83.4% (95%CI 59.9-94.4) for diachronous studies, and 78.1% (95%CI 55.5-91.1) for synchronous studies. Heterogeneity was substantial (I2, 79%), for both synchronous (I2, 81%) and diachronous studies (I2 = 69%).
Figure 4.
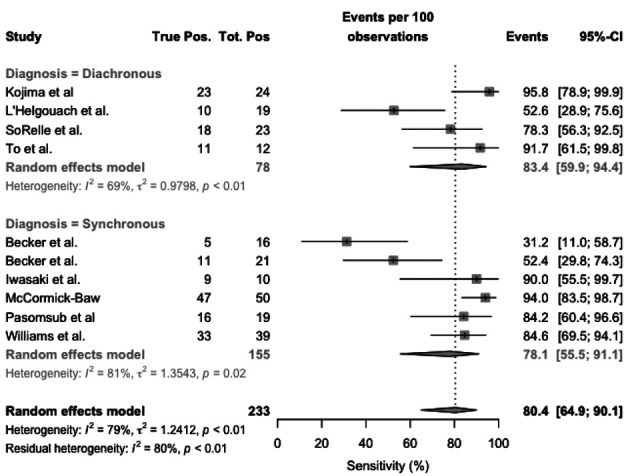
Forest plot representing the estimated sensitivity of studies on RT-qPCR analysis of salivary fluid for SARS-CoV-2 RNA, sub-analysis for case-control studies. Pooled sensitivity was 80.4% (95%CI 53.9–90.1), resulting from 83.4% (95%CI 59.9-94.4) for diachronous studies, and 78.1% (95%CI 55.5-91.1) for synchronous studies. Heterogeneity was substantial (I2, 79%), for both synchronous (I2, 81%) and diachronous studies (I2 = 69%)
Focusing on cohort studies (Figure 5), sensitivity ranged from 73.8% to 100%. Pooled sensitivity was 87.1% (95%CI 76.1–93.4), resulting from 87.2% (95%CI 70.3-95.1) for diachronous studies, and 89.1% (95%CI 77.8-95.0) for synchronous ones. Heterogeneity was substantial (I2, 60%), particularly both diachronous studies (I2 = 69%), while it was not calculated for synchronous studies as including a single report.
Figure 5.
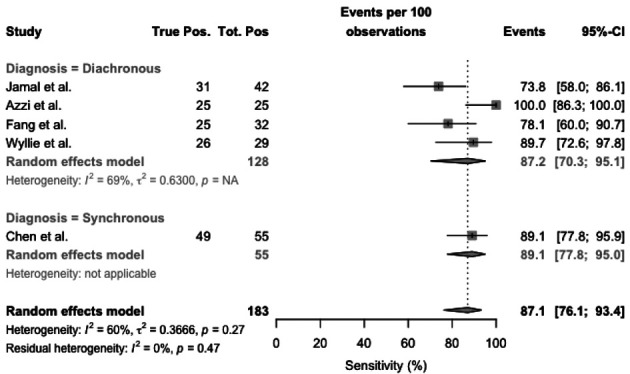
Forest plot representing the estimated sensitivity of studies on RT-qPCR analysis of salivary fluid for SARS-CoV-2 RNA, sub-analysis for cohort studies. Pooled sensitivity was 87.1% (95%CI 76.1–93.4), resulting from 87.2% (95%CI 70.3-95.1) for diachronous studies, and 89.1% (95%CI 77.8-95.0) for synchronous studies. Heterogeneity was substantial (I2, 60%), particularly both diachronous studies (I2 = 69%), while it was not calculated for synchronous studies as including a single report
Visual inspection of contour-enhanced funnel plots (Figure 6), suggested a significant asymmetry for all analyses, with subsequent reporting bias. However, regression analysis confirmed a significant reporting bias only for overall analysis of sensitivity (t = 1.8664, df = 13, p value = 0.0847), while it was dismissed for specificity (t = 1.7571, df = 8, p value = 0.117), as well as sensitivity subanalysis both in case-controls (t = 1.7571, df = 8, p value = 0.117) and cohort studies (t = 2.3882, df = 3, p value = 0.969), the latter possibly affected by the reduced number of estimates included in the analyses (i.e. five studies).
Figure 6.
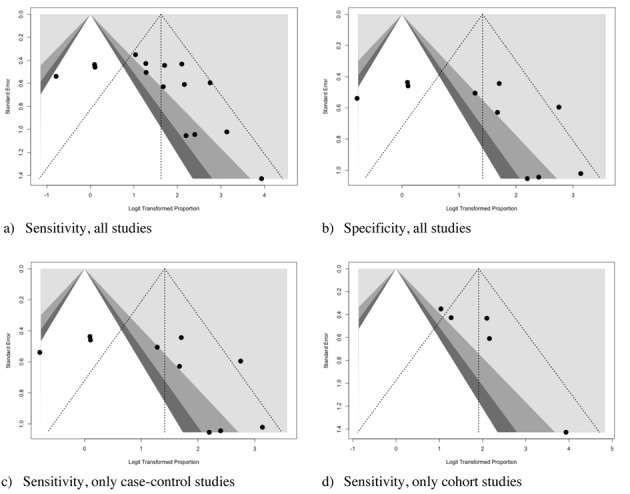
Funnel plots for Sensitivity (a, c, d), and Specificity (d) of studies included in the meta-analysis. Visual inspection suggested a significant asymmetry for all analyses, with subsequent reporting bias. However, regression analysis confirmed a significant reporting bias only for overall analysis of sensitivity (t = 1.8664, df = 13, p value = 0.0847), while it was dismissed for specificity (t = 1.7571, df = 8, p value = 0.117), as well as sensitivity subanalysis both in case-controls (t = 1.7571, df = 8, p value = 0.117) and case-crossover studies (t = 2.3882, df = 3, p value = 0.969), the latter possibly affected by the reduced number of cases included in the analyses
The forest plot representing the pooled DOR (i.e. 110.562 95%CI 32.720-373.594) from the case-control studies is shown in Figure 7.
Figure 7.
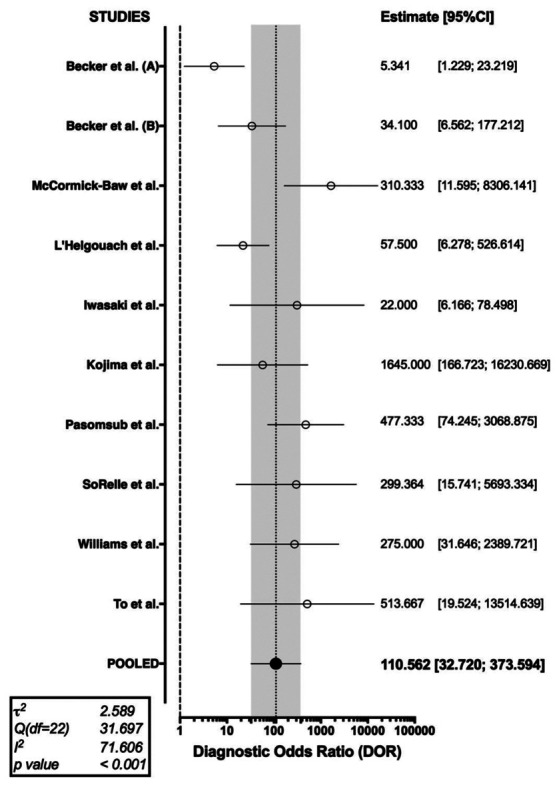
Forest plot representing the pooled diagnostic odds ratio (DOR) of RT-qPCR analysis of salivary fluid for SARS-CoV-2 RNA. A substantial heterogeneity in reported studies was identified (I2 71.61%, Cochran’s Q: 31.697 (df=22, p < 0.001))
As shown in Table 2, a cumulative PLR or 20.141 (95%CI 8.207; 49.430) was determined, with a correspondent NLR of 0.203 (95%CI 0.094; 0.436), i.e., while a positive test was associated with a relatively strong evidence of disease, a negative one was associated with a reduced chance of being actually affected by SARS-CoV-2 infection. In effect, Cohen’s kappa was estimated in 0.75 (95%CI 0.62; 0.88), suggesting that the agreement between rapid tests based on the assessment of serum antibodies and RT-PCR may be assumed to be moderate.
Table 2.
Summary of the properties of point-of-care rapid diagnostic testing for the COVID-19. Abbreviations: DOR (Diagnostics Odds-Ratio); NLR (Negative Likelihood Ratio); PLR (Positive Likelihood Ratio).
| Property | Value (95%CI) | Heterogeneity (p value) |
| Sensitivity (%) | 80.4% (53.9–90.1) | I2 = 79% (p < 0.001) |
| Specificity (%) | 97.7% (93.8–99.2) | I2 = 74% (p < 0.001) |
| NLR | 0.203 (0.094; 0.436) | I2 = 62% (p = 0.005) |
| PLR | 20.141 (8.207; 49.430) | I2 = 73% (p < 0.001) |
| DOR | 110.562 (32.720; 373.594) | I2 = 72% (p < 0.001) |
| Cohen’s Kappa | 0.75 (0.62; 0.88) | I2 = 96% (p < 0.001) |
In order to exclude that the differences in overall performance may have been associated with a different threshold level among studies, sROC of two distinctive models were determined, either using the overall DOR by combining each study’s diagnostic odds ratio (random-effects model, AUC = 0.867), or a fixed (unweighted) method (AUC = 0.896). The slight difference between the symmetric and asymmetric sROC curves indicates that a null to weak threshold effect is present (Figure 8).
Figure 8.
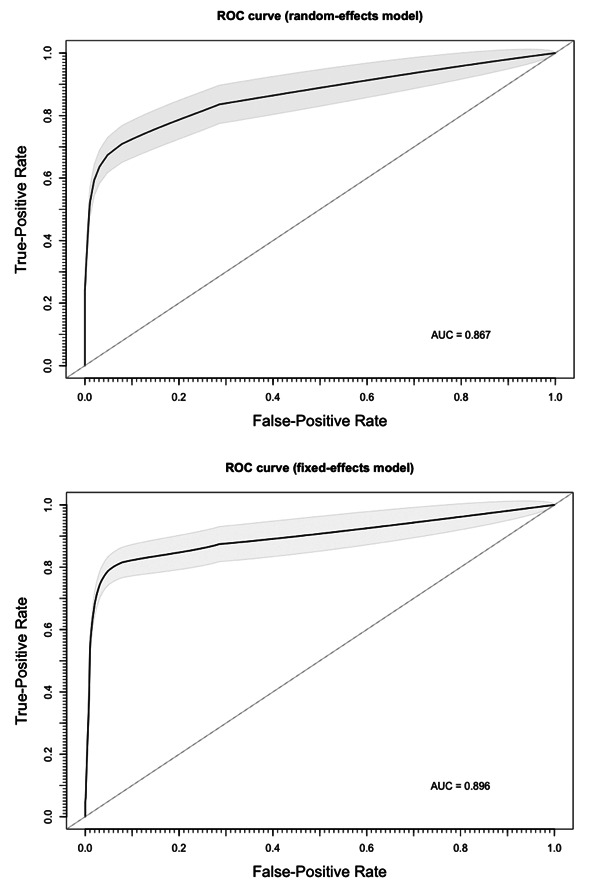
Summary Receiver Operated Characteristics (sROC) curve for RT-qPCR analysis of salivary fluid for SARS-CoV-2 RNA. The slight differences between estimates from a random-effect model (AUC = 0.867) and a fixed-effect model (AUC = 0.896) suggest the absence of a threshold effect in diagnostic performances of assessed tests.
Discussion
Saliva is an hypotonic fluid secreted by salivary glands, and contains water, electrolytes, mucus, and digestive proteins (16,34). Despite its heterogeneous origin and content, saliva is widely used as a diagnostic tool, substituting other biological fluids (e.g. serum and/or urine). More precisely, saliva has been to proposed as a diagnostic tool for various oral and systemic including some viral infections such as dengue, West Nile Fever, Chikungunya, Ebola, Zika virus, and Yellow Fever (16,34). Previous studies on the related SARS-CoV-1 have shown that in primates epithelial cells lining gland ducts may be an early target of viral infection (35), while the presence of considerable quantities of viral RNA has been unequivocally reported in the saliva of infected patients (36). As some early reports have similarly shown the presence of SARS-CoV-2 in saliva (11,12,14,17,23,24,37), suggesting the substantial accuracy of human saliva samples for diagnostic purposes (11,14,25), the use of saliva instead of nasopharyngeal specimens for RT-qPCR analysis appear promising.
In effect, our meta-analysis has found a moderate diagnostic agreement between conventional nasopharyngeal-based and salivary based RT-qPCR tests (i.e. Cohen’s kappa = 0.750, 95%CI 0.62-0.88), with a specificity of 97.7% (95%CI 93.8-99.2) and a test sensitivity of 83.4% (95%CI 73.1–90.4), the latter being significantly lower than that previously reported in the still unpublished meta-analysis from Czumbel et al (34) (i.e. 91%, 95%CI 80-99). However, such meta-analysis included only 4 of the studies we reported (14,22,23,25), while a fifth further study was subsequently retracted (38). In this regard, it should be stressed that in our study we separately analyzed reports having a COVID-19 diagnosis synchronous or diachronous in respect to salivary specimen collection in order to cope with potential heterogeneities in the viral spreading following the disease’s onset. Even though eventual estimates were quite similar both for specificity (i.e. 97.7%, 95%CI 72.6-99.9 vs. 98.0%, 95%CI 95.5-99.1, for diachronous vs. synchronous assessment) and sensitivity (i.e. 83%, 95%CI 59.9-94.4 vs. 78.1%, 95%CI 55.5-91.1, and 87.2%, 95%CI 70.3-95.1 vs. 89.1%, 95%CI 77.8-95.0 for diachronous vs. synchronous assessment, in case control and cohort studies, respectively), with extensive overlapping of confidence intervals, such results were not obvious, for several reasons.
First and foremost, despite their “gold standard” status, nasopharyngeal specimens are a far from optimal basis for a reliable RT-qPCR analysis. In a recent study on 205 patients with confirmed COVID-19 infection, RT-qPCR positivity peaked to 93% in bronchoalveolar lavage specimens, dropping to 72% in sputum, and 63% in nasal swabs, with only a 32% positivity in pharyngeal swabs (39). As ACE2 receptor is reputed to be nearly ubiquitous in human body, such differences are reasonably due to an inappropriate timing of sample collection in relation to illness onset, as well as to the proficiency in sampling technique (39–41). More precisely, oral fluids seem to have a different conversion time compared to nasal swabs (22), and similarly the persistence of detectable viral RNA in saliva may exceed that reported in nasopharyngeal mucosal cells, without any clinical significance. An incoherence between nasal nasopharyngeal and salivary specimens could therefore occur as a consequence of the diachronous evolution of the disease in the different tissues, with two possible distinctive “open windows” for specimen collection. Such potential limitation was ever more important as the source of SARS-CoV-2 in saliva remains largely unknown, with several possible different sources, i.e. debris of the nasopharyngeal epithelium drained into the oral cavity; viral copies secreted from blood plasma into the mouth via the crevicular fluid, an exudate derived from periodontal tissue; direct infection of oral mucosal endothelial cells, which show overexpression of the viral receptor ACE2; endocytosis of viruses and virus-containing exosomes from the circulation by salivary cells, with following release into the salivary lumen by exocytosis (33). While the high specificity may be explained as a consequence of the deliberate design of primers, specific for the genome sequence of SARS-CoV-2, the relatively low sensibility may found a possible cause in the unavailability of specifically designed diagnostic kits. In facts, it should be stressed that all the study we included in our meta-analysis were performed repurposing diagnostic kits that were not specifically designed for studying salivary specimens. In effect, at our knowledge only the study of Joung et al. (42) has specifically inquired a diagnostic test that was initially designed in order to assess salivary specimens, but such inquiry was excluded from the final sample as not RT-qPCR based. Moreover, the salivary sample collection is not extensively standardized, particularly in such a setting, and the performance of the laboratory analyses may be largely impaired by several associated factors. Preservations solutions are suspected to be particularly critical in respect of their heterogenous ability to protect viral RNA from degradation (20), and the possible interference with extraction chemistry and qPCR reaction.
However, the analysis of sROC curves may at least partially rule out that test performance may be impaired by the content of viral RNA in the collected specimens, being the latter a consequence of the natural history of viral infection or of the sampling techniques. In effect, the analogies between reported curves, and the substantial correspondence of the AUCs from fixed and random models (0.896 vs. 0.867), collectively hint towards a possible irrelevance of the actual viral RNA load, i.e., it is reasonable that specimens improperly collected, or collected from patients in the very early or very late phases of the infection (i.e., viral clearance) do not have an increased risk to be improperly diagnosed as negative when compared to patients appropriately sampled in the proper “diagnostic open window” (4).
Notwithstanding the relative importance of our results, some significant limitations should be stressed. First and foremost, a significant share of sampled studied were retrieved from a pre-print platform (i.e., medrxiv.org) (20,21,26–29). Second, our meta-analysis did not take in account the presumptive delay between test performing and the reported onset of the symptoms, as not regularly available from index studies. As a consequence, it is possible that most of commercial kits that did not perform particularly well may have been impaired from the source, being employed in an inappropriate timeframe, underestimating their actual sensitivity in optimal settings (12,25,43,44). As a consequence, we suggest that our results should be retained cautiously and not as a comparative assessment of commercially available kits. Third, the studies included are generally characterized by low numbers and low sample power. Moreover, the pooled sensitivity analysis included both cohort and case-control studies, the former seemly outperforming the latter: as recently stated by Woloshin et al. (40), use of either known positive or contrived samples may lead to overestimates of the actual sensitivity of the assessed test, since the sample collection may miss infected material in the daily practice. In other words, the eventual pooled estimate for sensitivity in cohort studies may be an overestimate of the actual diagnostic performances, probably more precisely accounted in synchronous case-control studies (i.e. 78.1%, 95%CI 55.5-91.1).
In conclusion, albeit promising, the use of available salivary specimens for RT-qPCR studies on suspected COVID-19 cases is currently questionable for clinical purposes, and cannot substitute the conventional collection of nasopharyngeal samples. However, given the limitations of the present review, such as the small number of studies, the small sample sizes and the high, statistically significant amount of heterogeneity among studies, further high-quality research in the field is warranted.
Conflict of interest:
Each author declares that he or she has no commercial associations (e.g. consultancies, stock ownership, equity interest, patent/licensing arrangement etc.) that might pose a conflict of interest in connection with the submitted article. The facts, conclusions, and opinions stated in the article represent the authors’ research, conclusions, and opinions and are believed to be substantiated, accurate, valid, and reliable. However, as this article includes the results of personal researches of the Authors, presenting correspondent, personal conclusions and opinions, parent employers are not forced in any way to endorse or share its content and its potential implications.
References
- 1.Guan W, Liang W, Zhao Y, Liang H, Chen Z, Li Y, et al. Comorbidity and its impact on 1590 patients with Covid-19 in China: A Nationwide Analysis. Eur Respir J. 2020 14;55(5):2000547. doi: 10.1183/13993003.00547-2020. doi: 10.1183/13993003.00547-2020. [DOI] [PMC free article] [PubMed] [Google Scholar]
- 2.Huang C, Wang Y, Li X, Ren L, Zhao J, Hu Y, et al. Clinical features of patients infected with 2019 novel coronavirus in Wuhan, China. Lancet. 2020;395(10223):497–506. doi: 10.1016/S0140-6736(20)30183-5. doi: 10.1016/ S0140-6736(20)30183-5. [DOI] [PMC free article] [PubMed] [Google Scholar]
- 3.Li Q, Guan X, Wu P, Wang X, Zhou L, Tong Y, et al. Early Transmission Dynamics in Wuhan, China, of Novel Coronavirus-Infected Pneumonia. N Engl J Med. 2020;382(13):1199–1207. doi: 10.1056/NEJMoa2001316. doi: 10.1056/NEJMoa2001316. [DOI] [PMC free article] [PubMed] [Google Scholar]
- 4.Riccò M, Ferraro P, Gualerzi G, Ranzieri S, Bragazzi NL, Balzarini F, et al. Point-of-Care diagnostic of SARS-CoV-2: knowledge, attitudes, and beliefs (KAP) of medical workforce in Italy. Acta Biomed. 2020;91(2):57–67. doi: 10.23750/abm.v91i2.9573. doi: 10.23750/abm.v91i2.9573. [DOI] [PMC free article] [PubMed] [Google Scholar]
- 5.European Centre for Diseases Prevention and Control (ECDC) Stockholm: 2020. An overview of the rapid test situation for COVID-19 diagnosis in the EU / EEA. available from: https://www.ecdc.europa.eu/en/publications-data/overview-rapid-test-situation-covid-19-diagnosis-eueea. (accessed June 9, 2020) [Google Scholar]
- 6.Lippi G, Mattiuzzi C, Bovo C, Plebani M, Services S. Current laboratory diagnostics of coronavirus disease 2019 ( COVID-19) Acta Biomed. 2019;91(2):137–145. doi: 10.23750/abm.v91i2.9548. doi: 10.23750/abm.v91i2.9548. [DOI] [PMC free article] [PubMed] [Google Scholar]
- 7.Tang Y-W, Schmitz JE, Persing DH, Stratton CW. The Laboratory Diagnosis of COVID-19 Infection: Current Issues and Challenges. J Clin Microbiol [Internet] 2020;April:1–22. doi: 10.1128/JCM.00512-20. Available from: http://www.ncbi.nlm.nih.gov/pubmed/32245835 . [DOI] [PMC free article] [PubMed] [Google Scholar]
- 8.Riccò M, Ferraro P, Gualerzi G, Ranzieri S, Henry BM, Said Y Ben, et al. Point-of-Care Diagnostic Tests for Detecting SARS-CoV-2 Antibodies : A Systematic Review and Meta-Analysis of Real-World Data. J Clin Med. 2020;9(5):E1515. doi: 10.3390/jcm9051515. doi: 10.3390/jcm9051515. [DOI] [PMC free article] [PubMed] [Google Scholar]
- 9.Vashist SK. In Vitro Diagnostic Assays for COVID-19: Recent Advances and Emerging Trends. Diagnostics (Basel) 2020;10(4):202. doi: 10.3390/diagnostics10040202. doi: 10.3390/diagnostics10040202. [DOI] [PMC free article] [PubMed] [Google Scholar]
- 10.Cassaniti I, Novazzi F, Giardina F, Salivaro F, Sachs M, Perlini S, et al. Performance of VivaDiagTM COVID-19 IgM/IgG Rapid Test is inadequate for diagnosis of COVID-19 in acute patients referring to emergency room department. J Med Virol. doi: 10.1002/jmv.25800. 10.1002/jmv.25800. doi: 10.1002/jmv.25800. Online ahead of print. [DOI] [PMC free article] [PubMed] [Google Scholar]
- 11.Xu R, Cui B, Duan X, Zhang P, Zhou X, Yuan Q. Saliva: potential diagnostic value and transmission of 2019-nCoV. Int J Oral Sci. 2020;12(1):11. doi: 10.1038/s41368-020-0080-z. doi: 10.1038/s41368-020-0080-z. [DOI] [PMC free article] [PubMed] [Google Scholar]
- 12.Ceron JJ, Lamy E, Martinez-Subiela S, Lopez-Jornet P, Capela e Silva F, Eckersall PD, et al. Use of Saliva for Diagnosis and Monitoring the SARS-CoV-2: A General Perspective. J Clin Med. 2020;9(5):E1491. doi: 10.3390/jcm9051491. doi: 10.3390/jcm9051491. [DOI] [PMC free article] [PubMed] [Google Scholar]
- 13.Azzi L, Carcano G, Dalla Gasperina D, Sessa F, Maurino V, Baj A. Two cases of COVID-19 with positive salivary and negative pharyngeal or respiratory swabs at hospital discharge: a rising concern. Oral Dis. 2020 doi: 10.1111/odi.13368. 10.1111/odi.13368. doi: 10.1111/odi.13368. Online ahead of print. [DOI] [PMC free article] [PubMed] [Google Scholar]
- 14.Azzi L, Carcano G, Gianfagna F, Grossi P, Gasperina DD, Genoni A, et al. Saliva is a reliable tool to detect SARS-CoV-2. J Infect. 2020;S0163-4453(20):30213–9. doi: 10.1016/j.jinf.2020.04.005. doi: 10.1016/j.jinf.2020.04.005. [DOI] [PMC free article] [PubMed] [Google Scholar]
- 15.Food and Drug Admimistration. Coronavirus (COVID-19) Update: FDA Authorizes First Diagnostic Test Using At-Home Collection of Saliva Specimens. FDA NEWS RELEASE. 2020 available from: https://www.fda.gov/news-events/press-announcements/coronavirus-covid-19-update-fda-authorizes-first-diagnostic-test-using-home-collection-saliva ; accessed on June 9, 2020) [Google Scholar]
- 16.Sri Santosh T, Parmar R, Anand H, Srikanth K, Saritha M. A Review of Salivary Diagnostics and Its Potential Implication in Detection of Covid-19. Cureus. 2020;12(4):e7708. doi: 10.7759/cureus.7708. doi: 10.7759/cureus.7708. [DOI] [PMC free article] [PubMed] [Google Scholar]
- 17.Thompson R, Cunniffe N. The probability of detection of SARS-CoV-2 in saliva. Stat Methods Med Res. 2020 Apr;29(4):1049–1050. doi: 10.1177/0962280220915049. doi: 10.1177/0962280220915049. [DOI] [PubMed] [Google Scholar]
- 18.Moher D, Liberati A, Tetzlaff J, Altman DG, Altman D, Antes G, et al. Preferred reporting items for systematic reviews and meta-analyses: The PRISMA statement. PLoS Med. 2009;6(7):e1000097. doi: 10.1371/journal.pmed.1000097. doi: 10.1371/journal.pmed.1000097. [DOI] [PMC free article] [PubMed] [Google Scholar]
- 19.Bizzaro N, Villalta D, Giavarina D, Tozzoli R. Are anti-nucleosome antibodies a better diagnostic marker than anti-dsDNA antibodies for systemic lupus erythematosus? A systematic review and a study of metanalysis. Autoimmun Rev. 2012;12(2):97–106. doi: 10.1016/j.autrev.2012.07.002. doi: 10.1016/j.autrev.2012.07.002. [DOI] [PubMed] [Google Scholar]
- 20.Becker D, Sandoval E, Amin A, De Hoff P, Diets A, Leonetti N, et al. Saliva is less sensitive than nasopharyngeal swabs for COVID-19 detection in the community setting. medRxiv. 2020 2020.05.11.20092338. doi: 10.1101/2020.05.11.20092338. [Google Scholar]
- 21.L’Helgouach N, Champigneux P, Schneider FS, Molina L, Espeut J, Alali M, et al. EasyCOV: LAMP based rapid detection of SARS-CoV-2 in saliva. medRxiv. 2020 2020.05.30.20117291. doi: 10.1101/2020.05.30.20117291. [Google Scholar]
- 22.Fang Z, Zhang Y, Hang C, Ai J, Li S, Zhang W. Comparisons of viral shedding time of SARS-CoV-2 of different samples in ICU and non-ICU patients. J Infect. 2020;S0163-4453(20):30139–0. doi: 10.1016/j.jinf.2020.03.013. doi: 10.1016/j.jinf.2020.03.013. [DOI] [PMC free article] [PubMed] [Google Scholar]
- 23.Williams E, Bond K, Zhang B, Putland M, Williamson DA. Saliva as a non-invasive specimen for detection of SARS-CoV-2. J Clin Microbiol. 2020 doi: 10.1128/JCM.00776-20. JCM.00776-20. doi: 10.1128/JCM.00776-20. Online ahead of print. [DOI] [PMC free article] [PubMed] [Google Scholar]
- 24.Chen JH-K, Yip CC-Y, Poon RW-S, Chan K-H, Cheng VC-C, Hung IF-N, et al. Evaluating the use of posterior oropharyngeal saliva in a point-of-care assay for the detection of SARS-CoV-2. Emerg Microbes Infect. 2020:1–14. doi: 10.1080/22221751.2020.1775133. doi: 10.1080/22221751.2020.1775133. [DOI] [PMC free article] [PubMed] [Google Scholar]
- 25.To KKW, Tsang OTY, Leung WS, Tam AR, Wu TC, Lung DC, et al. Temporal profiles of viral load in posterior oropharyngeal saliva samples and serum antibody responses during infection by SARS-CoV-2: an observational cohort study. Lancet Infect Dis. 2020;20(5):565–74. doi: 10.1016/S1473-3099(20)30196-1. doi: 10.1016/S1473-3099(20)30196-1. [DOI] [PMC free article] [PubMed] [Google Scholar]
- 26.Iwasaki S, Fujisawa S, Nakakubo S, Kamada K, Yamashita Y, Fukumoto T, et al. Comparison of SARS-CoV-2 detection in nasopharyngeal swab and saliva. Medrxiv. doi: 10.1016/j.jinf.2020.05.071. 2020.05.13.20100206 doi: 10.1101/2020.05.13.20100206. [DOI] [PMC free article] [PubMed] [Google Scholar]
- 27.Wyllie AL, Fournier J, Casanovas-Massana A, Campbell M, Tokuyama M, Vijayakumar P, et al. Saliva is more sensitive for SARS-CoV-2 detection in COVID-19 patients than nasopharyngeal swabs. medRxiv. 2020 2020.04.16.20067835. doi: 10.1101/2020.04.16.20067835v1. [Google Scholar]
- 28.Jamal AJ, Mozafarihashjin M, Coomes E, Powis J, Xin Liu A, Paterson A, et al. Sensitivity of nasopharyngeal swabs and saliva for the detection of severe acute respiratory syndrome coronavirus 2 (SARS-CoV-2) medRxiv. 2020 doi: 10.1093/cid/ciaa848. 2020.05.01.20081026. doi: 10.1101/2020.05.01.20081026. [DOI] [PMC free article] [PubMed] [Google Scholar]
- 29.SoRelle JA, Mahimainathan L, McCormick-Baw C, Cavuoti D, Lee F, Bararia A, et al. Evaluation of symptomatic patient saliva as a sample type for the Abbott ID NOW COVID-19 assay. medRxiv. 2020 2020.06.01.20119198. doi: 10.1101/2020.06.01.20119198. [Google Scholar]
- 30.Pasomsub E, Watcharananan SP, Boonyawat K, Janchompoo P, Wongtabtim G, Suksuwan W, et al. Saliva sample as a non-invasive specimen for the diagnosis of coronavirus disease-2019 (COVID-19): a cross-sectional study. Clin Microbiol Infect. 2020 doi: 10.1016/j.cmi.2020.05.001. S1198-743X(20)30278-0. doi: 10.1016/j.cmi.2020.05.001. [DOI] [PMC free article] [PubMed] [Google Scholar]
- 31.McCormick-Baw C, Morgan K, Gaffney D, Cazares Y, Jaworski K, Byrd A, et al. Saliva as an Alternate Specimen Source for Detection of SARS-CoV-2 in Symptomatic Patients Using Cepheid Xpert Xpress SARS-CoV-2. J Clin Microbiol. 2020 doi: 10.1128/JCM.01109-20. JCM.01109-20. doi: 10.1128/JCM.01109-20. Online ahead of print. [DOI] [PMC free article] [PubMed] [Google Scholar]
- 32.Kojima N, Turner F, Klausner Self-Collected Oral Fluid and Nasal Swabs Demonstrate Comparable Sensitivity to Clinician Collected Nasopharyngeal Swabs for Covid-19 Detection. medRxiv. 2020 doi: 10.1093/cid/ciaa1589. 2020.04.11.20062372. doi: 10.1101/2020.04.11.20062372. [DOI] [PMC free article] [PubMed] [Google Scholar]
- 33.To KKW, Tsang OTY, Chik-Yan Yip C, Chan KH, Wu TC, Chan JMC, et al. Consistent detection of 2019 novel coronavirus in saliva. Clin Infect Dis. 2020 doi: 10.1093/cid/ciaa149. ciaa149. doi: 10.1093/cid/ciaa149. [DOI] [PMC free article] [PubMed] [Google Scholar]
- 34.Czumbel LM, Kiss S, Farkas N, Mandel I, Hegyi A, Nagy Á, et al. Saliva as a Candidate for COVID-19 Diagnostic Testing : A Meta-Analysis. medRxiv. 2020 doi: 10.3389/fmed.2020.00465. 2020.05.26.20112565 doi: 10.1101/2020.05.26.20112565. [DOI] [PMC free article] [PubMed] [Google Scholar]
- 35.Liu L, Wei Q, Alvarez X, Wang H, Du Y, Zhu H, et al. Epithelial Cells Lining Salivary Gland Ducts Are Early Target Cells of Severe Acute Respiratory Syndrome Coronavirus Infection in the Upper Respiratory Tracts of Rhesus Macaques. J Virol. 2011;85(8):4025–30. doi: 10.1128/JVI.02292-10. doi: 10.1128/JVI.02292-10. [DOI] [PMC free article] [PubMed] [Google Scholar]
- 36.Wang W-K, Chen S-Y, Liu I-J, Chen Y-C, Chen H-L, Yang C-F, et al. Detection of SARS-associated Coronavirus in Throat Wash and Saliva in Early Diagnosis. Emerg Infect Dis. 2004;10(7):1213–9. doi: 10.3201/eid1007.031113. doi: 10.3201/eid1007.031113. [DOI] [PMC free article] [PubMed] [Google Scholar]
- 37.Khurshid Z, Asiri FYI, Al Wadaani H. Human saliva: Non-invasive fluid for detecting novel coronavirus (2019-nCoV) Int J Environ Res Public Health. 2020 Apr 1;17(7):2225. doi: 10.3390/ijerph17072225. doi: 10.3390/ijerph17072225. [DOI] [PMC free article] [PubMed] [Google Scholar]
- 38.Bae S, Kim M-C, Kim J-Y, Cha H-H, Lim JS, Kim M-J, et al. Notice of Retraction: Effectiveness of Surgical and Cotton Masks in Blocking SARS-CoV-2. Ann Intern Med. 2020:L20–0745. doi: 10.7326/L20-0745. doi: doi: 10.7326/L20-0745. [DOI] [PMC free article] [PubMed] [Google Scholar]
- 39.Wang D, Hu B, Hu C, Zhu F, Liu X, Zhang J, et al. Clinical Characteristics of 138 Hospitalized Patients With 2019 Novel Coronavirus-Infected Pneumonia in Wuhan, China. Jama [Internet] 2020;323(11):1061–1069. doi: 10.1001/jama.2020.1585. doi: 10.1001/jama.2020.1585. [DOI] [PMC free article] [PubMed] [Google Scholar]
- 40.Woloshin S, Patel N, Kesselheim AS. False Negative Tests for SARS-CoV-2 Infection. N Eng J Med. 2020 doi: 10.1056/NEJMp2015897. doi: 10.1056/NEJMp2015897. Online ahead of print. [DOI] [PubMed] [Google Scholar]
- 41.Bourgonje AR, Abdulle AE, Timens W, Hillebrands J, Navis GJ, Gordijn SJ, et al. Angiotensin-converting enzyme-2 (ACE2), SARS-CoV-2 and pathophysiology of coronavirus disease 2019 ( COVID-19) J Pathol. 2020 doi: 10.1002/path.5471. 10.1002/path.5471. doi: 10.1002/path.5471. [DOI] [PMC free article] [PubMed] [Google Scholar]
- 42.Joung J, Ladha A, Saito M, Segel M, Bruneau R, Schwartz L, et al. Point-of-care testing for COVID-19 using SHERLOCK diagnostics. medRxiv. 2020 2020.05.04.20091231. doi: 10.1101/2020.05.04.20091231. [Google Scholar]
- 43.Reusken CB, Buiting A, Bleeker-Rovers C, Diederen B, Hooiveld M, Friesema I, et al. Rapid assessment of regional SARS-CoV-2 community transmission through a convenience sample of healthcare workers, the Netherlands, March 2020. Euro Surveill. 2020;25(12):2000334. doi: 10.2807/1560-7917.ES.2020.25.12.2000334. doi: 10.2807/1560-7917.ES.2020.25.12.2000334. [DOI] [PMC free article] [PubMed] [Google Scholar]
- 44.Hirotsu Y, Maejima M, Shibusawa M, Nagakubo Y, Hosaka K, Amemiya K, et al. Pooling RT-PCR test of SARS-CoV-2 for large cohort of “healthy” and infection-suspected patients: A prospective and consecutive study on 1,000 individuals. medRxiv. 2020 doi: 10.1038/s41598-020-76043-z. 2020.05.04.20088146. doi: 10.1101/2020.05.04.20088146. [DOI] [PMC free article] [PubMed] [Google Scholar]