Abstract
Based on single-unit recordings of modulation transfer functions (MTFs) in the inferior colliculus (IC) and the medial geniculate body (MGB) of the unanesthetized rabbit, we identified two opposing populations: band-enhanced (BE) and band-suppressed (BS) neurons. In response to amplitude-modulated (AM) sounds, firing rates of BE and BS neurons were enhanced and suppressed, respectively, relative to their responses to an unmodulated noise with a one-octave bandwidth. We also identified a third population, designated hybrid neurons, whose firing rates were enhanced by some modulation frequencies and suppressed by others. Our finding suggests that perception of AM may be based on the co-occurrence of enhancement and suppression of responses of the opposing populations of neurons. Because AM carries an important part of the content of speech, progress in understanding auditory processing of AM sounds should lead to progress in understanding speech perception. Each of the BE, BS, and hybrid types of MTFs comprised approximately one-third of the total sample. Modulation envelopes having short duty cycles of 20–50% and raised-sine envelopes accentuated the degree of enhancement and suppression and sharpened tuning of the MTFs. With sinusoidal envelopes, peak modulation frequencies were centered around 32–64 Hz among IC BE neurons, whereas the MGB peak frequencies skewed toward lower frequencies, with a median of 16 Hz. We also tested an auditory-brainstem model and found that a simple circuit containing fast excitatory synapses and slow inhibitory synapses was able to reproduce salient features of the BE- and BS-type MTFs of IC neurons.
NEW & NOTEWORTHY Opposing populations of neurons have been identified in the mammalian auditory midbrain and thalamus. In response to amplitude-modulated sounds, responses of one population (band-enhanced) increased whereas responses of another (band-suppressed) decreased relative to their responses to an unmodulated sound. These opposing auditory populations are analogous to the ON and OFF populations of the visual system and may improve transfer of information carried by the temporal envelopes of complex sounds such as speech.
Keywords: auditory information processing, sensory coding, speech recognition, temporal envelopes, visual ON- and OFF-channels
INTRODUCTION
Sounds of human speech and music have fluctuations in amplitudes at rhythms ranging from about once every second to about once every hundredth of a second (Ding et al. 2017; Steeneken and Houtgast 1980; Stevens 2000; Varnet et al. 2017). When such sounds are divided into multiple frequency bands, the signal in each band can be decomposed into a modulating envelope and a carrier using the Hilbert transform (Rabiner and Schafer 2011). Telecommunication systems carrying speech signals capitalize on this principle; a prominent example of this method is speech vocoding (Dudley 1939, 1940; review: Schroeder 1966). Several studies have found that a small number (e.g., 4 or 5) of amplitude-modulated (AM) noise bands or sinusoids can produce high rates of speech recognition (Delattre et al. 1952; Dorman et al. 1997; Hill et al. 1968; Loizou et al. 1999; Shannon et al. 1995). Furthermore, using “auditory chimeras” that have envelopes of one sound and carriers of another, Smith et al. (2002) found that the envelope was most important for speech reception, whereas the carrier (also known as the fine structure) was most important for pitch perception and sound localization. These findings indicate that the modulating envelopes of band-pass filtered speech convey an important part of linguistic content of speech and that insights into how we perceive speech would require an understanding of how the auditory system processes AM sounds. The present study is directed toward this goal.
Previous studies of the auditory pathways have described a variety of types of modulation transfer functions (MTFs) of neurons of the central auditory system, such as band-pass, low-pass, high-pass, all-pass, and band-reject types (reviewed: Joris et al. 2004). With a few exceptions, e.g., Krishna and Semple (2000; IC) and Yin et al. (2011; auditory cortex), most studies did not compare each neuron’s responses to modulated stimuli with the response to the unmodulated carrier stimulus. A shortcoming with this common approach is that the pattern of a neuron’s MTF cannot indicate whether the underlying mechanism involves enhancement, suppression, or both. This situation of the literature is all the more surprising because in behavioral studies of humans and animals, distinguishing modulated and unmodulated stimuli is the standard approach (Carney et al. 2014; Dent et al. 2002; Kelly et al. 2006; Moody 1994; Viemeister 1979).
We sought to rectify this shortcoming by designing our study as follows. We recorded single-unit activities of the inferior colliculus (IC) and the medial geniculate body (MGB) of the unanesthetized rabbit. In all neurons studied, we determined whether modulating the amplitude of a stimulus led to enhancement or suppression relative to a neuron’s response to the same carrier stimulus unmodulated. Our stimuli consisted of an unmodulated noise plus a set of AM stimuli covering a range of modulation frequencies. Based on MTFs resulting from this approach, we identified two opposing populations: band-enhanced (BE) and band-suppressed (BS) neurons whose firing rates to AM sounds were enhanced and suppressed, respectively, relative to their responses to an unmodulated stimulus. The opposing nature of the BE and BS populations is analogous to the visual ON and OFF populations of the visual system (Schiller 1992). Possible advantages of the opposing populations in stimulus coding are discussed.
We also investigated effects of modulating envelope properties, i.e., duty cycle and rise-fall slope of smooth trapezoidal envelopes, on MTFs and found that envelopes having a short duty cycle (20–50%) and “raised-sine” envelopes (Bernstein and Trahiotis 2009, 2010) produced more pronounced enhancement and suppression and sharper tuning of MTFs.
To test a hypothesis about how the observed MTFs are created, we simulated MTFs of a model of the auditory brainstem and demonstrate that a relatively simple neural circuit model that includes fast excitatory synapses and slow inhibitory synapses can reproduce salient features of enhancement and suppression in the MTFs of IC neurons.
MATERIALS AND METHODS
This study was approved by the University of Connecticut Health Center Animal Care Committee and was conducted according to the National Institutes of Health guidelines. The procedures for neural recording in the present study were the same as those reported previously (Kim et al. 2015; Kuwada and Batra 1999; Kuwada et al. 2014). Briefly, extracellular single-unit action potentials were recorded in the right IC and MGB of unanesthetized young adult female Dutch-Belted rabbits with custom-made tungsten-in-glass microelectrodes. During the recording sessions, which typically lasted ∼2 h, the rabbit’s body was placed in a snug-fitting body stocking and positioned in a frame. The rabbit’s head was immobilized by clamping a brass rod that was mounted on the skull. The neurophysiological results are based on single-unit recordings of 105 neurons in the IC of two rabbits and 30 neurons in the MGB of one rabbit.
Stimulus generation and data collection.
For each neuron, we determined the best frequency (BF) using pure tones or one-third octave band noise. For measurements of MTFs, we used noise stimuli with a bandwidth of one-octave, centered at BF, and a level ∼30 dB relative to rate threshold. Each neuron was characterized by a combination of its response to the noise (unmodulated) and its responses to AM stimuli. A critical feature of this study was that we always compared a neuron’s firing rate to an AM sound to its response to the unmodulated sound. We thus determined the extent to which a neuron’s firing rate was enhanced or suppressed by AM as an important part of the MTF.
Several modulation envelopes used are described below. The modulation frequency was varied from 2–512 Hz in 1-octave steps. The modulation depth was 100% for all cases in this study. We limited the modulation frequency to be lower than 12% of the center frequency of the carrier noise band. The 12% corresponds to the difference between the upper cutoff and center frequency of a one-third-octave bandpass filter that approximates auditory filtering (Moore 2012). Each stimulus consisted of a 1,000-ms noise burst (with 4-ms smooth rise-fall gates) and an 800-ms silence. Each stimulus was presented twice. The stimuli were delivered monaurally to the left ear (contralateral to the neural recording side) with a closed system, i.e., an enclosed Beyer DT-770 earphone connected to a tube embedded in a custom-fitted ear mold. We chose to investigate MTFs to monaural stimuli as an early step needed before addressing MTFs to binaural stimuli. In a binaural study of MTFs, it is important to control interaural time, level, and spectral differences and devise a scheme for determining and justifying which part of a vast stimulus space to explore for each neuron, e.g., a condition that represents the neuron’s best spatial location. Previous studies have shown interactions between tuning for interaural time differences and for AM frequency (D’Angelo et al. 2003; Sterbing et al. 2003).
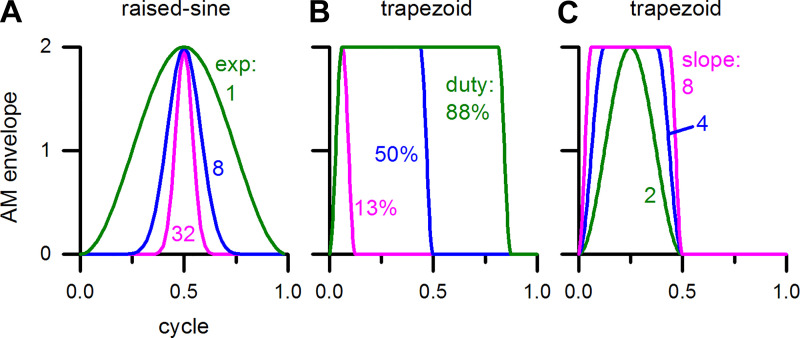
The modulation envelopes that were used in this study are illustrated in Fig. 1. We included the raised-sine envelopes of Bernstein and Trahiotis (2009, 2010), motivated by their finding that a human listener’s sensitivity to envelope-based interaural time difference (ITD) of high-frequency sounds was higher for raised-sine envelopes than for the sinusoidal envelope. Compared with the sinusoidal envelope, the raised-sine envelopes have shorter duty cycles and sharper rise-fall slopes. Duty cycle corresponds to the proportion of a modulation cycle over which the stimulus envelope is above a threshold. With threshold defined to be 1% of the maximum stimulus amplitude, duty cycles of the three envelopes shown in Fig. 1A were 93.6, 46.0, and 23.9% for the sinusoidal, “raised-sine-8”, and “raised-sine-32” envelopes, respectively. The “8” and “32” here correspond to the exponent, “n”, in equations 1 and 2 of Bernstein and Trahiotis (2010). We determined the rise-fall slopes of the modulation envelopes in two steps.
Fig. 1.
Different types of amplitude modulation (AM) envelopes. A: sine, raised-sine-8, and raised-sine-32 envelopes. B: smooth trapezoid envelopes with different duty cycles with a fixed relative rise-fall slope of 8. C: smooth trapezoid envelopes with different rise-fall slopes with a fixed duty cycle of 50%.
First, we determined the rise-fall slope of each envelope at the half-maximum point. We then expressed this slope relative to that of the sinusoidal envelope. The relative rise-fall slopes of the three envelopes in Fig. 1A were 1.00, 2.41, and 4.75.
In the raised-sine envelopes, duty cycle and rise-fall slopes covary with the exponent, and thus the influences of these two parameters on neural responses could not be ascertained separately just by varying the exponent. Because we desired to control duty cycle and rise-fall slope independently to determine their respective roles, we introduced a “smooth trapezoidal envelope” that consisted of the following parts: a smooth rising part, an optional constant-amplitude part, a smooth falling part, and an optional “off” part. The rising and falling parts of the envelope were computed as follows. We started with a sine wave spanning from −90° to +270°. We modified this signal such that it rose from 0 to 1 and fell from 1 to 0 by adding 1 to this signal and dividing it by 2. The modified signal is thus a full cycle of a sine wave (−90° to +270°) that is vertically shifted and scaled. The rising and falling parts combined together spanned an interval equal to or less than the modulation cycle. Variation in duty cycle was achieved by varying the fraction of the optional “off” portion. Variation in rise-fall slope was achieved by varying the fraction of the rising/falling portion. The present envelope avoids the transients that are caused by sharp edges of a traditional trapezoidal envelope. Figure 1B illustrates three smooth trapezoidal envelopes that have different duty cycles (13 to 88%) but the same relative rise-fall slope of 8. Another group of three smooth trapezoidal envelopes that have different relative rise-fall slopes (2 to 8) but the same duty cycle (50%) are illustrated in Fig. 1C.
Root mean square (RMS) levels of AM signals are, in general, different from that of the unmodulated version of the signal. With 100% modulation depth, RMS levels of the signals for sine, raised-sine-8 and raised-sine-32 envelopes were +1.8, −2.5, and −5.4 dB relative to the unmodulated signal level, respectively. For smooth trapezoidal AM signals, the relative RMS levels varied from −7.0 to +5.1 dB depending on duty cycle and rise-fall slope that we used.
In this study, an unmodulated stimulus plus nine AM stimuli comprised a stimulus set. The attenuator setting was selected to produce a desired target sound pressure level for the unmodulated stimulus, and the same attenuator setting was used for all stimuli of each stimulus set. Consequently, across different stimulus sets for various modulation types, sound pressure level of the unmodulated stimulus was constant, but sound pressure levels of various AM stimuli varied (by 7.2 dB for the sine and raised-sine envelopes). We chose this approach to determine the extent of enhancement and suppression of the response to the unmodulated stimulus just by modulating the carrier stimulus without any scaling of the stimulus (i.e., without changing the attenuation).
Classification of MTF types.
We classified all MTFs into four types based on how much the rate changed at the peak or trough of the MTF with respect to the rate in response to the unmodulated noise. A criterion, c, was used to specify the required change in rate; e.g., for a value of c = 1.2, the rate at the peak of the MTF had to be ≥1.2 times the response to the unmodulated stimulus to be classified as the band-enhanced (BE) type; analogously, the rate at the trough had to be < (1/1.2) times the response to the unmodulated stimulus to be classified as the band-suppressed (BS) type. Furthermore, to be categorized as the BE or BS type, responses had to show only enhancement or suppression. Neurons with both (or neither) were categorized as the hybrid (or flat) type. The present classification of MTFs based on enhancement and suppression is novel. We first used this classification in our previous paper (Kim et al. 2015); the same classification was also used in some of our other studies (Carney et al. 2016; Fan et al. 2018).
Specifically, when both of the following conditions were met, the MTF was classified as the BE type:
| (1) |
and
| (2) |
where r(f) is the average firing rate to an AM sound with modulation frequency, f; c is a criterion related to the change in rate, either 1.2 or 1.4; and rum is the average firing rate to the unmodulated carrier sound.
When both of the following conditions were met, the MTF was classified as the BS type:
| (3) |
and
| (4) |
When both of the following conditions were met, the MTF was classified as the hybrid type:
| (5) |
and
| (6) |
When both of the following conditions were met, the MTF was classified as the flat type:
| (7) |
and
| (8) |
RESULTS
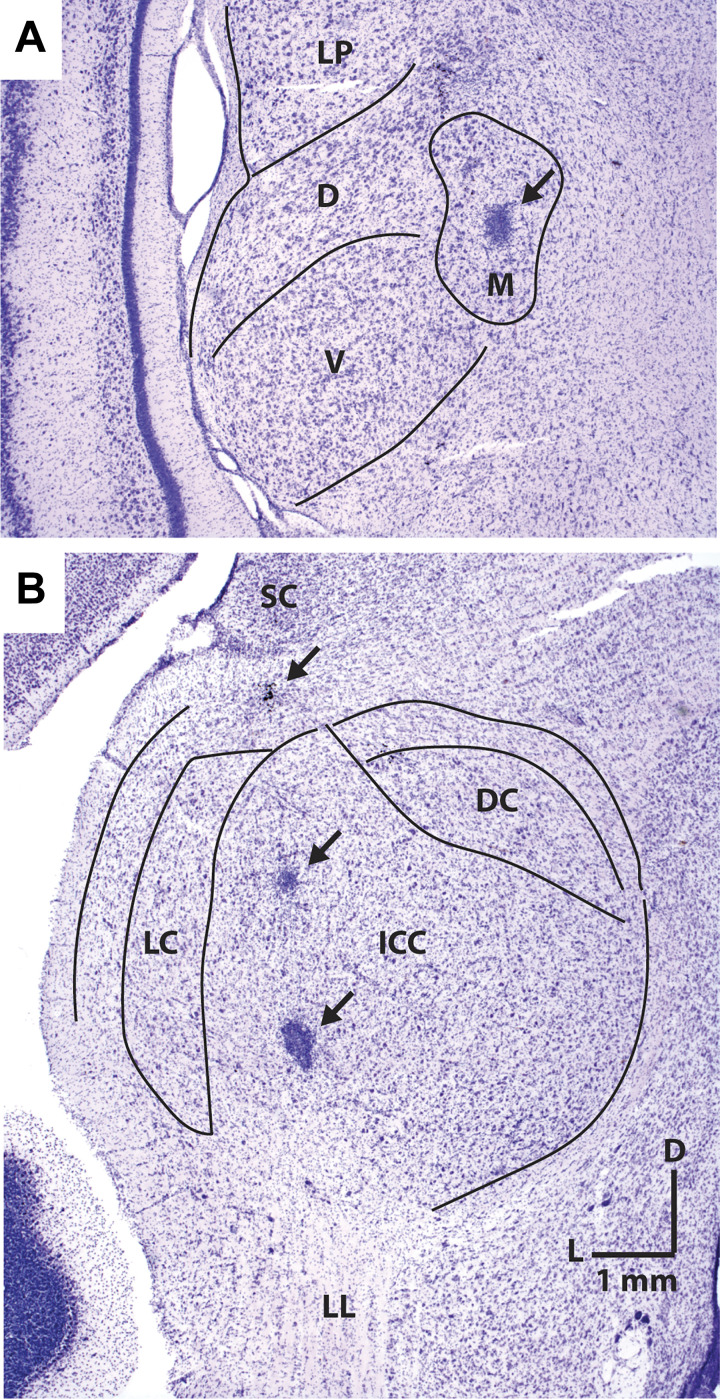
This study consisted of both neurophysiology and modeling. A few sites of neural recordings were verified by electrolytic lesions. Figure 2 represents histological sections in transverse planes that include electrolytic lesions made at recording sites, marked by arrows in the MGB (Fig. 2A) and in the IC (Fig. 2B).
Fig. 2.
Histological sections in transverse planes that show electrolytic lesions of recording sites marked by arrows in the medial geniculate body (A) and the inferior colliculus (B). D, dorsal; DC, dorsal cortex; ICC, central nucleus of inferior colliculus; L, lateral; LC, lateral cortex; LL, lateral lemniscus; LP, lateral posterior; M, medial; SC, superior colliculus; V, ventral.
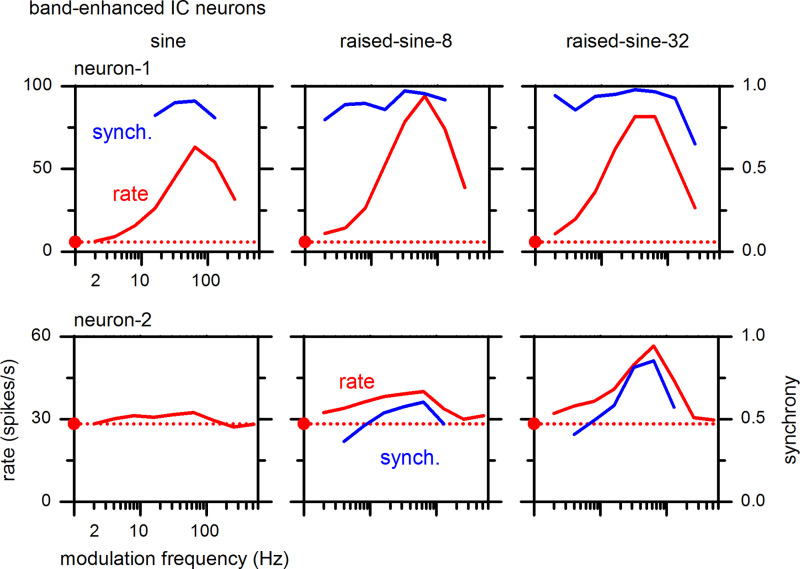
Examples of MTFs of BE-type IC neurons are described in Fig. 3. The two rows represent two neurons, and the three columns represent three different modulation envelopes, i.e., sine, raised-sine-8, and raised-sine-32. In response to the sinusoidal AM envelope (Fig. 3, left column), neuron-1 (Fig. 3; top) exhibited a BE-type MTF, with enhanced firing rates that were tuned around 64 Hz (Fig. 3, top left, red). In contrast, neuron-2 (Fig. 3, bottom) exhibited a “flat”-type MTF. Significance of synchrony to the modulation envelope was determined with a Rayleigh test of uniformity (Mardia and Jupp 2009). When synchrony was significant (P < 0.001), it was plotted in blue (referring to the y-axis scale in on the right side). Synchrony was high (mostly 0.8–0.98) for a range of modulation frequencies around the firing-rate peak.
Fig. 3.
Rate (left ordinate) and synchrony (right ordinate) modulation transfer functions of two band-enhanced inferior colliculus (IC) neurons (neurons-1 and -2) with a best frequency (BF) of 4 and 8 kHz, respectively. The carrier stimulus was a 1-octave band noise centered at the neuron’s BF. The red filled dot and horizontal dotted line represent the neuron’s firing rate to the unmodulated noise stimulus.
When the raised-sine envelopes were used (Fig. 3, middle and right columns), MTFs of both neurons became BE (note: when a neuron’s MTF type changed under different modulation envelopes, we chose the MTF type under the raised-sine-8 envelope to be the representative MTF type of the neuron). The peak firing rate of neuron-1 was highest under the raised-sine-8 envelope, whereas the highest rate was under the raised-sine-32 envelope for neuron-2. In neuron-1, the range of modulation frequencies showing significant synchrony was broader under the raised-sine envelopes. In neuron-2, synchrony was only significant under raised-sine envelopes and was strongest under the raised-sine-32 envelope.
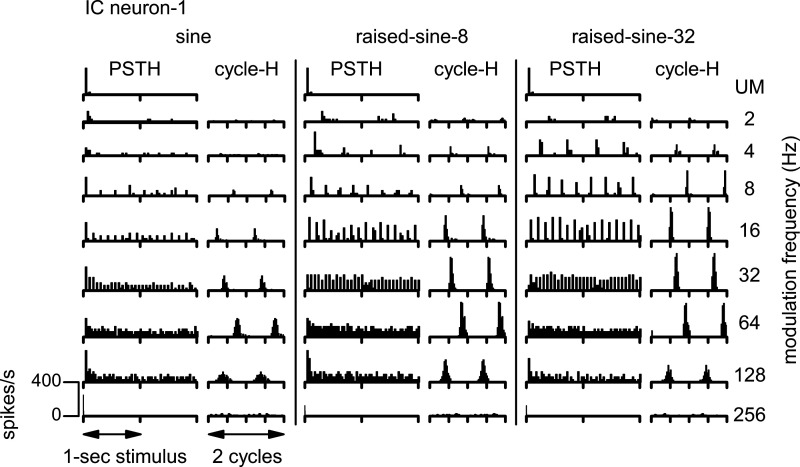
Temporal characteristics of spike discharges were examined using both poststimulus time histograms (PSTHs) and cycle histograms (cycle-Hs) of spike discharges. The PSTHs convey whether discharges are transient or sustained, whereas the cycle-Hs convey whether discharges are synchronized to the modulation envelope. Cycle-Hs that contain two cycles of the AM envelope are illustrated here to facilitate visualization of synchrony. Figure 4 displays PSTHs and cycle-Hs for responses of neuron-1 to the same stimuli as in Fig. 3. This neuron had onset discharges when the noise stimulus was unmodulated (Fig. 4, top row). Note that, in this case, there were no corresponding cycle-Hs because there was no modulation of the stimulus. The neuron’s firing rate was enhanced by AM most strongly when the modulation rate was 32–64 Hz. These enhanced firing rates were accompanied by discharges tightly locked to the modulation envelope, as illustrated by the cycle-Hs. Both the enhancement of firing rate and synchrony were much more pronounced in response to the raised-sine envelopes than to the sinusoidal envelope. For unmodulated noise, responses were dominated by the onset response, whereas responses to modulated noise were mostly sustained, in terms of firing rates per modulation cycle, particularly for the raised-sine envelopes.
Fig. 4.
Poststimulus time histograms (PSTH) and cycle histograms (cycle-H) of responses of a band-enhanced inferior colliculus (IC) neuron (neuron-1) represented in Fig. 3. The noise was unmodulated (UM; top row) or amplitude-modulated (rows 2–9). Three different modulation envelopes were used: a sine function (left), raised-sine-8 (middle), and raised-sine-32 (right). The stimulus, consisting of 1-s noise bursts followed by 0.8-s silent intervals, was presented twice monaurally to the ear contralateral to the neural recording site. Bin width for the PSTHs was 16.1 ms; bin width for the cycle-Hs was 1/32 cycle.
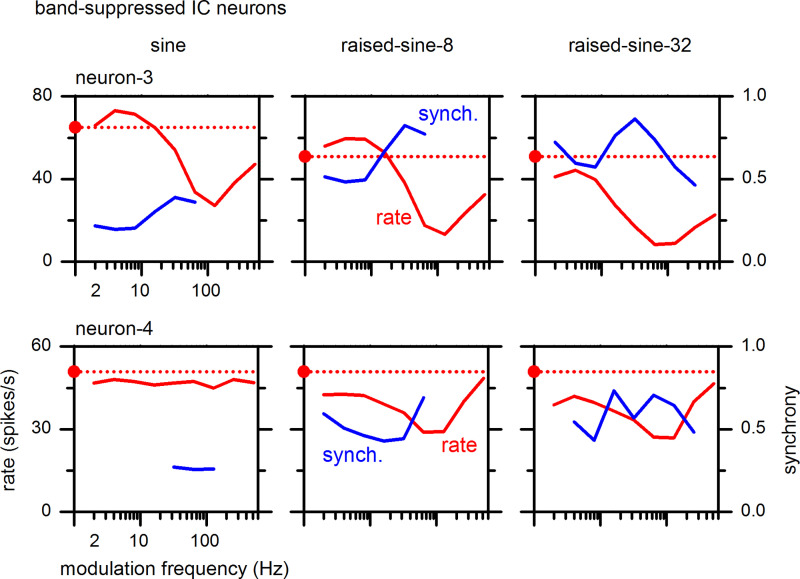
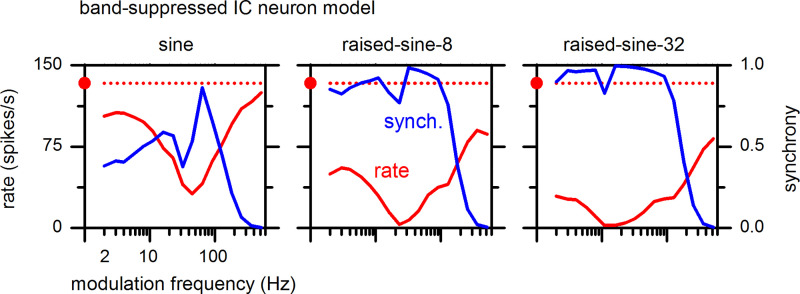
Examples of MTFs of BS-type IC neurons are shown in Fig. 5, in the same format as Fig. 3. In response to the sinusoidal AM envelope, neuron-3 (Fig. 5, top left, red) exhibited a clear BS-type MTF with suppressed firing rates that were tuned around 128 Hz. In contrast, neuron-4 (Fig. 5, bottom left, red) exhibited a flat-type MTF. In response to the raised-sine envelopes (Fig. 5, middle and right columns), however, both neurons exhibited clear BS-type MTFs. Thus, Figs. 3 and 5 together illustrate that raised-sine envelopes are more effective than the sinusoidal envelope in delineating MTF characteristics of both BE- and BS-type neurons.
Fig. 5.
Rate and synchrony modulation transfer functions of two band-suppressed inferior colliculus (IC) neurons (neurons-3 and -4) with a best frequency of 14 kHz and 5 kHz, respectively. The format of this figure is same as Fig. 3.
Regarding synchrony, neuron-3 (Fig. 5, top, blue) showed synchrony to the AM envelope for all three types of modulation. Under the sinusoidal envelope, neuron-3 showed weak (0.2–0.4) but statistically significant (P < 0.001) synchrony to modulation frequencies of 2–64 Hz (Fig. 5, top left, blue). Compared with the sinusoidal envelope, raised-sine envelopes induced stronger synchronies (0.5–0.8) over wider ranges of modulation frequencies, as high as 256 Hz. Neuron-4 responded to the sinusoidal envelope (Fig. 5, bottom left, blue), with weak (0.25–0.3) synchrony for modulation frequencies of 32–128 Hz, even though the firing rate remained essentially unchanged from the unmodulated case. Synchrony of both neurons became stronger under the raised-sine envelopes.
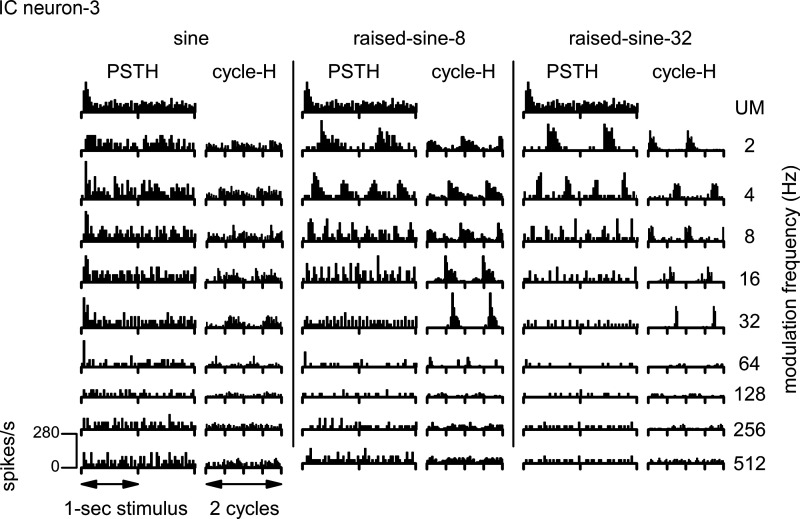
Figure 6 shows PSTHs and cycle-Hs of responses of neuron-3 (a BS neuron) in the same format as Fig. 4. When the noise stimulus was unmodulated (Fig. 6, PSTHs, top row), the neuron’s response consisted of both onset and sustained discharges. The neuron’s discharges were suppressed by AM, most strongly when the modulation rate was 64–128 Hz.
Fig. 6.
Poststimulus time histograms (PSTH) and cycle histograms (cycle-H) of responses of a band-suppressed inferior colliculus (IC) neuron represented in Fig. 5 (neuron-3). The format of this figure is same as Fig. 4.
These histograms illustrate a seemingly paradoxical phenomenon: as the firing rate became more and more suppressed with increasing modulation rate from 2 to 32 Hz, the spike discharges of the BS neuron became more tightly locked to the modulation envelope, yielding higher synchrony. The cycle-Hs also illustrate that raised-sine envelopes induced spike discharges that were more tightly locked to the modulation envelope.
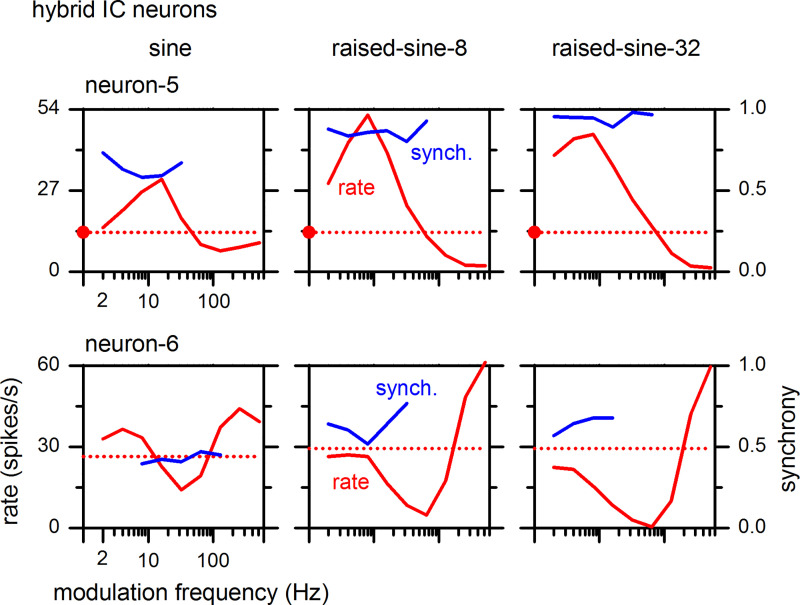
Hybrid-type MTFs exhibit both BE and BS properties in different sub-bands of modulation frequency; two examples are shown in Fig. 7. Hybrid types were divided into hybrid-1, which exhibits enhancement in lower modulation frequencies and suppression in upper modulation frequencies, and hybrid-2, which exhibits the reverse combination. Analogous to the BE and BS neurons above, enhancement and suppression of hybrid neurons were more pronounced when the modulation envelope was of raised-sine type. In both of these neurons, there was moderate to strong (0.25–0.95) synchrony for some modulation frequencies. As for the BE and BS neurons, hybrid neurons also showed higher synchrony in response to raised-sine envelopes.
Fig. 7.
Rate and synchrony modulation transfer functions of inferior colliculus (IC) neurons exhibiting hybrid types. Neuron-5 (top) and Neuron-6 (bottom) correspond to hybrid-1 and hybrid-2 types, respectively. The best frequency was 8 kHz for both neurons.
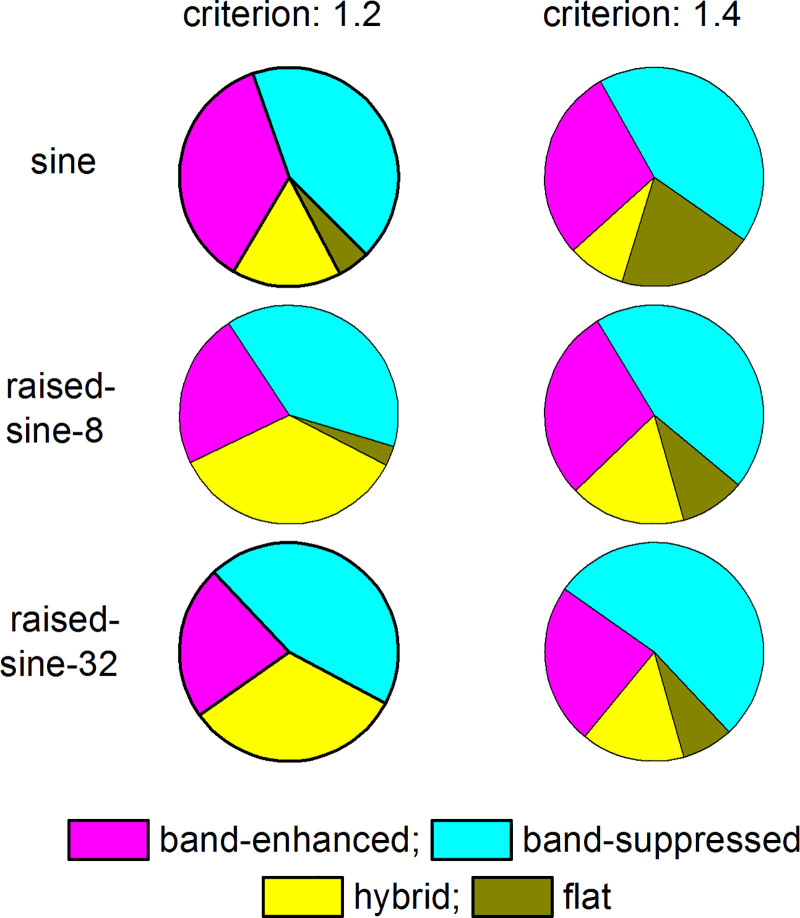
How prevalent are the BE, BS, and hybrid neurons in the IC? Figure 8 describes the distributions of these neuron types for two criteria (c = 1.2 and 1.4) and three modulation envelopes (sine, raised-sine-8, and raised-sine-32). The most numerous neurons belonged to the BS type, comprising 41–56% of the sample, depending on the envelope and criterion used. The least numerous neurons belonged to the flat type, being negligible (< 5%) for all three envelopes with the criterion of 1.2. When the criterion was 1.4, the flat type comprised 8–21% of the sample. Furthermore, the flat-type MTFs under sinusoidal envelope often became hybrid or BS type under raised-sine envelopes. Relative prevalence of the BE and hybrid types was mostly comparable; the BE type comprised 24–38% of the sample, and the hybrid type comprised 9–37%, depending on the envelope and criterion used.
Fig. 8.
Distributions of different types of rate modulation transfer functions of inferior colliculus neurons (n = 105). The criterion of normalized rate for separating neurons into different types was 1.2 (left) or 1.4 (right).
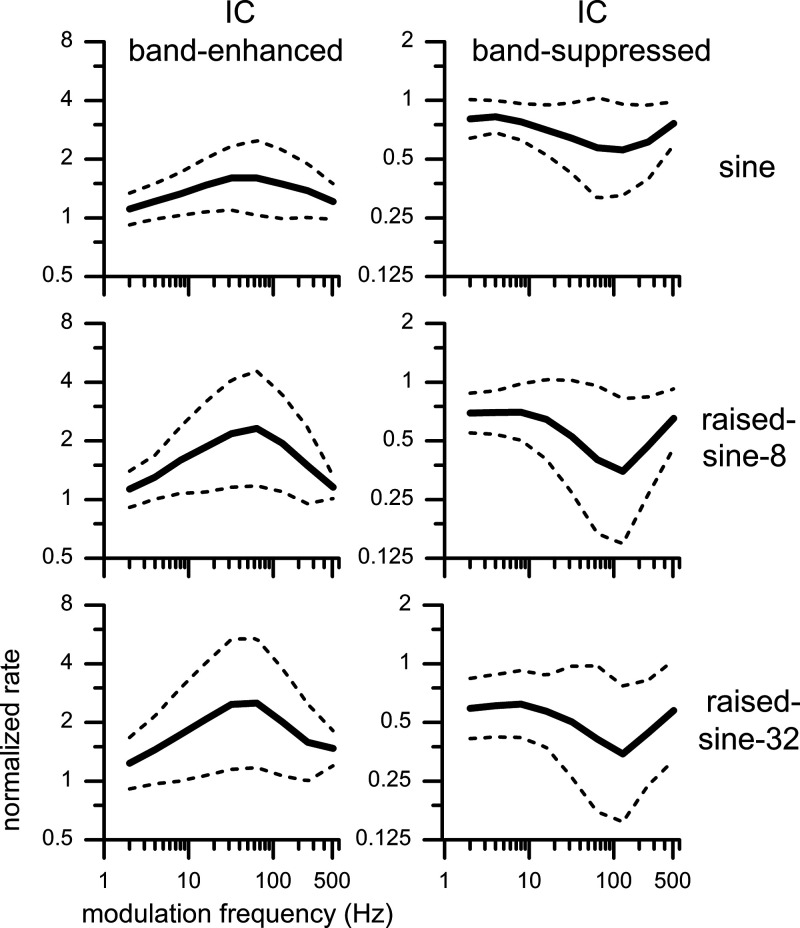
What would we see if the relative response rates in the MTFs of all of the recorded neurons were averaged? Figure 9 shows averaged MTFs, for which all rates were normalized by the response to unmodulated noise before averaging. The solid lines in Fig. 9 represent geometric means of relative firing rates taken separately from the BE and BS neurons (defined with 1.2 criterion) for three modulation envelopes. Note that the y-axes have logarithmic scales. The dashed lines represent ± 1 SD from the geometric mean, computed on the logarithm of relative firing rates. The population MTFs were tuned, with the BE MTFs having a peak of ∼32–64 Hz and the BS MTFs having a trough at 128 Hz. The tuning of both populations was sharper for the raised-sine envelopes than for the sinusoidal envelope. Compared with the sinusoidal envelope, raised-sine envelopes produced both greater enhancement of BE neurons and greater suppression of BS neurons. The peak relative population response of the BE neurons was 1.60, 2.31, and 2.51, for the sinusoidal, raised-sine-8, and raised-sine-32 envelopes, respectively. Analogously, the trough relative population response of the BS neurons was 0.56, 0.39, and 0.34 for the three corresponding envelopes.
Fig. 9.
Population rate modulation transfer functions of band-enhanced (left) and band-suppressed (right) inferior colliculus (IC) neurons, respectively, obtained with 3 types of envelopes and defined with a 1.2 criterion. Solid lines: mean; dashed lines: means ± SD computed on logarithmic y-scales. No. of neurons for the band-enhanced type: 38, 24, and 24 for the sine, raised-sine-8, and raised-sine-32 envelopes, respectively; those for the band-suppressed type: 45, 41, and 47.
Are the different MTF types made up of neurons with different BFs? This question was evaluated with the chi-square test applied to the distributions of BFs for the BE, BS, and hybrid MTF types observed with the raised-sine-8 envelope and a criterion of 1.2, as described in Table 1. The test outcome was that the BF distributions were not significantly different among the three MTF types; P = 0.094, chi-square = 4.78, degree of freedom = 10.
Table 1.
Distributions of best frequencies of neurons belonging to the BE, BS, and hybrid MTF types obtained with the raised-sine-8 envelope and a criterion of 1.2
| BF (kHz) | BE | BS | Hybrid | Sum |
|---|---|---|---|---|
| 0.5 | 0 | 1 | 0 | 1 |
| 1.0 | 0 | 1 | 2 | 3 |
| 2.0 | 1 | 11 | 3 | 15 |
| 4.0 | 11 | 15 | 19 | 45 |
| 8.0 | 10 | 7 | 11 | 28 |
| 16.0 | 2 | 6 | 2 | 10 |
| sum | 24 | 41 | 37 | 102 |
Best frequencies (BFs) were grouped into 1-octave-wide bins. The chi-square test indicated that the BF distributions were not significantly different among the three modulation transfer function (MTF) types; P = 0.094, chi-square = 4.78, degree of freedom = 10. BE, band-enhanced; BS, band-suppressed.
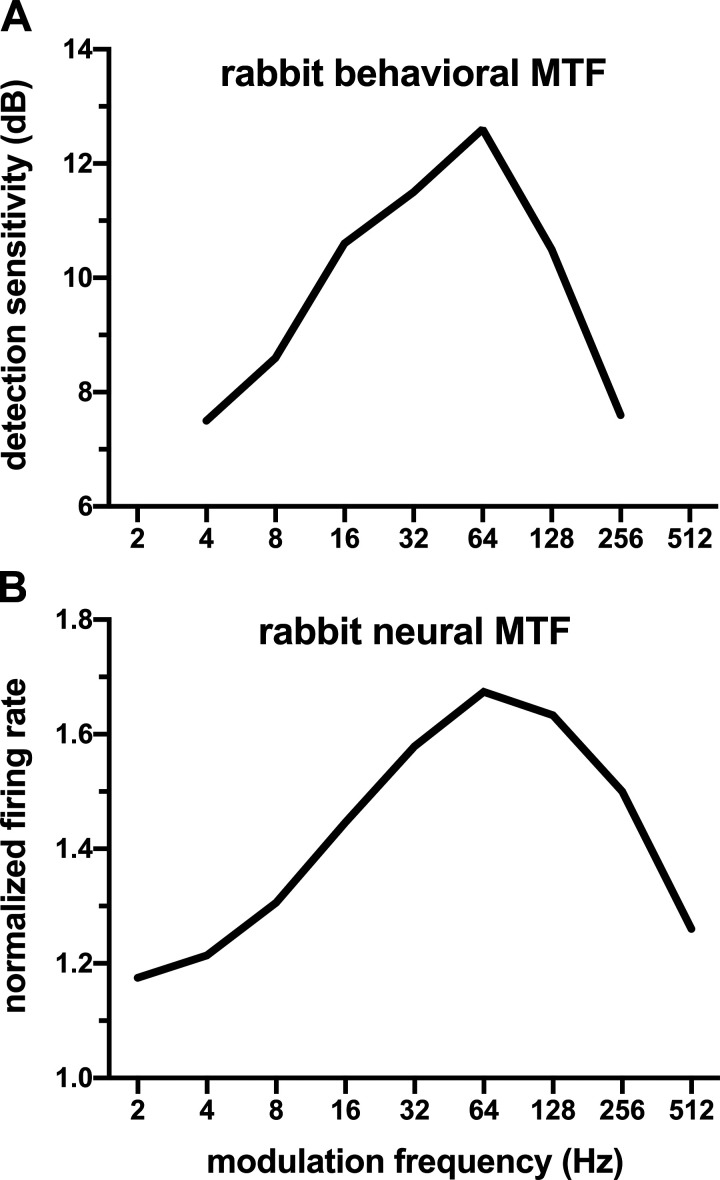
What is the relationship between the MTFs of the rabbit IC neurons and the rabbit’s behavioral MTFs? Using an operant behavioral procedure, Carney et al. (2014) measured the rabbit’s AM detection threshold for various modulation frequencies using a sinusoidal envelope and a wideband noise. We took reciprocals of the detection thresholds (i.e., modulation depths in dB) as detection sensitivities and plotted them versus modulation frequency in Fig. 10 (top). Figure 10 (bottom) shows a neural MTF that was derived from the BE and BS population responses to a sinusoidal envelope (same as Fig. 9, top). This MTF corresponds to the geometric mean of the normalized rate of the BE population and reciprocal of the normalized rate of the BS population. The behavioral and neural MTFs show remarkably similar patterns: both have a maximum at 64 Hz. The similarity supports the interpretation that the rabbit’s AM detection behavior reflects neural firing rate in the IC.
Fig. 10.
Behavioral and neural modulation transfer functions (MTFs) of the rabbit. A: amplitude-modulation detection sensitivity of the rabbit (in dB) vs. modulation frequency (in Hz) [adapted from Carney et al. 2014, Fig. 1B]. B: population normalized firing rate of inferior colliculus neurons of the rabbit. Reciprocals of population normalized firing rates of the band-suppressed neurons were averaged (as a geometric mean) with those of the band-enhanced neurons (shown in Fig. 9, top row).
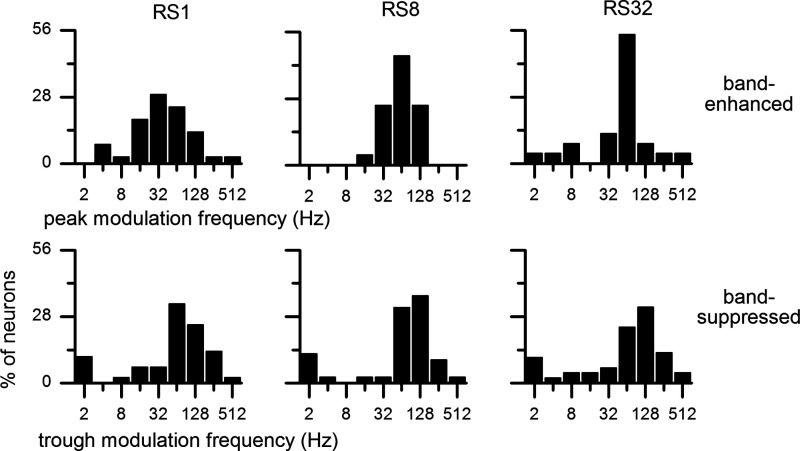
Which modulation frequencies induce the peak firing rates of the BE IC neurons and the trough firing rates of the BS IC neurons? This information is provided in Fig. 11. Under the sinusoidal envelope, the peak modulation frequency of the BE neurons was broadly distributed over 4–512 Hz with a median of 32 Hz (Fig. 11, top left). Under the raised-sine envelopes, the peak modulation frequency was more concentrated around 64 Hz with a median of 64 Hz (top middle and right). Distributions of the trough modulation frequency of the BS neurons were comparable to those of the BE neurons’ counterparts. One difference between the corresponding measures of the two neural groups is that, under each envelope, the most common trough modulation frequency tended to be slightly higher than the most common peak modulation frequency: 64 versus 32 Hz under sine and 128 versus 64 Hz under raised-sine envelopes. Median trough modulation frequency was 64 Hz for all three envelopes.
Fig. 11.
Distributions of peak (top) and trough (bottom) modulation frequencies of band-enhanced (top) and band-suppressed inferior colliculus neurons (bottom), respectively, obtained with 3 types of envelopes and defined with a 1.2 criterion. No. of neurons for each panel is given in Fig. 9 legend. Median peak modulation frequency was 32 Hz for raised-sine-1 (RS1) envelope and 64 Hz for raised-sine-8 (RS8) and raised-sine-32 (RS32) envelopes. Median trough modulation frequency was 64 Hz for all 3 envelopes.
The results described above demonstrate that the raised-sine-8 and -32 envelopes induce more pronounced enhancement of firing rates of BE neurons and suppression of BS neurons than the sinusoidal envelope. Considering that for the raised-sine envelopes, duty cycle and rise-fall slope covary with the exponent of the raised-sine equation, it was not possible to ascertain separately the effects of duty cycle and rise-fall slope of the modulation envelope on neural responses just by varying the exponent. To overcome this limitation, we devised a smooth trapezoidal envelope (Fig. 1) for which these two properties of the modulation envelope could be controlled separately.
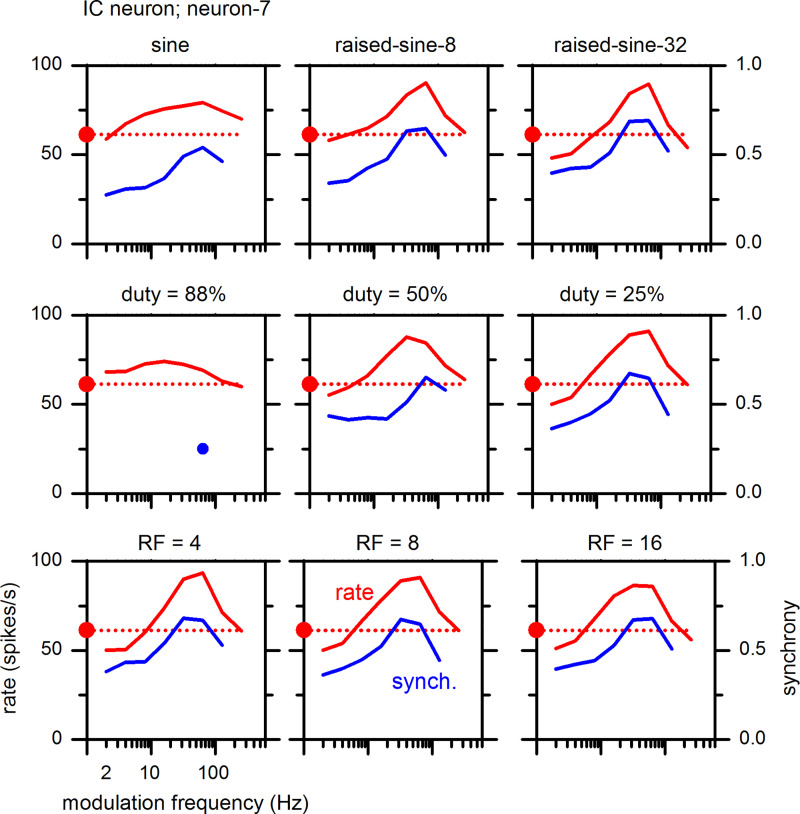
Responses of an example neuron to a smooth trapezoidal envelope are illustrated in Fig. 12; the middle row represents MTFs with different duty cycles (25–88%) and a fixed relative rise-fall slope (8), whereas the bottom row represents MTFs with different relative rise-fall slopes (4–16) and a fixed duty cycle (25%). A duty cycle of 25% was more effective in enhancing the neuron’s response than the longer duty cycles of 50 and 88% (middle row). As duty cycle decreased from 88% to 25%, the firing rate became higher, while at the same time, synchrony became stronger and significant over a wider range of modulation frequencies. In stark contrast, relative rise-fall slopes of 4–16 with a fixed duty cycle of 25% had little influence on the MTFs of this neuron (bottom row). The MTFs in the first row of Fig. 12 confirm that this neuron’s MTFs are consistent with the results described above for the sine and raised-sine envelopes.
Fig. 12.
Effects of amplitude-modulated envelope properties on modulation transfer functions of an inferior colliculus (IC) neuron (neuron-7) with a best frequency of 3.2 kHz. Top: variable exponents of raised-sine envelope. Middle: variable duty cycles with a fixed relative rise-fall (RF) slope of 8. Bottom: variable relative RF slopes with a fixed duty cycle of 25%.
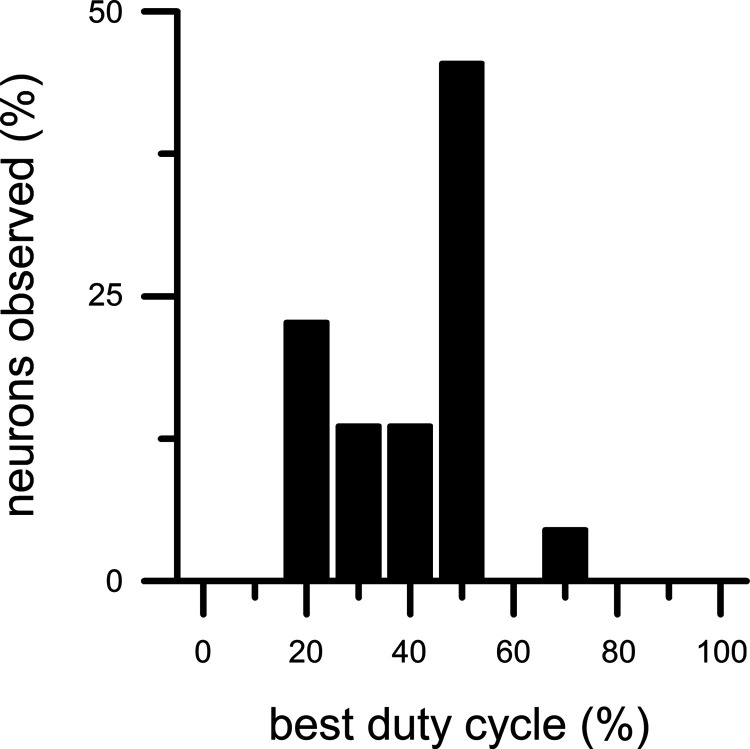
Effects of duty cycle and rise-fall slope on MTFs were examined in 22 IC neurons using the smooth trapezoidal envelope. The effects of a shorter duty cycle on MTFs were analogous to the effects of a higher exponent of the raised-sine envelope in all of the tested neurons. When duty cycle was at a neuron’s preferred value (called the best duty cycle), the neuron’s response was maximally enhanced in BE neurons and maximally suppressed in BS neurons. In hybrid neurons, both enhancement and suppression were observed in different regions of modulation frequency. In all tested neurons, effects of duty cycle on neural responses were strong, whereas effects of rise-fall slope were weak. Do different neurons exhibit different best duty cycles? What are the most frequently observed best duty cycles? We addressed these questions by examining the distribution of best duty cycles (Fig. 13). Nearly all neurons preferred short duty cycles of 20–50%.
Fig. 13.
Distribution of best duty cycle of inferior colliculus neurons (n = 22).
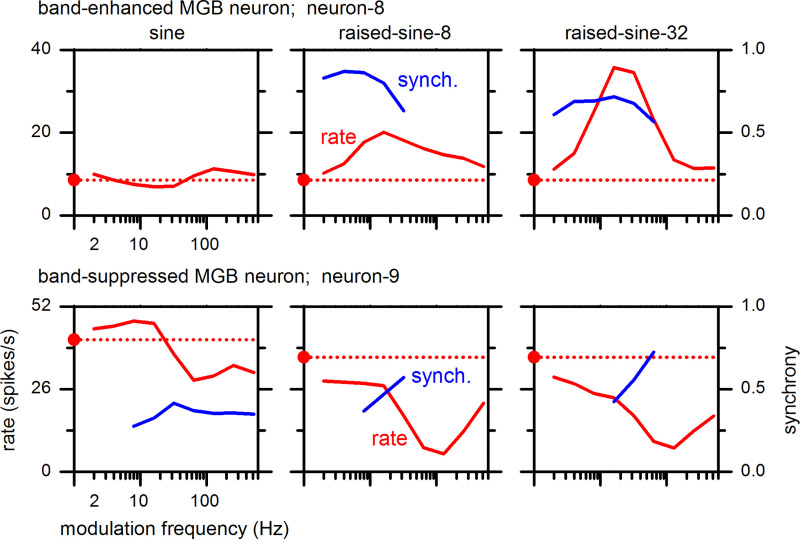
Above, observations from IC neurons were presented; below we present observations from MGB neurons. MGB MTFs comprised BE, BS, hybrid, and flat types, analogous to those of the IC neurons. Examples of MGB neurons’ BE- and BS-type MTFs are shown in Fig. 14. Enhancement and suppression features of MGB BE and BS neurons, respectively, became more pronounced under the raised-sine envelopes than the sine envelope, as in the IC. Furthermore, synchrony of these neurons also became stronger under the raised-sine envelopes.
Fig. 14.
Rate and synchrony modulation transfer functions of a band-enhanced and band-suppressed medial geniculate body (MGB) neurons. They are referred as neuron-8 [best frequency (BF) 5.0 kHz] and neuron-9 (BF 6.3 kHz), respectively.
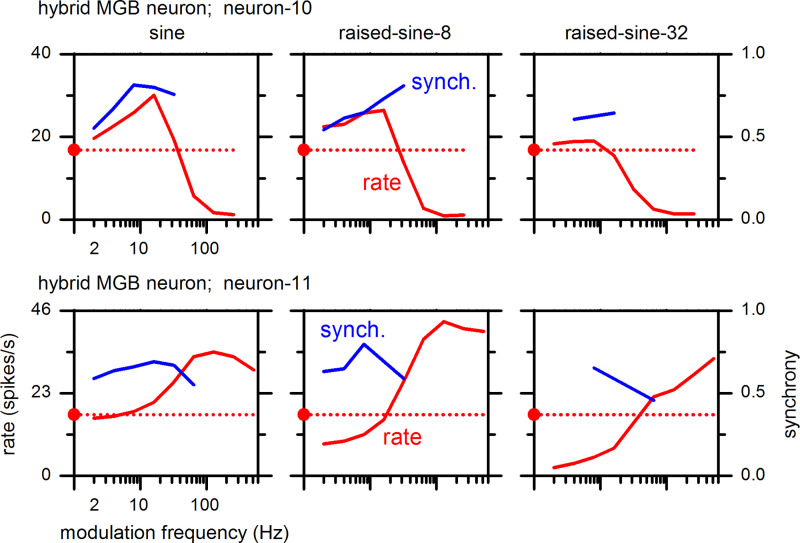
Examples of MGB neurons’ hybrid-type MTFs are shown in Fig. 15. Hybrid-1 and hybrid-2 types of MTFs are found in the MGB, analogous to the IC; however, effects of raised-sine envelopes on hybrid MTFs of MGB neurons can be more complex than in the IC. For example, a hybrid-1 type of MTF (Fig. 15, top left) under the sine envelope became BS type under the raised-sine-32 envelope, a situation not observed in the IC. Regarding synchrony of MGB neurons overall, statistically significant synchrony was present in modulation frequencies ranging from 2–512 Hz, with values of the synchrony reaching 0.90 under different conditions.
Fig. 15.
Rate and synchrony modulation transfer functions of medial geniculate body (MGB) neurons exhibiting hybrid types. Neuron-10 [top; best frequency (BF) 4.0 kHz] and neuron-11 (bottom; BF 14 kHz) panels correspond to hybrid-1 and hybrid-2 types, respectively.
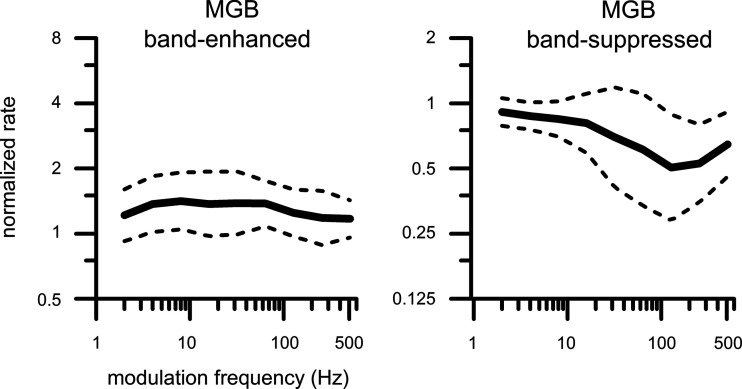
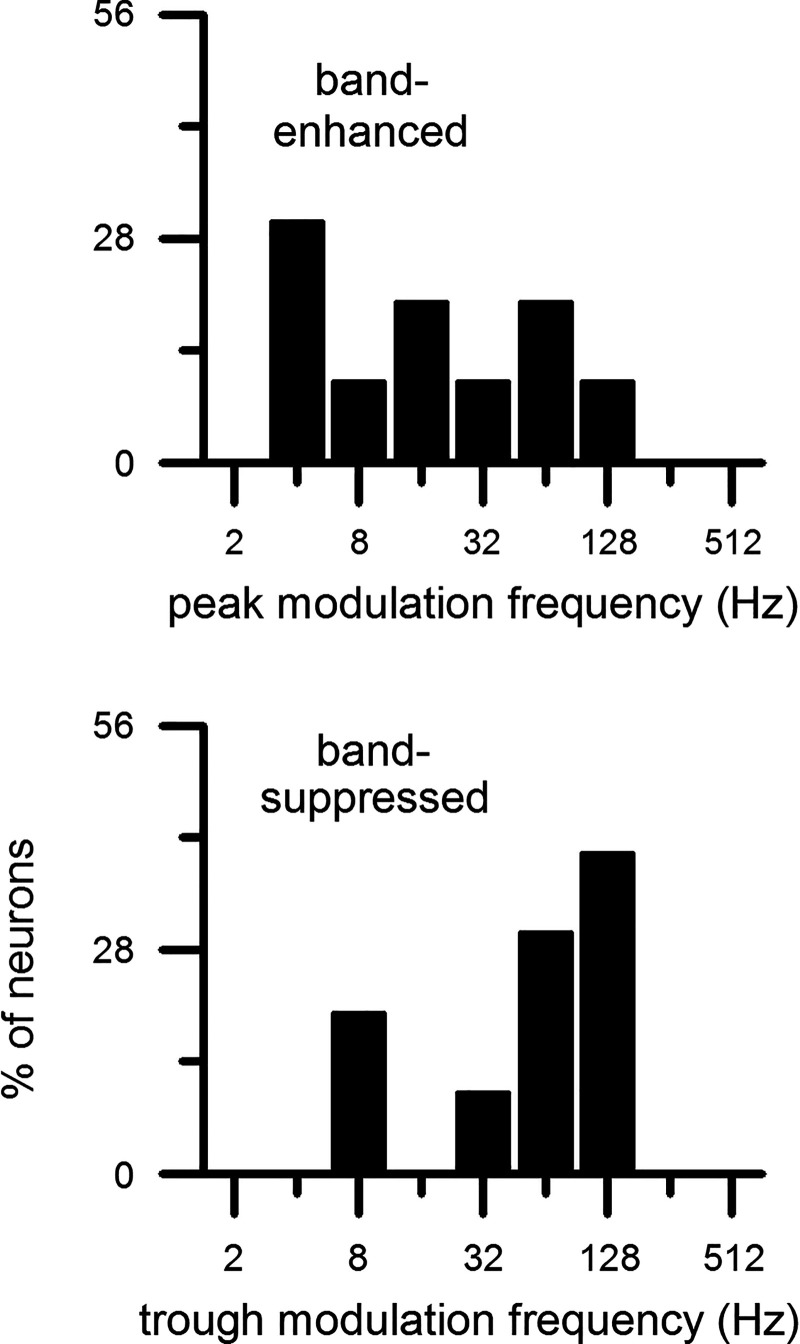
We computed population rate MTFs of BE and BS neurons of the MGB (Fig. 16), analogous to the IC population MTFs (Fig. 9), except that in the MGB only the sine envelope MTFs were recorded for the population. The BE population MTF of the MGB neurons (Fig. 16, left) does not have a distinct peak, as was observed in the IC at 32–64 Hz (Fig. 9, top left). The BE population MTF in the MGB was less tuned than in the IC; the BS population MTF in the MGB, on the other hand, did have a trough of ∼128 Hz (Fig. 16, right), similar to that in the IC (Fig. 9, top right).
Fig. 16.
Population rate modulation transfer functions of medial geniculate body (MGB) neurons: band-enhanced (n = 10) and band-suppressed (n = 10) defined with a 1.2 criterion. The stimulus envelope was sinusoidal. Solid lines: mean; dashed lines: means ± SD computed on logarithmic y-scales.
Distributions of peak and trough modulation frequencies of the BE and BS neurons of the MGB, respectively, are shown in Fig. 17. The BE neurons of the MGB did not show a peak in the distribution of peak modulation frequencies of ∼32–64 Hz, as was observed in the IC (Fig. 11, top left), but rather a distribution tilted toward 4 Hz (Fig. 17, top). This difference in the most common peak modulation frequencies between the BE neurons of the MGB and IC was related to the difference in the population MTFs of the BE neurons of the two nuclei noted in Fig. 16.
Fig. 17.
Distributions of peak (top) and trough (bottom) modulation frequencies of band-enhanced (n = 10) and band-suppressed (n = 10) medial geniculate body neurons, respectively, defined with a 1.2 criterion. The stimulus envelope was sinusoidal. Median peak modulation frequency was 16 Hz, and median trough modulation frequency was 64 Hz.
The distribution of trough modulation frequencies of the BS neurons of the MGB (Fig. 17, bottom) shows that the most common trough modulation frequencies were 64–128 Hz, matching the IC distribution. This similarity in the distribution of trough modulation frequencies between the BS neurons in the MGB and IC is related to the similarity in the population MTFs of the BS neurons (cf. Figs. 9 and 16).
Our observations of MGB neurons’ responses are in line with those of Preuss and Müller-Preuss (1990), who studied MGB neurons of awake squirrel monkey; e.g., their best modulation frequencies for firing rate were in the range of 1–128 Hz with a median of 16 Hz. This is comparable to our finding of a similar range and the same median value.
The present sample of IC neurons included neurons in the central nucleus (Fig. 2B). Although the present sample of MGB neurons was well driven by the AM stimuli, it is unclear to what extent the sample of MGB neurons included neurons in its ventral subdivision, the continuation of the lemniscal pathway from the central nucleus of the IC (Oliver et al. 2018). Accordingly, interpretation of the comparisons between the present IC and MGB results should be made cautiously.
Modeling results.
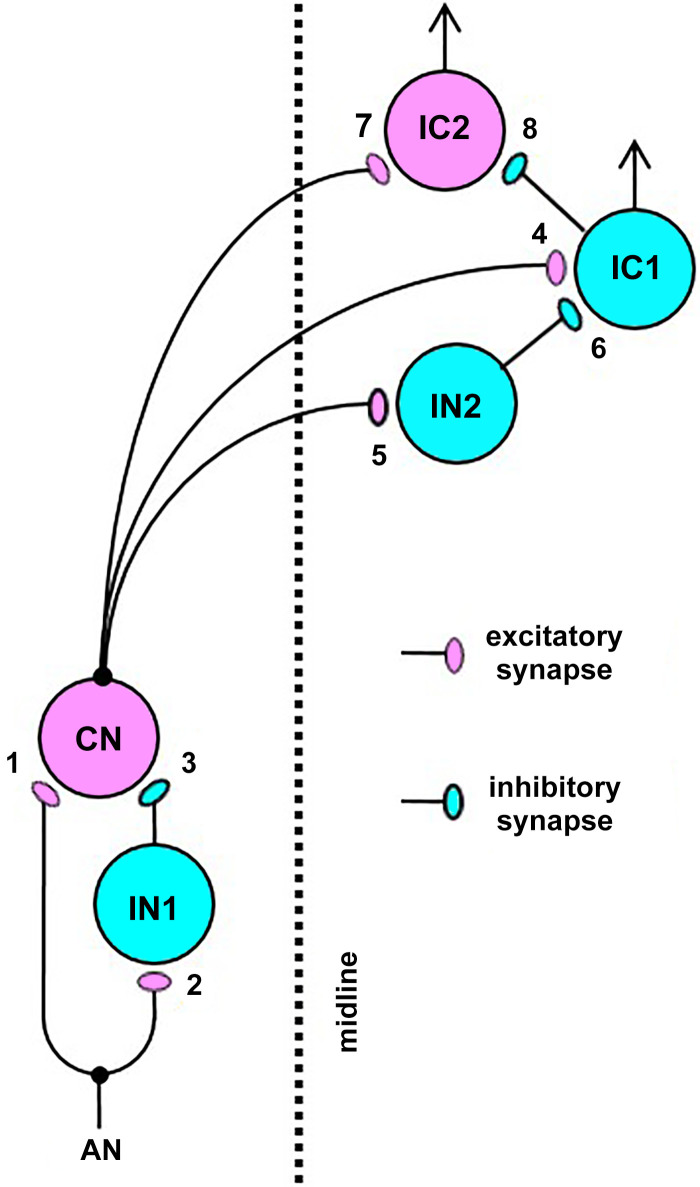
To help formulate a hypothesis about how the observed BE and BS MTFs of IC neurons may arise, we employed a simplified model for an auditory brainstem circuit that consisted of 6 neurons and 8 synapses described in Fig. 18. This model was adapted from Nelson and Carney (2004), Kim et al. (2015), and Carney et al. (2015, 2016). The auditory-nerve responses were simulated with the model of Zilany et al. (2014). Each excitatory and inhibitory synaptic input was described by an α-function (Jack et al. 1975); each synapse had a specified delay, time constant, and strength. The strength corresponds to the area under the α-function. The values of the model parameters are given in Table 2. Each synaptic function was convolved with the time-varying firing rate of the projection neuron associated with the synapse. The time-varying firing probability of a model neuron was taken to be proportional to the rectified version of the sum of the above convolutions.
Fig. 18.
Schematic drawing of a monaural auditory brainstem model. AN, auditory nerve fiber; CN, cochlear nucleus neuron; IC1, inferior colliculus neuron no. 1, simulating a band-enhanced neuron or a hybrid neuron; IC2, inferior colliculus neuron no. 2, simulating a band-suppressed neuron or a hybrid neuron; IN1, interneuron no. 1; IN2, interneuron no. 2. Magenta and cyan colors signify excitatory and inhibitory nature of the neurons/synapses, respectively [AN activities were simulated with the model of Zilany et al. (2014), and the present model was adapted from Kim et al. (2015)].
Table 2.
Parameter values of the model described in Fig. 18
| Synapse No. | Origin | Target | Strength | Time Constant (ms) | Delay (ms) |
|---|---|---|---|---|---|
| 1 | AN | CN | 1 | 0.5 | 0 |
| 2 | AN | IN1 | 1 | 0.0* | 0 |
| 3 | IN1 | CN | −0.3 | 2 | 1 |
| 4 | CN | IC1 | 4 | 0.2 | 0 |
| 5 | CN | IN2 | 1 | 0.0* | 0 |
| 6 | IN2 | IC1 | −6.0** | 2 | 1.5 |
| 7 | CN | IC2 | 1 | 1 | 0 |
| 8 | IC1 | IC2 | −2 | 1.2 | 0.6 |
Different best frequencies (from 3.2–14 kHz) were used in simulation of several different neurons. For the auditory nerve (AN) fiber model (Zilany et al. 2014), the fiber type was of medium spontaneous rate. CN, cochlear nucleus neuron; IC1, inferior colliculus neuron no. 1, simulating a band-enhanced neuron or a hybrid neuron; IC2, inferior colliculus neuron no. 2, simulating a band-suppressed neuron or a hybrid neuron; IN1, interneuron no. 1; IN2, interneuron no. 2.
For these synapses, the synaptic impulse responses were delta functions.
The value of this parameter was −6.0 for all model results except for those of Fig. 23, for which it was −2.5.
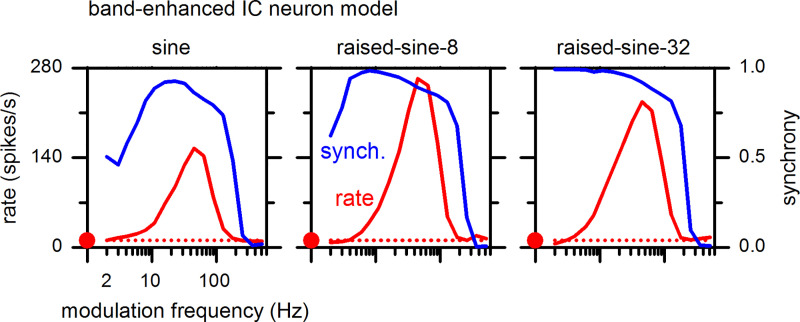
MTFs for a BE IC neuron model are shown in Fig. 19 for the sine and raised-sine modulation envelopes. The model reproduced salient features of MTFs of neuron 1, the IC BE neuron represented in Fig. 3 (top). These features include tuned enhancement of the response, with the greatest enhancement of the MTF in response to the raised-sine-8 envelope. The peak modulation frequency of the model (45 Hz) was near that of neuron-1, 64 Hz. Furthermore, the model synchrony was frequency-dependent and reached high synchrony values, replicating qualitative features of the responses of neuron-1. In particular, the synchrony MTF of the model for the sine envelope was band-pass, analogous to that of neuron-1.
Fig. 19.
Rate (left ordinate, red) and synchrony (right ordinate, blue) modulation transfer functions of the band-enhanced inferior colliculus (IC) neuron model (IC1, Fig. 18) with a best frequency of 4 kHz. The format of this figure is same as Fig. 3.
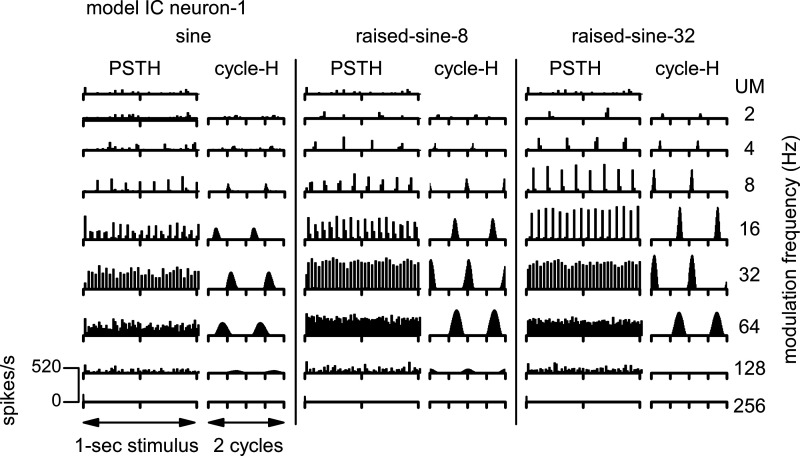
Temporal response characteristics of the IC BE neuron model are shown in Fig. 20, using the same format as Fig. 4. The model reproduced salient features of the responses of neuron-1 (Fig. 4), including sustained PSTHs to the AM stimuli and cycle-Hs with high synchrony to the stimulus envelope. In response to the unmodulated noise stimulus, the onset component of the model response (Fig. 20, top row) was not as prominent as that of neuron-1 (Fig. 3, top).
Fig. 20.
Poststimulus time histograms (PSTH) and cycle histograms (cycle-H) of responses of the band-enhanced inferior colliculus (IC) neuron model. The format of this figure is same as Fig. 4. UM, unmodulated.
MTFs for a BS IC neuron model are shown in Fig. 21 for the sine and raised-sine modulation envelopes. The model reproduced salient features of MTFs of neuron-3, the IC BS neuron in Fig. 5 (top). These features include tuned suppression of the response, with the greatest suppression in response to the raised-sine-32 envelope. The trough modulation frequencies of the model for the three envelopes (16–45 Hz) were somewhat lower than those of neuron-3 (64–128 Hz). The model synchrony MTFs shared some qualitative features with the responses of neuron-3, including moderate-to-high synchrony values and a decline of synchrony at high modulation frequencies (note: absence of a statistically significant synchrony is consistent with a low value of synchrony). The synchrony MTF of the model included a “notch” slightly below, or at, the trough modulation frequency. It is uncertain whether the synchrony MTF for neuron-3 might have analogous notches because our experimental data were taken at one-octave steps of modulation frequency, whereas the model MTFs were taken at half-octave steps.
Fig. 21.
Rate (left ordinate) and synchrony (right ordinate) modulation transfer functions of the band-suppressed inferior colliculus (IC) neuron model with a best frequency of 14 kHz. The format of this figure is same as Fig. 3.
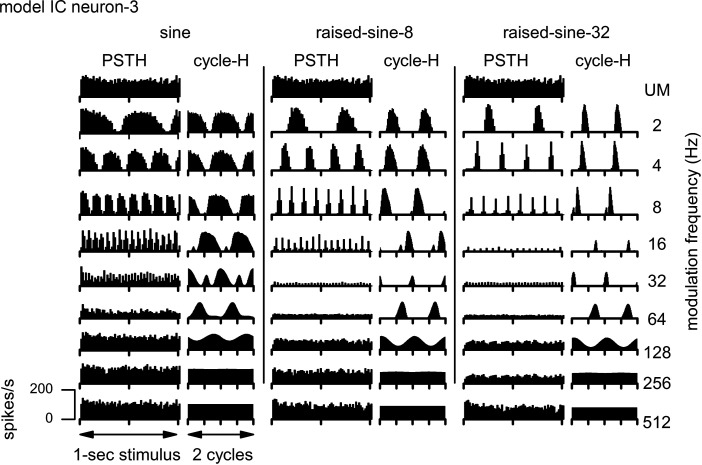
Temporal response characteristics of the IC BS neuron model are shown in Fig. 22. The IC BS neuron model’s response to the unmodulated noise stimulus (Fig. 22, top row) had a slight onset component, whereas neuron-3 had a prominent onset component (Fig. 6, top row). Except for the onset component, the model reproduced salient features of the responses of neuron-3 (Fig. 6). For example, the model reproduced cycle-Hs with high synchrony at comparable modulation frequencies. Additionally, when the firing rate was suppressed, the suppression was present throughout the duration of the AM stimulus.
Fig. 22.
Poststimulus time histograms (PSTH) and cycle histograms (cycle-H) of responses of the band-suppressed inferior colliculus (IC) neuron model. The format of this figure is same as Fig. 4. UM, unmodulated.
In the model, some cycle-Hs showed distortions in the form of double peaks (Fig. 22, column 2, 16 and 32 Hz, sine envelope; column 4, 16 Hz, raised-sine-8 envelope). Presence of such distortions led to reduced synchrony values. In neuron-3, there were hints of analogous distortions (Fig. 6, column 4, 8 and 64 Hz, raised-sine-8; column 6, 16 Hz, raised-sine-32).
It is noteworthy that simulations of the BS and BE neurons described in Figs. 19–22 were achieved using one set of parameters, as described in Table 2. The only difference across simulations was the use of two different auditory nerve (AN) BFs, chosen to match the BFs of the two example neurons (neurons-1 and -3) (note that each IC model neuron inherits the BF of the AN input fiber).
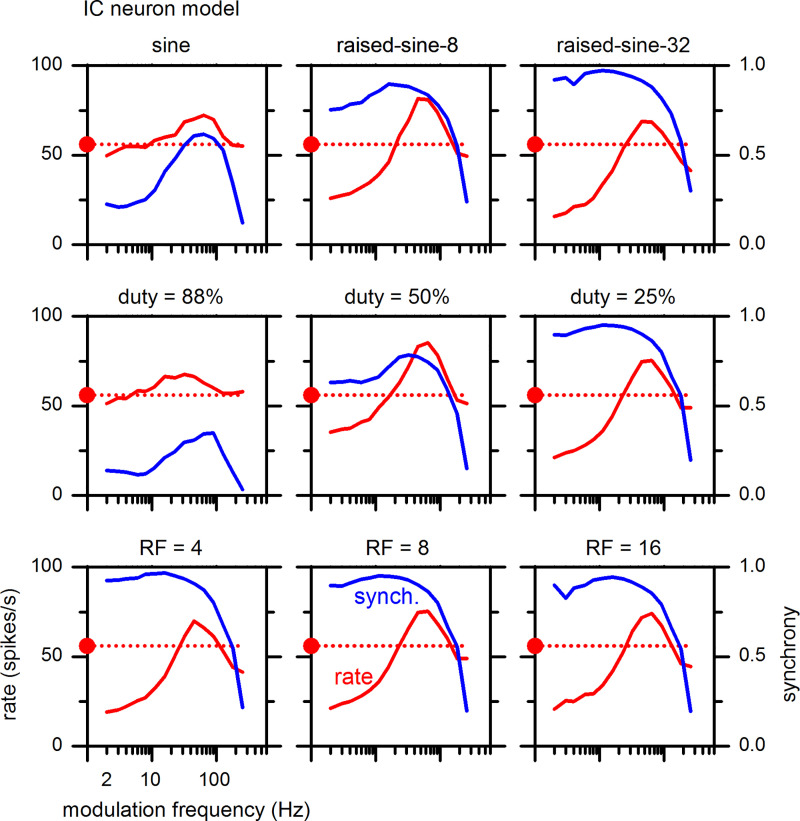
Effects of duty cycle and rise-fall slope of the modulation envelope on MTFs were examined in the model using the same smooth trapezoidal envelope; the results are shown in Fig. 23, using the same format as Fig. 12. The model parameters for Fig. 23 remained the same as above, except that the strength of synapse no. 6 was changed from −6 to −2.5 (Table 2). This change was made to have the model reproduce better the characteristics of the example neuron (neuron-7, Fig. 12). The model was highly sensitive to duty cycle, with highest rates and modulation tuning for duty cycles of 50% and 25%, qualitatively similar to neuron-7 (Fig. 12). At the same time, the model was practically insensitive to the rise-fall slope, again replicating the responses of neuron-7. The model also reproduced qualitative features of the MTFs of neuron-7 for the sine and raised-sine envelopes, including hybrid-type MTFs for the raised-sine-32 and the smooth trapezoidal envelope with a duty cycle of 25%.
Fig. 23.
Effects of amplitude modulation envelope properties on modulation transfer functions of the inferior colliculus (IC) model (IC1 neuron in Fig. 18) in the same format as Fig. 12. For this modeling, the strength of synapse no. 6 was −2.5. Best frequency = 3.2 kHz. RF, rise-fall slope.
DISCUSSION
Main findings.
We identified two opposing populations of neurons in the IC and MGB, designated BE and BS neurons, whose firing rates were enhanced and suppressed by AM sounds, respectively, relative to their responses to an unmodulated noise. Our finding suggests that perception of AM may not just reflect activation of a group of neurons but the co-occurrence of enhancement and suppression of activities of the opposing populations of neurons. We also identified a third population, designated hybrid neurons, whose firing rates were enhanced by some modulation frequencies and suppressed by others. Each of the BE, BS, and hybrid types of MTFs comprised approximately one-third of the total sample.
Our finding of the opposing neural populations in the IC and MGB is reminiscent of the ON and OFF populations of the visual system (Schiller 1992). The latter are considered to optimize information transfer to the central nervous system. In this analogy, we relate auditory AM modulation depth to light intensity. Firing rates of IC BE and BS neurons are enhanced and suppressed with increasing modulation depth, respectively (Kim et al. 2015). Considering that a neural firing rate cannot be negative, having two opposing populations is advantageous because one of the two populations is excited regardless of whether stimulus strength (AM depth) is increased or decreased. Therefore, the BE and BS populations together would provide better transfer of the information embedded in AM envelopes. A prominent example of a complex sound for which the envelope plays an important role in information transfer is speech (Drullman et al. 1994; Loizou et al. 1999; Shannon et al. 1995; Smith et al. 2002). In the context of a stimulus space comprising modulation depth, modulation frequency, and stimulus level, whether edge detection and dynamic range may be improved by the existence of the opposing populations remains to be investigated. Our finding that the IC and MGB contain opposing populations of BE- and BS-type neurons suggests that the auditory cortex may also contain them; a few such examples have been described (Yin et al. 2011).
Comparison with previous studies of MTFs.
Previous studies of MTFs of the IC and MGB have described various types of MTFs, such as band-pass, low-pass, high-pass, all-pass, and band-reject types (review: Geis and Borst 2009; Langner and Schreiner 1988; Müller-Preuss et al. 1994; Nelson and Carney 2007; Preuss and Müller-Preuss 1990; Rees and Møller 1987; Rees and Palmer 1989; review: Joris et al. 2004). A filter type such as a low-pass MTF can be created either by suppressing the responses at high frequencies or by enhancing the responses at low frequencies, or a combination of both. Analogously, a high-pass MTF can be created in one of three ways. These examples illustrate that the traditional approach is unsatisfactory in describing the mechanisms that shape MTFs. A rare exception in this context is Krishna and Semple (2000), who described examples of rate MTFs of IC neurons that exhibited enhancement, suppression, and a combination. However, a large part of their observations did not include testing responses to the unmodulated stimulus. Thus, a systematic classification of MTF types in terms of enhancement and suppression was not provided. Additionally, in view of the present findings, their exclusive use of sinusoidal modulation envelope was not optimal. Yin et al. (2011) also compared responses of auditory cortical neurons to AM and unmodulated stimuli and described examples of rate MTFs that exhibited enhancement, suppression, and a combination. However, they did not incorporate enhancement and suppression of neuronal responses into a systematic classification of neuronal types.
Stimulus level can have diverse effects on rate MTFs of IC neurons (Krishna and Semple 2000; Rees and Palmer 1989). Among neurons with peaked (band-pass) rate MTFs, level-tolerant peak modulation frequencies and tuning were observed over a wide range of stimulus levels in some neurons, whereas in others, peak modulation frequencies and sharpness of tuning varied noticeably across stimulus levels (Krishna and Semple 2000; Rees and Palmer 1989). Analogously, among neurons that showed troughed (band-reject) rate MTFs, level-tolerant trough modulation frequencies and tuning were observed in some neurons, whereas in others, rate MTFs varied more across stimulus levels (Krishna and Semple 2000). There was a tendency, however, that a clear tuning of rate MTF was often found at stimulus levels that were intermediate between rate threshold and rate saturation (Rees and Palmer 1989). Thus, the choice of 30 dB above rate threshold in this study was motivated by these previous observations.
Considering that the present MTF data for different modulation envelopes were obtained at sound pressure levels that varied by 7.2 dB for the sine and raised-sine envelopes, one may wonder whether the sharper tuning and more pronounced enhancement/suppression for the raised-sine envelopes may be due to their lower sound pressure levels than that of the sinusoidal envelope. Given the high diversity of the effects of sound pressure level on MTFs (Krishna and Semple 2000; Rees and Palmer 1989), however, it is unlikely that changes of up to 7.2 dB in level would have produced the systematic sharpening and exaggeration of enhancement/suppression of MTFs seen with raised-sine-8 and -32 envelopes (Figs. 3, 5, 9, and 14). Nevertheless, a future study of MTFs may address this issue directly by equalizing the sound pressure levels of all AM stimuli to match that of the unmodulated stimulus.
Effects of modulating envelope shape on MTFs.
Although previous studies of MTFs most often used sinusoidal envelopes (e.g., Batra 2006; Geis and Borst 2009; Krishna and Semple 2000; Preuss and Müller-Preuss 1990), a number of studies showed that MTFs were affected by the shape of modulation. Sinex et al. (2002) compared MTFs obtained with trapezoidal and sinusoidal envelopes. Because their trapezoidal envelope had a fixed duration, they were not able to ascertain the effect of duty cycle on the characteristics of MTFs. Krebs et al. (2008) also used trapezoidal and sinusoidal modulation envelopes and varied burst duration and interburst interval independently (note: when duration and interburst interval are specified, modulation frequency and duty cycle can be indirectly specified). Krebs et al. (2008) found that IC neurons were sensitive not only to modulation frequency, but also to duty cycle, duration, and interburst interval. The studies cited above and other related studies (e.g., Alder and Rose 2000; Epping and Eggermont 1986; Gooler and Feng 1992) showed that envelope shape, duty cycle, and burst duration are important factors in AM coding, in addition to modulation frequency. Using a broadband noise carrier modulated by sinusoidal and pulse (0.25 ms) train envelopes, Zheng and Escabí (2008) found that the MTFs of IC neurons were strongly affected by the envelope shape.
However, the present study is the first that ascertained the properties of the modulation envelope that most strongly sharpen AM frequency tuning and accentuate enhancement and suppression. We found that a short duty cycle (20–50%) of smooth trapezoidal envelope was most effective in this regard. We also discovered that “raised sine” envelopes (Bernstein and Trahiotis 2009, 2010) produced sharper tuning in MTFs and more pronounced enhancement and suppression than did stimuli with sinusoidal envelopes.
Human listeners are more sensitive in detecting square-wave AM than sinusoidal AM (Viemeister 1979). As a square wave has a shorter duty cycle (50%) than a sinusoid (93.6% for a threshold of 1%), human sensitivity is consistent with the present finding: modulation envelopes having short duty cycles of 20–50% accentuated the degree of enhancement and suppression in the IC and MGB.
Role of AM processing in speech recognition.
The spectrum of the modulating envelopes of band-pass filtered speech signals have energy in a range from ∼1–50 Hz with a broad peak of ∼3–8 Hz (Krause and Braida 2009; Stevens 2000; Varnet et al. 2017). In view of such modulation properties of speech, including modulation frequencies as low as a few Hz in a physiological study of AM, as is the case in the present study, should be important. Including modulation frequencies above 50 Hz extending to hundreds of Hz should also be important for addressing neural processing of formants and the fundamental frequency of voicing (f0; Carney 2018) and consonant discrimination. Because AM carries an important part of the content of speech (e.g., Loizou et al. 1999; Smith et al. 2002), progress in understanding auditory processing of AM sounds should lead to progress in understanding speech perception. In view of our finding of the opposing neural populations representing AM envelopes, we suggest that theories of speech perception may need to involve the activities of the opposing neural populations responding to speech sounds.
Coding of vowel sounds by IC neurons was investigated in several modeling and physiological studies (e.g., Carney 2018; Carney et al. 2015, 2016). The human voicing f0 typically ranges from ∼50–500 Hz (Schroeder 1966). We found that many BE (and BS) IC neurons have peak (and trough) modulation frequencies in this range (Fig. 11). The role of this modulation frequency range in neural coding of speech is important to consider. The modulating envelopes that entrain neural responses are strongly influenced by frequency tuning of the neurons. Responses of AN fibers are dominated by stimulus frequencies near their BFs. The envelope frequency components of speech stimuli near the voicing f0 are dominant in entraining AN responses that have BFs between the first two formants of vowels (Delgutte and Kiang 1984). Frequency tuning properties of IC neurons are much more complex and diverse (Palmer et al. 2013; Ramachandran et al. 1999) than those of AN fibers. The envelope frequency components of speech-type stimuli that may dominate in entraining IC neurons remain to be determined.
Distinction between neural coding of periodicity and AM.
Studies of AM coding often used a pure-tone carrier modulated by a sinusoidal envelope (review: Joris et al. 2004). When the modulation frequency happens to be a subharmonic of the carrier frequency, the instantaneous AM stimulus signal (i.e., fine structure) becomes periodic and leads to perception of a clear pitch (Moore 2012). However, such a stimulus is a special case and does not represent general AM stimuli. Thus, coding of AM should not be equated to coding of periodicity, although the two are sometimes assumed to be equivalent (e.g., Langner and Schreiner 1988). Noise vocoder stimuli that emulate unvoiced speech (Davis et al. 2005; Shannon et al. 1995) are not periodic and do not induce a pitch but lead to recognition of speech. Furthermore, a study by Smith et al. (2002), in which the envelope of one sound was combined with the carrier of another sound, led to the conclusion that the carrier periodicity was important for pitch perception, whereas the envelope was important for speech reception. These findings demonstrate that auditory processing of AM and of periodicity of an instantaneous sound pressure signal are separate. The relationships among pitch sensations elicited by various sounds such as AM noise with high modulation rates (40–850 Hz), pure tones, resolved and unresolved harmonic complexes, and rippled noise are complex and a subject of ongoing investigation (Fitzgerald and Wright 2005; Grimault et al. 2002).
Comparison of neural and behavioral MTFs.
In comparing behavioral and neural MTFs (Fig. 10), we assume that where neurons are most sensitive to AM sounds, i.e., near the peak modulation frequencies in BE neurons and near the trough modulation frequencies for BS neurons, they provide the lowest AM detection thresholds, i.e., detection with the smallest modulation depths. This assumption is consistent with the observations of Nelson and Carney (2007) and Kim et al. (2015). In BE neurons (bandpass-type neurons in the conventional terminology), firing rates increased with modulation depth. In contrast, in BS neurons, firing rates decreased with modulation depth (Kim et al. 2015). We further assume that a rate suppression of a BS neuron and a rate enhancement of a BE neuron together signify the presence of modulation and contribute to behavioral detection of AM. Under these assumptions, it is predicted that the behavioral best modulation frequency should match the neural counterpart.
Firing rates at modulation frequencies higher than the synchronization limit.
Firing rates of the IC BE neurons trended toward the unmodulated response for modulation frequencies above the synchronization limit, >128 or 256 Hz (Fig. 3). This property was shared by BE neurons in general and manifested in their population MTFs (Fig. 9, left column). One may interpret this result as follows: when modulation frequency was too high relative to the integration times of the neurons, the AM stimulus effectively became the same as the unmodulated version of the stimulus. Firing rates of the IC BS neurons also trended toward the unmodulated response for high modulation frequencies near 256 and 512 Hz (Fig. 5), where significant synchronization to the AM stimulus was nearly absent in the IC. This property was shared by BS neurons in general and manifested in their population MTFs (Fig. 9, right column). This pattern may be interpreted in the same way as stated above for the BE neurons.
Firing rates of the IC hybrid neurons shown in Fig. 7 did not trend toward their responses to the unmodulated stimulus for high modulation frequencies near 256 and 512 Hz, except for the case of the sinusoidal envelopes. As modulation frequency increased toward 256 and 512 Hz, firing rates of the hybrid neurons, in general, continued to be suppressed (e.g., Fig. 7, top ) or enhanced (e.g., Fig. 7, bottom). This property was more pronounced for raised-sine envelopes. This overall pattern of the hybrid neurons was in noticeable contrast to the patterns noted above for the IC BE and BS neurons. How to interpret this contrast remains to be investigated.
The MTF patterns of MGB BE and BS neurons for modulation frequencies above the limit of synchronization (Fig. 14) were analogous to those of the IC counterparts (Figs. 3 and 5). That is, the firing rates trended toward their responses to the unmodulated stimuli at those high modulation frequencies. The population MTF of the MGB BS neurons to the sinusoidal envelopes trended toward the unmodulated response (Fig. 16, right) analogous to their IC counterpart (Fig. 9, top right). The MTF patterns of MGB hybrid neurons for modulation frequencies above the limit of synchronization (Fig. 15) were analogous to those of the IC counterparts (Fig. 7). That is, in general, the firing rates did not trend toward their responses to the unmodulated stimuli at high modulation frequencies.
Conversion from synchrony to firing rate.
Many hybrid neurons and some BE and BS neurons of the IC and MGB exhibited considerable enhancement or suppression at modulation frequencies higher than the synchronization limit (Figs. 3, 5, 7, 14, and 15, plus other neurons, not shown). One may view this type of responses of the IC and MGB as results of a conversion from synchronized neural response to a firing rate. Auditory nerve fibers and many cochlear nucleus (CN) neurons can synchronize to high (> 500 Hz) modulation frequencies, and the above patterns of firing rates and synchrony have not been reported about them (e.g., Joris and Yin 1992; Kim et al. 1990; Rhode and Greenberg 1994). It is widely recognized that as one ascends the auditory pathways from the periphery to the cortex, the upper frequency limit of synchronization decreases (review: Joris et al. 2004). It has been suggested that synchronized responses of lower-order neurons are converted into firing rates of higher-order neurons (e.g., Lu et al. 2001; Yin et al. 2011).
We suggest that the present observations of IC and MGB neurons constitute an outcome of such a synchrony-to-rate conversion for the following reason. A substantial enhancement or suppression of firing rates of a neuron relative to its response to an unmodulated stimulus signifies that the neuron is able to convey the presence of AM in the stimulus. This ability, together with the inability of a neuron to synchronize to the modulation envelope, constitutes an outcome of a synchrony-to-rate conversion.
It is not known whether the above type of IC and MGB neurons inherit the properties from other neurons that project to them or they themselves perform a synchrony-to-rate conversion. It is also not known what mechanisms underlie such a conversion. We suggest that an interplay between synaptic time constants and the cell-membrane time constant (representing capacitance and resistance of the membrane) may be involved in creating a synchrony-to-rate conversion. Future studies should explore such a possibility.
Modeling.
The rationale behind this modeling study was a feasibility test to demonstrate that the different MTF types can be explained by relatively simple dynamic interactions between excitatory and inhibitory postsynaptic potentials. Specifically, the model postulates that: 1) the auditory brainstem consists of a small number of excitatory and inhibitory neurons, 2) excitatory and inhibitory ascending inputs converge on target neurons in the CN and in the IC, and 3) between the excitatory and inhibitory synapses on each common target neuron, the excitatory synapse has a faster impulse response than that of the inhibitory synapse.
The main findings of the modeling study are that a simplified model for the auditory brainstem circuit was able to reproduce most of the salient features of the BE- and BS-type MTFs of IC neurons. In the model, tuning of MTFs originates from a combination of a fast excitatory synaptic impulse response and a slow inhibitory synaptic impulse response. The sum of the impulse responses is oscillatory in the time domain. This means that in the frequency domain, the response is tuned. The model also reproduced hybrid-type MTFs to some extent (Fig. 23). The modeling results presented here support the hypothesis that the mechanisms embodied in the model may underlie the MTF characteristics of IC neurons described here.
The durations of the combined excitatory and inhibitory synaptic impulse responses of the model cells reflect their integration times, which play a role in determining the model responses to high modulation frequencies. Consistent with this view, both BE and BS MTF types of the model showed firing rates that trended toward their responses to the unmodulated stimuli for those high modulation frequencies (Figs. 19 and 21). The responses of BE neurons of the IC (Fig. 3) and of the MGB (Fig. 14) also fit this description. The responses of BS neurons of the IC (Fig. 5) and of the MGB (Fig. 14) also generally fit this description. Further modeling of hybrid-type MTFs (Carney et al. 2016) will need to address their firing rate patterns that remain enhanced or suppressed at high modulation frequencies above the synchronization limit (Fig. 7).
GRANTS
This study was supported by National Institutes of Health Grant Nos. R01 DC002178 and R01 DC010813.
DISCLOSURES
No conflicts of interest, financial or otherwise, are declared by the authors.
AUTHOR CONTRIBUTIONS
D.O.K. and S.K. conceived and designed research; D.O.K. and S.K. performed experiments; D.O.K. and S.K. analyzed data; D.O.K., L.H.C. and S.K. interpreted results of experiments; D.O.K. prepared figures; D.O.K. drafted manuscript; D.O.K. and L.H.C. edited and revised manuscript; D.O.K. and L.H.C. approved final version of manuscript.
ACKNOWLEDGMENTS
We thank Brian Bishop for implementing computer software for neural data collection and analysis and for running the laboratory, including handling of the rabbits used in the experiments. We thank Dr. Douglas Oliver for his help in preparing the histology of the inferior colliculus and medial geniculate body and in delineating the cytoarchitectonic areas. We thank Drs. Leslie Bernstein, Pavel Zahorik, and Douglas Oliver for discussions on the auditory system. We also thank anonymous reviewers for making constructive criticisms and suggestions.
REFERENCES
- Alder TB, Rose GJ. Integration and recovery processes contribute to the temporal selectivity of neurons in the midbrain of the northern leopard frog, Rana pipiens. J Comp Physiol A Neuroethol Sens Neural Behav Physiol 186: 923–937, 2000. doi: 10.1007/s003590000144. [DOI] [PubMed] [Google Scholar]
- Batra R. Responses of neurons in the ventral nucleus of the lateral lemniscus to sinusoidally amplitude modulated tones. J Neurophysiol 96: 2388–2398, 2006. doi: 10.1152/jn.00442.2006. [DOI] [PubMed] [Google Scholar]
- Bernstein LR, Trahiotis C. How sensitivity to ongoing interaural temporal disparities is affected by manipulations of temporal features of the envelopes of high-frequency stimuli. J Acoust Soc Am 125: 3234–3242, 2009. doi: 10.1121/1.3101454. [DOI] [PMC free article] [PubMed] [Google Scholar]
- Bernstein LR, Trahiotis C. Accounting quantitatively for sensitivity to envelope-based interaural temporal disparities at high frequencies. J Acoust Soc Am 128: 1224–1234, 2010. doi: 10.1121/1.3466877. [DOI] [PMC free article] [PubMed] [Google Scholar]
- Carney LH. Supra-threshold hearing and fluctuation profiles: implications for sensorineural and hidden hearing loss. J Assoc Res Otolaryngol 19: 331–352, 2018. doi: 10.1007/s10162-018-0669-5. [DOI] [PMC free article] [PubMed] [Google Scholar]
- Carney LH, Kim DO, Kuwada S. Speech coding in the midbrain: effects of sensorineural hearing loss In: Physiology, Psychoacoustics and Cognition in Normal and Impaired Hearing, edited by van Dijk P, Başkent D, Gaudrain E, de Kleine E, Wagner A, Lanting C. Cham: Springer, 2016, p. 427–435. [DOI] [PMC free article] [PubMed] [Google Scholar]
- Carney LH, Li T, McDonough JM. Speech coding in the brain: representation of vowel formants by midbrain neurons tuned to sound fluctuations. eNeuro 2: ENEURO.0004-15.2015, 2015. doi: 10.1523/ENEURO.0004-15.2015. [DOI] [PMC free article] [PubMed] [Google Scholar]
- Carney LH, Zilany MS, Huang NJ, Abrams KS, Idrobo F. Suboptimal use of neural information in a mammalian auditory system. J Neurosci 34: 1306–1313, 2014. doi: 10.1523/JNEUROSCI.3031-13.2014. [DOI] [PMC free article] [PubMed] [Google Scholar]
- D’Angelo WR, Sterbing SJ, Ostapoff EM, Kuwada S. Effects of amplitude modulation on the coding of interaural time differences of low-frequency sounds in the inferior colliculus. II. Neural mechanisms. J Neurophysiol 90: 2827–2836, 2003. doi: 10.1152/jn.00269.2003. [DOI] [PubMed] [Google Scholar]
- Davis MH, Johnsrude IS, Hervais-Adelman A, Taylor K, McGettigan C. Lexical information drives perceptual learning of distorted speech: evidence from the comprehension of noise-vocoded sentences. J Exp Psychol Gen 134: 222–241, 2005. doi: 10.1037/0096-3445.134.2.222. [DOI] [PubMed] [Google Scholar]
- Delattre P, Liberman AM, Cooper FS, Gerstman LJ. An experimental study of the acoustic determinants of vowel color; observations on one-and two-formant vowels synthesized from spectrographic patterns. Word 8: 195–210, 1952. doi: 10.1080/00437956.1952.11659431. [DOI] [Google Scholar]
- Delgutte B, Kiang NY. Speech coding in the auditory nerve: I. Vowel-like sounds. J Acoust Soc Am 75: 866–878, 1984. doi: 10.1121/1.390596. [DOI] [PubMed] [Google Scholar]
- Dent ML, Klump GM, Schwenzfeier C. Temporal modulation transfer functions in the barn owl (Tyto alba). J Comp Physiol A Neuroethol Sens Neural Behav Physiol 187: 937–943, 2002. doi: 10.1007/s00359-001-0259-5. [DOI] [PubMed] [Google Scholar]
- Ding N, Patel AD, Chen L, Butler H, Luo C, Poeppel D. Temporal modulations in speech and music. Neurosci Biobehav Rev 81, Pt. B: 181–187, 2017. doi: 10.1016/j.neubiorev.2017.02.011. [DOI] [PubMed] [Google Scholar]
- Dorman MF, Loizou PC, Rainey D. Speech intelligibility as a function of the number of channels of stimulation for signal processors using sine-wave and noise-band outputs. J Acoust Soc Am 102: 2403–2411, 1997. doi: 10.1121/1.419603. [DOI] [PubMed] [Google Scholar]
- Drullman R, Festen JM, Plomp R. Effect of reducing slow temporal modulations on speech reception. J Acoust Soc Am 95: 2670–2680, 1994. doi: 10.1121/1.409836. [DOI] [PubMed] [Google Scholar]
- Dudley H. Remaking speech. J Acoust Soc Am 11: 169–177, 1939. doi: 10.1121/1.1916020. [DOI] [Google Scholar]
- Dudley H. The carrier nature of speech. Bell Syst Tech J 19: 495–515, 1940. doi: 10.1002/j.1538-7305.1940.tb00843.x. [DOI] [Google Scholar]
- Epping WJ, Eggermont JJ. Sensitivity of neurons in the auditory midbrain of the grassfrog to temporal characteristics of sound. II. Stimulation with amplitude modulated sound. Hear Res 24: 55–72, 1986. doi: 10.1016/0378-5955(86)90005-5. [DOI] [PubMed] [Google Scholar]
- Fan L, Henry KS, Carney LH. Challenging one model with many stimuli: simulating responses in the inferior colliculus. Acta Acust Acust 104: 895–899, 2018). [DOI] [PMC free article] [PubMed] [Google Scholar]
- Fitzgerald MB, Wright BA. A perceptual learning investigation of the pitch elicited by amplitude-modulated noise. J Acoust Soc Am 118: 3794–3803, 2005. doi: 10.1121/1.2074687. [DOI] [PubMed] [Google Scholar]
- Geis HR, Borst JG. Intracellular responses of neurons in the mouse inferior colliculus to sinusoidal amplitude-modulated tones. J Neurophysiol 101: 2002–2016, 2009. doi: 10.1152/jn.90966.2008. [DOI] [PubMed] [Google Scholar]
- Gooler DM, Feng AS. Temporal coding in the frog auditory midbrain: the influence of duration and rise-fall time on the processing of complex amplitude-modulated stimuli. J Neurophysiol 67: 1–22, 1992. doi: 10.1152/jn.1992.67.1.1. [DOI] [PubMed] [Google Scholar]
- Grimault N, Micheyl C, Carlyon RP, Collet L. Evidence for two pitch encoding mechanisms using a selective auditory training paradigm. Percept Psychophys 64: 189–197, 2002. doi: 10.3758/BF03195785. [DOI] [PubMed] [Google Scholar]
- Hill FJ, McRae LP, McClellan RP. Speech recognition as a function of channel capacity in a discrete set of channels. J Acoust Soc Am 44: 13–18, 1968. doi: 10.1121/1.1911047. [DOI] [PubMed] [Google Scholar]
- Jack JJ, Noble D, Tsien RW. Electric Current Flow in Excitable Cells. Oxford, UK: Clarendon Press, 1975. [Google Scholar]
- Joris PX, Schreiner CE, Rees A. Neural processing of amplitude-modulated sounds. Physiol Rev 84: 541–577, 2004. doi: 10.1152/physrev.00029.2003. [DOI] [PubMed] [Google Scholar]
- Joris PX, Yin TC. Responses to amplitude-modulated tones in the auditory nerve of the cat. J Acoust Soc Am 91: 215–232, 1992. doi: 10.1121/1.402757. [DOI] [PubMed] [Google Scholar]
- Kelly JB, Cooke JE, Gilbride PC, Mitchell C, Zhang H. Behavioral limits of auditory temporal resolution in the rat: amplitude modulation and duration discrimination. J Comp Psychol 120: 98–105, 2006. doi: 10.1037/0735-7036.120.2.98. [DOI] [PubMed] [Google Scholar]
- Kim DO, Sirianni JG, Chang SO. Responses of DCN-PVCN neurons and auditory nerve fibers in unanesthetized decerebrate cats to AM and pure tones: analysis with autocorrelation/power-spectrum. Hear Res 45: 95–113, 1990. doi: 10.1016/0378-5955(90)90186-S. [DOI] [PubMed] [Google Scholar]
- Kim DO, Zahorik P, Carney LH, Bishop BB, Kuwada S. Auditory distance coding in rabbit midbrain neurons and human perception: monaural amplitude modulation depth as a cue. J Neurosci 35: 5360–5372, 2015. doi: 10.1523/JNEUROSCI.3798-14.2015. [DOI] [PMC free article] [PubMed] [Google Scholar]
- Krause JC, Braida LD. Evaluating the role of spectral and envelope characteristics in the intelligibility advantage of clear speech. J Acoust Soc Am 125: 3346–3357, 2009. doi: 10.1121/1.3097491. [DOI] [PMC free article] [PubMed] [Google Scholar]
- Krebs B, Lesica NA, Grothe B. The representation of amplitude modulations in the mammalian auditory midbrain. J Neurophysiol 100: 1602–1609, 2008. doi: 10.1152/jn.90374.2008. [DOI] [PubMed] [Google Scholar]
- Krishna BS, Semple MN. Auditory temporal processing: responses to sinusoidally amplitude-modulated tones in the inferior colliculus. J Neurophysiol 84: 255–273, 2000. doi: 10.1152/jn.2000.84.1.255. [DOI] [PubMed] [Google Scholar]
- Kuwada S, Batra R. Coding of sound envelopes by inhibitory rebound in neurons of the superior olivary complex in the unanesthetized rabbit. J Neurosci 19: 2273–2287, 1999. doi: 10.1523/JNEUROSCI.19-06-02273.1999. [DOI] [PMC free article] [PubMed] [Google Scholar]
- Kuwada S, Bishop B, Kim DO. Azimuth and envelope coding in the inferior colliculus of the unanesthetized rabbit: effect of reverberation and distance. J Neurophysiol 112: 1340–1355, 2014. doi: 10.1152/jn.00826.2013. [DOI] [PMC free article] [PubMed] [Google Scholar]
- Langner G, Schreiner CE. Periodicity coding in the inferior colliculus of the cat. I. Neuronal mechanisms. J Neurophysiol 60: 1799–1822, 1988. doi: 10.1152/jn.1988.60.6.1799. [DOI] [PubMed] [Google Scholar]
- Loizou PC, Dorman M, Tu Z. On the number of channels needed to understand speech. J Acoust Soc Am 106: 2097–2103, 1999. doi: 10.1121/1.427954. [DOI] [PubMed] [Google Scholar]
- Lu T, Liang L, Wang X. Temporal and rate representations of time-varying signals in the auditory cortex of awake primates. Nat Neurosci 4: 1131–1138, 2001. doi: 10.1038/nn737. [DOI] [PubMed] [Google Scholar]
- Mardia KV, Jupp PE. Directional Statistics. Hoboken, NJ: John Wiley & Sons, 2009, vol. 494. [Google Scholar]
- Moody DB. Detection and discrimination of amplitude-modulated signals by macaque monkeys. J Acoust Soc Am 95: 3499–3510, 1994. doi: 10.1121/1.409967. [DOI] [PubMed] [Google Scholar]
- Moore BC. An Introduction to the Psychology of Hearing (6th ed.). Leiden, The Netherlands: Brill, 2012. [Google Scholar]
- Müller-Preuss P, Flachskamm C, Bieser A. Neural encoding of amplitude modulation within the auditory midbrain of squirrel monkeys. Hear Res 80: 197–208, 1994. doi: 10.1016/0378-5955(94)90111-2. [DOI] [PubMed] [Google Scholar]
- Nelson PC, Carney LH. A phenomenological model of peripheral and central neural responses to amplitude-modulated tones. J Acoust Soc Am 116: 2173–2186, 2004. doi: 10.1121/1.1784442. [DOI] [PMC free article] [PubMed] [Google Scholar]
- Nelson PC, Carney LH. Neural rate and timing cues for detection and discrimination of amplitude-modulated tones in the awake rabbit inferior colliculus. J Neurophysiol 97: 522–539, 2007. doi: 10.1152/jn.00776.2006. [DOI] [PMC free article] [PubMed] [Google Scholar]
- Oliver DL, Cant NB, Fay RR, Popper AN (). The Mammalian Auditory Pathways: Synaptic Organization and Microcircuits. Cham, Switzerland: Springer, 2018, vol. 65. [Google Scholar]
- Palmer AR, Shackleton TM, Sumner CJ, Zobay O, Rees A. Classification of frequency response areas in the inferior colliculus reveals continua not discrete classes. J Physiol 591: 4003–4025, 2013. doi: 10.1113/jphysiol.2013.255943. [DOI] [PMC free article] [PubMed] [Google Scholar]
- Preuss A, Müller-Preuss P. Processing of amplitude modulated sounds in the medial geniculate body of squirrel monkeys. Exp Brain Res 79: 207–211, 1990. doi: 10.1007/BF00228890. [DOI] [PubMed] [Google Scholar]
- Rabiner LR, Schafer RW. Theory and Applications of Digital Speech Processing. Upper Saddle River, NJ: Pearson, 2011, vol. 64. [Google Scholar]
- Ramachandran R, Davis KA, May BJ. Single-unit responses in the inferior colliculus of decerebrate cats. I. Classification based on frequency response maps. J Neurophysiol 82: 152–163, 1999. doi: 10.1152/jn.1999.82.1.152. [DOI] [PubMed] [Google Scholar]
- Rees A, Møller AR. Stimulus properties influencing the responses of inferior colliculus neurons to amplitude-modulated sounds. Hear Res 27: 129–143, 1987. doi: 10.1016/0378-5955(87)90014-1. [DOI] [PubMed] [Google Scholar]
- Rees A, Palmer AR. Neuronal responses to amplitude-modulated and pure-tone stimuli in the guinea pig inferior colliculus, and their modification by broadband noise. J Acoust Soc Am 85: 1978–1994, 1989. doi: 10.1121/1.397851. [DOI] [PubMed] [Google Scholar]
- Rhode WS, Greenberg S. Encoding of amplitude modulation in the cochlear nucleus of the cat. J Neurophysiol 71: 1797–1825, 1994. doi: 10.1152/jn.1994.71.5.1797. [DOI] [PubMed] [Google Scholar]
- Schiller PH. The ON and OFF channels of the visual system. Trends Neurosci 15: 86–92, 1992. doi: 10.1016/0166-2236(92)90017-3. [DOI] [PubMed] [Google Scholar]
- Schroeder MR. Vocoders: analysis and synthesis of speech. Proc IEEE 54: 720–734, 1966. doi: 10.1109/PROC.1966.4841. [DOI] [Google Scholar]
- Shannon RV, Zeng FG, Kamath V, Wygonski J, Ekelid M. Speech recognition with primarily temporal cues. Science 270: 303–304, 1995. doi: 10.1126/science.270.5234.303. [DOI] [PubMed] [Google Scholar]
- Sinex DG, Henderson J, Li H, Chen GD. Responses of chinchilla inferior colliculus neurons to amplitude-modulated tones with different envelopes. J Assoc Res Otolaryngol 3: 390–402, 2002. doi: 10.1007/s101620020026. [DOI] [PMC free article] [PubMed] [Google Scholar]
- Smith ZM, Delgutte B, Oxenham AJ. Chimaeric sounds reveal dichotomies in auditory perception. Nature 416: 87–90, 2002. doi: 10.1038/416087a. [DOI] [PMC free article] [PubMed] [Google Scholar]
- Steeneken HJ, Houtgast T. A physical method for measuring speech-transmission quality. J Acoust Soc Am 67: 318–326, 1980. doi: 10.1121/1.384464. [DOI] [PubMed] [Google Scholar]
- Sterbing SJ, D’Angelo WR, Ostapoff EM, Kuwada S. Effects of amplitude modulation on the coding of interaural time differences of low-frequency sounds in the inferior colliculus. I. Response properties. J Neurophysiol 90: 2818–2826, 2003. doi: 10.1152/jn.00268.2003. [DOI] [PubMed] [Google Scholar]
- Stevens KN. Acoustic Phonetics. Cambridge, MA: MIT Press, 2000, vol. 30. [Google Scholar]
- Varnet L, Ortiz-Barajas MC, Erra RG, Gervain J, Lorenzi C. A cross-linguistic study of speech modulation spectra. J Acoust Soc Am 142: 1976–1989, 2017. doi: 10.1121/1.5006179. [DOI] [PubMed] [Google Scholar]
- Viemeister NF. Temporal modulation transfer functions based upon modulation thresholds. J Acoust Soc Am 66: 1364–1380, 1979. doi: 10.1121/1.383531. [DOI] [PubMed] [Google Scholar]
- Yin P, Johnson JS, O’Connor KN, Sutter ML. Coding of amplitude modulation in primary auditory cortex. J Neurophysiol 105: 582–600, 2011. doi: 10.1152/jn.00621.2010. [DOI] [PMC free article] [PubMed] [Google Scholar]
- Zheng Y, Escabí MA. Distinct roles for onset and sustained activity in the neuronal code for temporal periodicity and acoustic envelope shape. J Neurosci 28: 14230–14244, 2008. doi: 10.1523/JNEUROSCI.2882-08.2008. [DOI] [PMC free article] [PubMed] [Google Scholar]
- Zilany MS, Bruce IC, Carney LH. Updated parameters and expanded simulation options for a model of the auditory periphery. J Acoust Soc Am 135: 283–286, 2014. doi: 10.1121/1.4837815. [DOI] [PMC free article] [PubMed] [Google Scholar]


