

Summary
Mammalian SWI/SNF complexes are ATP-dependent chromatin-remodeling complexes that regulate genomic architecture. Here, we present a structural model of the endogenously-purified human canonical BAF complex bound to the nucleosome, generated using cryo-EM, cross-linking mass spectrometry, and homology modeling. BAF complexes bilaterally engage the nucleosome H2A/H2B acidic patch regions through the SMARCB1 C-terminal α-helix and the SMARCA4/2 C-terminal SnAc/post-SnAc regions, with disease-associated mutations in either causing attenuated chromatin remodeling activities. Further, we define changes in BAF complex architecture upon nucleosome engagement and compare the structural model of endogenous BAF to those of related SWI/SNF-family complexes. Finally, we assign and experimentally interrogate cancer-associated hot-spot mutations localizing within the endogenous human BAF complex, identifying those that disrupt BAF subunit–subunit and subunit–nucleosome interfaces in the nucleosome-bound conformation. Taken together, this integrative structural approach provides important biophysical foundations for understanding the mechanisms of BAF complex function in normal and disease states.
Graphical Abstract
Introduction
ATP-dependent chromatin-remodeling complexes are multi-component entities that govern nuclear architecture by altering nucleosome positioning and content. Originally discovered and characterized in yeast, chromatin remodelers fall into the SWI/SNF, ISWI, CHD, INO80, and SWR families and each contains helicase subunits (ATPases) and several additional components that diversify their activities and chromatin-targeting proclivities (Clapier et al., 2017). Members of the SWI/SNF family, including SWI/SNF and RSC in yeast, slide and evict nucleosomes and differ from members of other families with respect to their diverse subtypes, heterogeneous subunit compositions, activities on mammalian chromatin, and uniquely strong links to human disease (Kadoch et al., 2013).
Mammalian SWI/SNF (mSWI/SNF) complexes exist in three distinct configurations: canonical BAF (BAF or cBAF) complexes, polybromo-associated BAF (PBAF) complexes, and non-canonical BAF (ncBAF) complexes, each distinguished by the incorporation of distinct accessory subunits as well as their targeting patterns on the genome (Mashtalir et al., 2018; Michel et al., 2018). Importantly, the genes encoding subunits of mSWI/SNF-family complexes are mutated in over 20% of human cancers and in several neurodevelopmental and intellectual disability syndromes in which mutations are causative, making them the most frequently mutated chromatin regulators in human disease (Bogershausen and Wollnik, 2018; Kadoch et al., 2013; Pulice and Kadoch, 2016; Tsurusaki et al., 2012; Tsurusaki et al., 2014; Wieczorek et al., 2013).
The most abundant and highly mutated complex within the mSWI/SNF family is the canonical BAF complex, which contains as defining components the ARID1A/B subunit paralogs and the DPF2 reader subunit (Mashtalir et al., 2018). BAF complexes localize predominantly to distal enhancer sites genome-wide, regulating their accessibility and activating tissue-specific gene expression (Nakayama et al., 2017)(Pan et al., 2019). They are thus major tumor suppressor entities that play critical roles in mediating proper cell differentiation down terminal tissue lineages (Eroglu et al., 2014; Ho et al., 2009). As such, perturbations to cBAF complexes in particular disrupt normal enhancer accessibility and hence transcription-factor access to their cognate recognition motifs, thereby causing program-level disruption of tissue differentiation (Kelso et al., 2017; Mathur et al., 2017; Nakayama et al., 2017; Pan et al., 2019; Sandoval et al., 2018; Wang et al., 2017; Xu et al., 2020).
While over the past several years the field has gained an increasing understanding regarding the role of human SWI/SNF complexes in normal cell states, during development, and in disease, studies defining their subunit organization, assembly (Mashtalir et al., 2018), and 3D structure have only recently begun to emerge. Particularly, high-resolution cryo-EM structures have become available for the related yet distinct yeast RSC (Patel et al., 2019; Wagner et al., 2020; Ye et al., 2019), yeast SWI/SNF complexes (Han et al., 2020) and, during revision of this study, for a recombinant human BAF complex (He et al., 2020), each bound to the nucleosome, confirming the previously established modular subunit organization for the SWI/SNF family of remodelers (Mashtalir et al., 2018) and shedding new light on complex–nucleosome engagement mechanisms. Interestingly, while considered highly conserved, only a fraction of the total recurrent single-residue human disease-associated mutations can be mapped onto the structures of the yRSC, ySWI/SNF and recombinant BAF complexes, leaving several mutations awaiting structural and functional assignment.
Here, we present a three-dimensional (3D) structural model of the endogenously-purified human canonical BAF complex bound to the nucleosome using a combination of single-particle cryo-electron microscopy (cryo-EM), cross-linking mass-spectrometry (CX-MS), and homology modeling. We report two single-particle cryo-EM maps for the human BAF complex, in isolation and in complex with a nucleosome core particle (NCP), highlighting recently-identified mammalian-specific subunits and domains and their binding interactions. We perform extensive comparative analyses with related SWI/SNF-family complexes and chromatin remodelers of other classes. Importantly, we leverage the structure of the fully-assembled endogenous human BAF complex to inform its mechanism of action and motion on nucleosome substrates, structural requirements for remodeling activities, and functional deficits caused by previously-uncharacterized, recurrent cancer-specific missense mutations. Taken together, these studies provide the foundation for comprehensive dissection of human BAF complex–nucleosome interactions and the impact of recurrent disease-associated mutations in this major chromatin regulatory entity, opening up new directions for the field at large.
Results
Overall structural organization of the BAF–NCP complex
In this study, we purified endogenous human BAF complexes for structural examination by both cryo-EM and CX-MS (Figure S1A) using expression of an HA-tagged DPF2 subunit to uniquely capture canonical BAF complexes in HEK-293F cells. Purified HA-DPF2-containing complexes were then subjected to density sedimentation to isolate fully-formed BAF complexes (Figure S1B) using approaches previously established by our group (Mashtalir et al., 2018). Complexes were confirmed to be catalytically active and to exhibit nucleosome-remodeling activity, as assessed by ATPase activity assays (by ADP-Glo measurements) and restriction enzyme accessibility assays (REAA), respectively (Figure S1C,D).
For cryo-EM analyses, purified BAF complexes were stabilized using GraFix (Kastner et al., 2008; Stark, 2010), vitrified, and imaged by cryo-EM (Figure S1E). A total of ~600,000 particles were subjected to 2D and 3D classification, which revealed a complex consisting of two major lobes, an elongated upper lobe in close contact with a triangular lower lobe (Figure S1F,G). Further 3D classification and refinement steps focusing on the lower lobe yielded a density map for this region of the BAF complex at 7.8 Å (Figure S1G,H). Attempts to obtain a map for the upper lobe at sub-nanometer resolution were unsuccessful. Reasoning that NCP binding may stabilize BAF complexes, we next incubated BAF complexes with NCPs and stabilized them using the GraFix approach (Kastner et al., 2008; Stark, 2010) (Figure S2A-C). For CX-MS analysis, the BAF–NCP complex was fixed with bissulfosuccinimidyl suberate (BS3) instead of glutaraldehyde and confirmed to migrate in the expected fractions on sucrose gradients prior to mass-spectrometric analysis (Figure S2D).
Following vitrification and imaging (Figure S2E), a total of ~1,700,000 particles were automatically picked and subjected to image processing (Figure S2F,G). Refinement of ~880,000 NCP-bound BAF particles yielded a map that showed clear density for the nucleosome and the BAF domains in direct contact with it. Following focused classification and refinement, density maps were produced for these regions at ~5.8-Å resolution (Figure S2F,G, Table S1), yielding a composite density map of the endogenous human BAF complex bound to a nucleosome (Figure S3A). Because the resolution of the map was insufficient to deduce the subunit organization, we assembled high-convergence homology models of subunit domains (Song et al., 2013) (Figure S3B-E) into the density map, guided by CX-MS data of human BAF–NCP complex (Figure S3F, Table S2) and the high-resolution structure of the yeast SWI/SNF complex (Han et al., 2020). This integrative strategy resulted in a model of the endogenous human BAF complex bound to the nucleosome (Figures 1A,B).
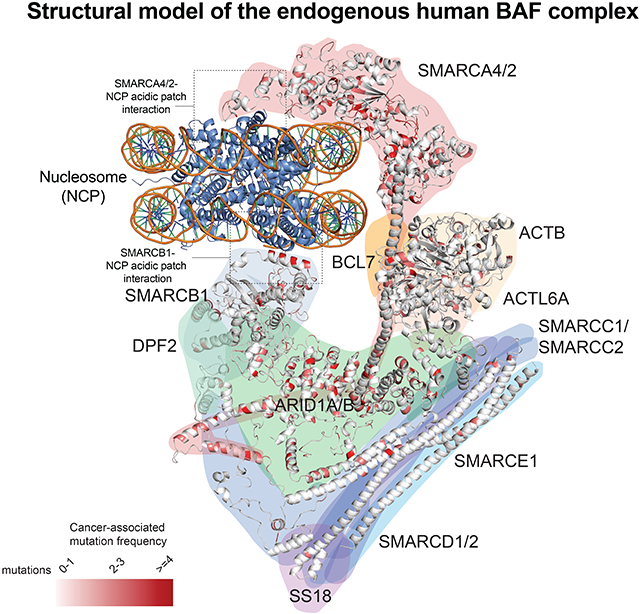
Figure 1. Model for the endogenous human BAF complex bound to a nucleosome.

A-B. Model of the human BAF-NCP complex. Canonical BAF complex subunits are organized into the ATPase, ARP and core modules, and labeled by color. SMARCC1a/b are shown to represent both SMARCC1 and SMARCC2, SMARCD2 to represent SMARCD1 and SMARCD2, ARID1A to represent both ARID1A and ARID1B found within endogenously-purified complexes. Unaccounted densities in the map of the endogenous BAF complex are indicated.
C. Top view of the BAF complex showing the interaction of the ATPase module with the NCP.
D. Side view of the BAF complex focusing on the ARP module (ACTL6A, ACTB and the SMARCA4 HSA domain).
E. The interaction of the SMARCA4/2 ATPase subunit with the BAF core module.
F. Cross-links between all BAF subunits and NCP histones. Subunits are arranged by module (colored blocks). The SMARCA4 ATPase (red asterisk) cross-links to all BAF subunits and two histones.
G. A helical bundle, consisting of the SMARCC, SMARCD, and SMARCE1 subunits, forms the basis of the core module of the BAF complex.
H. SMARCB1 and its interactions with the NCP and components of the core module. See also Figures S1-S3, Tables S1-S2.
SMARCA4 connects the core, ATPase, and ARP modules
Our model of the BAF–NCP complex reveals that the human cBAF complex is composed of three main structural modules, consistent with previous biochemical findings obtained with free BAF complexes (Mashtalir et al., 2018), arranged in a ‘C shape’ around the NCP. We term these the ‘BAF core’ module, which forms the triangular lower lobe abutting the nucleosome via the SMARCB1 C-terminal domain (CTD), the ‘catalytic ATPase’ module comprised of the SMARCA4/2 ATPase subunit C-terminal region that interacts with the face of the nucleosome opposite that contacted by the core module, and the ‘ARP’ module, which connects these two modules via the SMARCA4 HSA domain (Figure 1A-B, Movie S1). The BAF complex engages both faces of the NCP, interacting with both core histone folds over the H2A/H2B acidic patches. The endogenous human complex (1.44 MDa) is 245 Å in height and 162 Å in width, which makes it ~4.5 times larger than the NCP (98 Å in diameter). Several regions of the map not accounted for by the model, and not present in maps of recombinant or yeast complexes, could be putatively assigned to BAF subunits based on CX-MS data (Figures 1A,B, Figure S4A-C, further described in Figure 2).
Figure 2. Assignment of human-specific BAF subunits and domains to densities in the cryo-EM map of the endogenous human BAF complex.

A. Two views of the cryo-EM maps of the endogenous human BAF–NCP complex (transparent gray surface) with the model (colored ribbon representation). Unaccounted densities to which endogenous human-specific BAF subunits could be putatively assigned based on CX-MS data are shown as colored surfaces and labeled.
B. (Top) CX-MS localizes the N-terminus of BCL7A. (Bottom) Residues of subunits included in the structural model of the BAF complex that form cross-links with BCL7A.
C. Overlay of cryo-EM maps of the endogenous human BAF complex in the presence of AMP-PNP (this study, yellow) and that of the recombinant human BAF complex in the ADP-bound state (EMD-0974, green), low-pass-filtered to 10 Å. Arrows indicate the displacement of the ATPase and ARP modules relative to the recombinant complex.
D. CX-MS localizes the SSXT domain of the human-specific subunit SS18 close to BAF subunits SMARCA4 (N-term) and SMARCD1 within the core module.
E. Zoomed-in view of the core module (ribbon representation) highlighting the N-termini of SMARCC1/SMARCC2 and ARID1A on the right, which localize to the blue and green unaccounted densities shown in (A), respectively. Regions of SMARCD1 N-terminus are shown on the upper left. Mappable SMARCE1 residue to which SS18 cross-links is shown at the bottom of the core module nearest the SMARCA4 ATPase N-terminus. See also Figure S4.
The ATPase module consists of the catalytic helicase domains of SMARCA4, which interact with the ‘top’ nucleosome face as well as with the nucleosomal DNA at the superhelical location 2 (SHL 2) position (Figure 1C, Movie S2) (Liu et al., 2017). The ARP module, consisting of subunits ACTB and ACTL6A, interacts with the long α-helix formed by the SMARCA4 HSA domain (aa 447-531), which connects the ATPase and core modules (Figure 1A,D). The long HSA α-helix passes laterally by the NCP to interact with ARM repeats 5-7 of ARID1 (termed core-binding region, CBR) and continues into the core to form the anchor domain of SMARCA4, which includes two α-helical segments that interact with the SANT domains of the two SMARCC1 subunits (Figure 1E). This organization is further supported by CX-MS data indicating that the SMARCA4 ATPase is the most extensively cross-linked subunit within the complex, and contains a number of regions within the ATPase itself and the other ATPase-bound subunits that mediate interactions to NCP core and tail regions (Figure 1F).
The base of the BAF core module is formed by a helical bundle that includes the coiled-coil (CC) domains of the two SMARCC1/2 subunits (previously termed CAR and dimerization regions, respectively; Mashtalir et al., 2018), and those of the SMARCD and SMARCE1 subunits (Figure 1G). The assembly of the SMARCC1/2 and SMARCD subunits into an interconnected helical bundle provides a structural explanation for the previous finding that deletion of any of these subunits completely abrogates BAF complex formation (Mashtalir et al., 2018). The mammalian-specific SMARCE1 subunit is positioned more peripherally to the helical bundle, explaining why deletion of this subunit does not completely inhibit complex formation (Mashtalir et al., 2018). While the helical bundle forms one side of the ‘V-shaped’ core module, the other side is formed by the SANT and SWIRM domains of the two SMARCC1 subunits, ending in the SMARCB1 subunit, which interacts with the NCP at the H2A/H2B acidic patch region (Figure 1H, Movie S2), as recently shown by our group (Valencia et al., 2019) and then seen in the structures of the yeast and human recombinant SWI/SNF complexes (Han et al., 2020; He et al., 2020). The V shape of the core is bridged by the C-terminal armadillo (ARM) repeats (or CBR) of the ARID1 subunit, which on one side form an extensive interface with the CC and SWIB domains of SMARCD of the helical bundle, and on the other side interact with one of the SMARCC1 SWIRM domains. This subunit arrangement scaffolds the core module as a single rigid entity within the full BAF complex.
Assignment of mammalian-specific subunits and subunit domains
In addition to the structural model, CX-MS data obtained with endogenous BAF–NCP complexes allowed us to localize mammalian-specific subunits within the cryo-EM map (Figures 2A, 1A-B, Movie S3). These include the recently-identified subunits of the BCL7A/B/C family (~23 kDa) and SS18 (46 kDa), each comprised of mostly unstructured, intrinsically disordered protein (IDP) regions and strongly implicated in cancer (Kadoch and Crabtree, 2013; Kadoch et al., 2013). We identified cross-links of these components at their N-termini with BAF subunits and/or with the NCP (Figures 2A, S3F). In the NCP-bound conformation, the BCL7A N-terminus (aa 1-40), within which recurrent mutations are found in diffuse large B-cell lymphoma (DLBCL) (Balinas-Gavira et al., 2020), interacts with the HSA domain of SMARCA4 near its contact with ARP-module subunits ACTL6A and ACTB, and with the nucleosome acidic patch (H2B) and SMARCB1 CTD (Figure 2B). Specifically, we detected cross-links at amino acids 15, 19 of BCL7A with amino acids 496, 499 of SMARCA4 (Figure 2B). Further, we observed a shift in the positioning of the HSA domain and hence ARP module relative to the NCP in models of endogenous versus recombinant BAF–NCP complexes, suggesting a potential function for BCL7A as a ‘bridge’ or ‘spacer’ that evolved in metazoans for a yet-to-be-established function, for example, to accommodate the binding of specific factors (Figures 2C, S4D). SS18 contacts the disordered N-terminal region of the SMARCA4 ATPase (Lys13 of SS18 to Lys94 of SMARCA4) via its N-terminus located at the base of the core module (Figure 2D). This provides important structural context for BAF complex core module disruption observed in synovial sarcoma, in which the SSX tail of the SS18-SSX fusion oncoprotein binds the nucleosome acidic patch with higher affinity than the SMARCB1 C-terminal α-helix, providing a possible explanation for the destabilization and degradation of SMARCB1 (BAF47) (McBride et al., 2020).
We also identified cross-links showing that the N-termini of SMARCC1 and SMARCC2 that are not part of the model interact with SMARCB1 near the NCP attachment point (Figure 2E), thus mapping them to the unfilled density shown in blue in Figure 2A. The N-termini of SMARCD1/2, also not included in the model, map to the opposite side of the core module; however, additional unassigned density in this region could not be interpreted (Figure 2E, 2A). Finally, the large, peripheral unassigned density within the core module extending from the C-terminal core-binding region of ARID1A (Figure 2A) can be explained by the large N-terminal region of ARID1A (~170 kDa) (Figure 2E). Taken together, the assignment of additional subunits and subunit domains to densities in the cryo-EM map of the endogenous human BAF complex provides important context for defining their role in BAF complex function and in the evaluation of recurrent missense mutations in these subunit regions.
Comparison of the structure of the endogenous human BAF complex with those of other SWI/SNF complexes
Our model of the endogenous BAF complex includes 36% of all the residues of the complex, while those of the recombinant BAF, ySWI/SNF and yRSC complexes include 31%, 31%, and 29%, respectively (Figures 3A,B, S4E). Integrating CX-MS data, the location of 43% of the residues in the mSWI/SNF complex could be assigned (Figure S4F).
Figure 3. Comparison of the endogenous human BAF complex to recombinant human and yeast complexes.

A-B. Bar graphs depicting the percentage of total cBAF amino acids included in the structural models, by (A) complex and (B) subunit.
C. (Top, middle) Two views of the cryo-EM maps of the NCP-bound forms of endogenous, recombinant and yeast complexes, showing the interaction of the ATPase/ARP modules with the NCP. (Bottom) Cross-links of the SMARCA4 SnAc and post-SnAc domains to histone H2B of the NCP.
D. SMARCB1 winged helix (WH) domain placement in the models of the endogenous human BAF complex using CX-MS and the recombinant human BAF complex (PDB: 6LTJ).
E. Overlay of the model of the endogenous human BAF complex (colored by subunit) with the model of the recombinant human BAF complex (gray, PDB: 6LTJ).
F. Overlay of the models of endogenous and recombinant yeast and human SMARCA4/Snf2/Sth1 ATPase subunits aligned based on NCP position.
G. Immunoblot for BAF components including DPF2 in WT or SMARCB1 KO HEK-293T cells.
H. The DPF2 Req domain that interacts with the SMARCB1 Rpt2 domain is required for SMARCB1-BAF complex binding. Human cancer-associated mutations (COSMIC database) mapped onto the DPF2 N-terminal Req domain. See also Figures S4-S6.
Comparison of the cryo-EM density for the ATPase modules across the models of the endogenous BAF complex (this study) and other SWI/SNF family complexes (Han et al., 2020; He et al., 2020; Patel et al., 2019; Wagner et al., 2020; Ye et al., 2019) revealed several notable features: (1) The map of the endogenous human BAF complex shows additional density near the ‘top’ nucleosome acidic patch region (Figure 3C, top, middle), which CX-MS and modeling experiments identified as the SnAc and post-SnAc domains of SMARCA4 (aa 1307-1418) (Figure 3C, bottom). (2) The ATPase components closely interact with the nucleosomal DNA only in the yeast SWI/SNF and RSC complexes, whereas those of the human complexes form more loose, if any, interactions with DNA, suggesting that the structural models may have captured the complex in different functional states (Figure S5B,C). (3) The endogenous human complex exhibits the largest gap between the ATPase/ARP modules and the nucleosome (Figure 3C, top), perhaps due to the presence of additional endogenous human-specific components tethered to the ATPase module such as BCL7A. (4) In the endogenous human BAF complex, the winged-helix (WH) DNA-binding domain localizes near the DNA-exit site of the nucleosome, supported by multiple cross-links of the WH domain to the C-terminal region of the SMARCA4 HSA domain, BCL7A, and histones (Figure 3D). This differs from the placement of the WH domain in the recombinant human BAF complex, where it is localized within the core module near the HSA–ARID interface. (5) There is a 16-degree difference in the angle between the SMARCA4 HSA domains between endogenous versus recombinant complexes, shifting the position of the pre-HSA anchor region within the core module. This may again be due to the presence of additional ATPase module components that are present only in the endogenously-purified complexes (Figures 3E, S5D). (6) The ATPase and core modules lie in the same plane in the human complexes but are arranged at an angle in the yeast complexes (Figures 3F, S5A). (7) In the yRSC structures (PDBs: 6KW4 and 6TDA), the ATPase HSA domain is shorter in length by 16 aa (Figure 3F), preventing it from extending into the core module (possibly owing to increased mobility), such that the HSA–ARID interaction is not observed in the yRSC structures. Further, the extra density in the lower lobe (or core module) of yRSC, which is comprised of yRSC-specific subunits, appears to shift the position of its core module subunits laterally as compared to their position in the human cBAF (or the ySWI/SNF) structures (Figure S5B,C).
These comparisons clarify the architectural features of the endogenous cBAF complex with respect to their yeast and recombinant counterparts and also highlight the key difference between this family of remodelers and other chromatin remodelers, such as INO80 (Ayala et al., 2018; Eustermann et al., 2018), Chd1 (Farnung et al., 2017), and SWR1 (Willhoft et al., 2018) (Figure S5E), in that only SWI/SNF-family (SWI/SNF and RSC type) complexes form bilateral acidic-patch interactions and thus form a complete 'C clamp' around the nucleosome. This bilateral nucleosome engagement, together with a uniquely high degree of NCP:histone engagement relative to NCP:DNA engagement, the orientation of the ATPase relative to the nucleosome acidic patch sites, and the addition of human-specific subunits that lack yeast homologs suggests important SWI/SNF-specific differences. We identified major differences in the distribution of human disease-associated mutations, particularly when comparing the ratio of mutations that occur at interfaces between the complex and the NCP DNA to those occurring at interfaces between the complex and the NCP histones (Figure S5F-I). Specifically, while this ratio is ~20:1 for Chd1, INO80, and SWR1 complexes, it is more balanced for the endogenous BAF complex (ratio of 1.6:1), reflecting its increased engagement of histones (Figure S5I). As noted before, human cBAF complexes also exhibit higher total frequencies of mutations (20% of human cancers) compared to other chromatin-remodeling complexes (Bailey et al., 2018; Kadoch et al., 2013).
Finally, the DPF2 reader subunit, which contains a Requiem (Req) domain and a tandem plant homeobox (PHD) domain, is known to only be able to associate with the fully-assembled core module, the reason why we chose to tag DPF2 to purify fully-assembled cBAF (Mashtalir et al., 2018). The models of both the endogenous and recombinant BAF complexes include parts of the DPF2 subunit. We find that the N-terminal Req domain of DPF2 (aa 14-50) interfaces with the SMARCB1, SMARCC1 and ARID1A/B subunits (Figure S6A-B). Given that in the absence of SMARCB1, DPF2 is no longer detectable in the nuclear fraction (Figures 3G) and the spatial proximity of the DPF2 N-terminal region to SMARCB1, we used a series of truncation variants to map the region of SMARCB1 responsible for DPF2 recruitment. We observed stabilization of DPF2 in the nuclear fraction only with constructs containing the Repeat 2 (RPT2) domain (aa 259-319) of SMARCB1, confirming its critical role in mediating the integration of DPF2 into the BAF complex (Figure S6C-F). Importantly, cancer-associated mutations in DPF2 map to the Req helical domain abutting the RPT2 domain of SMARCB1 (Figure 3H).
Dynamics of nucleosome-bound and -unbound BAF complexes
Nucleosome binding is accompanied by large conformational changes in BAF complex modular structure. In the cryo-EM map of the BAF complex alone, the ATPase module sits on top of the core module, with the SMARCA4 subunit in close proximity to the SMARCB1 subunit (Figure 4A, left panel). Upon NCP binding, the ATPase module separates from the core module and rotates about the ARP module, creating space for the NCP and allowing the SMARCA4 and SMARCB1 subunits to attach to the NCP in a clamp-like grip (Figure 4A, right panel). This large conformational change is also supported by CX-MS, which revealed substantial differences in intra- and inter-subunit cross-links within the ATPase and ARP modules (Figure 4B) as well as in cross-links between other subunits/modules throughout the BAF complex between unbound and NCP-bound conditions (Figure S6G). Specifically, upon NCP binding, we detected fewer internal cross-links within the SMARCA4/2 subunits and more cross-links between the SMARCA4/2 HSA domain and the ARP-module subunits (ACTL6A and ACTB), suggesting that nucleosome binding and the associated repositioning of the ATPase module leads to reduced mobility of the ARP module and a more stable interaction with the SMARCA4 HSA helix.
Figure 4. Interaction of the endogenous human BAF complex with the NCP.

A. Cryo-EM maps of the BAF complex alone (left panel) and in complex with NCP (right panel) with the docked models of the BAF subunits and the NCP shown in ribbon representation. The dashed lines highlight the ATPase module.
B. Cross-links that are gained (red) or lost (blue) in the BAF ATPase module subunits upon NCP binding. Subunit regions are defined in Figure S3E, Table S2.
C. The two largest motions of the ATPase and ARP modules in the free BAF complex identified by multi-body refinement. Two maps at the extreme positions for each motion are shown in blue and red, with motions indicated by black arrows. See also Supplemental Movie S4.
D. The two largest motions in the BAF–NCP complex identified by multi-body refinement. A map in the intermediate position (solid gray surface) is shown for each motion and superimposed with two maps at the extreme positions (transparent blue and red surfaces). The motions are indicated with black arrows. See also Supplemental Movie S5.
E. Cross-links identified between the ATPase module (SMARCA4/SMARCA2) and histones of the NCP. Subunit regions are defined in Figure S3E, Table S2.
F. Scatter plot reflecting the number of cross-links versus the number of cancer-associated mutations within ATPase and ARP module subunits. Selected points are labeled with subunit and/or NCP region cross-linked.
G. Schematic reflecting model for nucleosome engagement dynamics of fully-formed canonical BAF complexes. See also Figure S6.
To define the conformational variability of the BAF complex, we subjected the cryo-EM dataset to multi-body refinement in RELION-3 (Nakane et al., 2018). For the BAF complex alone, we defined the three modules as separate bodies. The result of multi-body refinement indicated that the ATPase and ARP modules are flexibly tethered to the core module, presumably through the long HSA helix of SMARCA4. The analysis revealed two major movements of the ATPase and ARP modules relative to the core module: a swivel motion of approximately 40° and a swing-out motion of approximate 50° (Figure 4C, Movie S4). The mobility of the ATPase and ARP modules relative to the core module likely facilitates nucleosome engagement. The ATPase module in the map of the BAF complex alone is positioned in the space that is occupied by the nucleosome in the map of the BAF–NCP complex. However, the amplitudes of the observed swivel and swing-out motions are sufficient to provide the rotation of ~30° that is required to rotate the ATPase module into the orientation seen in the BAF–NCP complex. The ATPase module not only has to rotate, but also to separate from the core module to provide sufficient space for the NCP. Such an increased separation between the ATPase and core modules was not captured by the multi-body refinement, suggesting that it is either a rare event for the BAF complex alone or that the wider separation is induced only upon the initial nucleosome-binding event.
For the BAF–NCP complex, we defined the nucleosome as one body, the ATPase and ARP modules together as a second body, and the core module as a third body. Surprisingly, multi-body refinement also showed substantial motions in the BAF–NCP complex: a rotation of the nucleosome by ~35° about the contact points with the BAF complex and a ~45° tilting movement of the ATPase and ARP modules relative to the nucleosome and core module (Figure 4D, Movie S5), further confirmed by CX-MS data indicating that the ATPase module subunits bind various NCP core or tail interfaces, a significant number of which are mutated in cancer (Figure 4E,F). Based on the observed dynamics, we propose a mechanism of nucleosome engagement and chromatin remodeling driven by the structural dynamics of the BAF complex we observed (Figure 4G, model).
Bilateral acidic patch interactions and their role in BAF complex-mediated chromatin remodeling
The human BAF complex forms a bilateral H2A/H2B nucleosome acidic patch ‘clamp’ (Figure 5A). The cryo-EM map showed additional helical density that connects to the acidic patch on the bottom face of the nucleosome, which was identified as the C-terminal α-helix of SMARCB1 (Figure 5A). Notably, this is consistent with recent results reporting that the C-terminal α-helical domain (aa 351-385) of SMARCB1 in isolation interacts with the nucleosome acidic patch (Valencia et al., 2019) and recent structures of yRSC (Wagner et al., 2020; Ye et al., 2019), ySWI/SNF and recombinant human BAF complexes (Han et al., 2020; He et al., 2020). We identified mutations across a range of human cancer types along the SMARCB1 α-helix, with R377H/C/L, R366C/P, R374W/Q and R370M/S/T representing the most recurrent mutations (Figure 5B). These data were further substantiated by CX-MS data revealing the highest frequencies of SMARCB1 missense mutations clustering within its NCP-binding region (Figure 5B, right). Further, mutations causative of the intellectual disability disorder Coffin-Siris syndrome (CSS) (Tsurusaki et al., 2012) cluster in this region and have been shown to result in attenuation of ATP-dependent BAF remodeling activity in vitro and DNA accessibility in cells (Valencia et al., 2019).
Figure 5. Bilateral engagement of the NCP acidic patches by SMARCA4 and SMARCB1 is required for BAF-mediated chromatin remodeling.

A. The H2A/H2B nucleosome acidic patch regions are bound by the SMARCB1 C-terminal α-helix (aa 351-385) on one NCP face and the SMARCA4 SnAc/post-SnAC domain (aa 1307-1418) on the other. BAF subunits are shown as colored ribbons, NCP histones as electrostatic surface and NCP DNA as orange ladder.
B. (Left) Cancer-associated mutations (COSMIC database) mapped onto the model of the SMARCB1–NCP interface. Number of mutations shown in parentheses, bold= driver mutation (Bailey et al. 2018). (Right) Scatter plot reflecting the number of SMARCB1–NCP cross-links versus the number of SMARCB1 mutations . Selected points are labeled with subunit and/or NCP region cross-linked.
C. (Left and middle) Two views showing the mapping of cancer-associated mutations (COSMIC database) onto the model of the SMARCA4 (SnAC/post-SnAC)–NCP interface. Bold= driver mutation. (Right) Scatter plot reflecting the number of SMARCA4–NCP cross-links versus the number of SMARCA4 mutations. Selected points are labeled with subunit and/or NCP region cross-linked.
D. Immunoblot showing the expression of WT SMARCA4 and acidic patch-binding region mutant variants in SMARCA4/2-deficient HEK-293T cells. HA-SMARCA4 variants visualized by HA immunoblot; SMARCC1 shown for loading control.
E. REAA for BAF-mediated chromatin remodeling performed on HA-purified complexes isolated from SMARCA4/2 double KO HEK-293T cells that were infected with empty vector or SMARCA4 variants. 0.3 mM ATP, 0.01 U/μL DpnII enzyme, 30°C, 90 minutes. DNA bands were visualized on TapeStation platform.
F. Quantification of REAA shown in panel E. Average of n=3 independent experiments, with error bars representing S.D. **= p-value <0.01; ***= p-value <0.001
G-I. REAA performed on BaF complexes isolated from HEK-293T SMARCB1-KO cells, captured by either HA-WT SMARCA4, HA-SMARCA4 del1405-1415, or HA-WT SMARCA4 with rescued V5-SMARCB1. G, Immunoblot showing the variant expression. H, REAA DNA fragment analysis (TapeStation). I, Quantification of REAA results from n=3 independent experiments, with error bars representing S.D.
Importantly, on the opposing, ‘top’ face of the nucleosome, the map showed additional density not seen in the maps of the yeast SWI/SNF and recombinant human BAF complexes (Figures 1A, 3C), which we identified in our model as the SnAc/post-SnAc domain (aa 1307-1418) of the SMARCA4/2 ATPase (Figure S6H). Importantly, this region was found to be recurrently mutated in human cancer (Figure 5C). We therefore sought to functionally characterize the interface between SMARCA4 and the acidic patch with respect to its role in chromatin-remodeling activity. We expressed either empty vector control, or HA-tagged wild-type (WT) SMARCA4, post-SnAc-mutant, or T910M ATPase-compromised SMARCA4 variants (Pan et al., 2019) (Figure 5D-F). We performed HA immunoprecipitations (IPs) to capture complexes containing either WT or mutant SMARCA4, incubated these with mononucleosomes, and subsequently performed chromatin-remodeling assays (REAA) to define any changes in BAF-mediated chromatin-remodeling activity (Figure 5E,F). Intriguingly, both deletion of an 11-aa region within the SMARCA4 post-SnAc domain or a single-residue point mutation (R1411Q) reduced the chromatin-remodeling activity compared to complexes containing WT SMARCA4. The T910M ATPase-deficient mutant almost entirely eliminated the remodeling activity, consistent with prior studies that indicated its compromised remodeling capacity genome-wide in cells (Pan et al., 2019) (Figure 5E,F). We further confirmed the role for the SMARCA4 SnAc/post-SnAc domain in the setting of SMARCB1 deletion, revealing that mutations in this region of SMARCA4 further exacerbated the inhibition of residual chromatin-remodeling activities mediated by the SMARCA4 ATPase that are caused by SMARCB1 perturbation (Figure 5G-I). These data demonstrate the functional importance of the bilateral nucleosome-interaction surfaces for the BAF complex to attain its maximum chromatin-remodeling activity.
Structural localization and effect of SMARCA4 missense mutations
Given that the SMARCA4 ATPase is the most extensively interfaced subunit and that it contains the most single-residue (missense) mutations in cancer (Kadoch and Crabtree, 2015; St Pierre and Kadoch, 2017), we mapped the full set of SMARCA4/SMARCA2 human cancer (COSMIC database) mutation frequencies onto the SMARCA4 ATPase structure (Figure 6A). We found that several recurrent hot-spot mutations localize directly to interactions between the HSA domain and the Arm-repeat region (CBR) of the ARID1A/B subunits (Figure 6B). Reciprocally, mapping of missense mutations (single-residue changes) on ARID1A indicated several additional hot spots at sites of SMARCA4 HSA interaction (Figure 6B), indicating that this region is a major hub for structural compromise in cancer and in agreement with the dynamic interactions observed between the ATPase and core modules (Figure 4). We find that SMARCA4 mutations are clustered in four key regions: the catalytic helicase domains, the HSA domain (near the ARP module-interaction surfaces), the core-insertion site, and the pre-HSA/anchor regions. Notably, we found that recurrent and previously uncharacterized mutational hot spots occur at key residues within protein ‘turn’ regions within the SMARCA4 subunit, such as R441W/Q (interface with ARID1A), R451H (bottom of the HSA domain) and R408W/Q (pre-HSA anchor region) (Figure 6A,C). Notably, we found that both SMARCA4 R408W and R441W ‘hinge’ mutations reduced BAF-mediated chromatin-remodeling activity on mononucleosome substrates, suggesting that the coordination of the ATPase subunit positioning and its dynamic movement within the core module is required for the BAF complex to reach its maximum chromatin-remodeling activity (Figure 6D-F).
Figure 6. SMARCA4 hotspot mutations in the BAF core module attenuate the chromatin-remodeling activity.

A. Frequency of missense mutations across full-length SMARCA4. Putative driver missense mutations are in bold (Bailey et al., 2018). Red circles highlight mutations that were evaluated in functional assays.
B. The interface between the SMARCA4 HSA domain and the Arm (core-binding) region of ARID1A, with the mutation frequencies in SMARCA4 and ARID1A in red and blue tones, respectively. Number of mutations are indicated in parentheses.
C. Mutations in the post-HSA and anchor regions of SMARCA4 that were selected for functional studies.
D-F. Chromatin-remodeling activity of WT SMARCA4 and post-HSA/anchor region mutant variants. D, Imunoblot confirming expression of HA-tagged variants. E, Chromatin-remodeling assays (REAA) performed with endogenous complexes; TapeStation was used for fragment analysis. F, Quantification of REAA assays performed in E. Average of n=3 experimental replicates; S.D. is shown. ***= p-value <0.001.
Comprehensive mapping of cancer-associated mutations onto the model of the endogenous cBAF complex informs mechanisms of its misfunction in cancer
We next used the BAF–NCP complex model to comprehensively define the structural regions and interfaces that are affected by recurrent, single-residue human cancer mutations, including TCGA driver mutations (Bailey et al., 2018) (Figures 7A, S7A). We identified mutations in the SMARCA4/2 ATPase subunits outside of the helicase regions, namely the R1232S/C/D/V and R973Q/W/L mutations, as well as a number of mutations within the large core module, both at subunit interfaces and exposed surfaces. For example, we found mutations mapping to the helical regions of SMARCD1 (Q457H/C and A490V/T/E) and SMARCC2 (I901M) as well as other regions within ARID1A (i.e., G2087R/E within the ARM-repeat region that tethers multiple subunits within the core). Owing to incomplete conservation between human BAF and the yeast RSC and SWI/SNF complexes as well as regions/domains excluded from these models, the endogenous BAF complex structure allowed mapping of the highest percentage of cancer-associated missense, frameshift, and nonsense mutations (Figure 7B). A large percentage of mutations agreed with respect to positioning in the models of the endogenous and recombinant complexes (Figure S7B,C). CX-MS data for the endogenous BAF–NCP complex further identified subunit–subunit and subunit–nucleosome interactions that were recurrently mutated in cancer, including those involving mammalian-specific subunits and subunit domains such as BCL7A, the N-terminus of ARID1A, and others (Figure 7C).
Figure 7. Model of the endogenous human BAF–NCP complex enables comprehensive dissection of disease-associated mutations.

A. Pan-subunit human BAF complex missense mutational hotspots. Red-gray heatmap indicates the number of missense mutations according to legend. Bold= driver mutations.
B. (Left) % of human BAF somatic cancer mutations (COSMIC database) mappable in various models. (Right) Fraction of missense driver mutations (Bailey et al., 2018) of the total number of missense driver mutations in ARID1A, SMARCA4, and SMARCB1 that occur in regions included in the models of the endogenous and recombinant BAF complex.
C. Scatter plot reflecting the number of cross-links (by BAF-NCP CX-MS) versus the number of mutations (COSMIC database). Subunit–subunit (red) and subunit–NCP (blue) interactions are indicated. Subunit regions described in Figure S3E, Table S2.
D. Bar graphs showing somatic missense mutations that localize to subunit–subunit and module–module interfaces defined by CX-MS. Mutations within five residues of cross-links (window size = 11 aa) that represent an interface between BAF subunits or modules were summed and plotted.
E. Mutations localizing to subunit–NCP interfaces defined by CX-MS (window size= 11 aa).
F. Missense mutations (within 5 residues of CX site) in human cancer that localize to core subunit–subunit, subunit–NCP core and subunit–NCP tail interfaces, or that are predicted to affect catalytic and non-catalytic ATPase/ARP module subunit–subunit interfaces. See also Figure S7.
We also classified all mutations in terms of their localization to subunit–subunit interactions (within a given BAF module), module–module interactions, or subunit–NCP interfaces (broken down by subunit–histone folds or subunit–histone tails) (Figure 7D,E). 70% of missense mutations occurred at structurally important subunit–subunit interfaces within the core module, 19% in total were predicted to disrupt subunit–NCP interfaces, and 11% were predicted to affect the catalytic activity (ATPase helicase and ARP modules) of the complex (Figure 7F). These categories collectively represent 27% of all human cancer-associated mutations in mSWI/SNF genes defined to date (COSMIC database), suggesting the existence of additional mechanisms leading to BAF complex perturbation that remain to be characterized, such as those affecting solvent-exposed surfaces of the BAF complex, disordered or structurally unresolved regions, reader domains, subunit stability and degradation, or the interactions of BAF complexes with other factors (Figure S7D).
Discussion
In this study, we have generated the first structural models of the endogenous human canonical BAF complex and used these to inform the impact of disease-associated mutations. Importantly, because we did not use recombinantly produced material but instead endogenous BAF complexes purified from human cells, the resulting cryo-EM maps, subunit–subunit and subunit–NCP cross-links identified by CX-MS, and the deduced structural model represent those of the fully-assembled, canonical BAF complex. Although the extensive compositional heterogeneity, flexibility, and dynamics inherent to endogenous BAF complexes limited the resolution of the final cryo-EM composite map, we were able to use it in conjunction with CX-MS and advanced modeling techniques to generate a model, allowing for the localization of additional human-specific subunits and subunit domains to unassigned densities and resulting in the most complete picture of the human BAF complex achieved to date.
Extensive further work will be needed to reveal the interactions between BAF complexes and nucleosomes containing single and combinatorial histone post-translational modifications as well as distinct histone core variants. For example, the resolution for the SMARCA4 bromodomain and the tandem PHD domains that require acetylatyed/crotonylated histone H3 tails for binding (Xiong et al., 2016; Zeng et al., 2010) was limited. Indeed, incubation of BAF complexes with differentially modified nucleosomes could change their binding orientations, stability, and their activities, and will likely allow for the determination of higher-resolution and/or more complete structures. Other areas of the complex that were not resolved in our model include DNA-binding domains such as the SMARCE1 HMG, the ARID1A/B ARID, and the SMARCB1 WH domains, mutations in which have been implicated in human neurodevelopmental diseases (Tsurusaki et al., 2012; Tsurusaki et al., 2014; Wieczorek et al., 2013). Such domains could potentially be visualized by using longer extra-nucleosomal DNA to stabilize them, especially considering that these subunits, based on this model and others, do not interact with nucleosomal DNA. In addition, beyond inhibition of nucleosome remodeling, we anticipate a range of mechanisms for human disease-associated missense mutations, such as changes in protein stability, gain-of-function enzymatic activities, altered interactions with transcription factors, and others.
In addition to inherent heterogeneity, another major challenge in structurally characterizing endogenous human BAF complexes is their higher content of IDP regions compared to their yeast or recombinant counterparts (Figure S7D). Indeed, several endogenous human-specific components, such as SS18, BCL7A, and the entire N-terminus of ARID1A, contain low-complexity sequences, which may contribute to activities beyond canonical chromatin remodeling.
Taken together, we hope that this model of the endogenous human BAF complex will serve as a powerful initial foundation that will assist investigators in defining the consequences of disease-specific perturbations, functionally grouping mutations, linking these to gene expression and physiologic outcomes, and identifying therapeutic opportunities.
STAR Methods Text
RESOURCE AVAILABILITY
Lead Contact
Further information and requests for resources and reagents should be directed to and will be fulfilled by the Lead Contact, Cigall Kadoch (Cigall_kadoch@dfci.harvard.edu).
Materials Availability
This study did not generate new unique reagents.
Data and Code Availability
The cryo-EM density maps have been deposited in the Electron Microscopy Data Bank (EMDB) under accession numbers: EMD-22476 (Cryo-EM map of human BAF (base module)), EMD-22477 (Cryo-EM map of human BAF-NCP (nucleosome)), EMD-22478 (Cryo-EM map of human BAF-NCP (nucleosome/ATPase/ARP)), EMD-22479 (Cryo-EM map of human BAF-NCP (nucleosome/arm)). The cross-linking mass-spectrometry (CX-MS) data are deposited in the PRIDE database (https://www.ebi.ac.uk/pride/) under accession number: PXD020992. The model coordinates of the full human cBAF complex bound to the nucleosome have been deposited in the Protein DataBank (Dev) under accession code PDBDEV_00000056.
EXPERIMENTAL MODEL AND SUBJECT DETAILS
Mammalian cell lines and culture conditions
HEK-293T and HEK-293T LentiX cells were cultured in standard DMEM medium (Gibco), supplemented with 10% fetal bovine serum (FBS) (Omega), 1X GlutaMAX (Gibco), 100 U/mL penicillin-streptomycin (Gibco), 1 mM sodium pyruvate (Gibco), and maintained in a humidified incubator at 37°C with 5% CO2. HEK-293F cells were cultured in 3- to 15-liter spinner flasks (Corning) in SFM II medium (Gibco) supplemented with GlutaMAX (Gibco) and Poloxamer (Sigma).
Bacterial strains used for protein production
Escherichia coli BL21 Rosetta2 cells (Novagen) were used for the expression of the NCP octamer proteins (in inclusion bodies). Growth and protein expression conditions are outlined in Method Details.
METHOD DETAILS
Human canonical BAF complex purification
Human BAF complexes were purified as described before (Mashtalir et al., 2018), with several modifications. Briefly, a HEK-293F cell line stably expressing HA-tagged DPF2 was cultured in spinner flasks in SFM II medium supplemented with GlutaMAX and Poloxamer. Cells were centrifuged for 5 minutes at 4°C at 4000g. Pellets were washed in cold phosphate-buffered saline (PBS) (Gibco). Cell suspension was then centrifuged for 5 minutes at 4°C at 4000g. Cell pellets were resuspended in HB (10 mM Tris-HCl, pH 7.5, 10 mM KCl, 1.5 mM MgCl2, 1 mM DTT, 1 mM PMSF) and homogenized in Dounce homogenizers. The suspension was pelleted for 30 minutes at 4°C at 4000g and nuclear pellets were resuspended in pre- extraction buffer (50 mM Tris-HCl, pH 7.5, 100 mM KCl, 1 mM MgCl2, 1 mM EDTA, 1 mM, 0.1% (v/v) NP40, 1 mM DTT, 1 mM PMSF and protease inhibitor cocktail. After pelleting for 10 minutes at 4°C at 4000g, chromatin was resuspended in high-salt buffer (HSB; 50 mM Tris-HCl, pH 7.5, 300 mM KCl, 1 mM MgCl2, 1 mM EDTA, 1 mM, 1% NP40, 1 mM DTT, 1 mM PMSF and protease inhibitor cocktail) and incubated with rotation for one hour at 4°C. Homogenates were centrifuged at 20,000 rpm in a SW32Ti rotor (Beckman Coulter) for 1 hour at 4°C and the supernatant collected. Nuclear extracts were filtered with a 0.45-μm filter and rotated overnight at 4°C with HA magnetic resin (Thermo Fisher Scientific). The beads were washed in HSB and proteins were eluted by incubating the beads 4 times for 1.5 hours with 1 mg/mL of HA peptide in HSB.
Colloidal blue staining
Samples of purified canonical BAF complexes were run on a 4-12% Bis-Tris SDS-PAGE gel, stained using the Colloidal blue kit (Invitrogen) and imaged using an LI-COR Odyssey Imaging System (LI-COR Biosciences)
Histone purification and octamer formation
For cryo-EM and cross-linking mass spectrometry studies, human histones were purified as described (An and Roeder, 2004). Briefly, individual histones were expressed as inclusion bodies in E. coli BL21 Rosetta2 cells (Novagen) and successively purified over Sephacryl S-200 (GE Healthcare) and SP-Sepharose (GE Healthcare) columns. Individual histones were then reconstituted into an octamer that was further purified and separated through a final gel filtration step at high salt. When required, prepared histones were stored at −80°C in 2 M NaCl, 30% glycerol, TE buffer (20 mM Tris, 0.25 mM EDTA, pH 8.0) at a minimal concentration of 1 mg/mL. Histone concentrations were determined by Coomassie blue staining with BSA standards. Histone octamers were then formed and purified as described (Ruthenburg et al., 2011). Briefly, individual lyophilized histones were dissolved in a denaturing buffer (50 mM Tris-HCl, pH 8.0, 6.3 M guanidine, 1 mM EDTA, 5 mM 2-mercaptoethanol) and mixed in stoichiometric amounts. After incubation for 30 minutes at 4°C to ensure complete denaturation, the mixture was dialyzed against three changes of refolding buffer (20 mM Tris-HCl, pH 8.0, 2 M NaCl, 1 mM EDTA, 5% (v/v) glycerol, 5 mM 2-mercaptoethanol), and octamers were purified over a Superdex 200 column (GE Healthcare) pre-equilibrated with the refolding buffer.
Mononucleosome assembly
Mononucleosome assembly was carried out according to established methods (Luger et al., 1999). To amplify the 601 template with 25-bp linker DNA (for 25-bp overhangs on each side with nucleosome centered), PCR was performed using the tandem 601 template described in (Shimada et al., 2019) and the following primer set: Forward: GGGATGGACCCTATACGCGGCC; Reverse: GAGAGGTCGCTGTTCAATACATGC. After the initial PCR reaction, the fragment containing a single 601 sequence was purified from an agarose gel, and PCR was repeated with this fragment as template. Mononucleosomes were assembled by salt dilution (Cirillo et al., 2002). 1 μM 601 template was mixed with an equimolar amount of histone octamers in assembly buffer (10 mM Tris-HCl, pH 8.0, 1 mM EDTA, 0.01% NP-40, 1 mM DTT) containing 2 M NaCl, at a final volume of 10 μL. The NaCl concentration was sequentially diluted by adding at 15-minute intervals 3.3 μL, 6.7 μL, 5 μL, 3.6 μL, 4.7 μL, 6.7 μL, 10 μL, 30 μL, and 20 μL of the assembly buffer containing no NaCl, while the reaction mixture was incubated at 30°C. Nucleosome assembly was confirmed by running the sample on a 4.5% native acrylamide gel and staining with SYBR Gold stain (Invitrogen). After confirming nucleosome assembly, the reaction mixture was further dialyzed overnight against binding buffer (20 mM HEPES, pH 7.5, 100 mM KCl, 1 mM MgCl2, 1 mM DTT) and heated at 37°C for 30 minutes before forming a complex with BAF.
Histone sequences used:
H2A
MSGRGKQGGKARAKAKTRSSRAGLQFPVGRVHRLLRKGNYAERVGAGAPVYLAAVLEYLTAEILELAGNAARDNKKTRIIPRHLQLAIRNDEELNKLLGKVTIAQGGVLPNIQAVLLPKKTESHHKAKGK
H2B
MPEPAKSAPAPKKGSKKAVTKAQKKDGKKRKRSRKESYSVYVYKVLKQVHPDTGISSKAMGIMNSFVNDIFERIAGEASRLAHYNKRSTITSREIQTAVRLLLPGELAKHAVSEGTKAVTKYTSSK
H3
MARTKQTARKSTGGKAPRKQLATKAARKSAPATGGVKKPHRYRPGTVALREIRRYQKSTELLIRKLPFQRLVREIAQDFKTDLRFQSSAVMALQEACEAYLVGLFEDTNLCAIHAKRVTIMPKDIQLARRIRGERA
H4
MSGRGKGGKGLGKGGAKRHRKVLRDNIQGITKPAIRRLARRGGVKRISGLIYEETRGVLKVFLENVIRDAVTYTEHAKRKTVTAMDVVYALKRQGRTLYGFGG
601 Widom DNA sequence (146+25+25=196bp)
GGGATGGACCCTATACGCGGCCGCCCTGGAGAATCCCGGTCCGAGGCCGCTCAATTGGTCGTAGCAAGCTGTAGCACCGCTTAAACGCACGTACGCGCTGTCCCCCGCGTTTTAACCGCCAAGGGGATTACTCCCTAGTCTCCAGGCACGTGTCAGATATATACATCCTGTGCATGTATTGAACAGCGACCTTCTC
Chromatin-remodeling and ATPase assays
SMARCA4 (BRG1) levels of the HA-purified BAF complex purifications were normalized via BCA protein quantification and immunoblotting analyses. Purified canonical BAF complexes were diluted for final reaction concentration of 10 ng/μL in REAA buffer (20 mM HEPES, pH 8.0, 50 mM KCl, 5 mM MgCl2) containing 0.1 mg/mL BSA, 1 μM DTT, 20 nM nucleosomes (EpiDyne Nucleosome Remodeling Assay Substrate ST601-GATC1, EpiCypher). The REAA mixture was incubated at 30 or 37°C for 10 minutes, and the reaction was initiated by addition of 1-2 mM ATP (Ultrapure ATP, Promega) and 0.005 U/μL DpnII Restriction Enzyme (New England Biolabs). The REAA reaction mixture was quenched with 20-24 mM EDTA and placed on ice. Proteinase K (Ambion) was added at (100 μg/mL) for 30-60 minutes, followed by either AMPure bead DNA purification and D1000 HS DNA ScreenTape Analysis (Agilent)
Vectors used
Constitutive expression of N-terminally HA-tagged DPF2 (used for cBAF purification) as well as N-terminally V5-tagged full-length WT or mutant SMARCB1 (BAF47) or N-terminally HA-tagged SMARCA4 (BRG1) were used for expression in either HEK-293T or HEK-293TSMARCB1Δ/Δ cells, achieved using lentiviral infection of an EF1α-driven expression vector (modified pTight vector from Clontech, dual promoter EF-1a-MCS-PGK-Puro or EF-1a-MCS-PGK-Blast), selected with puromycin (2 μg/μL, Sigma-Aldrich) or blasticidin (10 μg/mL, Thermo Fisher).
Lentivirus generation
Lentiviral particles were prepared using LentiX HEK-293T packaging cells (Clontech) via polyethylenimine (PEI, Sigma)-mediated transfection of gene delivery vector co-transfected with packaging vectors pspax2 and pMD2.G as previously described (Forbes et al. 2011). Supernatants were harvested 72 hours after transfection and centrifuged at 20,000 rpm using an SW32Ti rotor for 2.5 hours at 4°C. Virus-containing pellets were resuspended in PBS, pH 7.4 (Gibco), and placed on cells dropwise.
Infection and selection
HEK-293T cells were lentivirally infected with either empty vector, or HA-DPF2, or V5-SMARCB1 constructs or HA-SMARCA4 constructs for 48 hours and then selected with puromycin (2 μg/μL) or blasticidin (10 μg/mL), split at 72 hours and continued with selection for 5 days. Cells were harvested for experiments 7 days post-infection or scaled and expanded for cBAF complex purification.
Cryo-EM sample preparation and data collection
For the BAF complex alone, the complex eluted from the anti-HA beads was loaded on top of a 11-mL linear 10-30% (v/v) glycerol and 0-0.08% (v/v) glutaraldehyde GraFix gradient in 25 mM HEPES, pH 7.9, 100 mM KCl, 0.1 mM EDTA, 12.5 mM MgCl2, 1 mM DTT in accordance with the modified GraFix protocol (Stark, 2010). Centrifugation was carried out at 40,000 rpm in an SW41 rotor for 16 hours at 4°C. 550-μL fractions were manually collected from the top of the gradient and quenched with Tris-HCl, pH 7.5 at a final concentration of 50 mM. Fractions containing BAF complex were concentrated and diluted three times in an Amicon Ultra concentrator (Millipore; 50-kDa cut-off) with glycerol- and glutaraldehyde-free buffer (50 mM Tris-HCl, pH 7.5, 100 mM KCl, 1 mM MgCl2, 1 mM EDTA, 1 mM DTT). The concentrated samples were used for cryo-EM specimen preparation.
For the BAF–NCP complex, the complex eluted from the anti-HA beads was dialyzed overnight against binding buffer (20 mM HEPES, pH 7.5, 100 mM KCl, 1 mM MgCl2, 1 mM DTT) and mixed with a 5-fold molar excess of the mononucleosome substrate. The mixture was supplemented with 1 mM AMP-PNP (Sigma), incubated for 2 hours at 4°C and then loaded on top of a 11-mL linear 10-40% sucrose and 0-0.08% glutaraldehyde gradient in 20 mM HEPES, pH 7.5, 100 mM KCl, 1 mM MgCl2, 0.1 mM EDTA, 1 mM DTT, 50 μM AMP-PNP. Centrifugation was carried out at 37,000 rpm in an SW41 rotor for 14 hours at 4°C. 550-μL fractions were manually collected from the top of the gradient and quenched with Tris-HCl, pH 7.5 at a final concentration of 50 mM. Fractions containing BAF–NCP complex were concentrated in an Amicon Ultra concentrator (50-kDa cutoff; Millipore) and then subjected to a Zeba Spin Desalting Column (Thermo Fisher Scientific) equilibrated with 20 mM HEPES, pH 7.5, 100 mM KCl, 1 mM MgCl2, 1 mM DTT, 50 μM AMP-PNP. AMP-PNP at a final concentration of 1 mM was added to the eluted sample before preparing cryo-EM specimens.
To prepare cryo-EM grids, 4 μL of the samples were applied to Quantifoil R 1.2/1.3 mesh Cu holey carbon grids (Quantifoil) covered with a homemade thin carbon film, and then blotted for 1-1.5 s and plunge-frozen in liquid ethane using a Vitrobot Mark IV (Thermo Fisher Scientific) operated at 4°C and 100% humidity.
Cryo-EM data were collected on 200-kV Talos Acrtica electron microscopes (Thermo Fisher Scientific) in the Cryo-EM Resource Center at The Rockefeller University (RU) or at the Cryo-Electron Microscopy Laboratory at New York University (NYU) Langone Health, both equipped with a K2 Summit direct detector, in super-resolution counting mode using the SerialEM software (Mastronarde, 2005). After binning over 2x2 pixels, the calibrated pixel sizes were 1.5 (RU) and 1.45 Å (NYU) on the specimen level. Exposures of 15 s were dose-fractionated into 50 frames with a dose rate of 10 electrons pixel−1 s−1. Defocus values ranging from −1.0 to −3.5 μm were used. Cryo-EM data collection statistics are summarized in Table S1.
Cryo-EM data processing
Image processing was performed in RELION-2.1 and −3.0 (Kimanius et al., 2016; Nakane et al., 2018; Zivanov et al., 2018; Zivanov et al., 2019). All movie frames were corrected with a gain reference collected during the same EM session, and specimen movement was corrected using MotionCor2 with dose weighting and 2x2 binning (Zheng et al., 2017). The contrast transfer function (CTF) parameters were estimated from the movie frames using CTFFIND-4.1.5 (Rohou and Grigorieff, 2015). Images showing substantial ice contamination, abnormal background, thick ice, low contrast or poor Thon rings were discarded.
For the BAF complex alone, 4,866 images were selected from 6 datasets for further processing. Particles were automatically selected from the aligned and dose-weighted images using Gautomatch (https://www.mrc-lmb.cam.ac.uk/kzhang/Gautomatch/) and windowed into 260x260-pixel images. The particles of each dataset were separately subjected to two rounds of 2D classification, and classes that produced poor averages were discarded. From the first dataset, ~25,000 particles were selected from good 2D classes and used to generate an initial density map in cryoSPARC (Structura Biotechnology) (Punjani et al., 2017). The particles after 2D clean-up from all six datasets were combined, and the selected 596,957 particles were subjected to 3D classification into four classes. Two of the resulting classes were combined and subjected to a second round of 3D classification into four classes using the local search option with a mask for the lower lobe. The resulting class showing the clearest features was used for focused 3D refinement using the same mask, yielding the final density map for the lower lobe at a resolution of 7.8 Å (FSC = 0.143, Figure S1H).
For the BAF–NCP complex, 9,928 micrographs were selected from 10 datasets of complexes formed with nucleosomes containing non-modified histone cores (BAF–Nuc), and 4,913 micrographs were selected from 5 datasets of complexes formed with nucleosomes containing H3K14-acetylated histones (BAF–H3K14AcNuc). Particles were automatically picked from the aligned and dose-weighted micrographs using Gautomatch. The particle coordinates were used to extract particles into 290x290-pixel images (RU) or 300x300-pixel images (NYU). The images were rescaled into 256x256-pixel images, resulting in a pixel size of 1.7 Å. The particles of each dataset were separately subjected to two rounds of 2D classification, and classes that produced poor averages were discarded. From a pilot dataset of BAF in complex with unmodified nucleosome, ~36,000 particles were selected after 2D clean-up and used to generate three ab-initio maps in cryoSPARC. One of the maps showed no density for a bound nucleosome, whereas another one showed clear density for a bound nucleosome. These two maps were used as initial reference maps for supervised 3D classification of the particles after 2D clean-up. The particles assigned to the map of the nucleosome-bound BAF complex were subjected to another round of 2D classification to identify and discard classes that produced poor averages. The remaining 603,173 and 274,804 particles from the datasets of the BAF–Nuc and BAF–H3K14AcNuc complexes, respectively, were combined and subjected to an initial 3D refinement with global alignment. The refined map was used to generate masks for the nucleosome, the nucleosome plus the ATPase-ARP module, and the nucleosome plus the 'arm' module. These masks were used to subject the particles to focused 3D classification into 6 classes, using the local search option. In all cases, the classes containing the most particles showed the best-resolved features of the bound nucleosome, containing 267,544, 185,959 and 281,723 particles, respectively. Independent refinement of the best classes for the nucleosome, the nucleosome plus the ATPase-ARP module, and the nucleosome plus the 'arm' module yielded maps at resolutions of 5.6, 6.2 and 5.9 Å, respectively (FSC = 0.143, Figure S2G)
For multi-body refinement in RELION-3.0 (Nakane et al., 2018), the refined particles (89,104 particles) from the last focused refinement of the BAF complex alone were subjected to global 3D refinement without mask (consensus refinement), and then the refined map was used to create maps for three bodies: lower lobe (body 1), ARP module (body 2) and ATPase module (body 3). Multi-body refinement was continued from the last iteration of the consensus refinement, with a sigma angle of 10 and a sigma offset of 2. Principal component analysis for all the particles was performed using relion_flex_analyse implemented in RELION-3.0 (Nakane et al., 2018). Principal components 1 and 2 accounted for ~25% of the variance in the rotations and translations.
Cross-linking mass spectrometry of endogenous human BAF–NCP complexes
Eluted BAF complex was dialyzed overnight against 25 mM HEPES, pH 7.5, 100 mM KCl, 1 mM MgCl2, 0.1 mM EDTA, 5% sucrose, 1 mM DTT and mixed with a 3-fold molar excess of mononucleosomes. The mixture was incubated with 1 mM AMP-PNP (Sigma) for 2 hours at 4°C. Sample was cross-linked with 3 mM BS3 for 3 hours and loaded on top of a 11-mL linear 10-40% sucrose gradient in 20 mM HEPES, pH 7.5, 100 mM KCl, 1 mM MgCl2, 0.1 mM EDTA, 1 mM DTT. Centrifugation was carried out at 37,000 rpm in a SW41 rotor for 16 hours at 4°C. 550-μL fractions were manually collected from the top of the gradient and quenched with Tris-HCl, pH 7.5 at a final concentration of 50 mM. Fractions containing BAF–NCP complex were concentrated in an Amicon Ultra concentrator (30-kDa cutoff; Millipore).
Sample was prepared according to a previously described preparation protocol using SP3 beads (Hughes et al., 2014): 10 μL of SP3 beads (10 μg/μL) and an equal volume of acetonitrile was added to the cross-linked sample and incubated at 60°C for 30 minutes with shaking. Due to the high concentration of sucrose, the solution separated into two phases. The beads were concentrated with a magnet and washed with 100% acetonitrile. The beads were then resuspended in 100 μL 8 M urea in 1 M ammonium bicarbonate and treated with TCEP/CAA for 1 hour at 37°C in the dark. The bead supernatant was evaporated and the dried proteins were resuspended in 8 M urea in 1 M ammonium bicarbonate and treated with TCEP/CAA for 1 hour at 37°C in the dark. Both samples were diluted 10 times with water and digested by addition of trypsin (protein:trypsin ratio of 20:1,) overnight at 37°C.
The digested peptides were desalted by passage over C18 cartridges (The Nest Group, Southborough, MA), and dried by speed-vac. The peptides from both digests were resuspended in 50 μL Buffer A (25 mM ammonium formate, pH 2.8, 20% (v/v) acetonitrile, 0.1% (v/v) formic acid) and combined. 1 μg of sample was reserved for MS analysis and the remaining sample was fractionated using an in-house prepared microcapillary strong cation-exchange column (200 mm X 20 cm; Proteomix SCX 3um, Sepax Technologies). We used a binary HPLC pump with split flow with microcapillary flowrate at 2-3 μL/minute. Peptides were loaded onto the microcapillary column equilibrated in Buffer A and washed with Buffer A. Bound peptides were eluted with 20 μL of Buffer A containing 30%, 50%, 70%, and 100% Buffer B (800 mM ammonium formate, pH 2.8, 20% acetonitrile), followed by a 50-μL elution with Buffer D (0.5 M ammonium acetate, 30% acetonitrile). All fractions were dried in a speed-vac, and resuspended in 0.1% trifluoroacetic acid (TFA), 2% acetonitrile.
Peptides were analyzed by electrospray ionization microcapillary reverse phase HPLC mass spectrometry on a Thermo Scientific Fusion instrument with HCD fragmentation and serial MS events that included one FTMS1 event at 30,000 resolution followed by FTMS2 events at 15,000 resolution. Other instrument settings included: MS1 scan range (m/z): 400-1500; cycle time 3 s; Charge states 4-10; Filters MIPS on, relax restriction = true; Dynamic exclusion enabled: repeat count 1, exclusion duration 30 s; Filter IntensityThreshold, signal intensity 50000; Isolation mode, quadrupole; Isolation window 2 Da; HCD normalized collision energy 28%, isolation width 2 Da; AGC target 500,000, Max injection time 200 ms. A 90-minute gradient from 5% ACN to 40% ACN was used.
Generation of a model for endogenous human BAF complex
Model building was carried out in two phases: First homology models were generated for individual domains, proteins, and subcomplexes, which were then assembled using density-guided docking. All modeled chains were first aligned with the corresponding chain in the yeast SWI/SNF complex using ‘hhalign’ from the HHsearch suite (Soding, 2005). HH-suite was also used for homology detection and annotation (Steinegger et al., 2019). Additionally, ‘hhpred’ was used to identify other detectable homologs (and to generate alignments for components that had no homolog in the structure of the yeast complex). RosettaCM was then used to perform homology modeling starting from all detected (up to 10) alignments for each domain (Song et al., 2013; Fleishman et al., 2011). Sequence insertions of 13 residues or longer were not modeled. Next, Rosetta ab initio folding was carried out on all other domains predicted to be globular (Ovchinnikov et al., 2018). This procedure yielded models for 8 domains predicted from homologs and for 2 domains with well-converged ab initio ensembles. For each domain (unless specified otherwise below), approximately 200 models were generated with RosettaCM, and 5,000 models were generated with Rosetta ab initio (Simons et al., 1999). Convergence of ab initio models were assessed by inspecting the top five models by energy, and divergent ensembles were not considered for the subsequent assembly phase.
Additionally, more specific modelling protocols were carried out for several components:
SMARCE – Since secondary structure prediction and manual inspection of cross-links suggested that a long region of SMARCE forms a single long helix, an ideal helical model was built parametrically using PyRosetta and docked manually into the density (using UCSF Chimera) (Chaudhury et al., 2010). 17 different sequence registrations were then sampled and refined with RosettaCM. Over 100 models were generated, and the best-scoring models all converged on a single sequence registration.
SMARCC1 – This subunit was built using a combination of Rosetta ab initio and RosettaCM. The N-terminus was built using the yeast homolog, while the C-terminus was built ab initio. The two models shared a helix, which allowed the models to be aligned to a common reference frame and to be refined together using RosettaCM.
SMARCB1 helix bound to NCP acidic patch – Using a novel NMR structure of the SMARCB1 helix, we docked the helix against the lower acidic patch of the NCP using Rosetta’s dock_pdb_into_density tool (Wang et al., 2015). Multiple docking solutions were subjected to RosettaCM, and a final converged model yielded a helix that fit the density well and also interfaced well with the acidic patch. This final helix was combined with the model of the SMARCB1 core, and the gaps in sequence were filled in with RosettaCM.
DPF2 NTD – trRosetta (Yang et al., 2020) was used to generate 150 models, of which the top 5 (scored by Rosetta energy) were selected. The first 50 residues of these models all converged very well, so that the first 50 residues of the top scoring model were used in subsequent steps. Using TMalign (Zhang and Skolnick, 2005) and the RSC structure (PDB: 6V8O) as template, we found significant structural similarity of these 50 residues to RSC7 (TM-score 0.55). By aligning the RSC SFH1 to SMARCB1 in Chimera, we were able to use the RSC7–SFH1 complex as a template to place our DPF2 residues into the cryo-EM map, which yielded a good fit to density. The first 13 residues of our DPF2 NTD did not fit the density and did not align well with the SFH1 template and were therefore removed, allowing the structure to be slightly better aligned with the template (TM-score 0.60).
To simplify model assembly, three sub-complexes were assembled separately: 1) the ATPase and the NCP, 2) the actin-like domains and the SMARCA4 helix, and 3) the lower lobe containing all remaining models.
ATPase + NCP.
Models of the ATPase were manually docked into the density in UCSF Chimera, using as a guide the structure of the Snf2–nucleosome complex (PDB: 5X0Y). However, the cryo-EM density suggested multiple differences from the template: in the context of the BAF complex, the ATPase appeared to adopt a more extended conformation, and there appeared to be additional density near the C-terminus of the ATPase domain that was not resolved in the crystal structure and extended to an acidic patch on the NCP. We therefore used RosettaCM iteratively to both refine the ATPase into the density and to build an additional 28 C-terminal residues. Five rounds of RosettaCM were run. Each round generated thirty models that served as input for the subsequent round, a strategy that has proven very powerful for structure refinement (Park et al., 2019). A fit-to-density energy term was included in RosettaCM modeling.
Actin-like domains + SMARCA4 helix.
Assembly of these domains was guided by the crystal structure of the Arp7–Arp9–Snf2(HSA)–RTT102 subcomplex (PDB: 4I6M). Homology models of ACTL6A, ACTB, and the SMARCA4 helix were aligned to the reference structure, refined in RosettaCM, and docked into the density using UCSF Chimera. Models in which the placement of the actin domains ACTL6A and ACTB were swapped were also built, and cross-linking constraints (between ACTL6A and ARID1A) were used to identify which placement was correct.
Lower lobe.
The domain placement into the cryo-EM map of the lower lobe was guided by the structure of the yeast SWI/SNF complex (PDB: 6UXW). To achieve a better match to the cryo-EM density, the yeast SWI/SNF complex structure of the lower lobe was partitioned into three subcomplexes: 1) ARID1A, 2) the N-termini of SMARCC1 + N-termini of SMARCC2 + SMARCB, and 3) C-termini of SMARCC1 + C-termini of SMARCC2 + SMARCC. Homology models of the human BAF subunits were aligned to the three subcomplexes and then individually docked into the cryo-EM map using UCSF Chimera. After refining the entire subcomplex with RosettaCM, SMARCE and the DPF2 NTD were added. For all domains except SMARCE, we again used Rosetta’s dock_pdb_into_density tool to find all possible placements of each model guided by the density and evaluated each placement against the cross-linking data.
A final refinement of the entire assembled complex was carried out with RosettaCM to improve inter-subunit geometry as well as improving the fit to density.
Nuclear extraction for co-immunoprecipitation
Nuclear extracts isolated from HEK-293T and HEK-293TSMARCB1Δ/Δ cells were prepared as described (Mashtalir et al. 2018). Specifically, cells were scraped from plates, washed with cold PBS, pelleted in a TX-200 rotor at 1,200 rpm for 5 minutes at 4°C, and resuspended in EB0 hypotonic buffer (50 mM Tris-HCl, pH 7.5, 0.1% NP-40, 1 mM EDTA, 1 mM MgCl2, supplemented with protease inhibitor (Roche) and 1 mM PMSF). Lysates were pelleted at 4,000g for 5 minutes at 4°C. Supernatants were discarded, and nuclei were resuspended in EB300 high-salt buffer (50 mM Tris-HCl, pH 7.5, 300 mM NaCl, 1% NP-40, 1 mM EDTA, 1 mM MgCl2, supplemented with protease inhibitor and 1 mM PMSF). Lysates were incubated on ice for 10 minutes with occasional vortexing. Lysates were then pelleted at 21,000g for 10 minutes at 4°C. Supernatants were collected, and protein concentrations were quantified using the bicinchonic acid (BCA) assay (Pierce). Finally, samples were supplemented with 1 mM DTT.
Restriction enzyme accessibility assay (REAA)
For immunoprecipitation, nuclear extracts and subsequent REAA assays, 700 μg of nuclear extract (at 1 μg/μL) were incubated with 2-5 μg of antibody overnight at 4°C. Dynabeads (Pierce Protein G Magnetic Beads, Thermo Fisher Scientific) were then added, rotated for 2 hours at 4°C, and washed 3-5 times with EB300. Complexes were used either still bound to the beads for REAA or eluted with sample buffer (2X NuPAGE LDS Buffer (Invitrogen) and 200 mM DTT) for SDS-PAGE analysis.
Western blotting
Western blot analysis was performed using standard procedures. For Western blots visualizing mSWI/SNF complex subunits, samples were separated using a 4-12% Bis-Tris PAGE gel (NuPAGE 4-12% Bis-Tris Protein Gel, Invitrogen), and transferred onto a PVDF membrane (Immobilon-FL, EMD Millipore). For Western blots visualizing histones, samples were separated using a 10-20% tricine gel (Novex 10-20% Tricine Protein Gel, Thermo Fisher Scientific), and transferred onto a PVDF membrane (Immobilon-PSQ, EMD Millipore). Membranes were blocked with 5% milk in PBS-Tween (PBST 0.1% Tween-20) and incubated with primary antibody for 3 hours at room temperature or overnight at 4°C. Membranes were washed 3 times with PBST and then incubated with near-infrared fluorophore-conjugated species-specific secondary antibodies (LI-COR) for 1 hour at room temperature. Membranes were washed 3 times with PBST, once with PBS, and then imaged using a Li-Cor Odyssey CLx imaging system (LI-COR).
QUANTIFICATION AND STATISTICAL ANALYSIS
Statistical analyses
Unless otherwise noted, all p values were determined using a two-tailed t test (Student’s t test).
Cryo-EM data processing and acquisition
Cryo-EM data collection and refinement statistics can be found in Table S1. Details on cryo-EM data analyses are provided in Method Details.
Cross-linked peptide identification
The RAW files were converted to mzXML files by Rawconverter (Winter et al., 2015). For cross-linked peptide searches, we used two different cross-link database searching algorithms: pLink2 (Yang et al., 2012) and the in-house designed Nexus algorithm. For pLink2 searches, a database containing BAF subunit and histone sequences was used with fixed modification Carbamidomethyl [C] and variable modifications: Oxidation [M], Gln->pyro-Glu [AnyN-term], Glu->pyro-Glu [AnyN-term], Xlink_DSS [K] and Xlink_DSS [ProteinN-term].
For Nexus searches, the same database was used with the following parameter settings: (a) up to three miscleavages; (b) static modification on cysteines (+57.0215 Da); (c) differential oxidation modification on methionines (+15.9949 Da); (d) differential modification on the peptide N-terminal glutamic acid residues (−18.0106 Da) or N-terminal glutamine residues (−17.0265 Da); (e) differential mono-BS3 modification on lysine residue (+156.0806 Da). A 5% of false discovery rate (FDR) cutoff was used for both pLink2 and Nexus searches. After performing the pLink2 and Nexus analyses, the search results were combined and each spectrum was manually evaluated for the quality of the match to each peptide using the COMET/Lorikeet Spectrum Viewer (TPP). Cross-linked peptides are considered confidently identified if at least 4 consecutive b or y ions for each peptide are observed and the majority of the observed ions are accounted for. Search results that did not meet these criteria were removed. Intra-links involving a cross-link between identical residues were only kept if the spectral evidence strongly supported the identification; that is, the major fragment ions correspond to the intra-linked peptide sequence and no/few other fragment ions were observed. 4.9% of inter-linked and 5.4% of intra-linked spectra were removed after manual examination. Spectra and cross-link maps can be viewed at https://www.yeastrc.org/proxl_public/viewProject.do?project_id=258. All inter- and intra-cross-links are reported in Table S2.
Computational Analysis for CS-MS
Unless otherwise noted, all CX-MS data analyses were performed using Python v2.7. Plots were generated using Matplotlib v2.2.3 and the Seaborn v0.9.0 data visualization packages.
Mutation QC and Domain Annotations
Somatic cancer mutation data from various protein transcripts in COSMIC v90 were obtained for BAF subunits: SMARCA4 (ENST00000344626), SMARCA2 (ENST00000382203), SMARCB1 (ENST00000644036), ARID1A (ENST00000324856), ARID1B (ENST00000350026), SMARCD1 (ENST00000394963), SMARCD2 (ENST00000448276), SMARCD3 (ENST00000262188), ACTL6A (ENST00000429709), ACTB (ENST00000331789), SMARCC1 (ENST00000254480), SMARCC2 (ENST00000267064), SMARCE1 (ENST00000348513), DPF1 (ENST00000420980), DPF2 (ENST00000528416), DPF3 (ENST00000556509), BCL7A (ENST00000261822), BCL7B (ENST00000223368), and BCL7C (ENST00000215115), and other chromatin remodeling complex subunits: INO80A (ENST00000361937), INO80B (ENST00000233331), RUVBL1 (ENST00000322623), RUVBL2 (ENST00000595090), ACTR5 (ENST00000243903), ACTR6 (ENST00000188312), SRCAP (ENST00000262518), and CHD1 (ENST00000614616). These data were filtered for missense, frameshift, and nonsense mutations (matching “Mutation Description” values of 'Substitution - Missense', 'Substitution - Nonsense', 'Deletion - Frameshift', 'Insertion - Frameshift', or 'Frameshift'), and COSMIC complex mutations and known SNPs were excluded. This filtered set of somatic cancer mutations was mapped to the canonical FASTA sequences of the following UniProtKB entries: SMARCA4 (P51532), SMARCA2 (P51531), SMARCB1 (Q12824), ARID1A (O14497), ARID1B (Q8NFD5), SMARCD1 (Q96GM5), SMARCE1 (Q969G3), SMARCD2 (Q92925), SMARCD3 (Q6STE5), ACTL6A (O96019), ACTB (P60709), SMARCC1 (Q92922), SMARCC2 (Q8TAQ2), DPF1 (Q92782), DPF2 (Q92785), DPF3 (Q92784), INO80A (Q9ULG1), INO80B (Q9C086), RUVBL1 (Q9Y265), RUVBL2 (Q9Y230), ACTR5 (Q9H9F9), ACTR6 (Q9GZN1), SRCAP (Q6ZRS2), and CHD1 (O14646).
Predicted and known functional domain annotations of the BAF and histone core proteins were obtained from PFAM and InterPro databases and the literature.
Cross-linking and Mutation Charts
The total number of cross-links between BAF subunits were represented as heatmaps, in which paralog subunits were considered equivalent, using the seaborn clustermap function with default parameters and no clustering.
For heatmaps showing the number of cross-links at the domain level, each BAF subunit or histone protein was divided into regions of variable residue lengths based on predicted and known functional domain annotations (see Table S2). Cross-links between protein regions were counted and paralog subunits were considered equivalent. The raw counts of cross-links were represented as heatmaps using the seaborn clustermap function with default parameters and no clustering. Additionally, somatic cancer missense mutations within five residues on either side of a unique cross-link (window = 11 aa) were summed and plotted on various scatterplots integrating cross-linking and missense mutation data using matplotlib. Unless otherwise noted, the missense mutation frequency was plotted on a logarithmic base-10 scale and both inter- and intra-cross-links were included in this CXMS-missense mutation scatterplot analysis.
For heatmaps showing changes in cross-links at the domain level between nucleosome-bound BAF and free BAF, the raw differences in the number of cross-links were plotted using the seaborn clustermap function with default parameters and no clustering.
The nucleosome-bound BAF structure was split into four modules: core (ARID1A/1B, SMARCB1, SMARCC1/2, SMARCD1/2/3, SMARCE1, and DPF2), ATPase (SMARCA2/4, BCL7A/B/C), ARP (ACTL6A/B, ACTB), and NCP (H2A, H2B, H3, and H4). The total number of unique somatic cancer mutations stratified by type (missense, frameshift, and nonsense) within five residues on either side of the total set of unique cross-links (window = 11 aa) representing BAF subunit–subunit, BAF subunit–module, and BAF subunit–NcP interfaces were summed and plotted as bar plots. The number of missense mutations within five residues of a cross-link (window= 11 aa) were further summarized as a pie chart using matplotlib, in which the number of unique missense mutations within five residues of the total set of unique cross-links representing BAF core inter-subunit interfaces, BAF ATPase and ARP inter-subunit interfaces (excluding the SMARCA helicase N- and C-terminal domains), BAF ATPase and ARP catalytic interfaces (interfaces that include the SMARCA helicase N- and C-terminal domains), BAF subunit–NCP fold interfaces, or BAF subunit–NCP tail interfaces, were summed and used as input into the pie chart. These missense mutations affecting BAF subunit–NCP fold interfaces and BAF subunit–NCP tail interfaces were also represented as a bar chart using matplotlib.
Additionally, the total number of inter-cross-links by residue position across the various BAF subunits were visualized as dotplots and histograms using matplotlib. Ambiguous cross-links that could be mapped to multiple paralogs of human BAF were remapped to the following set of BAF subunits if possible: SMARCA4, BCL7A, SS18, ACTL6A, ACTB, DPF2, ARID1A, SMARCB1, SMARCC1, SMARCC2, SMARCD1, and SMARCE1. Paralogs were considered equivalent in this analysis in the labeling of the outbound ends of these remapped inter-cross-links for these visualizations.
The remapped inter-cross-links with ARID1A ARID/ARID-CBRA inter-region, SMARCC1 N-term, SMARCC2 N-term, BCL7A, SMARCB1 winged-helix, and SS18 on one end were visualized on the model using PyMOL. The resolved ends of these cross-links were visualized on the model as black circles. Histones and BAF subunits were colored using hues consistent with the inter-cross-link protein diagrams described previously.
Coverage Analyses
Pairwise alignments of the FASTA sequences of the protein chains from the models of endogenous human BAF complex, recombinant human BAF complex (PDB: 6LTJ), yeast RSC complex (PDB: 6KW4), and yeast SWI/SNF complex (PDB: 6UXW) and the corresponding canonical FASTA sequence of the UniProtKB entries described previously were used to compute the sequence coverages of each model. EMBOSS Needle v6.6.0 with default parameters was used for pairwise alignments. Paralogs were excluded in this coverage analysis, so the canonical FASTA sequences of the following subunits of the endogenous human BAF complex were used: SMARCA4, SMARCB1, SMARCC1, SMARCC2, SMARCD1, SMARCE1, DPF2, ARID1A, BCL7A, SS18, ACTB, and ACTL6A. Chains J, V, Y of the yeast RSC complex (PDB: 6KW4) were concatenated by residue position, chain D was aligned to SMARCC1, and chain H was aligned to SMARCC1. Chains G, E of the yeast SWI/SF complex (PDB: 6UXW) were concatenated by residue position and aligned to SMARCC1, and chains F, D were concatenated by residue position and aligned to SMARCC2. Chain O of the recombinant human BAF complex (PDB: 6LTJ) was aligned to SMARCC1 and chain N was aligned to SMARCC2. Coverage maps along with domain annotations were plotted as ribbons using matplotlib.
Percentage of total coverage and coverage by BAF subunit were plotted as bar charts or grouped bar charts using matplotlib. The lengths of the individual BAF subunits were obtained from the lengths of the canonical FASTA sequences of the UniProtKB entries described previously. In particular, the protein lengths for SMARCA4 (1647 aa), SMARCB1 (385 aa), SMARCC1 (1105 aa), SMARCC2 (1214 aa), SMARCD1 (515 aa), SMARCE1 (411 aa), DPF2 (391 aa), ARID1A (2285 aa), BCL7A (210 aa), SS18 (418 aa), ACTB (375 aa), and ACTL6A (429 aa) were used for a total BAF length of 9385 aa.
Human cancer mutation mapping
Unless otherwise noted, pairwise alignments were performed with EMBOSS Needle v6.6.0 with default parameters, and multiple sequence alignments were performed with Clustal Omega v1.2.4 with default parameters. Additionally, all alignments were performed using these software packages hosted on the EMBL-EBI portal. All mutations used were derived from the COSMIC mutation database (https://cancer.sanger.ac.uk/cosmic).
The canonical FASTA sequences of the UniProtKB entries were aligned to the sequences in the final model of the endogenous human BAF complex and in the structures of the yeast RSC complex (PDB: 6KW3, 6KW4), the yeast SWI/SNF complex (PDB: 6UXW), and the recombinant human BAF complex (PDB: 6LTH, 6LTJ) using EMBOSS Needle v6.6.0 with default parameters for pairwise sequence alignments (for BAF subunits without paralogs) and Clustal Omega v1.2.4 with default parameters for multiple sequence alignments (for BAF subunits with paralogs) to create a map between the canonical FASTA sequence and the structural sequence. Chain concatenations for broken chains, and chain assignments for SMARCC1/SMARCC2 were consistent with the chain concatenations and assignments described previously under Coverage. Unless otherwise noted, all known SNPs were excluded in the mutational modeling analysis.
Sequence alignments between the canonical FASTA sequences described previously and the FASTA sequences resolved in the structures of the complexes were used to map the filtered missense somatic cancer mutation data onto the models. Pairwise sequence alignments (for BAF subunits without paralogs) and multiple sequence alignments (for BAF subunits with paralogs) were performed using EMBOSS Needle v6.6.0 and Clustal Omega v1.2.4 with default parameters, respectively. Mutations across paralogs (e.g., ARID1A/1B) were summed. The missense mutational recurrence by residue position onto the sequences included in the models was visualized across the BAF complexes using PyMOL v2.3.4. The mutation frequency values were stored in the, initially blanked, B-factor columns of the raw pdb files using BioPandas v0.2.4. Unless otherwise noted, the mutation recurrence was binned into three groups: zero mutations (white), one mutation (pink), and two or more mutations (red) using the color_b addon PyMOL script. Electrostatic potentials for the NCP were calculated using the ABPS plugin. Unless otherwise noted, all known SNPs were excluded in the mutational modeling analysis.
Additionally, sequence alignments between the canonical FASTA sequences and the FASTA sequences included in the structures of the INO80A complex (PDB: 6HTS), the SWR1 complex (PDB: 6GEN), and the Chd1 complex (PDB: 5O9G) were used to map the filtered somatic cancer mutation data onto the sequences included in the models. Only pairwise sequence alignments were performed using EMBOSS Needle 6.6.0 because paralogs were excluded in this analysis. Nonsynonymous (missense, frameshift, and nonsense) mutation frequencies by residue positions were visualized across the models with the same color gradient described above. All known SNPs were included in this mutational modeling analysis, and paralogs were excluded in this analysis.
For the comparative analysis of missense mutation coverage in the models of the endogenous and recombinant human BAF complexes, differences in sequence coverages of the structures described under Coverage were used to identify missense mutations exclusive to the model of the endogenous human BAF complex, missense mutations exclusive to the model of the recombinant human BAF complex, and missense mutations shared by both models. The missense mutation frequencies of these three sets of mutations were plotted onto the models using a three-bin (0 mutations, 1 mutation, 2+ mutations) white-to-red (for mutations exclusive to one model) or white-to-blue (for mutations shared by both models) binned color gradient.
For the comparative analysis of missense mutational recurrence of the BAF and other chromatin-remodeling complexes, the INO80A (PDB: 6HTS), SWR (PDB: 6GEN), and Chd1 (PDB: 5O9G) complexes, at subunit–NCP histone and subunit–NCP DNA interfaces, the total number of missense mutations occurring at residues with α-carbons within 10 Å of the α-carbons of the histone core (for the interfaces with NCP histones) or the total number of missense mutations occurring at residues with α-carbons within 10 Å of the DNA (for the subunit–NCP DNA interfaces) were identified using the PyMOL within function, and plotted as grouped bar charts using matplotlib. The missense mutations originating from subunit paralogs of all chromatin-remodeling complexes, including human BAF subunit paralogs (ACTL6B, BCL7B/C, ARID1B, DPF1/3, SMARCA2, SMARCD2/3), were excluded in this analysis.
Putative missense cancer driver mutations from a PanCancer analysis of TCGA data from Bailey et al., 2018, were mapped to the model of the endogenous human BAF complex using the appropriate sequence alignments described previously. Additionally, the total percentages of putative missense drivers mappable on the models of the endogenous and recombinant human BAF complexes were plotted as a bar chart using matplotlib. Human BAF subunit paralogs with putative missense drivers (ARID1B and SMARCA2) were excluded in both analyses.
Structural Alignments
The model of the endogenous human BAF complex was compared to the structures of the yeast RSC complex (PDB: 6KW3/4), the yeast SWI/SNF complex (PDB: 6UXW), and the recombinant human BAF complex (PDB: 6LTH, 6LTJ). Unless otherwise noted, the structures were aligned with the PyMOL align or cealign functions (whichever alignment produced a lower RMSD) using the histone core (H2A/B, H3, H4) as reference. The PyMOL get_angle function was used to compute the angles between the ATP-binding pockets and the PyMOL angle_between_helices function was used to compute the angle between the α-helices of the structures (e.g., between the HSA of the yeast RSC or SWI/SNF complexes and the endogenous human BAF complex).
For the figure comparing the HSAs of the different complexes, the NCP in the yeast RSC complex structure was aligned to the NCP in the yeast SWI/SNF complex structure using the PyMOL align function, followed by alignments of the NCPs in the structures of the endogenous and recombinant human BAF complex structures to the NCP in the yeast RSC complex structure using the PyMOL cealign function.
Calculation of Intrinsically Disordered Protein (IDP) regions within subunits:
To determine the fraction of IDP regions, full-length human and yeast subunit protein sequences were subjected to “GlobPlot,” a predictor of globular domains (Linding et al., 2003). Search was restricted to components of the human and yeast complexes that were identifiable through sequence (for example SMARCE has no identifiable homolog in yeast and hence was not used in this calculation). These calculations take into account putative globular domains with no identifiable sequence similarity to any known domain.
> AJT87389.1: Snf2p: SMARCA2/4
> AJV95515.1: Swi1p: ARID1A/B, (EDZ68798.1)
> EDZ68798.1: YPL016Wp: ARID1A/B (AJV95515.1)
> AJP83426.1: Snf5p: SMARCB1
> AJR69048.1: Swi3p: SMARCC1/2
> AJT27900.1: snf12p: SMARCD1/2/3
From this analysis, 55% of the human BAF complex is predicted to be globular, while 69% of the yeast complex is predicted to be globular (45% versus 31% IDP, respectively).
Supplementary Material
Figure S1. Purification and activity assessments of endogenous human BAF complexes and analysis by cryo-EM.
A. Schematic showing the purification of BAF complexes from human cells using HA-DPF2 as bait, which were fixed by GraFix for analysis by cryo-EM. Purified complexes were also incubated with nucleosome core particles (NCPs) and chemically fixed using either GraFix for analysis by cryo-EM or BS3 for analysis by CX-MS.
B. Colloidal blue-stained gel of canonical BAF complexes that were isolated using HA-DPF2 as bait and further purified over a 10-30% glycerol gradient.
C. REAA using DPF2-purifed canonical BAF complexes and recombinant, unmodified nucleosomes with 601 Widom sequence DNA containing a DpnII restriction site. The DNA gel was imaged using TapeStation D1000 to visualize cut and uncut DNA.
D. Quantification of REAA and ATPase activity (ADP-Glo) for different ATP concentrations. The ATPase assay was run for 60 minutes at 37°C.
E. Selected motion-corrected cryo-EM image of HA-DPF2-purified BAF complexes. Scale bar: 50 nm.
F. Selected 2D-class averages of BAF complex particles.
G. Schematic depicting the image-processing workflow used for free BAF complexes, including focused 3D refinement used to improve the map for the lower lobe, also showing the angular distribution for the particles in the final dataset.
H. Gold-standard Fourier shell correlation (FSC) curve for the refined map of the BAF lower lobe, indicating an overall resolution of 7.8 Å (FSC = 0.143).
I. Contributions of eigenvectors after multi-body refinement. Approximately 25% of the variance in the rotations and translations is explained by the first two eigenvectors (highlighted in gray).
J. Histograms of the amplitudes along the first and second eigenvectors for all particle images in the refined dataset. Related to Figure 1 and Star Methods.
Figure S2. Reconstitution of BAF–NCP complexes and analysis by cryo-EM.
A. SYBR Gold-stained native-PAGE gel (4.5%), showing free template dNa (196 bp) and DNA bound to NCPs.
B. Ethidium bromide-stained native PAGE gel (3-8%) of GraFix fractions, showing the separation of BAF–NCP complexes from free NCPs.
C. Coomassie blue-stained native PAGE gel (3-8%) of GraFix, showing the separation of BAF–NCP complexes from free BAF complexes.
D. SYBR Gold-stained native-PAGE gel (4.5%) of free NCP and BAF–NCP complexes fixed with BS3 and used for subsequent CX-MS analyses.
E. Selected motion-corrected cryo-EM image of HA-DPF2-purified BAF complexes bound to nucleosomes. Scale bar: 50 nm.
F. Selected 2D-class averages of BAF–NCP complex particles. The side length of individual averages is 43.5 nm.
G. Schematic depicting the image-processing workflow used for BAF–NCP complexes, including focused 3D classification and refinement used to improve different map regions, also showing the angular distribution for the particles in the final datasets. Gold-standard FSC curves for the final maps of the nucleosome region, nucleosome plus ATPase-ARP module and nucleosome plus ‘arm’ module indicate overall resolutions of 5.6 Å, 6.2 Å, and 5.9 Å, respectively (FSC = 0.143). Related to Figure 1 and Star Methods.
Figure S3. Homology modeling and cross-linking mass spectrometry for the endogenous human BAF–NCP complex.
A. Composite cryo-EM map for the endogenous BAF–NCP complex obtained by combining the best maps for the upper and lower lobes. The individual modules are indicated.
B. Workflow used to generate the model for the endogenous human BAF complex. For every BAF subunit, first sequence alignments were used to parse every protein sequence for domains. Models for the individual domains were then generated using homology modeling with RosettaCM (Song et al., 2013), threading models from the structure of the yeast SWI/SNF complex, and ab initio modeling with Rosetta ab initio. These models were refined with or without use of the cryo-EM density, depending on the determined confidence for their location in the density map. All domains were then placed into the composite cryo-EM map of the BAF–NCP complex and their localization was evaluated using a combination of Rosetta density-score, location of the peptide in the yeast SWI/SNF structure, and satisfaction of the cross-links obtained from the CX-MS analysis of the BAF–NCP complex. Then subcomplexes were generated (ATPase+NCP, ARP, ARID1A, N termini of SMARCC1 + N termini of SMARCC2 + SMARCB1, and C termini of SMARCC1 + C termini of SMARCC2 + SMARCC) and refined in the context of the cryo-EM density using RosettaCM. Finally, the entire complex was refined into the density map, again using RosettaCM.
C. Domain models used to assemble the human BAF complex. Shown are the three models with the highest and lowest convergence domains used in the final model of the BAF complex. RosettaCM uses a sampling algorithm in addition to Rosetta's physically realistic force field to optimally refine the structure of the homology models. The top 5 models at the end of extensive RosettaCM modeling runs define the confidence; large differences between the top 5 models result in lower confidence.
D. Known structures and models of individual domains generated with RosettaCM and Rosetta ab initio. The structures of two domains were known: the SMARCB1 C-terminal helix (PDB: 6UCH) and the DPF2 (PDB: 5VDC). 18 domains were modeled using RosettaCM and used in the final structure. RosettaCM also yielded models for 3 domains that could not be placed into the map: SMARCA4 1439-1572, ARID1A 1002-1127, and SMARCC1 146-260. Rosetta ab initio was used to generate models for residues 13-47 of BCL7A and for residues 850-950 of SMARCC1, but these were not used in the final model.
E. Regions of the BAF subunits that are included in the final model of the endogenous human BAF complex. Domains are shown in purple and regions included in the model in gray. R1, region 1, R2, region 2, etc.
F. Cross-links identified in the CX-MS analysis of the endogenous BAF–NCP complex. Subunit regions as defined in panel E. Related to Figures 1-3 and Star Methods.
Figure S4. Cryo-EM maps of human BAF complexes, localization of human-specific subunits, and completeness of the BAF models.
A. Two views of the cryo-EM map of the endogenous human BAF–NCP complex (yellow surface). The right panel also shows the model of the complex in ribbon representation.
B. The same views of the cryo-EM map of the recombinant human BAF–NCP complex (EMDB: EDM-0974), lowpass-filtered to 6 Å (magenta surface). The right panel also shows the model of the complex in ribbon representation (PDB: 6LTJ).
C. Overlay of the two maps for the human BAF–NCP complex, colored as in (A) and (B). The modules are labeled and densities not seen in the map of the recombinant human BAF–NCP complex are outlined with blue dashed lines.
D. The ATPase and ARP modules in cryo-EM maps of the human BAF–NCP complex under different nucleotide conditions. The endogenous human BAF–NCP complex in the presence of AMPPNP (yellow surface), the recombinant human BAF–NCP complex in the apo state (magenta surface; EMDB: EMD-0974) and in the presence of ADP (green; EMDB: EMD-0973). All maps were low pass-filtered to 10 Å.
E. BAF subunit regions included in the model of the endogenous human BAF–NCP complex versus the subunit regions included in the models of the recombinant human BAF complex, the yeast SWI/SNF complex (ySWI/SNF) and the yeast RSC complex (yRSC).
F. Coverage of our map including structural model (blue) and CX-Ms model (green). Regions of additional coverage from CX-MS data was determined using portions of the human BAF complex within 11 aa of an X-linked site. Related to Figures 2-4.
Figure S5. Coverage and comparative analysis of BAF compared to yeast and human complexes.
A. Structures of endogenous human BAF (this study), recombinant human BAF (PDB: 6LTJ), ySWI/SNF (PDB: 6UXW), and yRSC (PDB: 6KW4, 6TDA). ATPase subunits of each are highlighted in red, SMARCB1 homologs in purple. NCP is shown in electrostatic surface representation.
B-C. Comparison of the model of endogenous human BAF complex (this study) with those of the yRSC and ySWI/SNF complexes.
D. Overlay of the HSA domains in the models of the endogenous human BAF complex (blue) and the recombinant human BAF complex (green), showing a difference in tilt angle by ~16°, resulting in shifts in the positions of both the pre-HSA anchors and the Snf2/helicase domains.
E. Structures of INO80 (PDB: 6HTS, 6FML), SWR1 (PDB: 6GEN), and Chd1 (PDB: 5O9G). ATPase components shown in red, SMARCB1 homolog shown in purple. NCP shown in electrostatic surface representation.
F. Number of complex–NCP DNA and complex–NCP histone interfaces for the different complexes.
G-I. Mutations mapped onto the INO80, SWR1 and Chd1 complexes. Related to Figures 2-4.
Figure S6. Analysis of subunits and domains included in the model of the endogenous human BAF–NCP complex.
A. Overlay of our model of the NCP-bound form of the endogenous human BAF complex (opaque) with that of the recombinant human BAF complex (transparent; PDB: 6LTJ), showing the similar interaction of the SMARCB1 CTD with the acidic patch of the NCP acidic patch.
B. Overlay of our model of the NCP-bound form of the endogenous human bAf complex (opaque) with that of the recombinant human BAF complex (transparent; PDB: 6LTJ), showing the similar positions of SMARCB1 and the DPF2 Req domain.
C. DPF2 stability depends on the presence of the SMARCB1 subunit. G401 malignant rhabdoid tumor cells (deficient in SMARCB1) were transfected with SMARCB1 (+) or not (−) and cell extracts were immunoblotted for DPF2.
D. Schematic of SMARCB1 variants generated for rescue in SMARCB1-KO cells.
E. Total nuclear extract of SMARCB1-KO cells transfected with the SMARCB1 variants shown in panel B and immunoblotted for DPF2, showing that the Rpt2 domain of SMARCB1 is required for DPF2 to be incorporated into the BAF complex.
F. Immunoprecipitation studies using V5-tagged SMARCB1 variants indicate the requirement of the Rpt2 domain for DPF2 incorporation into BAF complexes.
G. Changes in cross-links between the CX-MS datasets for the BAF–NCP complex and the free BAF complex, highlighting core module subunits SMARCC1/2, SMArCd, SMARCB1, SMARCE1 subunits (left) and ARID1 and DPF2 subunits (right).
H. Sequence conservation for the SnAc and post-SnAc region of SMARCA4/2 ATPase subunit. Related to Figures 4-5.
Figure S7. Mapping of human cancer-associated mutations onto the model of the endogenous human BAF complex.
A. Mapping of TCGA pan-cancer driver mutations identified in Bailey et al., 2018, onto the model of the endogenous human BAF–NCP complex. The BAF complex is shown as white ribbon, the histones of the NCP as blue ribbons and the DNA of the NCP as orange ladder.
B, C. Comparison of our model of the endogenous human BAF–NCP complex with that of the recombinant human BAF–NCP complex. Mutations that could be mapped onto both structures are shown in blue; mutations that could only be mapped to one of the structures are shown in red.
D. Percentage of intrinsically disordered protein (IDP) regions in all the subunits of the human BAF complex and the yeast SWI/SNF complex. Related to Figures 6-7.
Movie S1: Structural model of the endogenous BAF complex, spin view. Related to Figures 1 and S1-S3.
Movie S2: Interfaces of the BAF complex with the NCP, including interfaces of the ATPase module with the NCP (part 1) and the SMARCB1 subunit with the NCP (part 2). Related to Figure 1.
Movie S3: Structural model of the endogenous BAF complex with endogenous-specific, unfilled densities highlighted. Related to Figures 2 and 3.
Movie S4: Multi-body refinement of BAF alone, motion 1 and 2. Related to Figure 4.
Movie S5: Multi-body refinement of BAF (NCP bound), motion 1 and 2. Related to Figure 4.
Table S1. Cryo-EM data collection parameters and statistics. Related to Figures 1-7, Figure S1-S7.
Table S2. Cross-linking mass-spectrometry dataset for the BAF–NCP complex, showing inter- and intra-cross-links. BAF subunit and histone protein domain annotation and coordinates. Related to Figures 1-7 and S1-S7.
Highlights.
The BAF complex consists of three modules arranged in a C-shape around the nucleosome
Endogenous-specific densities map to the ARID1A and SMARCC C-termini, SS18, and BCL7A
SMARCA4 SnAc/post-SnAc and SMARCB1 CTD regions bilaterally engage NCP acidic patch sites
Disease mutations cluster at key structural interfaces, attenuating remodeling activity
Structural analysis of an endogenous human SWI/SNF complex shows how it engages with nucleosomes and provides insight into how cancer-associated mutations affect the remodeler’s function.
Acknowledgements
We thank members of the Kadoch, Walz, and DiMaio laboratories for their input and advice throughout this project, especially M. Bush (Walz Lab) and M. Ebrahim and J. Sotiris for help with grid screening and data collection at the Evelyn Gruss Lipper Cryo-Electron Microscopy Resource Center at The Rockefeller University. We also thank Z. Liu and D. Stokes at the Cryo-Electron Microscopy Laboratory at New York University Langone Health for support in data collection. This study was supported by grants 1DP2CA195762-01, the Pew-Stewart Scholars in Cancer Research Award, the American Cancer Society Research Scholar Award RSG-14-051-01-DMC (C.K.), the NIH K99CA237855 (N.M.) and NIH R01GM110064 (J.A.R).
Footnotes
Declarations of Interest
C. K. is the scientific founder, fiduciary Board of Directors member, Scientific Advisory Board Member, shareholder and consultant for Foghorn Therapeutics, Inc. (Cambridge, MA). The other authors declare no competing interests.
Publisher's Disclaimer: This is a PDF file of an unedited manuscript that has been accepted for publication. As a service to our customers we are providing this early version of the manuscript. The manuscript will undergo copyediting, typesetting, and review of the resulting proof before it is published in its final form. Please note that during the production process errors may be discovered which could affect the content, and all legal disclaimers that apply to the journal pertain.
References
- An W, and Roeder RG (2004). Reconstitution and transcriptional analysis of chromatin in vitro. Methods in enzymology 377, 460–474. [DOI] [PubMed] [Google Scholar]
- Ayala R, Willhoft O, Aramayo RJ, Wilkinson M, McCormack EA, Ocloo L, Wigley DB, and Zhang X (2018). Structure and regulation of the human INO80-nucleosome complex. Nature 556, 391–395. [DOI] [PMC free article] [PubMed] [Google Scholar]
- Bailey MH, Tokheim C, Porta-Pardo E, Sengupta S, Bertrand D, Weerasinghe A, Colaprico A, Wendl MC, Kim J, Reardon B, et al. (2018). Comprehensive Characterization of Cancer Driver Genes and Mutations. Cell 173, 371–385. [DOI] [PMC free article] [PubMed] [Google Scholar]
- Balinas-Gavira C, Rodriguez MI, Andrades A, Cuadros M, Alvarez-Perez JC, Alvarez-Prado AF, de Yebenes VG, Sanchez-Hernandez S, Fernandez-Vigo E, Munoz J, et al. (2020). Frequent mutations in the amino-terminal domain of BCL7A impair its tumor suppressor role in DLbCl. Leukemia. 10.1038/s41375-020-0919-5. [DOI] [PubMed] [Google Scholar]
- Bogershausen N, and Wollnik B (2018). Mutational Landscapes and Phenotypic Spectrum of SWI/SNF-Related Intellectual Disability Disorders. Front Mol Neurosci 11, 252. [DOI] [PMC free article] [PubMed] [Google Scholar]
- Chaudhury S, Lyskov S, and Gray JJ (2010). PyRosetta: a script-based interface for implementing molecular modeling algorithms using Rosetta. Bioinformatics 26, 689–691. [DOI] [PMC free article] [PubMed] [Google Scholar]
- Cirillo LA, Lin FR, Cuesta I, Friedman D, Jarnik M, and Zaret KS (2002). Opening of compacted chromatin by early developmental transcription factors HNF3 (FoxA) and GATA-4. Molecular cell 9, 279–289. [DOI] [PubMed] [Google Scholar]
- Clapier CR, Iwasa J, Cairns BR, and Peterson CL (2017). Mechanisms of action and regulation of ATP-dependent chromatin-remodelling complexes. Nature reviews Molecular cell biology 18, 407–422. [DOI] [PMC free article] [PubMed] [Google Scholar]
- Eroglu E, Burkard TR, Jiang Y, Saini N, Homem CCF, Reichert H, and Knoblich JA (2014). SWI/SNF complex prevents lineage reversion and induces temporal patterning in neural stem cells. Cell 156, 1259–1273. [DOI] [PubMed] [Google Scholar]
- Eustermann S, Schall K, Kostrewa D, Lakomek K, Strauss M, Moldt M, and Hopfner KP (2018). Structural basis for ATP-dependent chromatin remodelling by the INO80 complex. Nature 556, 386–390. [DOI] [PMC free article] [PubMed] [Google Scholar]
- Farnung L, Vos SM, Wigge C, and Cramer P (2017). Nucleosome-Chd1 structure and implications for chromatin remodelling. Nature 550, 539–542. [DOI] [PMC free article] [PubMed] [Google Scholar]
- Fleishman SJ, Leaver-Fay A, Corn JE, Strauch E-M, Khare SD, Koga N, Ashworth J, Murphy P, Richter F, Lemmon G, Meiler J, and Baker D. (2011). RosettaScripts: A Scripting Language Interface to the Rosetta Macromolecular Modeling Suite. PLoS oNe 6: e20161. [DOI] [PMC free article] [PubMed] [Google Scholar]
- Han Y, Reyes AA, Malik S, and He Y (2020). Cryo-EM structure of SWI/SNF complex bound to a nucleosome. Nature 579, 452–455. [DOI] [PMC free article] [PubMed] [Google Scholar]
- He S, Wu Z, Tian Y, Yu Z, Yu J, Wang X, Li J, Liu B, and Xu Y (2020). Structure of nucleosome-bound human BAF complex. Science (New York, NY) 367, 875–881. [DOI] [PubMed] [Google Scholar]
- Ho L, Ronan JL, Wu J, Staahl BT, Chen L, Kuo A, Lessard J, Nesvizhskii AI, Ranish J, and Crabtree GR (2009). An embryonic stem cell chromatin remodeling complex, esBAF, is essential for embryonic stem cell self-renewal and pluripotency. Proceedings of the National Academy of Sciences of the United States of America 106, 5181–5186. [DOI] [PMC free article] [PubMed] [Google Scholar]
- Kadoch C, and Crabtree GR (2013). Reversible disruption of mSWI/SNF (BAF) complexes by the SS18-SSX oncogenic fusion in synovial sarcoma. Cell 153, 71–85. [DOI] [PMC free article] [PubMed] [Google Scholar]
- Kadoch C, and Crabtree GR (2015). Mammalian SWI/SNF chromatin remodeling complexes and cancer: Mechanistic insights gained from human genomics. Science advances 1, e1500447. [DOI] [PMC free article] [PubMed] [Google Scholar]
- Kadoch C, Hargreaves DC, Hodges C, Elias L, Ho L, Ranish J, and Crabtree GR (2013). Proteomic and bioinformatic analysis of mammalian SWI/SNF complexes identifies extensive roles in human malignancy. Nature genetics 45, 592–601. [DOI] [PMC free article] [PubMed] [Google Scholar]
- Kastner B, Fischer N, Golas MM, Sander B, Dube P, Boehringer D, Hartmuth K, Deckert J, Hauer F, Wolf E, et al. (2008). GraFix: sample preparation for single-particle electron cryomicroscopy. Nature methods 5, 53–55. [DOI] [PubMed] [Google Scholar]
- Kelso TWR, Porter DK, Amaral ML, Shokhirev MN, Benner C, and Hargreaves DC (2017). Chromatin accessibility underlies synthetic lethality of SWI/SNF subunits in ARID1A-mutant cancers. eLife 6, e30506. [DOI] [PMC free article] [PubMed] [Google Scholar]
- Kimanius D, Forsberg BO, Scheres SH, and Lindahl E (2016). Accelerated cryo-EM structure determination with parallelisation using GPUs in ReLiON-2. eLife 5, e18722. [DOI] [PMC free article] [PubMed] [Google Scholar]
- Linding R, Russell RB, Neduva V, Gibson TJ (2003). GlobPlot: Exploring protein sequences for globularity and disorder. Nucleic Acids Research 31, 3701–3708. [DOI] [PMC free article] [PubMed] [Google Scholar]
- Liu X, Li M, Xia X, Li X, and Chen Z (2017). Mechanism of chromatin remodelling revealed by the Snf2-nucleosome structure. Nature 544, 440–445. [DOI] [PubMed] [Google Scholar]
- Luger K, Rechsteiner TJ, and Richmond TJ (1999). Expression and purification of recombinant histones and nucleosome reconstitution. Methods in molecular biology (Clifton, NJ) 119, 1–16. [DOI] [PubMed] [Google Scholar]
- Mashtalir N, D'Avino AR, Michel BC, Luo J, Pan J, Otto JE, Zullow HJ, McKenzie ZM, Kubiak RL, St Pierre R, et al. (2018). Modular Organization and Assembly of SWI/SNF Family Chromatin Remodeling Complexes. Cell 175, 1272–1288. [DOI] [PMC free article] [PubMed] [Google Scholar]
- Mastronarde DN (2005). Automated electron microscope tomography using robust prediction of specimen movements. J Struct Biol 152, 36–51. [DOI] [PubMed] [Google Scholar]
- Mathur R, Alver BH, San Roman AK, Wilson BG, Wang X, Agoston AT, Park PJ, Shivdasani RA, and Roberts CW (2017). ARID1A loss impairs enhancer-mediated gene regulation and drives colon cancer in mice. Nature genetics 49, 296–302. [DOI] [PMC free article] [PubMed] [Google Scholar]
- McBride MJ, Mashtalir N, Winter EB, Dao HT, Filipovski M, D'Avino AR, Seo HS, Umbreit NT, St Pierre R, Valencia AM, et al. (2020). The nucleosome acidic patch and H2A ubiquitination underlie mSWI/SNF recruitment in synovial sarcoma. Nature structural & molecular biology. 10.1038/s41594-020-0466-9. [DOI] [PMC free article] [PubMed] [Google Scholar]
- Michel BC, D'Avino AR, Cassel SH, Mashtalir N, McKenzie ZM, McBride MJ, Valencia AM, Zhou Q, Bocker M, Soares LMM, et al. (2018). A non-canonical SWI/SNF complex is a synthetic lethal target in cancers driven by BAF complex perturbation. Nature cell biology 20, 1410–1420. [DOI] [PMC free article] [PubMed] [Google Scholar]
- Nakane T, Kimanius D, Lindahl E, and Scheres SH (2018). Characterisation of molecular motions in cryo-EM single-particle data by multi-body refinement in RELION. eLife 7, e36861. [DOI] [PMC free article] [PubMed] [Google Scholar]
- Nakayama RT, Pulice JL, Valencia AM, McBride MJ, McKenzie ZM, Gillespie MA, Ku WL, Teng M, Cui K, Williams RT, et al. (2017). SMARCB1 is required for widespread BAF complex-mediated activation of enhancers and bivalent promoters. Nature genetics 49, 1613–1623. [DOI] [PMC free article] [PubMed] [Google Scholar]
- Ovchinnikov S, Park H, Kim DE, DiMaio F, and Baker D (2018). Protein structure prediction using Rosetta in CASP12. Proteins 86 Suppl 1, 113–121. [DOI] [PMC free article] [PubMed] [Google Scholar]
- Pan J, McKenzie ZM, D'Avino AR, Mashtalir N, Lareau CA, St Pierre R, Wang L, Shilatifard A, and Kadoch C (2019). The ATPase module of mammalian SWI/SNF family complexes mediates subcomplex identity and catalytic activity-independent genomic targeting. Nature genetics 51, 618–626. [DOI] [PMC free article] [PubMed] [Google Scholar]
- Park H, Lee GR, Kim DE, Anishchenko I, Cong Q, and Baker D (2019). High-accuracy refinement using Rosetta in CASP13. Proteins 87, 1276–1282. [DOI] [PMC free article] [PubMed] [Google Scholar]
- Patel AB, Moore CM, Greber BJ, Luo J, Zukin SA, Ranish J, and Nogales E (2019). Architecture of the chromatin remodeler RSC and insights into its nucleosome engagement. eLife 8, e54449. [DOI] [PMC free article] [PubMed] [Google Scholar]
- Pulice JL, and Kadoch C (2016). Composition and Function of Mammalian SWI/SNF Chromatin Remodeling Complexes in Human Disease. Cold Spring Harbor symposia on quantitative biology 81, 53–60. [DOI] [PubMed] [Google Scholar]
- Punjani A, Rubinstein JL, Fleet DJ, and Brubaker MA (2017). cryoSPARC: algorithms for rapid unsupervised cryo-EM structure determination. Nature methods 14, 290–296. [DOI] [PubMed] [Google Scholar]
- Rohou A, and Grigorieff N (2015). CTFFIND4: Fast and accurate defocus estimation from electron micrographs. J Struct Biol 192, 216–221. [DOI] [PMC free article] [PubMed] [Google Scholar]
- Rohou A, Grigorieff N (2015). CTFFIND4: Fast and accurate defocus estimation from electron micrographs. J Struct Biol 192, 216–221. [DOI] [PMC free article] [PubMed] [Google Scholar]
- Ruthenburg AJ, Li H, Milne TA, Dewell S, McGinty RK, Yuen M, Ueberheide B, Dou Y, Muir TW, Patel DJ, et al. (2011). Recognition of a mononucleosomal histone modification pattern by BPTF via multivalent interactions. Cell 145, 692–706. [DOI] [PMC free article] [PubMed] [Google Scholar]
- Sandoval GJ, Pulice JL, Pakula H, Schenone M, Takeda DY, Pop M, Boulay G, Williamson KE, McBride MJ, Pan J, et al. (2018). Binding of TMPRSS2-ERG to BAF Chromatin Remodeling Complexes Mediates Prostate Oncogenesis. Molecular cell 71, 554–566. [DOI] [PMC free article] [PubMed] [Google Scholar]
- Shimada M, Chen WY, Nakadai T, Onikubo T, Guermah M, Rhodes D, and Roeder RG (2019). Gene-Specific H1 Eviction through a Transcriptional Activator-->p300-->NAP1-->H1 Pathway. Molecular cell 74, 268–283. [DOI] [PMC free article] [PubMed] [Google Scholar]
- Simons KT, Ruczinski I, Kooperberg C, Fox BA, Bystroff C, Baker D (1999) Improved recognition of native-like protein structures using a combination of sequence-dependent and sequence-independent features of proteins. Proteins 34, 82–95. [DOI] [PubMed] [Google Scholar]
- Simons KT, Bonneau R, Ruczinski I, Baker D (1999) Ab initio protein structure prediction of CASP III targets using ROSETTA. Proteins Suppl 3: 171–176. [DOI] [PubMed] [Google Scholar]
- Soding J (2005). Protein homology detection by HMM-HMM comparison. Bioinformatics 21, 951–960. [DOI] [PubMed] [Google Scholar]
- Song Y, DiMaio F, Wang RY, Kim D, Miles C, Brunette T, Thompson J, and Baker D (2013). High-resolution comparative modeling with RosettaCM. Structure 21, 1735–1742. [DOI] [PMC free article] [PubMed] [Google Scholar]
- St Pierre R, and Kadoch C (2017). Mammalian SWI/SNF complexes in cancer: emerging therapeutic opportunities. Current opinion in genetics & development 42, 56–67. [DOI] [PMC free article] [PubMed] [Google Scholar]
- Stark H (2010). GraFix: stabilization of fragile macromolecular complexes for single particle cryo-EM. Methods in enzymology 481, 109–126. [DOI] [PubMed] [Google Scholar]
- Steinegger M, Meier M, Mirdita M, Vöhringer H, Haunsberger SJ, Söding J (2019) HH-suite3 for fast remote homology detection and deep protein annotation. BMC Bioinformatics 20: 473. [DOI] [PMC free article] [PubMed] [Google Scholar]
- Tsurusaki Y, Okamoto N, Ohashi H, Kosho T, Imai Y, Hibi-Ko Y, Kaname T, Naritomi K, Kawame H, Wakui K, et al. (2012). Mutations affecting components of the SWI/SNF complex cause Coffin-Siris syndrome. Nature genetics 44, 376–378. [DOI] [PubMed] [Google Scholar]
- Tsurusaki Y, Okamoto N, Ohashi H, Mizuno S, Matsumoto N, Makita Y, Fukuda M, Isidor B, Perrier J, Aggarwal S, et al. (2014). Coffin-Siris syndrome is a SWI/SNF complex disorder. Clin Genet 85, 548–554. [DOI] [PubMed] [Google Scholar]
- Valencia AM, Collings CK, Dao HT, St Pierre R, Cheng YC, Huang J, Sun ZY, Seo HS, Mashtalir N, Comstock DE, et al. (2019). Recurrent SMARCB1 Mutations Reveal a Nucleosome Acidic Patch Interaction Site That Potentiates mSWI/SNF Complex Chromatin Remodeling. Cell 179, 1342–1356. [DOI] [PMC free article] [PubMed] [Google Scholar]
- Wagner FR, Dienemann C, Wang H, Stutzer A, Tegunov D, Urlaub H, and Cramer P (2020). Structure of SWI/SNF chromatin remodeller RSC bound to a nucleosome. Nature 579, 448–451. [DOI] [PMC free article] [PubMed] [Google Scholar]
- Wang RY, Kudryashev M, Li X, Egelman EH, Basler M, Cheng Y, Baker D, and DiMaio F (2015). De novo protein structure determination from near-atomic-resolution cryo-EM maps. Nature methods 12, 335–338. [DOI] [PMC free article] [PubMed] [Google Scholar]
- Wang X, Lee RS, Alver BH, Haswell JR, Wang S, Mieczkowski J, Drier Y, Gillespie SM, Archer TC, Wu JN, et al. (2017). SMARCB1-mediated SWI/sNf complex function is essential for enhancer regulation. Nature genetics 49, 289–295. [DOI] [PMC free article] [PubMed] [Google Scholar]
- Wieczorek D, Bogershausen N, Beleggia F, Steiner-Haldenstatt S, Pohl E, Li Y, Milz E, Martin M, Thiele H, Altmuller J, et al. (2013). A comprehensive molecular study on Coffin-Siris and Nicolaides-Baraitser syndromes identifies a broad molecular and clinical spectrum converging on altered chromatin remodeling. Human molecular genetics 22, 5121–5135. [DOI] [PubMed] [Google Scholar]
- Willhoft O, Ghoneim M, Lin CL, Chua EYD, Wilkinson M, Chaban Y, Ayala R, McCormack EA, Ocloo L, Rueda DS, et al. (2018). Structure and dynamics of the yeast SWR1-nucleosome complex. Science 362, eaat7716. [DOI] [PubMed] [Google Scholar]
- Xiong X, Panchenko T, Yang S, Zhao S, Yan P, Zhang W, Xie W, Li Y, Zhao Y, Allis CD, et al. (2016). Selective recognition of histone crotonylation by double PHD fingers of MOZ and DPF2. Nature chemical biology 12, 1111–1118. [DOI] [PMC free article] [PubMed] [Google Scholar]
- Xu G, Chhangawala S, Cocco E, Razavi P, Cai Y, Otto JE, Ferrando L, Selenica P, Ladewig E, Chan C, et al. (2020). ARID1A determines luminal identity and therapeutic response in estrogen-receptor-positive breast cancer. Nature genetics 52, 198–207. [DOI] [PMC free article] [PubMed] [Google Scholar]
- Yang J, Anishchenko I, Park H, Peng Z, Ovchinnikov S, and Baker D (2020). Improved protein structure prediction using predicted interresidue orientations. Proceedings of the National Academy of Sciences of the United States of America 117, 1496–1503. [DOI] [PMC free article] [PubMed] [Google Scholar]
- Ye Y, Wu H, Chen K, Clapier CR, Verma N, Zhang W, Deng H, Cairns BR, Gao N, and Chen Z (2019). Structure of the RSC complex bound to the nucleosome. Science 366, 838–843. [DOI] [PMC free article] [PubMed] [Google Scholar]
- Zeng L, Zhang Q, Li S, Plotnikov AN, Walsh MJ, and Zhou MM (2010). Mechanism and regulation of acetylated histone binding by the tandem PHD finger of DPF3b. Nature 466, 258–262. [DOI] [PMC free article] [PubMed] [Google Scholar]
- Zhang Y, and Skolnick J (2005). TM-align: a protein structure alignment algorithm based on the TM-score. Nucleic acids research 33, 2302–2309. [DOI] [PMC free article] [PubMed] [Google Scholar]
- Zheng SQ, Palovcak E, Armache JP, Verba KA, Cheng Y, and Agard DA (2017). MotionCor2: anisotropic correction of beam-induced motion for improved cryo-electron microscopy. Nature methods 14, 331–332. [DOI] [PMC free article] [PubMed] [Google Scholar]
- Zivanov J, Nakane T, Forsberg BO, Kimanius D, Hagen WJ, Lindahl E, and Scheres SH (2018). New tools for automated high-resolution cryo-EM structure determination in RELION-3. eLife 7, e42166. [DOI] [PMC free article] [PubMed] [Google Scholar]
- Zivanov J, Nakane T, and Scheres SHW (2019). A Bayesian approach to beam-induced motion correction in cryo-EM single-particle analysis. IUCrJ 6, 5–17. [DOI] [PMC free article] [PubMed] [Google Scholar]
Associated Data
This section collects any data citations, data availability statements, or supplementary materials included in this article.
Supplementary Materials
Figure S1. Purification and activity assessments of endogenous human BAF complexes and analysis by cryo-EM.
A. Schematic showing the purification of BAF complexes from human cells using HA-DPF2 as bait, which were fixed by GraFix for analysis by cryo-EM. Purified complexes were also incubated with nucleosome core particles (NCPs) and chemically fixed using either GraFix for analysis by cryo-EM or BS3 for analysis by CX-MS.
B. Colloidal blue-stained gel of canonical BAF complexes that were isolated using HA-DPF2 as bait and further purified over a 10-30% glycerol gradient.
C. REAA using DPF2-purifed canonical BAF complexes and recombinant, unmodified nucleosomes with 601 Widom sequence DNA containing a DpnII restriction site. The DNA gel was imaged using TapeStation D1000 to visualize cut and uncut DNA.
D. Quantification of REAA and ATPase activity (ADP-Glo) for different ATP concentrations. The ATPase assay was run for 60 minutes at 37°C.
E. Selected motion-corrected cryo-EM image of HA-DPF2-purified BAF complexes. Scale bar: 50 nm.
F. Selected 2D-class averages of BAF complex particles.
G. Schematic depicting the image-processing workflow used for free BAF complexes, including focused 3D refinement used to improve the map for the lower lobe, also showing the angular distribution for the particles in the final dataset.
H. Gold-standard Fourier shell correlation (FSC) curve for the refined map of the BAF lower lobe, indicating an overall resolution of 7.8 Å (FSC = 0.143).
I. Contributions of eigenvectors after multi-body refinement. Approximately 25% of the variance in the rotations and translations is explained by the first two eigenvectors (highlighted in gray).
J. Histograms of the amplitudes along the first and second eigenvectors for all particle images in the refined dataset. Related to Figure 1 and Star Methods.
Figure S2. Reconstitution of BAF–NCP complexes and analysis by cryo-EM.
A. SYBR Gold-stained native-PAGE gel (4.5%), showing free template dNa (196 bp) and DNA bound to NCPs.
B. Ethidium bromide-stained native PAGE gel (3-8%) of GraFix fractions, showing the separation of BAF–NCP complexes from free NCPs.
C. Coomassie blue-stained native PAGE gel (3-8%) of GraFix, showing the separation of BAF–NCP complexes from free BAF complexes.
D. SYBR Gold-stained native-PAGE gel (4.5%) of free NCP and BAF–NCP complexes fixed with BS3 and used for subsequent CX-MS analyses.
E. Selected motion-corrected cryo-EM image of HA-DPF2-purified BAF complexes bound to nucleosomes. Scale bar: 50 nm.
F. Selected 2D-class averages of BAF–NCP complex particles. The side length of individual averages is 43.5 nm.
G. Schematic depicting the image-processing workflow used for BAF–NCP complexes, including focused 3D classification and refinement used to improve different map regions, also showing the angular distribution for the particles in the final datasets. Gold-standard FSC curves for the final maps of the nucleosome region, nucleosome plus ATPase-ARP module and nucleosome plus ‘arm’ module indicate overall resolutions of 5.6 Å, 6.2 Å, and 5.9 Å, respectively (FSC = 0.143). Related to Figure 1 and Star Methods.
Figure S3. Homology modeling and cross-linking mass spectrometry for the endogenous human BAF–NCP complex.
A. Composite cryo-EM map for the endogenous BAF–NCP complex obtained by combining the best maps for the upper and lower lobes. The individual modules are indicated.
B. Workflow used to generate the model for the endogenous human BAF complex. For every BAF subunit, first sequence alignments were used to parse every protein sequence for domains. Models for the individual domains were then generated using homology modeling with RosettaCM (Song et al., 2013), threading models from the structure of the yeast SWI/SNF complex, and ab initio modeling with Rosetta ab initio. These models were refined with or without use of the cryo-EM density, depending on the determined confidence for their location in the density map. All domains were then placed into the composite cryo-EM map of the BAF–NCP complex and their localization was evaluated using a combination of Rosetta density-score, location of the peptide in the yeast SWI/SNF structure, and satisfaction of the cross-links obtained from the CX-MS analysis of the BAF–NCP complex. Then subcomplexes were generated (ATPase+NCP, ARP, ARID1A, N termini of SMARCC1 + N termini of SMARCC2 + SMARCB1, and C termini of SMARCC1 + C termini of SMARCC2 + SMARCC) and refined in the context of the cryo-EM density using RosettaCM. Finally, the entire complex was refined into the density map, again using RosettaCM.
C. Domain models used to assemble the human BAF complex. Shown are the three models with the highest and lowest convergence domains used in the final model of the BAF complex. RosettaCM uses a sampling algorithm in addition to Rosetta's physically realistic force field to optimally refine the structure of the homology models. The top 5 models at the end of extensive RosettaCM modeling runs define the confidence; large differences between the top 5 models result in lower confidence.
D. Known structures and models of individual domains generated with RosettaCM and Rosetta ab initio. The structures of two domains were known: the SMARCB1 C-terminal helix (PDB: 6UCH) and the DPF2 (PDB: 5VDC). 18 domains were modeled using RosettaCM and used in the final structure. RosettaCM also yielded models for 3 domains that could not be placed into the map: SMARCA4 1439-1572, ARID1A 1002-1127, and SMARCC1 146-260. Rosetta ab initio was used to generate models for residues 13-47 of BCL7A and for residues 850-950 of SMARCC1, but these were not used in the final model.
E. Regions of the BAF subunits that are included in the final model of the endogenous human BAF complex. Domains are shown in purple and regions included in the model in gray. R1, region 1, R2, region 2, etc.
F. Cross-links identified in the CX-MS analysis of the endogenous BAF–NCP complex. Subunit regions as defined in panel E. Related to Figures 1-3 and Star Methods.
Figure S4. Cryo-EM maps of human BAF complexes, localization of human-specific subunits, and completeness of the BAF models.
A. Two views of the cryo-EM map of the endogenous human BAF–NCP complex (yellow surface). The right panel also shows the model of the complex in ribbon representation.
B. The same views of the cryo-EM map of the recombinant human BAF–NCP complex (EMDB: EDM-0974), lowpass-filtered to 6 Å (magenta surface). The right panel also shows the model of the complex in ribbon representation (PDB: 6LTJ).
C. Overlay of the two maps for the human BAF–NCP complex, colored as in (A) and (B). The modules are labeled and densities not seen in the map of the recombinant human BAF–NCP complex are outlined with blue dashed lines.
D. The ATPase and ARP modules in cryo-EM maps of the human BAF–NCP complex under different nucleotide conditions. The endogenous human BAF–NCP complex in the presence of AMPPNP (yellow surface), the recombinant human BAF–NCP complex in the apo state (magenta surface; EMDB: EMD-0974) and in the presence of ADP (green; EMDB: EMD-0973). All maps were low pass-filtered to 10 Å.
E. BAF subunit regions included in the model of the endogenous human BAF–NCP complex versus the subunit regions included in the models of the recombinant human BAF complex, the yeast SWI/SNF complex (ySWI/SNF) and the yeast RSC complex (yRSC).
F. Coverage of our map including structural model (blue) and CX-Ms model (green). Regions of additional coverage from CX-MS data was determined using portions of the human BAF complex within 11 aa of an X-linked site. Related to Figures 2-4.
Figure S5. Coverage and comparative analysis of BAF compared to yeast and human complexes.
A. Structures of endogenous human BAF (this study), recombinant human BAF (PDB: 6LTJ), ySWI/SNF (PDB: 6UXW), and yRSC (PDB: 6KW4, 6TDA). ATPase subunits of each are highlighted in red, SMARCB1 homologs in purple. NCP is shown in electrostatic surface representation.
B-C. Comparison of the model of endogenous human BAF complex (this study) with those of the yRSC and ySWI/SNF complexes.
D. Overlay of the HSA domains in the models of the endogenous human BAF complex (blue) and the recombinant human BAF complex (green), showing a difference in tilt angle by ~16°, resulting in shifts in the positions of both the pre-HSA anchors and the Snf2/helicase domains.
E. Structures of INO80 (PDB: 6HTS, 6FML), SWR1 (PDB: 6GEN), and Chd1 (PDB: 5O9G). ATPase components shown in red, SMARCB1 homolog shown in purple. NCP shown in electrostatic surface representation.
F. Number of complex–NCP DNA and complex–NCP histone interfaces for the different complexes.
G-I. Mutations mapped onto the INO80, SWR1 and Chd1 complexes. Related to Figures 2-4.
Figure S6. Analysis of subunits and domains included in the model of the endogenous human BAF–NCP complex.
A. Overlay of our model of the NCP-bound form of the endogenous human BAF complex (opaque) with that of the recombinant human BAF complex (transparent; PDB: 6LTJ), showing the similar interaction of the SMARCB1 CTD with the acidic patch of the NCP acidic patch.
B. Overlay of our model of the NCP-bound form of the endogenous human bAf complex (opaque) with that of the recombinant human BAF complex (transparent; PDB: 6LTJ), showing the similar positions of SMARCB1 and the DPF2 Req domain.
C. DPF2 stability depends on the presence of the SMARCB1 subunit. G401 malignant rhabdoid tumor cells (deficient in SMARCB1) were transfected with SMARCB1 (+) or not (−) and cell extracts were immunoblotted for DPF2.
D. Schematic of SMARCB1 variants generated for rescue in SMARCB1-KO cells.
E. Total nuclear extract of SMARCB1-KO cells transfected with the SMARCB1 variants shown in panel B and immunoblotted for DPF2, showing that the Rpt2 domain of SMARCB1 is required for DPF2 to be incorporated into the BAF complex.
F. Immunoprecipitation studies using V5-tagged SMARCB1 variants indicate the requirement of the Rpt2 domain for DPF2 incorporation into BAF complexes.
G. Changes in cross-links between the CX-MS datasets for the BAF–NCP complex and the free BAF complex, highlighting core module subunits SMARCC1/2, SMArCd, SMARCB1, SMARCE1 subunits (left) and ARID1 and DPF2 subunits (right).
H. Sequence conservation for the SnAc and post-SnAc region of SMARCA4/2 ATPase subunit. Related to Figures 4-5.
Figure S7. Mapping of human cancer-associated mutations onto the model of the endogenous human BAF complex.
A. Mapping of TCGA pan-cancer driver mutations identified in Bailey et al., 2018, onto the model of the endogenous human BAF–NCP complex. The BAF complex is shown as white ribbon, the histones of the NCP as blue ribbons and the DNA of the NCP as orange ladder.
B, C. Comparison of our model of the endogenous human BAF–NCP complex with that of the recombinant human BAF–NCP complex. Mutations that could be mapped onto both structures are shown in blue; mutations that could only be mapped to one of the structures are shown in red.
D. Percentage of intrinsically disordered protein (IDP) regions in all the subunits of the human BAF complex and the yeast SWI/SNF complex. Related to Figures 6-7.
Movie S1: Structural model of the endogenous BAF complex, spin view. Related to Figures 1 and S1-S3.
Movie S2: Interfaces of the BAF complex with the NCP, including interfaces of the ATPase module with the NCP (part 1) and the SMARCB1 subunit with the NCP (part 2). Related to Figure 1.
Movie S3: Structural model of the endogenous BAF complex with endogenous-specific, unfilled densities highlighted. Related to Figures 2 and 3.
Movie S4: Multi-body refinement of BAF alone, motion 1 and 2. Related to Figure 4.
Movie S5: Multi-body refinement of BAF (NCP bound), motion 1 and 2. Related to Figure 4.
Table S1. Cryo-EM data collection parameters and statistics. Related to Figures 1-7, Figure S1-S7.
Table S2. Cross-linking mass-spectrometry dataset for the BAF–NCP complex, showing inter- and intra-cross-links. BAF subunit and histone protein domain annotation and coordinates. Related to Figures 1-7 and S1-S7.
Data Availability Statement
The cryo-EM density maps have been deposited in the Electron Microscopy Data Bank (EMDB) under accession numbers: EMD-22476 (Cryo-EM map of human BAF (base module)), EMD-22477 (Cryo-EM map of human BAF-NCP (nucleosome)), EMD-22478 (Cryo-EM map of human BAF-NCP (nucleosome/ATPase/ARP)), EMD-22479 (Cryo-EM map of human BAF-NCP (nucleosome/arm)). The cross-linking mass-spectrometry (CX-MS) data are deposited in the PRIDE database (https://www.ebi.ac.uk/pride/) under accession number: PXD020992. The model coordinates of the full human cBAF complex bound to the nucleosome have been deposited in the Protein DataBank (Dev) under accession code PDBDEV_00000056.