

Objective
Tinnitus, phantom sound perception, arises from aberrant brain activity within auditory cortex. In tinnitus animal models, auditory cortex neurons show increased spontaneous firing and neural synchrony. In humans, similar hyperactivation in auditory cortex has been displayed with functional near-infrared spectroscopy (fNIRS). Resting-state functional connectivity (RSFC) or increased connectivity between brain regions has also been shown in tinnitus using fNIRS. However, current fNIRS technology utilizes infrared (IR)-sources and IR-detectors placed on the scalp that restricts (~3 cm depth IR penetration) signal capture to outer cerebral cortex due to skin and skull bone. To overcome this limitation, in this proof of concept study, we adapted fNIRS probes to fit in the external auditory canal (EAC) to physically place IR-probes deeper within the skull thereby extracting neural signals from deeper auditory cortex.
Methods
Twenty adults with tinnitus and 20 nontinnitus controls listened to periods of silence and broadband noise before and after 5 min of silence to calculate RSFC. Concurrent scalp probes over auditory cortex and an adapted probe placed in the right EAC were utilized.
Results
For standard probes, left and right auditory cortex in tinnitus showed increased RSFC to each other and to other nonauditory cortices. Interestingly, adapted fNIRS probes showed trends toward increased RSFC.
Conclusion
While many areas for the adapted probes did not reach significance, these data using a highly innovative and newly created probe adapting fNIRS technology to the EAC substantiates our previously published data in human tinnitus and concurrently validates this technology as a useful and expanded brain imaging modality.
Keywords: auditory cortex, functional near-infrared spectroscopy, resting-state functional connectivity, tinnitus
Introduction
Tinnitus (phantom sound perception) etiology is not well-defined. It is typically associated with ear pathology (i.e., hearing loss) leading to aberrant neural activity within central auditory pathways [1]. The study of tinnitus in humans has been restricted due to limitations of noninvasive imaging technology to measure human brain changes in tinnitus in real time.
Functional near-infrared spectroscopy (fNIRS) is a noninvasive method for measuring cerebral cortical hemodynamic activity that has been used in human auditory and nonauditory studies [2,3]. fNIRS measures changing optical properties of hemoglobin in the brain using infrared (IR) light to quantify hemodynamic responses through neurovascular coupling [2]. Like functional MRI, when a specific brain region becomes active, fNIRS measures changes in localized hemoglobin as an index of neural activity within the specific brain region. By relying on the intrinsic optical properties of blood that yield measurements of both oxy-(HbO) and de-oxyhemoglobin (HbR), fNIRS is an effective direct metabolic marker [4]. fNIRS can also be used to analyze the connectivity of neural networks within and between specific brain regions. Resting-state functional connectivity (RSFC) portends network interactions but does not assess individual neuron activity. RSFC may reflect plastic changes that play a role in normal and maladaptive conditions that may influence local processing, connections between regions that are likely to work together in the future or serve to coordinate neural activity [5].
Using fNIRS, we have documented brain changes in adult cochlear implant users and in human tinnitus [6–8]. Because neural changes in auditory cortex may underlie tinnitus perception, it is important to target imaging studies to those regions in human tinnitus. Limited IR depth of penetration through scalp and skull using traditional ‘cap’ or scalp configurations (trans-calvarial) currently restricts all fNIRS recordings to the outer cerebral cortex (3 cm of IR penetration). Because brain changes in human tinnitus have been shown to involve deeper cortical and subcortical areas, including thalamocortical networks and limbic networks, that are beyond the reach of current fNIRS technology, it is critical to modify existing fNIRS technology to probe deeper and wider within auditory cortex [9,10].
One strategy to expand brain surveillance with fNIRS is to adapt IR-probes to bypass or minimize IR-limiting calvarial bone and scalp tissues through existing skull conduits [i.e. external auditory canal (EAC)] to physically place the IR-source and IR-detector closer to deeper brain structures of interest. Here, we describe the first-ever documented adaptation of existing fNIRS technology to IR probes that transit the EAC to measure deeper areas of the human temporal lobe. The key innovation and primary goal of this proof of concept study was to design, fabricate and test the adapted laser fNIRS probes for lateral skull base placements for medial and deep temporal lobe recordings through the native EAC. The purpose of this study was not to identify/uncover underlying mechanisms of tinnitus, but rather to validate and extend our previously published changes in RSFC (in human tinnitus) as a measurable objective platform to validate the adapted probes for functional efficacy and application going forward [8]. Our hypothesis is that fNIRS probes adapted to the EAC can deliver (IR-source) and receive (IR-detector) IR light in a manner adequate to calculate RSFC in auditory cortex that replicates our published findings with traditional scalp probes (San Juan et al., 2017).
Methods
Participants
Based on prestudy statistical power analysis, 20 age-matched normal/near-normal hearing adults (10 females and 10 males; average age 38.2 years) with tinnitus and 20 nontinnitus controls (10 females and 10 males; average age 48 years) were selected. Afflicted participants suffered from tinnitus aurium subjectively described as bilateral sound heard inside the head in the absence of an external sound stimulus. All participants were recruited from the senior author’s otology/lateral skull base clinic where the selection of normal/near normal hearing tinnitus and control participants is required to rule out hearing loss as a confounding factor influencing fNIRS results. The University of Michigan Institutional Review Board approved the study and participants were reimbursed for participation. Informed consent was obtained from each participant after an extensive explanation of the protocol using noninvasive fNIRS technology. All tinnitus participants suffered from constant, nonpulsatile, subjective auditory percepts that were appreciated in the ‘head’ or heard in both ears equally. Exclusion criteria included prior otologic surgery, unilateral tinnitus and any degree of conductive hearing loss, sensorineural hearing loss greater than 30 dB at any frequency or other identified etiologies of tinnitus (i.e., skull base tumors, retro-cochlear lesions, high dose aspirin, etc.). It must be noted that this excludes a large proportion of tinnitus sufferers since most have evidence of hearing loss. We excluded those participants to mitigate confounding effects of neuronal changes related to hearing loss but not tinnitus. Both control and tinnitus participants were held to the same normal/near-normal hearing criteria defined as hearing thresholds less than 30 dB for pure tone averages (PTAs) across all frequencies. Moreover, the speech reception thresholds (SRTs) and word discrimination scores (WDS) were also found to be within the normal range between both groups.
Functional near-infrared spectroscopy imaging/cap configuration
We used a continuous wave fNIRS system (CW6, Techen Inc., USA) with two wavelengths (690 and 830 nm). For traditional cap fNIRS recordings, a customized configuration of 30 optodes (15 per hemisphere; source-detector pairs; Fig. 1a) inserted into a silicone headband was wrapped circumferentially around the head and secured with Velcro straps (Fig. 1b). There are 12 detectors and six sources resulting in 23 channels per hemisphere. The neuroanatomical placement of the optodes was guided through the Atlas Viewer GUI [11]. IR-sources and IR-detectors were arranged into 5 × 3 arrays over the frontal, temporal and parietal cortices of the right and left hemispheres. The distance between each IR-source and detector was set at 2.8 cm. To identify if the optode array had moved during testing, the position of T3 and T4 were confirmed pre- and post-experiment [12]. The data were collected at a sampling rate of 50 Hz. Since fNIRS measures IR-light intensity, several conversion steps were made between the captured intensity values to derive the final data measured in units of micromolar (µM) concentration change [7].
Fig. 1.
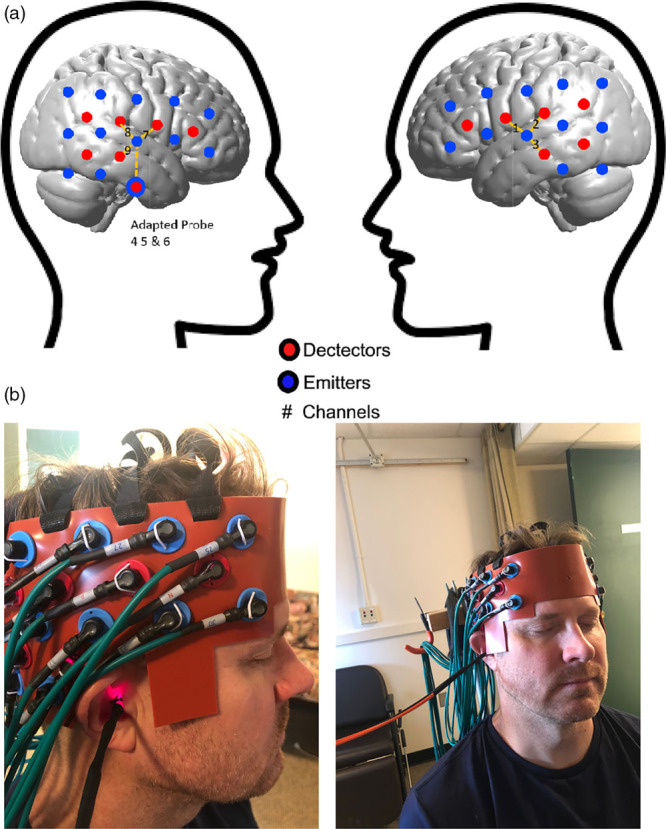
(a) Brain schematic showing the channel configuration for the fNIRS probes adapted to the EAC to measure AC. Channel configurations (numbers) for detectors (red circles) and emitters/sources (blue circles) over cortical hemispheres for ‘cap’ configuration. Inter-connected blocks with dashed line represent AC. T3 and T4 are reference points of International 10–20 System. There are 12 detectors and six sources resulting in 23 channels per hemisphere. The unit of concentration is micromolar (μM). (b) Final concurrent cap and adapted probe fNIRS set up for recordings. Photograph of the adapted probe (for EAC) and housing inserted in the EAC of a test participant (the PI on the project in this case to avoid participant confidentiality issues) with the concurrent scalp/cap probes in place during a typical recording session. Note the active IR light source emitted from the adapted probe that is on and detected in the right EAC. AC, auditory cortex; EAC, external auditory canal; fNIRS, functional near-infrared spectroscopy; IR, infrared; PI, primary investigator.
Adapted functional near-infrared spectroscopy probes
We used two types of fNIRS probes to detect the region of interest (ROI; auditory cortex; defined below) in the current study – the regular cap probes, which clipped into a silicone rubber-built head band, and the adapted probes, which are built within a custom-made glass fiber/probe that was inserted into participant’s EAC (Fig. 1b). Adapted probes were modeled after those previously used by our team [13]. Two kinds of fibers are being used for either IR-source (illumination) or IR-detector (detection). The detector fiber is a borosilicate fiber bundle with a large diameter (2 mm), since a larger collection area is required for a small fNIRS signal through the brain. The source fiber contains two identical multi-mode fibers with 400 μm diameter. Catheter distal end design was composed of three components: resin ferrule to hold the fiber, two grooves to accommodate both IR-source and detector fibers, two right angle prisms for each fiber. Resin ferrule has an outer diameter of ~4.6 mm and two grooves with widths of ~2.3 mm and ~0.5 mm to fit the detector fiber bundle and source fibers, respectively. Right-angle prism (Tower Optical Corporation, FL) was used to rotate light 90° toward the superior EAC wall/inferior temporal lobe of brain. The entire distal end is >20 mm in length.
To house and stabilize the adapted probes within each human participant’s EAC and to maximize recording efficiency, we devised a customized method that employs injecting composite material for ear mold impression into the participants’ EAC. Once hardened just lateral to the ear drum (protected by a buffering piece of cotton), the EAC impression is removed, imaged with a CT scanner and subsequently 3D printed with biomedical compatible composite. The resultant composite housing is custom fit to each participant’s EAC anatomy. The housing is then smoothed and hollowed out to accommodate the adapted probe fiber and prism inserted through the center (Fig. 1b).
Functional near-infrared spectroscopy anatomical localization/region of interest selection
ROI included auditory cortex (temporal lobe/superior temporal plane) and surrounding association cortical regions (temporal and parietal cortices). Acknowledging the spatial resolution limits of fNIRS, anatomical [10–20 electroencephalography (EEG) system] and functional (normal brain response to auditory stimulation) strategies were utilized to identify ROI as we have previously used and published [7,8]. First, the International 10–20 System for EEG cap electrode placement with bilateral T3/T4 coordinates for temporal optode placements was employed to ensure appropriate recordings from the ROI [12]. Then, we used a 3D magnetic digitizer (Polhemus Patriot digitizer, Vermont, USA) to confirm the locations of the remaining optodes. We used the corresponding Brodmann areas based on the automatic anatomical labeling database and assigned a cortical region to each channel. Using AtlasViewer-GUI, we transformed the optode positions from the 3D digitizer using the Montreal Neurological Institute to create the graphical representations of the optode locations seen in the figures [8]. To enhance anatomic localization, several fNIRS reference points (IR-source and IR-detector locations from combined ‘cap’ and adapted probes) were used. Non-region of interest (non-ROI) was selected using published criteria to include an area immediately adjacent to ROI minus an additional channel (n − 1) [14]. For this study, the non-ROI corresponded to nodes within the visual (occipital lobe) cortex. The final probe configurations for both hemispheres including specific locations for the IR-source and IR-detectors for this study include left and right auditory cortex. The final configuration prior to recording involved the placement of the cap electrodes as described with the concurrent adapted fNIRS probe placed in the right EAC (Fig. 1a, b).
Stimuli protocol
To validate the probes, we sought to replicate the results of published work by using the same listening paradigm. Participants were engaged in a passive listening block-design paradigm protocol that consisted of periods (18 s of each condition) of silence [interstimulus rest (ISR)] or broadband noise (BBN) stimuli using Audacity (GNU General-Public License) and normalized with Praat 4.2 [15] (Fig. 2). Participants were instructed to stay awake and fix their eyes on a ‘+’ sign displayed on a black background of a computer screen to help keep their head still and avoid motion artifact. Auditory stimuli were presented via E-Prime (Psychology Software Tools Inc., Pittsburgh, PA, USA) and played at a standard fixed volume through two loudspeakers placed at a distance approximately 2 feet from the participant in a sound-field orientation that was held constant at 70 dB sound pressure level (SPL; Creative Inspire T12). This configuration achieved a consistent SPL given participant selection criteria that included an SRT range of 10–20 dB and comparable PTAs. Participants were instructed to simply sit and listen. The first half of the experiment was conducted where the adapted probe served as an IR-source and was repeated with the adapted probe serving as an IR-detector. Five minutes of silence was presented before and after the block stimulation/rest (BBN/ISR) paradigm (Fig. 2) because this length of time is necessary to obtain an accurate measure of RSFC. The 5 min pre- and post-algorithm silence periods were repeated after the adapted probe was switched from IR-source to IR-detector. The hemodynamic response data recorded during the stimulation portion of the paradigm will be analyzed in a separate article. This paradigm was not designed to analyze functional connectivity during noise stimulation since this would require that noise be presented to the participants for 5 min. Such a paradigm may be used in future investigations. In this proof of concept work, we only recorded from the right EAC due to limitation in resources (e.g. only one working probe, the use of custom EAC impressions, etc.). Additionally, since all participants had bilateral tinnitus, it was deemed that bilateral recordings did not add anything significant to the current study.
Fig. 2.
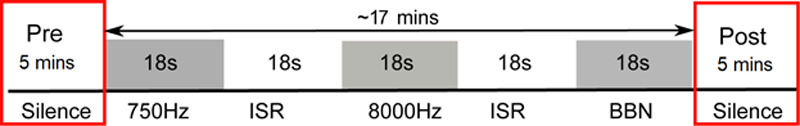
Schematic of auditory testing block paradigm. Control and tinnitus participants passively listened to BBN for 18 s each, immediately followed or preceded by an ISR consisting of silence/absence of auditory stimulation for 18 s for a total experiment run time of 17 min. Each paradigm was repeated nine times. Prior to and after the recording block/stimulation protocol, each participant listened to 5 min of silence to calculate the RSFC. BBN, broadband noise; ISR, interstimulus rest period; RSFC, resting-state functional connectivity.
Data analysis and statistics: resting-state functional connectivity
For RSFC analysis, the 5-min prestimulation and 5-min poststimulation periods of silence were extracted from recordings. The raw data were then processed and analyzed using the NIRS Brain AnalyzIR toolboxes [16]. The data were down-sampled to 5 Hz, then converted to optical density, and finally the Beer-Lambert Law was applied to obtain HbO and HbR data. To calculate the Pearson correlation coefficients (R), the built-in ‘connectivity’ module of the NIRS Toolbox was used. This connectivity function utilizes an autoregressive correlation function to help mitigate the confounding effects of physiologic phenomena that can lead to false positive results [17]. Each R value quantifies the correlation between two channels’ hemodynamic data, a proxy for RSFC. An R value of 1 indicates perfect positive correlation, an R value of 0 indicates no correlation, and an R value of −1 indicates perfect negative correlation. Once all connectivity values were calculated, they were then transformed using Fisher’s transformation (e.g. the inverse hyperbolic tangent function), which is a stabilizing function to correct for the fact that the variance of Pearson correlation coefficients changes depending on the proximity to 0 [18]. Once the data was normalized through this transformation, usual mathematical functions (e.g. addition, subtraction, mean) could be applied to the data. A two-tailed Student’s t-test was then applied to obtain the P-values. Once statistical analyses were completed, values were transformed back to R values using the inverse Fisher transformation (e.g. hyperbolic tangent function), and these are the RSFC values reported.
For analysis, we grouped specific channels into specific brain regions according to anatomical location. To determine the anatomical locations of these channels, our cap that houses the optodes was placed on a model. A 3D magnetic digitizer (Polhemus Patriot digitizer, Vermont, USA) was then used to accurately determine the location of each optode in 3D space, with reference regarding five points (nasion, inion, right and left pre-auricular points, and midpoint of crown of the head), from International 10–20 system [19]. Using the automatic anatomic labeling database, the corresponding Brodmann Area was assigned to each channel. For the purposes of graphing the data onto models of the brain, Montreal Neurological Institute coordinates were then determined using the MATLAB-based software AtlasViewer-GUI [11,20].
Results
Behavioral data analyses
Within control participants, the average SRT was 15 dB with an average WDS of 100%, while the tinnitus group had an average SRT of 16.5 dB and 98.3% WDS. Independent t-tests indicated no significant differences in either hearing thresholds or age between tinnitus and control participants.
Resting-state functional connectivity
To verify the integrity of the new measurements and extend prior findings, we analyzed RSFC data using the channels of the cap configuration [8]. The connectivity data were analyzed for the trials using in-EAC IR-source-only probe and for the in-EAC IR-detector-only probe individually. These data were then compared and there were no differences in any RSFC values for the cap configuration channels measured, indicating that there was good intertrial reliability (the data of the channels from the cap should not be affected by the type of in-EAC adapted probe used). Given this finding, the cap data were then combined to increase the power of the data (by including data that can be thought of as to two trials for each participant) and for the simplicity of reporting the data. As an example, the prestimulation RSFC between the left and right auditory cortex for tinnitus participants were 0.400 in the IR-detector only trial and 0.398 in the IR-source only trial. Instead, we would report the combined value of 0.399. Once we confirmed the data to be validated, we then analyzed the connectivity of the channels obtained with the two types of probes (IR-source-only vs. IR-detector-only).
Standard functional near-infrared spectroscopy measurement (cap probes)
The RSFC of the ROIs to the various superficial cortical (nonauditory; non-ROI) regions were measured for both control and tinnitus. Both control and tinnitus participants demonstrated statistically significant RSFC to the frontal, fronto-temporal and fronto-parietal regions (all measured regions involving the frontal lobe; Table 1). Additionally, tinnitus participants demonstrated statistically significant connectivity to the temporal, temporo-parietal, temporo-occipital and parietal regions. These were all significant in both the pre- and post-stimulation conditions (5-min silence periods before and after the block silence-BBN stimulation paradigm) and none of the changes from pre- to post-stimulation were significantly different (Table 1). These results indicate that ROI (auditory cortex) in tinnitus participants are connected to more nonauditory cortical brain regions around them than in controls (Fig. 3a).
Table 1.
Connectivity between auditory cortex and other nonauditory brain cortices is increased in tinnitus
| Control | Tinnitus | ||
|---|---|---|---|
| Frontal | Pre | 0.3104* | 0.4212* |
| Post | 0.3143* | 0.4173* | |
| Fronto-temporal | Pre | 0.3411* | 0.4659* |
| Post | 0.3561* | 0.4668* | |
| Fronto-parietal | Pre | 0.2866* | 0.4039* |
| Post | 0.2938* | 0.4127* | |
| Temporal | Pre | 0.1739 | 0.2819* |
| Post | 0.1791 | 0.2755* | |
| Temporo-parietal | Pre | 0.1573 | 0.2959* |
| Post | 0.1568 | 0.2958* | |
| Temporo-parieto-occipital | Pre | 0.0612 | 0.1997 |
| Post | 0.0529 | 0.1992 | |
| Temporo-occipital | Pre | 0.1095 | 0.2262* |
| Post | 0.1106 | 0.225* | |
| Parietal | Pre | 0.1696 | 0.3074* |
| Post | 0.1701 | 0.3104* |
RSFC between AC (ROI) and nonauditory cortical regions captured by the cap configuration probes during the pre- and post-stimulation (block paradigm) recordings for control and tinnitus participants (*denotes statistically significant RSFC; P < 0.05).
AC, auditory cortex; ROI, region of interest; RSFC, resting-state functional connectivity.
Fig. 3.
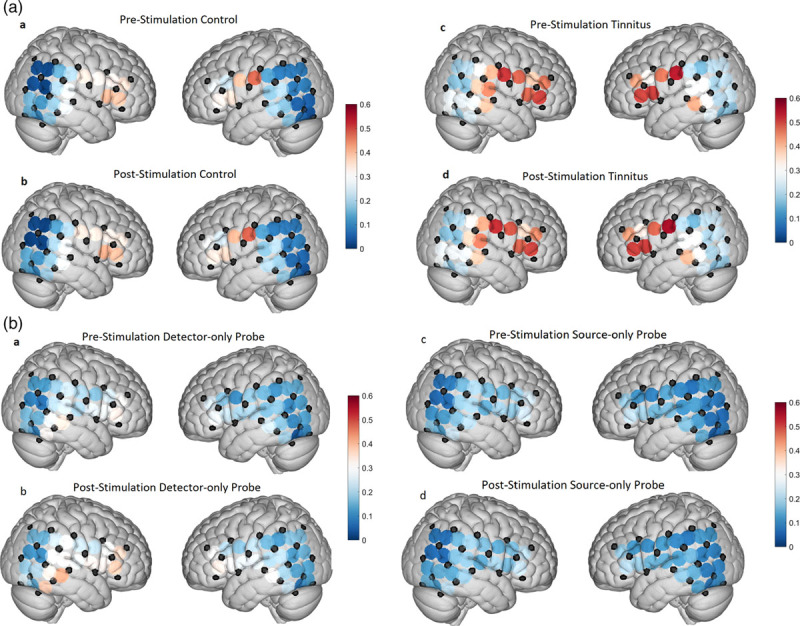
(a) Increased RSFC in the tinnitus brain. Graphical representation of both right and left hemispheres showing RSFC across the fNIRS channels using the cap configurations. Left-hand pairs show pre- and post-test algorithm RSFC between control participants (left) and the pre- and post-stimulation for tinnitus participants (right). Cooler colors (blues) represent less RSFC at various fNIRS nodes, while the warmer colors (orange/red) represent increased RSFC. Note the increased RSFC in the tinnitus brains as compared to control. These data largely reproduce our previously published findings (9). (b) RSFC is measurable but largely unchanged using adapted fNIRS probes. Graphical representation of both right and left hemispheres showing RSFC between fNIRS cap channels and the adapted probes fitted for the right EAC. Left-hand pairs show pre- and post-test algorithm RSFC between control participants and the right-hand pairs for tinnitus participants. Cooler colors (blues) represent less RSFC at various fNIRS nodes, while the warmer colors (orange/red) represent increased RSFC. Note that while no significant changes in ROI RSFC were detected using the adapted probes, we measured meaningful RSFC data. The lack of significant changes in RSFC between control and tinnitus using the adapted probes may reflect as expected inadequate IR penetration to more fNIRS nodes distributed across the scalp as well as the high likelihood of subcortical light penetration by the adapted IR-source that is not adequately detected by a scalp/cap detector. EAC, external auditory canal; fNIRS, functional near-infrared spectroscopy; IR, infrared; ROI, region of interest; RSFC, resting-state functional connectivity.
New adapted probe functional near-infrared spectroscopy measurement (external auditory canal probes)
Next, we analyzed the RSFC of the channels involving the adapted probes placed in the right-side EAC. In this analysis, each adapted probe configuration has three channels: the IR-source-only probe matched with the three closest detectors on the scalp, and IR-detector-only probe matched with the three closest sources on the scalp. We calculated the R value for each probe channel’s connectivity to all other channels. We then grouped individual channels into regions in similar fashion as above and then calculated the average RSFC of the probe channels to each of these regions (Table 2). Figure 3b displays the RSFC of one individual probe channel to every single other channel, including those from the scalp/cap configuration. The two channels shown in Fig. 3b were selected as they demonstrated connectivity values similar in magnitude to those seen among the channels of the scalp/cap configuration. Interestingly, none of the adapted probe channels, neither individually nor combined, showed a statistically significant connection to any of the regions. The connectivity of channel 46 to the ROI in tinnitus participants in the post-stimulation condition of the IR-detector-only trial approached significance with a P-value of 0.0604. None of the channels involving the adapted probes showed a statistically significant RSFC to each other, indicating that they were measuring from separate regions.
Table 2.
Connectivity between auditory cortex and other nonauditory cortices can be measured using functional near-infrared spectroscopy probes adapted to the external auditory canal
| Control | Tinnitus | ||||||||
|---|---|---|---|---|---|---|---|---|---|
| All detector channels |
Detector ch. 46 |
All source channels |
Source probe ch. 27 |
All detector channels |
Detector ch. 46 |
All source channels |
Source probe ch. 27 |
||
| Aud Cx | Pre | 0.0692 | 0.1908 | 0.078 | 0.1600 | 0.1017 | 0.2334 | 0.0802 | 0.1596 |
| Post | 0.0720 | 0.1933 | 0.0679 | 0.1441 | 0.1261 | 0.2993* | 0.0762 | 0.1508 | |
| Frontal | Pre | 0.1296 | 0.3425 | 0.1168 | 0.2597 | 0.0955 | 0.2640 | 0.0946 | 0.2004 |
| Post | 0.1190 | 0.3101 | 0.1097 | 0.2272 | 0.1176 | 0.3131 | 0.0930 | 0.1890 | |
| Fronto-temporal | Pre | 0.1010 | 0.2613 | 0.0910 | 0.1971 | 0.0899 | 0.2440 | 0.0858 | 0.1822 |
| Post | 0.0965 | 0.2507 | 0.0888 | 0.1827 | 0.1110 | 0.3026 | 0.0829 | 0.1754 | |
| Fronto-parietal | Pre | 0.0673 | 0.1496 | 0.0634 | 0.1371 | 0.0758 | 0.1678 | 0.0686 | 0.1375 |
| Post | 0.0716 | 0.1546 | 0.0560 | 0.1183 | 0.0892 | 0.2159 | 0.0695 | 0.1362 | |
| Temporal | Pre | 0.0902 | 0.2271 | 0.0712 | 0.1508 | 0.0830 | 0.2251 | 0.0780 | 0.1484 |
| Post | 0.0879 | 0.2288 | 0.0720 | 0.1512 | 0.0974 | 0.02647 | 0.0725 | 0.1445 | |
| Temporo-parietal | Pre | 0.0558 | 0.1304 | 0.0500 | 0.1039 | 0.0681 | 0.1657 | 0.0651 | 0.1280 |
| Post | 0.0575 | 0.1291 | 0.0456 | 0.0938 | 0.0833 | 0.2092 | 0.0625 | 0.1269 | |
| Temporo-parieto-occipital | Pre | 0.0285 | 0.0642 | 0.0218 | 0.0496 | 0.0495 | 0.1270 | 0.0461 | 0.0832 |
| Post | 0.0277 | 0.0562 | 0.0256 | 0.0515 | 0.0578 | 0.1498 | 0.0447 | 0.0892 | |
| Temporo-occipital | Pre | 0.0527 | 0.1360 | 0.0606 | 0.1356 | 0.0541 | 0.1506 | 0.0611 | 0.1207 |
| Post | 0.0513 | 0.1367 | 0.0564 | 0.1206 | 0.0697 | 0.1910 | 0.0634 | 0.1291 | |
| Parietal | Pre | 0.0695 | 0.1550 | 0.0566 | 0.1233 | 0.0767 | 0.1958 | 0.0705 | 0.1528 |
| Post | 0.0686 | 0.1492 | 0.0518 | 0.1095 | 0.0920 | 0.2246 | 0.0707 | 0.1465 | |
RSFC of the adapted probes to the identified cortical regions for control and tinnitus participants during pre- and post-stimulation conditions. Shown is the combined RSFC of three channels associated with each probe (e.g. all detector channels, all source channels) as well as the individual channel for each probe. These specific channels’ data were selected for display as they were the channel within each probe that demonstrated the highest RSFC. The RSFC values of these channels were like those channels from the cap configuration, while the RSFC values of the other two channels within each probe were all close to zero (as can be seen by the mean value connectivity being much lower than the individual channel displayed). None of these connections were statistically significant, although channel 46 in the post-stimulation condition in tinnitus participants (*) approached significance with a P-value of 0.0604.
AC, auditory cortex; ROI, region of interest; RSFC, resting-state functional connectivity.
We then proceeded to identify the channels with the highest level of RSFC to each of the adapted probe channels (Table 3). None of these connections were found to be statistically significant; however, some do approach significance (channel 27 of the IR-source probe to channel 29). The adapted probe channels tended to be most connected to those channels in the temporo-occipital and in the frontal region. It should be noted that the RSFC of one of the channels for each probe showed higher values than the other two. The channels with the higher RSFC values were the ones that had the partner optode the shortest distance away. It is possible that these results indicate that the other two channels were recording from deeper brain areas that have lower RSFC to the outer cortical regions.
Table 3.
Adapted external auditory canal probes show capacity to measure resting-state functional connectivity
| Controls | Tinnitus | ||||
|---|---|---|---|---|---|
| Pre | Post | Pre | Post | ||
| Source ch. 25 | Chann | 48 | 29 | 48 | 39 |
| R | 0.0377 | 0.0421 | 0.0343 | 0.0305 | |
| P | 0.8765 | 0.8620 | 0.8875 | 0.8999 | |
| Source ch. 26 | Chann | 31 | 28 | 28 | 28 |
| R | 0.0663 | 0.0692 | 0.0789 | 0.0804 | |
| P | 0.7844 | 0.7751 | 0.7446 | 0.7397 | |
| Source ch. 27 | Chann | 49* | 49* | 28 | 28 |
| R | 0.4295* | 0.3979* | 0.2410 | .2283 | |
| P | 0.0583* | 0.0825* | 0.3107 | 0.3379 | |
| Detector ch. 32 | Chann | 36 | 36 | 36 | 35 |
| R | 0.1075 | 0.1079 | 0.0960 | 0.0798 | |
| P | 0.6563 | 0.6553 | 0.6913 | 0.7416 | |
| Detector ch. 37 | Chann | 41 | 39 | 39 | 41 |
| R | 0.0831 | 0.0684 | 0.0477 | 0.0553 | |
| P | 0.7311 | 0.7776 | 0.8439 | 0.8196 | |
| Detector ch. 46 | Chann | 29* | 49 | 47 | 47* |
| R | 0.4043* | 0.3536 | 0.3400 | 0.4071* | |
| P | 0.0771* | 0.1276 | 0.1443 | 0.0748* | |
The channels that demonstrated the strongest RSFC to each of the probe channels for the pre- and post-stimulation conditions in both tinnitus and control participants. None were statistically significant (*denotes those approaching significance; 0.10 > P-value > 0.05).
RSFC, resting-state functional connectivity.
Discussion
We have successfully fabricated, modified and implemented the use of a highly innovative adaptation of conventional fNIRS ‘cap’ probes to the EAC for human recordings. This novel adaptation is the first of its kind and may expand brain surveillance using fNIRS technology going forward by adapting the IR-source and IR-detector pair of ‘cap’ probes deeper within the skull through the EAC. These adapted probes are reliably and safely inserted into the EAC. Similar to the traditional ‘cap’ fNIRS probes recording over both ROI and non-ROI superficial cortical regions, the probe demonstrated the capacity to record RSFC, but from different, likely deep cortical, locations never before recorded using fNIRS [7,8]. Here, we have successfully recorded from 20 tinnitus and 20 control participants using the adapted probes and concurrent ‘cap’ probes to measure RSFC.
The neuroscience underlying tinnitus is a complex and dynamic set of interacting neural networks and subnetworks involving multiple cortical and subcortical areas [21]. For example, in drawing analogies to phantom pain/limb perception, it has been proposed that complex interactions of the somatosensory systems with the frontal lobe may play a key role regarding the perception and the negative associations of tinnitus [22]. Furthermore, recent work has demonstrated that hubs and networks involving deeper subcortical areas play a crucial role in the neurophysiology of tinnitus. As an example, deafferentation can lead to maladaptive mechanisms that result in thalamocortical dysrhythmia that may be directly related to the phantom perception of sound reaching conscious awareness [10]. Given this complexity, it is imperative for the advancement of the field to take advantage of a variety of tools and innovative methods that can help increase brain surveillance.
fNIRS technology is an emerging research tool for human brain imaging studies related to central auditory and tinnitus research since it is essentially silent and does not confound the recording environment. The technology utilizes IR transmission and absorption of brain hemoglobin concentration as a surrogate or indirect measure for neural activity. Due to limitations to the depth of penetration, fNIRS technology could not be used to investigate deeper cortical structures potentially crucial to tinnitus perception. Here, we demonstrate the use of probes uniquely adapted to fit within the EAC in order to record from areas that could previously not be reached by current fNIRS technology.
Unique contribution of adapted probes to tinnitus understanding: resting-state functional connectivity
We published the utility of fNIRS to measure RSFC between human auditory cortex and nonauditory regions after auditory stimulation [8]. RSFC is the association of baseline activity between two cortical brain regions. RSFC can serve as a proxy for connectivity among large scale networks, but it is not synonymous with anatomical connections, and certainly does not assess individual neuron activity. With RSFC, we obtain spatiotemporal patterns of hemodynamic cortical responses across brain regions, which reflect plastic changes that play a role in both adaptive and maladaptive conditions. RSFC, therefore, may represent contextual influences of connections involved in specific brain processing and connections between regions likely to coordinate neural activity.
Using the traditional ‘cap’ probes, we currently showed that both control and tinnitus groups demonstrated significant RSFC to frontal, fronto-temporal and fronto-parietal regions (all measured regions involving the frontal lobe). As expected from our previous work, tinnitus participants demonstrated significant RSFC to the temporal, temporo-parietal, temporo-occipital and parietal regions [8]. These were significant in pre- and post-stimulation conditions and with no changes from pre- to post-stimulation. These results indicate that auditory cortex in tinnitus participants is connected to more brain regions than in nontinnitus controls. These results are congruent with the hypothesis that tinnitus perception may also be generated by nonauditory brain regions that are connected to auditory cortex neurons.
When we evaluated RSFC using probes adapted to the EAC, two channels demonstrated connectivity values similar in magnitude to those seen among the channels of the ‘cap’ configuration. However, none of the probe channels, neither individually nor combined, showed a statistically significant connection to any of the regions. None of the channels involving the probes showed a statistically significant connectivity to each other, indicating that they were measuring from separate regions. The probe channels tended to be most connected to those channels in the temporo-occipital and in the frontal region. Again, it should be noted that one of the channels for each probe showed higher values than the other two. The channels with the higher connectivity values were the ones that had the partner optode the shortest distance away. Given that we can capture hemodynamic data (with excellent wave-form correlations between scalp and adapted probes; data not shown) using the adapted probes suggests that the adapted probes were recording neural activity and possibly from deeper brain areas that have lower connectivity to the outer cortical regions. Moreover, the anatomic location of auditory cortex deep in the superior temporal gyrus is directly superiorly to the vector of IR light delivered from the adapted probe through the EAC and skull base. To reach auditory cortex, IR light along that axis must pass through subcortical portions of the temporal lobe. Our ability to calculate RSFC from auditory cortex detectors given that pathlength of IR light from the adapted probe IR-source is highly suggestive that it has taken a deeper, subcortical course. The fact that we can detect RSFC that is NS may therefore be a limitation of the IR detector, not the IR-source, in detecting light from subcortical brain. This represents the potentially most novel and powerful component of the present study in that for the first time, fNIRS probes may potentially be recording from subcortical structures. Future studies utilizing multi-sourced probes in the EAC to enhance IR penetration with increased local IR-detectors will be required to triangulate these changes to better ascertain exactly where RSFC is located.
While we did not show a significant RSFC between ROI and non-ROI cortices with the adapted probes, an increasing trend in RSFC suggests that in both the pre- and post-stimulation tinnitus brain that multi-sensory networks may contribute to phantom sound perception. This concept is supported by our results that show increased RSFC between the ROI and the frontal, temporal and occipital lobes in tinnitus. These findings are consistent with the notion that increased RSFC exists in the frontal and temporal lobe of tinnitus brains [23]. Increased RSFC of the ROI with multiple brain areas suggests that nonauditory cortices play a significant role in sound processing and perception in tinnitus [5,24].
Future directions
Given the early stages of development of this new technology, there is certainly significant room for further sophistications. For example, the EAC allows for recordings to be performed in a variety of angles and depths of insertion. Validation of the anatomical information afforded by these permutations should be performed by co-registering the device with current state of the art technology, such as fMRI. Streamlining the production and cost of production will also be key aspects that will be addressed in future versions to make the technology more accessible to researchers and clinicians. Furthermore, the probes should also be used to investigate responses to other listening paradigms.
Current limitations
One limitation of this study is the interpretability of optical imaging data due to anatomic variability in the bony skull base between the superior aspect of the EAC and the temporal lobe of the brain. Given that the skull floor/roof of the ear canal is not always solidified bone, variable pneumatization may indeed affect the amount and direction of IR light penetration for IR-source and IR-detectors. That said, the current hemodynamic data demonstrates that neural activity was recorded; however, anatomic variability in the skull base will need to be more closely examined in future studies to better disclose true limitations of the adapted probe design. The imaging processing step utilizing spatial normalization is often used in fMRI or PET to standardize optical imaging given variability in human brain size and morphology. This approach was not utilized in our current study and going forward, we plan to implement these concurrent technologies along with more sophisticated adaptations of the EAC probes to utilize multiple IR-sources and scalp detectors to better triangulate signal within the recorded temporal lobe.
Conclusion
We have successfully designed, fabricated and tested the first known adapted fNIRS technology to fit in the EAC to measure RSFC in auditory cortex in normal human brain and in those with tinnitus. This novel and highly innovative adaptation may provide for a broadened and noninvasive means to image the brain utilizing fNIRS technology. Future studies using more sophisticated versions of this initial adapted probe design will provide more effective means to study disease affecting the human brain beyond the auditory cortex and tinnitus.
Acknowledgements
The authors would like to thank the Center for Human Growth and Development for the availability and use of the fNIRS lab and equipment to conduct this study.
The study was supported by an R21 NIH grant from the National Institutes of Deafness and Communication Disorders [Tinnitus and Auditory Cortex; Using Adapted Functional Near-Infrared Spectroscopy to Measure Neural Correlates in Humans (National Institutes of Health R21-A1; R21DC016456)].
Conflicts of interest
There are no conflicts of interest.
References
- 1.Noreña AJ, Eggermont JJ. Changes in spontaneous neural activity immediately after an acoustic trauma: implications for neural correlates of tinnitus. Hear Res. 2003; 183:137–153 [DOI] [PubMed] [Google Scholar]
- 2.Ferrari M, Quaresima V. A brief review on the history of human functional near-infrared spectroscopy (fNIRS) development and fields of application. Neuroimage. 2012; 63:921–935 [DOI] [PubMed] [Google Scholar]
- 3.Ayaz H, Onaral B, Izzetoglu K, Shewokisa P, McKendrick R, Parasuraman R. Continuous monitoring of brain dynamics with functional near infrared spectroscopy as a tool for neuroergonomic research: empirical examples and a technological development. Front Hum Neurosci. 2013; 7:871. [DOI] [PMC free article] [PubMed] [Google Scholar]
- 4.Huppert T, Hoge R, Diamond S, Franceschini M, Boas D. A temporal comparison of BOLD, ASL, and NIRS hemodynamic responses to motor stimuli in adult humans. Neuroimage. 2006; 29:368–382 [DOI] [PMC free article] [PubMed] [Google Scholar]
- 5.Fox MD, Raichle ME. Spontaneous fluctuations in brain activity observed with functional magnetic resonance imaging. Nat Rev Neurosci. 2007; 8:700–711 [DOI] [PubMed] [Google Scholar]
- 6.Bisconti S, Shulkin M, Hu X, Basura G, Kileny P, Kovelman I. Functional near-infrared spectroscopy brain imaging investigation of phonological awareness and passage comprehension abilities in adult recipients of cochlear implants. J Speech Lang Hear Res. 2016; 59:239–253 [DOI] [PubMed] [Google Scholar]
- 7.Issa M, Bisconti S, Kovelman I, Kileny P, Basura G. Human auditory and adjacent non-auditory cortices are hyper-metabolic in tinnitus as measured by functional near-infrared spectroscopy (fNIRS). Neural Plast. 2016; 2016:1–13 [DOI] [PMC free article] [PubMed] [Google Scholar]
- 8.San Juan J, Xiao-su H, Issa M, Bisconti S, Kovelman I, Kileny P, Basura G. Tinnitus alters state functional connectivity (RSFC) in human auditory and non-auditory brain regions as measured by functional near-infrared spectroscopy (fNIRS). PLOS One. 2017; 12:1–20 [DOI] [PMC free article] [PubMed] [Google Scholar]
- 9.Leaver AM, Renier L, Chevillet MA, Morgan S, Kim HJ, Rauschecker JP. Dysregulation of limbic and auditory networks in tinnitus. Neuron. 2011; 69:33–43 [DOI] [PMC free article] [PubMed] [Google Scholar]
- 10.De Ridder D, Vanneste S, Langguth B, Llinas R. Thalamocortical dysrhythmia: a theoretical update in tinnitus. Front Neurol. 2015; 6:124. [DOI] [PMC free article] [PubMed] [Google Scholar]
- 11.Aasted CM, Yücel MA, Cooper RJ, Dubb J, Tsuzuki D, Becerra L, et al. Anatomical guidance for functional near-infrared spectroscopy: AtlasViewer tutorial. Neurophotonics. 2015; 2:020801. [DOI] [PMC free article] [PubMed] [Google Scholar]
- 12.Klem G, Luders H, Jasper H, Elger C. The ten-twenty system of the International Federation. The International Federation of clinical neurophysiology. Electroencephalogr Clin Neurophysiol Suppl. 1999; 52:3–6 [PubMed] [Google Scholar]
- 13.Alexander VV, Shi Z, Iftekher F, Welsh MJ, Gurm HS, Rising G, et al. Renal denervation using focused infrared fiber lasers: a potential treatment for hypertension. Lasers Surg Med. 2014; 46:689–702 [DOI] [PubMed] [Google Scholar]
- 14.Plichta MM, Gerdes AB, Alpers GW, Harnisch W, Brill S, Wieser MJ, Fallgatter AJ. Auditory cortex activation is modulated by emotion: a functional near-infrared spectroscopy (fNIRS) study. Neuroimage. 2011; 55:1200–1207 [DOI] [PubMed] [Google Scholar]
- 15.Boersma P, Weenink D. Praat: doing phonetics by computer (Version 4.3.02). 2004 http://www.praat.org/
- 16.Santosa H, Zhai X, Fishburn F, Huppert T. The NIRS brain AnalyzIR toolbox. Algorithms. 2018; 11:73. [DOI] [PMC free article] [PubMed] [Google Scholar]
- 17.Huppert T. Commentary on the statistical properties of noise and its implication on general linear models in functional near-infrared spectroscopy. Neurophotonics. 2016; 3:010401. [DOI] [PMC free article] [PubMed] [Google Scholar]
- 18.Fisher RA. Frequency distribution of the values of the correlation coefficient in samples from an indefinitelylarge population. Biometrika. 1915; 10:507–521 [Google Scholar]
- 19.Tsuzuki D, Dan I. Spatial registration for functional near-infrared spectroscopy: from channel position on the scalp to cortical location in individual and group analyses. Neuroimage. 2014; 85Pt 192–103 [DOI] [PubMed] [Google Scholar]
- 20.Fonov V, Evans A, McKinstry R, Almli C, Collins D. Unbiased nonlinear average age-appropriate brain templates from birth to adulthood. Neuroimage. 2009; 31:47-S102 [Google Scholar]
- 21.De Ridder D, Vanneste S, Weisz N, Londero A, Schlee W, Elgoyhen AB, Langguth B. An integrative model of auditory phantom perception: tinnitus as a unified percept of interacting separable subnetworks. Neurosci Biobehav Rev. 2014; 44:16–32 [DOI] [PubMed] [Google Scholar]
- 22.Ridder DD, Elgoyhen AB, Romo R, Langguth B. Phantom percepts: Tinnitus and pain as persisting aversive memory networks. Proc Natl Acad Sci. 2011; 108:8075–8080 [DOI] [PMC free article] [PubMed] [Google Scholar]
- 23.Chen Y, Wang F, Jie Wang F, Xia W, Gu J, Yin X. Resting-state brain abnormalities in chronic subjective tinnitus: a meta-analysis. Frontiers Hum Neurosci. 2017; 11:1–12 [DOI] [PMC free article] [PubMed] [Google Scholar]
- 24.Engel A, Fries P, Singer W. Dynamic predictions: oscillations and synchrony in top–down processing. Nat Rev Neurosci. 2001; 2:704–716 [DOI] [PubMed] [Google Scholar]