

Abstract
Concerns have been raised that the increase in popular interest in genetics may herald a new era within which racial inequities are seen as ‘natural’ or immutable. In the following study, we provide data from a nationally representative survey on how the US population perceives general ability, athleticism, and intellect being determined by race and/or genetics and whether they believe racial health inequities to be primarily the product of genetic or social factors. We find that self-described race is of primary importance in attributing general ability to race, increasing age is a significant factor in attributing athleticism and intellect to genes and race, and education is a significant factor in decreasing such racially and genetically deterministic views . Beliefs about the meaning of race are statistically significantly associated with respect to the perception of athletic abilities and marginally associated with the perception of racial health inequalities being either socially or genetically derived. Race, education, socioeconomic status, and concepts of race were frequently found to be multiplicative in their statistical effects. The persistent acceptance of a genetically and racially deterministic view of athleticism among the White and older population group is discussed in respect to its social impact, as is the high level of agreement that general abilities are determined by race among non-White respondents and those of lower socioeconomic status. We argue that these findings highlight that both biological and non-biological forms of understanding race continue to play a role into the politics of race and social difference within contemporary US society.
Keywords: Race, Genetics, Causality, Health, Determinism, Inequity
Introduction
The following study is grounded in questions and concerns about the reification of race as if it were a marker of genetic and/or biological difference. More than this, our objective is to explore - through the collection of empirical data - whether different sectors of the US population think differently about race and genetics as they pertain to generalizable abilities, athleticism, intellect, and differences in health. While concerns abound regarding the impact of popular thinking about genetics upon concepts of race and racialized thinking, empirical data is by no means plentiful (see Condit and Bates 2005; Jayaratne et al. 2006 for similar arguments regarding the lack of empirical data on how genetics might impact upon public understandings of race). In light of the continued use of race within popular and scientific discourse, and the continued association between race and genetics in the media and across multiple public platforms it is an important time to re-assess what the general public believes to be axiomatic about race and genetics.
Fundamental to the question of how race is perceived is the degree to which people believe races to be genetically and biologically distinct. Lewontin’s 1972 experiment utilizing protein electrophoresis examined this question for humans and found that the genetic diversity within purported human racial groups was greater than that between them (Lewontin 1972). This result has been consistently repeated by a number of researchers utilizing ever improving technologies (e.g. restriction fragment length polymorphisms, microsatellites, and whole genome sequencing; Barbujani and Colona 2010; Graves 2015a; Molnar 2015; Nei & Rovchoudhurv 1974; Fujimura & Rajagopalan 2011; Fujimura et al. 2014; Jorde and Wooding 2004). This result means that there is no unambiguous way to apportion human populations into biological races (Templeton 2013; Graves 2015). However, despite these studies there has been a renewed interest in the minority of genetic variation that is associated with supposed racial difference. As Byrd and Ray (2015) recount, “as ‘racial essentialism’ (the belief that certain biological traits and social behaviors were linked and constitute the ‘essence’ of a certain racial group) was laid to rest, it was simultaneously reborn in the quest to identify genetic differences based on socially constructed categories.” As a result, genetics and genomics have once more become intimately tied to notions of race (Bliss 2015; Reardon 2009; Williams 2016). More broadly, the general public has widely differing views concerning the degree to which genetic variation is shared or differentiated between racial groups, views that may well impact upon their social interactions with other racial groups (Plaks et al., 2012; Kang, Plaks, & Remedios, 2015; Williams & Eberhardt, 2008).
The rise in popular interest in genetics and its potential implications for popular and expert understandings of race has been well documented (Bliss 2015; Duster, 2003 & 2015; Koenig et al. 2008; Reardon, 2009; Wailoo et al. 2012; Whitmarsh and Jones 2010). As part of the continuing effort to educate the media and general public about the dangers of viewing race as a biological (genetic) construct or category, historians and critics of race as a biological categorv have pointed out that the concept race pre-dates what we would now call biology, emerging as it did in written form in the 17th Century. This concept was further developed in the 18th Centurv beginning with Linnea us’s classification of humans into four varieties, Homo sapiens europeaus, H. sapiens asiaticus, H. sapiens americanus, and H. sapiens afer. While Linneaus felt that these varieties could be arranged hierarchically with europeaus at the pinnacle and afer in the abyss, there was no general agreement among naturalists with respect to race until the 19th Century. Throughout this process, naturalists highlighted the intimate ties between race and social inepuities. This became part and parcel of their justification for the colonization and exploitation of the so-called inferior races (Brace 2005; GouId 1994; Graves 2015a; Marks 2001 and 2003; Montague 2001; Revnolds, 1992; Smedl ev 1999; Smedlev and Smedlev 2005). Furthermore, scientific race and scientific racism (the search for biological rationale for why some people must be seen as inferior) became integral to the justification of colonialism, enslavement, national dominance, and class domination (Brace 2005; Gould 1994, 1996; Graves 2004). Even with the ending of slavery in the US and the UK, some scientists continued to attempt to prove the inferiority of non-Whites (and the ‘lower classes’) in ways that would justify discriminatory practices as not only excusable but in accordance with nature (Alland 2002; Gould 1994, 1996; Jackson and Weidman 2004). As such, not only is the question of how the public comes to understand race an issue concerned with knowledge — knowledge about the history of race and knowledge of human genetic variation in particular — it is also an issue of political expediency. To what degree to people perceive racial difference to be accordance in their existing worldviews and experiences, and how do these differences in perception play out in maintaining or resisting the dominant social order?
Data and Methods
Survey Measures
Survey development was a collaborative effort among investigators at Duke University, Carolina Survey Research Laboratory (CSRL) at the University of North Carolina, Chapel Hill, and the Department of Anthropology at the University of Oklahoma. The survey comprised nine parts, totaling 90 questions: 1) Awareness of and familiarity with genetic ancestry testing; 2) Race, ethnicity, and ancestry; 3) Degree of genetic relativism; 4) Relationships between race and genetics; 5) Knowledge of biological ancestry; 6) Interest in genetic ancestry testing; 7) Perspectives about genetic ancestry testing; 8) Ethnic identity; and 9) Demographics.
Survey Pilot
The CSRL conducted a pilot test (n=57) of the proposed survey instrument between July 22 and August 22, 2013. We oversampled Black and Hispanic populations to increase “racial” and ethnic diversity and sampled from the US Eastern Seaboard. The pilot was used to assess the robustness of the computer-assisted telephone interviewing (CATI) programing, the reliability of proposed scales, as well as the ability of individual items to discriminate. Adults 21 years of age or older were randomly selected within households to participate. Behavioral coding was conducted during the pilot survey to identify potential problems with survey items as well as to document other administration barriers (Lessler and Forsyth 1996). Revisions were made to the survey to minimize redundancy, clarify intention of questions, and reduce length. In addition, scale items were reduced until they loaded satisfactorily on the constructs being measured and they performed consistently (Cronbach alpha e .70) (DeVellis 2016).
Sampling Methods
For the national survey, two independent and non-overlapping telephone frames were used within the continental USA. Half of the sample came from a random-digit-dial (RDD) frame to include broad coverage of all US households. The other half came from electronic white pages (EWP) listings to target Black households. Both frames were stratified by census region to ensure proportionate representation nationwide and were supplied by a reputable sampling vendor (Marketing Systems Group, Horsham, P A). After low response rates from Hispanics in the pilot, the decision was made to not oversample or translate the survey into Spanish as a cost-reduction measure. To be considered eligible, a telephone number needed to reach a household with an English-speaking resident 21 years old or older. If more than one eligible adult resided in the household, one was randomly selected. Though the total number of outright refusals (NR) was not high in the pilot (N=40), the number of ‘unknown’ or unclassifiable responses was unexpectedly high (n=353) given that the eligibility criterion was quite relaxed (i.e., anyone over the age of 21 who spoke English could response). Even though we could not establish eligibility for any of these households (i.e., they hung up on us or otherwise refused to cooperate with the interviewer), we did record as many reasons for nonparticipation as possible. The vast majority of the refusals were lack of interest in the survey topic (n=156/approx. 42.9%) while the number of persons recorded as nonparticipating due to language reasons was just 4 (approx.. 1.1%) meaning that language bias seems unlikely to be key problematic in the study sample.
Data collection
The national telephone survey was conducted between March 18 and September 3, 2014. Calls were made Monday through Thursday between 9am and midnight (EST), Saturday 9:30am to 3:30pm and Sunday 2pm to midnight. Blaise CATI software was used to both manage the sample and collect the data (Blaise 2007). No numbers were removed from calling until a minimum of 10 unsuccessful call attempts were made and at least one weekend, evening, and daytime call attempt were made. The sample resulted in 1,655 interviews and achieved a weighted response rate of 45 percent (The American Association for Public Opinion Research,(2016). The remaining sample consisted of ineligible numbers (35,628), refusals from eligible households (1,260), or numbers of indeterminable eligibility status (16,300). Interviewers completed general and project-specific training before conducting the surveys and signed certificates of confidentiality. For quality control, interviewers were monitored twice fortnightly. The study was approved by the Institutional Review Boards of Duke University and the University of North Carolina, Chapel Hill.
Weights and Adjustment
A three-step sample weighting procedure was followed in producing sample weights (Kalsbeek and Agans 2008). The base weights were computed using the sampling rate for telephone numbers in each stratum, adjusting for the number of eligible respondents and landline telephone numbers in the household (Step 1).The base weights were then adjusted for differential household -level nonresponse among sampling strata using the inverse of the stratum-specific household-level response rate as the adjustment factor and trimmed following the procedures recommended by Potter (1998) (Step 2). The nonresponse-adjusted household sample weight was then calibrated to population counts as estimated from the American Community Survey (US Census 2015) sample by cross-tabulating on race (White vs. non-White), education (associates degree or less vs. college degree), and age (21–50 vs. 51–60 vs. >60). Final weights were normalized to the total sample size so as not to artificially inflate the degrees of freedom in our analyses (Flores-Cervantes and Kalton 2008)
Choice of Questions
Survey respondents were asked whether they agreed (strongly or somewhat) or disagreed (strongly or somewhat) with the following three statements:
-
A.
The abilities a person is born with depend on what race they are.
-
B.
People of one race may be better athletes than people of another race because of genetics.
-
C.
People of one race may be smarter than people of another race because of genetics.
In addition, they were asked the following single question regarding racial health inequalities and genetics:
-
D.
Research shows that on average, blacks have worse health than whites. In your opinion, is this mostly because of genetic factors or mostly because of social factors?
Responses were analyzed according to the following independent variables:
Self-described racial identity (according to OMB categories as found on the census)
College and above college education vs no college education (as a measure of education status)
Renting vs Ownership of home, or “other” residential status (as a measure of socioeconomic status)
Age (grouped into three 21–50, 51–60, over 60).
Concept of race as Biological vs Not Biological (respondents were asked if they thought “Race is biological. You are born a certain race and it is based on science” or “Race is not biological. It is something society has made up.”)
In developing these questions we employed literature on the following topics: popular understandings of race, genetics, and biology in ascribing essential qualities (Chao, Hong, Y., and Chiu 2013; Condit et al. 2004; Condit and Bates 2005; Dar-Nimrod and Heine 2011; Glasgow, Shulman and Covarrubias 2009: Haslam and Whelan 2008; Jayarante et al. 2006; Jayaratne et al. 2009; Shulman and Glasgow 2010; Yzerbyt, Corneille, and Estrada 2001); cultural differences in attitudes to genetic science (Dye et al. 206; Furr 2002); popular perceptions of Black sporting success (Hoberman 2007; Hughey and Goss 2015; Rasmussen, Es gate, & Turner 2005); race and intelligence (Alland 2002; Gould 1996; Kaplan, 2015); the growing market for racialized medicine (Duster 2015; Kahn 2013; Krupar and Ehlers 2017) and the continued use of race within the context of genetic and biomedical research (Lorusso and Bacchini 2015; Yudell, et al., 2016). These four bodies of knowledge were utilized with respect to interpreting Questions concerning abilities, athletic ability, intelligence, and whether the public believes racial health inequalities to be the product of social or genetic factors.
Statistical Analysis
A number of standard logistic regressions were employed to identify the associations with agreement to certain statements while controlling for other variables as appropriate. It should be noted that we performed list-wise deletion before performing the regression, i.e. we excluded observations missing on any one of the control variables. This led to a reduction in sample size of between 4% and 11%, depending on the outcome examined. In the Results section associations are reported as odds ratios using weighted frequencies. We provide McFadden’s pseudo R-squared (calculated as one minus the fraction of the residual deviance by the null deviance). This term provides a rough estimate of the variance in the outcome explained by the control variables.
Results
Sample Characteristics
As seen in Table 1, the respondents in our sample tended to beolder and more educated than the general population, but the sampling weights redistributed these imbalances. As a check on our weighting process, we compared our sample estimate of current adult smokers, defined by smoking on all or some days as well as 100 cigarettes in entire lifetime, against the National Health Interview Survey (NHIS) estimate (17.8 ± 0.6; n=34,55 7). We found that our weighted estimate closely approached the NHIS smoking estimate, suggesting that our weights appropriately adjusted our sample to the general population.
Table 1. Demographic Characteristics of Respondents.
| Characteristic | Frequency | Weighted Fr equency |
Weighted Pe rcentages ( %) |
s.e of perc entage* |
|---|---|---|---|---|
| Race* (n=1655) | ||||
| American Indian or Alaska Native |
69 | 81.647 | 5.029 | 0.752 |
| Asian | 17 | 13.806 | 0.850 | 0.248 |
| Black or African American |
338 | 283.065 | 17.436 | 1.033 |
| Native Hawaiian or Other Pacific Islander |
3 | 4.181 | 0.258 | 0.159 |
| White | 1149 | 1180.000 | 72.653 | 1.310 |
| Other Race | 42 | 48.387 | 2.980 | 0.552 |
| Refusal | 10 | 12.887 | 0.794 | 0.307 |
| Total Education (n=165 5) |
1628 | 1623 | 100 | |
| Some college or Associate Degree or less |
937 | 1196 | 72.278 | 1.205 |
| College degree | 718 | 458.807 | 27.723 | 1.205 |
| Total Age (n=1655) |
1655 | 1655 | 100 | |
| 21–50 | 461 | 937.337 | 56.637 | 1.472 |
| 51–60 | 395 | 307.823 | 18.600 | 0.996 |
| >60 | 799 | 409.840 | 24.764 | 1.033 |
| Total Home Ownership |
1655 | 1655 | 100 | |
| Own | 1226 | 1130 | 69.579 | 1.537 |
| Rent | 317 | 379.229 | 23.359 | 1.412 |
| Other | 78 | 108.885 | 6.707 | 0.905 |
| Refusal | 6 | 5.451 | 0.336 | 0.165 |
| Don’t Know | 1 | 0.318 | 0.020 | 0.020 |
| Total | 1628 | 1623 | 100 |
s.e. – standard error
Table 2 (below) reports odds ratios with respect to agreement with the statements A-C while controlling for other variables. The findings are reported in odds ratios, which can be interpreted as a percent increase or decrease in the probability of agreeing with each statement (odds ratio-l)*100 = percent increase or decrease).
Table 2. Odds Ratios from Logistic Regressions.
| Agreement with statement | ||||||||
|---|---|---|---|---|---|---|---|---|
| A | s.e | B | s.e | C | s.e | |||
| (Intercept) | 0.181*** | (0.039) | 0.819 | (0.131) | 0.227*** (0.043) | |||
| Race(non-Wh ite )1 |
2.032** | (0.421) | 0.513*** | (0.087) | 0.891 | (0.187) | ||
| Education (c ollege degre e)2 |
0.500*** | (0.093) | 0.888 | (0.119) | 0.550*** (0.093) | |||
| Housing (ren ting)3 |
1.545+ | (0.346) | 1.307 | (0.247) | 1.519+ | (0.338) | ||
| Age 51–604 | 0.801 | (0.178) | 1.264 | (0.206) | 1.324 | (0.273) | ||
| Age over 604 | 1.144 | (0.218) | 1.796*** | (0.260) | 1.790** | (0.320) | ||
| Race is not Biological5 |
0.797 | (0.155) | 0.569*** | (0.084) | 0.808 | (0.149) | ||
| n | 1,536 | 1,529 | 1,530 | |||||
| Pseudo-R4 | 0.051 | 0.042 | 0.027 | |||||
p<0.1
p<0.05
p<0.01
p<0.001., s.e. standard error; model weighted to adjust for complex survey design.
Reference category for race is White (Odds ratio shown is for all non-White groups in comparison to White population)
Reference categories for Education is no college degree (Odds ratio shown is for College Degree or above)
Reference category for housing is home ownership (Odds ratio shown is for Renting); results for “Other” omitted
Reference category for age is 21–50 (Odds Ratio shown is for age 51–60 an d over 60 years old)
Reference category for concept of race is that race is a biological category (Odds Ratio shown is for race is viewed as not a biological category)
Agreement with the statement regarding General Abilities
From Table 2 it can be seen that agreement with statement A that “the abilities a person is born with depend on what race they are” is strongly associated with self-identified race and education, and has a marginally statistically significant relationship to housing status. Self-identification as American Indian or Alaska, Asian, Black or African American, Native Hawaii an or Other, Pacific Islander, or Other Race approximately doubles (203% increase) the probability of agreement with the statement. Home renters are 54.5% ((1.545–1)*100) more likely than home owners to agree that abilities depend on race although this association is statistically marginal). By way of contrast, respondents with a college degree are 50%((0.500–1)* 100) less likely than those without a college degree to agree that abilities depend on race.
Education and rental status had multiplicative effects upon our initial finding of racial differences in perception of abilities. When we stratified our results, we found that the association between renting (indicative of lower socioeconomic status) and greater agreement with statement “the abilities a person is born with depend on what race they are” was maintained within each racial/ethnic group.
As seen in Figure 1, below, non-white renters with no college have the highest predicted probability of agreeing that general abilities depend on race at approximately and White homeowners with a college degree have the lowest predicted probability of agreement. The pattern described in Figure 1 is robust to different modelling assumptions.
Figure 1: Probability of Agreeing that Abilities Depend on Race.
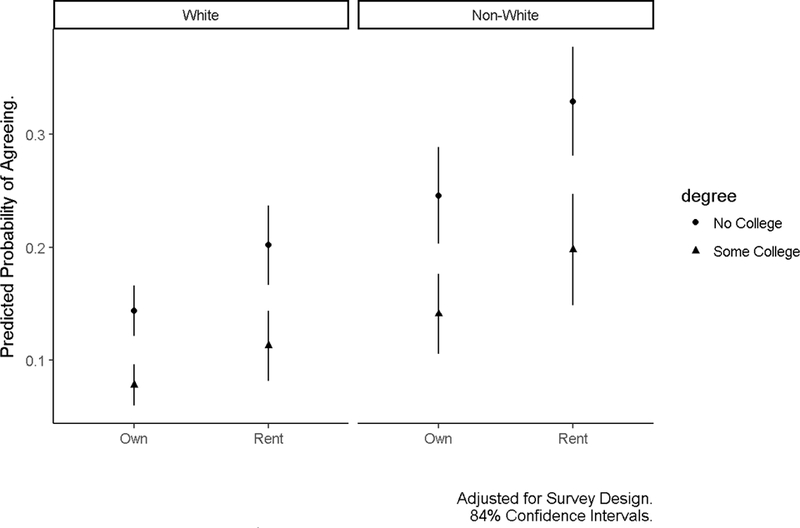
Note that this figure presents 84% confidence intervals because this level is recommended for picturing bivariate differences. Intervals which do not overlap generally indicate statistically significant differences at the p < 0.05 level (Goldstein and Healy, 1995).
Concepts of race as biological or not biological do not appear to influence agreement with the statement in any statistically significant manner (see Table 2).
Agreement with the Statement on Athletic Abilities
Agreement with the statement B that “People of one race may be better athletes than people of another race because of genetics” is statistically associated with race, age, and beliefs ab out whether race is a biological construct (as reported in Table 2).
Self-identifying as Black or other non-White race/ethnicity de creases the likelihood of agreement by 48.7% ((0.513–1)* 100). Testing for interaction effects with race indicates the results are robust across differing levels of education and home-ownership. Beliefs about whether race is a biologically determined outcome are important for this outcome, with those who believe race is a not biological construct being 43.1% ((1–0.569)*100) less likely to agree that athletic abilities depend on race.
Age is also an important factor in agreement. Being over 61 increases the likelihood of agreement by 79.6% ((1.796–1)* 100) compared to the reference population of 21–50. Middle aged individuals are about just over 25% more likely than the youngest to agree with Statement B, though this odds ratio is not statistically significant. This suggests the existence of an age-specific gradient in agreement with the idea that athletic abilities depend on race.
Beliefs about the meaning of race is multiplicative with racial identification and age. In summary, concepts of race alone do not account for the differences in agreement with this proposition across race and age.
Agreement with the Statement on Intellectual Abilities
Agreement with statement C that “People of one race may be smarter than people of another race because of genetics” has statistically significant associations with education and age (as reported in Table 2). Specifically, having a college degree (as opposed to not reaching college education level) reduces the likelihood of agreeing with the statement by approximately 45% ((0.550–1)*100). Respondents aged 61 and older are 79% more likely to agree with this statement.
Age and education are both independently correlated with the outcome, but they are also multiplicative effects that work together. Education operates the same across all ages with respect to perception of intelligence differentials according to race.
Belief that race is not a biological category does not appear to impact upon agreement with Statement C.
Genetic vs Social Interpretations of Racial Health Differentials
Table 3 below reports odds ratios with respect to whether people felt that health inequalities were largely the product of social - rather than genetic - factors. As previously, odds ratios are reported for each variable while controlling for other variables. (As above, results can be interpreted as a percent increase or decrease in the probability of agreeing with each statement (odds ratio-1)*100 = percent increase or decrease)
Table 3. Odds Ratios from Logistic: Agreement with racial Inequalities mostly due to social factors?
| Odds Ratios | s.e. | |||
|---|---|---|---|---|
| (Intercept) | 2.682*** | (0.519) | ||
| Race (non-White)1 | 1.005 | (0.202) | ||
| Education (college degree)2 | 3.306*** | (0.601) | ||
| Housing (renting)3 | 0.809 | (0.178) | ||
| Age 51–604 | 0.743 | (0.150) | ||
| Age over 614 | 0.857 | (0.157) | ||
| Race is not Biological5 | 1.446+ | (0.272) | ||
| N | 1,473 | |||
| Pseudo –R2 | 0.047 |
p,0.1
p<0.05
p<0.01
p<0.001., s.e. standard error; model weighted to adjust for complex survey design
Reference category for race is White (Odds ratio shown is for all non-White groups in comparison to White population)
Reference categories for Education is no college degree (Odds ratio shown is for College Degree or above)
Reference category for housing is home ownership (Odds ratio shown is for Renting); ‘Other” category omitted
Reference category for age is 21–50 (Odds Ratio shown is for age 51–60 an d over 60 years old)
Reference category for concept of race is that race is a biological cate gory (Odds Ratio shown is for race is viewed as not a biological category)
Table 3 shows that education has by far the most significant association with attributing racial health inequalities to social factors, with college education or above increasing the likelihood of attributing racial health inequalities to social factors by over 300%. Self-identification of race/ethnicity, home ownership, and age do not show statistically significant associations with this statement at traditional levels of significance, though they reach marginal levels of statistical significance (p<0.11) when education is excluded from the model. Without education, the proportion of variance explained, as measured by the Pseudo-R2 is only 0.7%; adding education moves the proportion explained to 4.2%.
Holding a view of race as not a biological concept increased the percentage of people attributing racial health inequalities to social factors by 44.6% but the finding was only marginally statistically associated (p. <0.1). Racial concepts are multiplicative with education with respect to this finding; however, education is statistically significantly associated with beliefs about racial health inequalities, independent of whether race is viewed as a biological construct.
Summary regarding Correlates
Race is associated with education, housing, and age status. Additional data analysis indicated that the White population group is more likely to have a college education (or above), own property, and be older than other population groups.
Additional research conducted by the research team indicates that across all racial/ethnic population groups in the US, a majority of people believe race to be a combination of social and biological elements. However, of those presuming race to be either a biological or a social concept, Whites were more likely to take a biological position with respect to the meaning of race. Conversely, of those presuming race to be either a biological or a social concept Black and American Indian populations were more likely to reject the biological concept of race and subscribe to a notion of race as a social category.
With the exception of beliefs about athletic abilities, education generally displays the most consistent, and often the strongest association with agreement or disagreement with various statements provided and in respect to believing that social factors are more significant than genetic factors in determining racial differences in health.
Limitations
We used weights to make the data nationally representative, but notably, racial self-identification was one of (but not the only) attributes used to conduct oversampling. For multiple regression, inclusion of racial identification is necessary to test our hypotheses, but this also introduces complex issues related to the appropriate weighting of analysis, and may affect standard errors and tests of statistical significance (Winship & Radbill, 1994). These concerns are partially ameliorated because analyses with unweighted data produces similar results (particularly with variables that have large effect sizes, like education). However, there are some important differences. Analyses using unweighted frequencies suggest stronger associations between renting (as a measure of socioeconomic status) and agreement with Statement A (abilities) and unweighted frequencies also show a statistically significant association between higher rates of education and disagreement with Statement B (athleticism). Analysis using unweighted figures also increase the significance (lower p value) of having a non-biological view of health with respect to disagreeing with Statement C (intelligence) and believing racial health inequalities to be derived from social factors (Statement D). In combination, these differences highlight the need to be aware of the differences between weighted and unweighted data in interpreting the findings.
Inevitably limitations to the numbers of questions that could be asked and the need to focus upon particular research topics led to limitations as to the information that was collected. Geographical location was not recorded. It is possible that the findings might also be conditional on region of residence, which might add a further layer of understanding, especially when comparing the US Deep South to other regions. We note that the housing status is not necessarily the only form of socioeconomic marker available, but it has been shown as a robust marker of socioeconomic status in a number of studies (Grundy and Holt 2001; Filakti and Fox 1995; Laaksonen et al. 2005). We also note that concepts of race are complex - we cannot answer what people specifically mean by rejecting or affirming of race as biological, we can only make a broad distinction between biological and social concepts of race (see Morning 2007 and 2009 for further discussion of race a social concept). A further limitation is that while anonymity was ensured, questions about race are frequently sensitive. It may be the case these sensitivities influence peoples’ answers, especially as the survey was conducted over the phone. Despite these limitations it remains the case that various patterns emerge; in short, responses do differ according to group dynamics and these differences appear to reflect racial, socioeconomics, education, and age, along with concepts of race).
Discussion
Main Findings
Overall our findings are indicative of four important patterns. Firstly, that race and associated indicators of racially derived social advantage and disadvantage are significant factors in the perception that abilities are determined by race. In short, persons who might be identified as likely to have the greatest advantages in life (as indicated by being self-identified as White, house owners, and having higher levels of access to education) are the least likely to ascribe to a view that abilities are something determined by race (see Figure 1). Secondly, that being older increases the likelihood of someone believing that athletic ability and intellectual ability are determined by race and genetics. Being White and older is a particularly strong indicator of agreement with Statement B - that athletic ability is determined through race and genetics. Conversely, higher levels of education militate against such biologically essentialized views of athletic (Statement B) and intellectual ability (Statement C). Thirdly, that higher levels of education and holding concepts of race that rejects race as a biological category are the most important factors in ascribing racial health inequalities to social, rather than genetic, f actors. The two components - a non-bio logical (social) view of race and higher levels of education are multifactorial in effect. Notably self-identified race, housing (as a measure of socioeconomic status), and age are not statistically associated with perceptions about health differences.
Implications of the Findings
From an education standpoint, our data suggest that the educational message that races are not biological categories has had some popular impact. Higher levels of education and concepts of race as non-biological were seen as multiplicative in reducing the biologically essentialist statements concerning mental abilities and was also seen to be the dominant factor with respect to ascribing racial health inequalities to social, rather than genetic factors see (Morning 2007 and 2009; Wagner et al. 2017 for discussions of the status of race within academia).
The persistence of the belief that race and genetics provide an explanation for sporting achievement - especially among White respondents - may in part be accounted for by a tendency to ascribe a genetic causality to physical rather than mental abilities. As Parrott et al. (2003) states “where people are forced to choose one over the other, there are fairly clear patter ns assigning genes a larger role in physical traits and a smaller role in traits perceived to be cognitively based.” However, it also suggests a continuance of an historical construct in which non-Whites (especially Blacks) have come to be seen as innately suited to sports and, perhaps more significantly, are seen as unsuited to success in other contexts (Hayes and Sugden 1999; Hoberman 1997; Hughey and Goss 2015). Although to the best of our knowledge no other survey-based study has directly compared White and other population groups with respect to perceptions of athletic ability, empirical data supporting the claim that Black athleticism is frequently seen as natural or innate can be found in the work of Morning (2007) whose data suggest that nearly three-quarters of respondents presented with an example of unequal sporting success in the NFL suggested that differences in sports representation were due to blacks’ natural physical superiority vis hites. Similarly, Hayes and Sugden’s (1999) study of scholastic coaching concludes that Black students are often seen as innately good at sport, and at the same time expectations for non-sporting academic success are reduced. A similar set of expectations were found among the general public within the work of Sheldon et al. (2007) who conclude that White Americans’ expectations of African American success in sport operates as a “backhanded compliment and likely serves to help perpetuate prejudice and negative racial stereotypes.” In short, it appears that in the sports and athletics context it remains socially acceptable among the White population to employ long-standing stereotypes about Black brawn over brains.
Finally, we saw that people who are more likely to be economically and socially disadvantaged were statistically more likely than other populations to agree to Statement A (general abilities). This was especially true with respect to racial identification - a 94.6% increase in agreement with the statement that “the abilities a person is born with depend on what race they are” among non-Whites (using unweighted data suggests an additional association with low socioeconomic status and agreement with this statement). There are several possible explanations for this finding. The first is that non-Whites are more likely to hold biologically essentialist views about race in general. This seems unlikely given that our study does not indicate similar findings for Statements B and C concerning athletic and intellectual abilities being determined by race and genetics. The second explanation is that the question is interpreted as one concerned with lifetime opportunities being limited. As Singer et al. (2007) also found - somewhat paradoxically - Black respondents appeared to give more genetically deterministic responses in their study using vignette-questions. In turn, rather than concluding that Blacks are more likely to subscribe generally to deterministic thinking, Singer et al. suggested “the tendency of Black respondents to endorse more genetic ratings appears to be due, in part, to their lack of confidence that they can control their own fate.” Finally, it is also possible that rather than being solely indicative of a form of fatalism that this finding may also be a form of tacit resistance to the insistence that failure to be economically successful is to be blamed on the individual rather than endemic socioeconomic barriers to economic success. At the very least the finding indicates a non-acceptance of the notion that the US has moved past endemic racial barriers and that everyone is truly equal at birth (see Bobo and Charles 2009; Bonilla-Silva 2006; El-Haj 2007 for discussion of neo-liberal color-blind racism). Either way, it suggests that notions of innate difference by birth into a particular race is understood differently due to the distinct lived experiences of different racial groups in the US.
Conclusion
Political expediency, as evidenced by the transformation of race from a folk belief about type and difference to a politically valuable social and scientific tool for justifying exploitation and subjugation, lies at the core of understanding the role of race in society. It should come as no surprise that in an age when genetics, race, and social activism have combined in myriad different forms that race is being pulled in multiple directions as it continues to be fought over as proof of the natural order of things or proof that society is structured in ways that facilitate or restricts opportunities based upon race and its associated correlates. While education appears to have spearheaded the shift away from essentialized perspectives that see physical and mental ability as intimately tied to racial, biological, and genetic difference and thus away from the crude biological racism of the 20th Century, social perspectives of race are by no means unequivocally free from racial intolerance. Confronting 21st Century forms of racial discrimination - based upon the notion that racism no longer exists and that all people have unlimited opportunity - presents a new challenge. It is arguable that those populations who have suffered most from biological views of race are now voicing their cone erns that racial barriers still exist even in the supposedly post-racial context of contemporary US society. In the future, it is essential to regularly survey the impact of informal and formal education and engagement efforts in improving the public’s knowledge about the relationship between race and genetics and the role of both in interpreting and addressing all forms of social and health disparity in US society.
Acknowledgements
We gratefully acknowledgments the work of Bryce Bartlett of Duke University Sociology for conducting the statistical testing and working with the team on interpreting results.
The authors are grateful to the survey respondents who took the time to participate in the study.
Funding
This research was supported, in part, by Grant Number 1R01HG00 6295–01 from the National Human Genome Research Institute, National Institutes of Health.
References
- Alland A (2002). Race in mind: Race, IQ, and other racisms New York: Palgrave MacMillan [Google Scholar]
- Barbujani G, & Colonna V (2010). Human genome diversity: frequently asked questions. Trends in Genetics, 26(7), 285–295. [DOI] [PubMed] [Google Scholar]
- Blaise, Version 4.8 [Computer software]. (2007). Voorburg/Heerlen: Statistics Netherlands. [Google Scholar]
- Bliss C (2015). Science and Struggle Emerging Forms of Race and Activism in the Genomic Era. The Annals of the American Academy of Political and Social Science, 661(1), 86–108. [Google Scholar]
- Bobo LD, & Charles CZ (2009). Race in the American mind: From the Moynihan report to the Obama candidacy. The Annals of the American Academy of Political and Social Science, 621(1), 243–259. [Google Scholar]
- Bonilla-Silva E (2006). Racism without racists: Color-blind racism and the persistence of racial inequality in the United States Lanham, MD: Rowman & Littlefield Publishers. [Google Scholar]
- Brace CL (2005). “Race” is a four-letter word: the genesis of the concept Oxford University Press. [Google Scholar]
- Byrd WC, & Ray VE (2015). Ultimate Attribution in the Genetic Era White Support for Genetic Explanations of Racial Difference and Policies. The Annals of the American Academy of Political and Social Science, 661(1), 212–235. [Google Scholar]
- Chao MM, Hong Y, and Chiu C (2013). Essentializing race: its implication on racial categorization. J. Pers. Soc. Psychol 104, 619–634. [DOI] [PubMed] [Google Scholar]
- Condit CM, Parrott RL Harris TM, Lynch J Dubriwny T (2004). The role of “genetics” in popular understandings of race in the United States. Public Understanding of Science, 13(3), 249–272. [DOI] [PubMed] [Google Scholar]
- Condit C, & Bates B (2005). How lay people respond to messages about genetics, health, and race. Clinical genetics, 68(2), 97–105 [DOI] [PubMed] [Google Scholar]
- Dar-Nimrod I, & Heine SJ (2011). Genetic essentialism: on the deceptive determinism of DNA. Psychological bulletin, 137(5), 800–818 [DOI] [PMC free article] [PubMed] [Google Scholar]
- DeVellis RF (2016). Scale development: Theory and applications ( Vol. 26). Thousand Oaks, CA: Sage publications. [Google Scholar]
- Duster T (2003) Backdoor to eugenics New York: Routledge. [Google Scholar]
- Duster T (2015). A post-genomic surprise. The molecular reinscription of race in science, law and medicine. The British journal of sociology, 66(1), 1–27. [DOI] [PubMed] [Google Scholar]
- Dye T, Li D, Detriment M, Groth S, Fernandez D, Dozier A,& Chang J (2016). Sociocultural variation in attitudes toward use of genetic in format ion and participation in genetic research by race in the United States: implications for precision medicine. Journal of the American Medical Informatics Association, 23(4),782–786. [DOI] [PMC free article] [PubMed] [Google Scholar]
- El-Haj NA (2007). The genetic reinscription of race. Annual Review Anthropology, 36, 283–300. [Google Scholar]
- Filakti H, & Fox J (1995). Differences in mortality by housing tenure and by car access from the OPCS Longitudinal Study. Population Trends, (81), 27–30. [PubMed] [Google Scholar]
- Flores-Cervantes I, Kalton G (2008). Methods for sampling rare populations in telephone surveys. In: Lepkowski JM, Tucker C, Brick JM, De Leeuw ED, Japec L, Lavrakas PJ, Link MW, & Sangster RL (Eds.) Advances in telephone survey methodology New York: John Wiley & Sons. [Google Scholar]
- Fujimura TH, & Rajagopalan R (2011). Different differences: The use of ‘genetic ancestry’ versus race in biomedical human genetic research. Social Studies of Science, 41(1), 5–30. [DOI] [PMC free article] [PubMed] [Google Scholar]
- Fujimura JH, Bolnick DA, Rajagopalan R, Kaufman JS, Le wontin RC, Duster T , Ossorio P, & Marks J (2014). Clines without classes: How to make sense of human variation. Sociological Theory, 32(3), 208–227. [Google Scholar]
- Furr LA (2002). Perceptions of genetics research as harmful to society: differences among samples of African-Americans and European-Americans. Genetic testing, 6(1), 25–30. [DOI] [PubMed] [Google Scholar]
- Glasgow J, Shulman JL, & Covarrubias EG (2009). The ordinary conception of race in the United States and its relation to racial attitudes: A new approach. Journal of Cognition and Culture, 9(1), 15–38 [Google Scholar]
- Goldstein H & Healy MJR (1995). The Graphical Presentation of a Collection of Means. Journal of the Royal Statistical Society. Series A (Statistics in Society), 158 (1): 175–77. [Google Scholar]
- Gould SJ. (1994). The geometer of race. Discover, November 1994: 65–81. [Google Scholar]
- Gould SJ (1996). The mismeasure of man New York: WW Norton & Company. [Google Scholar]
- Graves JL (2004). The race myth: Why we pretend race exists in America New York: Dutton. [Google Scholar]
- Graves JL (2015). Why the Nonexistence of Biological Races Does Not Mean the Nonexistence of Racism. American Behavioral Scientist, 59(11), 1474–1495. [Google Scholar]
- Graves JL (2015a). Great Is Their Sin Biological Determinism in the Age of Genomics. The Annals of the American Academy of Political and Social Science, 661(1), 24–50. [Google Scholar]
- Grundy E, & Holt G (2001). The socioeconomic status of older adults: How should we measure it in studies of health inequalities?. Journal of Epidemiology & Community Health, 55(12), 895–904. [DOI] [PMC free article] [PubMed] [Google Scholar]
- Haslam N, and Whelan J (2008). Human natures: psychological essentialism in thinking about differences between people. Soc. Pers. Psychol. Compass 2, 1297–1312. [Google Scholar]
- Hayes S, & Sugden J (1999). Winning through ‘Naturally’ still? An analysis of the perceptions held by physical education teachers towards the performance of Black pupils in school sport and in the classroom. Race Ethnicity and Education, 2(1), 93–108. [Google Scholar]
- Hoberman JM (1997). Darwin’s athletes: How sport has damaged Black America and preserved the myth of race Boston, MA: Houghton Miff 1 in Harcourt. [Google Scholar]
- Hughey MW, & Goss DR (2015). A level playing field? Media constructions of athletics, genetics, and race. The Annals of the American Academy of Political and Social Science, 661(1), 182–211. [Google Scholar]
- Jackson JP, & Weidman NM (2004). Race, racism, and science: Social impact and interaction Santa Barbara, CA: Abc-Clio. [Google Scholar]
- Jayaratne TE, Gelman SA, Feldbaum M, Sheldon JP, Petty EM, & Kardia SL (2009). The perennial debate: Nature, nurture, or choice? Black and White Americans’ explanations for individual differences. Review of General Psychology, 13(1), 24–33 [DOI] [PMC free article] [PubMed] [Google Scholar]
- Jayaratne TE, Ybarra O, Sheldon JP, Brown TN, Feldbaum M, Pfeffer CA, & Petty EM . (2006) . White Americans’ geneticaly theories of race differences and sexual orientation: Their relationship with prejudice toward Blacks, and gay men and lesbians. Group Processes & Intergroup Relations, 9(1), 77–94. [DOI] [PMC free article] [PubMed] [Google Scholar]
- Jorde LB, & Wooding SP (2004). Genetic variation, classification and ‘race’. Nature genetics, 36, S28–S33. [DOI] [PubMed] [Google Scholar]
- Kahn J (2013). Race in a bottle: The story of BiDil and racialized medicine in a post-genomic age Columbia University Press. [Google Scholar]
- Kang SK, Flaks JE, & Remedios JD (2015). Folk beliefs ab out genetic variation predict avoidance of biracial individuals. Frontiers in psychology, 6 Retrieved from https://www.frontiersin.org/articles/10.3389/fpsyg.2015.00357/full. Accessed 12/12/17 [DOI] [PMC free article] [PubMed] [Google Scholar]
- Kalsbeek WD, & Agans RP (2008). Sampling and weighting in household telephone surveys. In Lepkowski JM, Tucker C, Brick JM, De Leeuw ED, Japec L, Lavrakas PJ, Link MW, & Sangster RL (Eds.) Advances in telephone survey methodology. New York: John Wiley & Sons. [Google Scholar]
- Kaplan TM (2015). Race, IQ, and the search for statistical signals associated with so-called “X”-factors: environments, racism, and the “hereditarian hypothesis”. Biology & Philosophy, 30(1), 1–17. [Google Scholar]
- Koenig BA, Lee SSJ, & Richardson SS (2008). Revisiting race in a genomic age. Rutgers University Press. [Google Scholar]
- Krupar S, & Ehlers N (2017). Biofutures: Race and the governance of health. Environment and Planning D: Society and Space, 35(2), 222–240 [Google Scholar]
- Laaksonen M, Rahkonen O, Karvonen S, & Lahelma E (2005). Socioeconomic status and smoking: analysing inequalities with multiple indicators. The European Journal of Public Health, 15(3), 262–269. [DOI] [PubMed] [Google Scholar]
- Lessler JT, & Forsyth BH (1996). A coding system for appraising questionnaires. In Schwarz NE, & Sudman SE (Eds) Answering ques t ions: Methodology for determining cognitive and communicative processes in survey research San Francisco: Jossey-Bass. [Google Scholar]
- Lewontin RC. (1972). An apportionment of human diversity. In: Dobzhansky T, Hecht MK, Steere WC (Eds.). Evolutionary Biology 6 New York: Appleton-Century-Crofts, 1972. [Google Scholar]
- Lorusso L, & Bacchini F (2015). A reconsideration of the role of self-identified races in epidemiology and biomedical research. Studies in History and Philosophy of Science Part C: Studies in History and Philosophy of Biological and Biomedical Sciences, 52, 56–64. [DOI] [PubMed] [Google Scholar]
- Marks J (2003). What it means to be 98% chimpanzee: Apes, people, and their genes University of California Press. [Google Scholar]
- Marks JM (2001). Human biodiversity: Genes, race, and history New York: Aldine de Gruyter. [Google Scholar]
- Molnar S (2015). Human variation: races, types, and ethnic groups. Upper Saddle River, N.J.: Pearson Prentice Hall [Google Scholar]
- Montagu A (2001). Man’s most dangerous myth: The fallacy of race Walnut Creek, CA: AltaMira Press. [Google Scholar]
- Morning A (2007). “Everyone Knows It’s a Social Construct”: Contemporary Science and the Nature of Race. Sociological focus, 40(4), 436–454. [Google Scholar]
- Morning A (2009). Toward a sociology of racial conceptualization f or the 21st century. Social Forces, 87(3), 1167–1192. [Google Scholar]
- Nei M & Roychoudhury AK (1974). Genic variation within and between the three major races of man: Caucasoids, Negro ids, and Mongoloids, Annals of Human Genetics, 26, 421–443. [PMC free article] [PubMed] [Google Scholar]
- Parrott RL, Silk KJ, & Condit C (2003). Diversity in lay perceptions of the sources of human traits: genes, environments, and personal behaviors. Social Science & Medicine, 56(5), 1099–1109. [DOI] [PubMed] [Google Scholar]
- Plaks JE, Malahy LW, Sedlins M, & Shoda Y (2012). Folk beliefs about human genetic variation predict discrete versus continuous racial categorization and evaluative bias. Social Psychological and Personality Science, 3(1), 31–39. [Google Scholar]
- Potter FA (1988), “Survey of Procedures to Control Extreme Sampling Weights,” Proceedings of the Section on Survey Research Methods, American Statistical Association, 453–458. [Google Scholar]
- Rasmussen R, Eseate A, & Turner D (2005). On your marks, get stereotyped, so! Novice coaches and black stereotypes in sprinting. Journal of Sport and Social Issues, 29(4), 426–436. [Google Scholar]
- Reardon J (2009). Race to the Finish: Identity and Governance in a n Age of Genomics Princeton University Press. [Google Scholar]
- Reynolds LT (1992). A Retrospective on “Race”: The Career of a Concept. Sociological Focus, 25(1), 1–14. [Google Scholar]
- Sheldon JP, Jayaratne TE, & Petty EM (2007). White Americans’ genetic explanations for a perceived race difference in athleticism: The relation to prejudice toward and stereotyping of Blacks. Athletic Insight: The Online Journal of Sport Psychology, 9(3), 31–56. [Google Scholar]
- Shulman JL, & Glasgow J (2010). Is Race-Thinking Biological or Social, and Does It Matter for Racism? An Exploratory Study. Journal of Social Philosophy, 41(3), 244–259. [Google Scholar]
- Singer E, Antonucci TC, Burmeister M, Couper MP, Raghunathan TE, & Van Hoewyk J (2007). Beliefs about genes and environment as determinants of behavioral characteristics. International Journal of Public Opinion Research, 19(3), 331–353. [Google Scholar]
- Smedley A (1999). Race in North America: origin and evolution of a worldview (2nd ed.). Boulder, CO: Westview Press. [Google Scholar]
- Smedley A, & Smedley BD (2005). Race as biology is fiction, racism as a social problem is real: Anthropological and historical perspectives on the social construction of race. American Psychologist, 60(1), 16–26. [DOI] [PubMed] [Google Scholar]
- Templeton AR (2013) Biological races in humans. Studies in History and Philosophy of Biological Sciences 44(3), 262–71. [DOI] [PMC free article] [PubMed] [Google Scholar]
- US Census. American Community Survey (2015) United States Census Bur eau Retrieved from https://www.census.gov/programs-surveys/acs/. Accessed 12/12/2017
- Wagner TK, Yu TH, Ifekwunigwe TO, Harrell TM, Bamshad MT, & Royal CD (2017). Anthropologists’ views on race, ancestry, and genetics. American journal of physical anthropology, 162( 2), 318–327. [DOI] [PMC free article] [PubMed] [Google Scholar]
- Wailoo K, Nelson A, & Lee C (Eds.).(2012). Genetics and the unsettled past: The collision of DNA, race, and history Rutgers University Press. [Google Scholar]
- Whitmarsh I, & Tones DS (2010). What’s the use of race?: Modern governance and the biology of difference. MIT press [Google Scholar]
- Winship C, & Radbill L (1994). Sampling Weights and Regression Analysis. Sociological Methods & Research 23(2), 230–57. [Google Scholar]
- Williams J,E (2016). Decoding Racial Ideology in Genomics Lanham, MD: Lexington Books. [Google Scholar]
- Williams MJ, & Eberhardt JL (2008). Biological conceptions o f race and the motivation to cross racial boundaries. Journal of Personality and Social Psychology, 94(6), 1033–1047 [DOI] [PubMed] [Google Scholar]
- Yudell M, Roberts D, DeSalle R, & Tishkoff S (2016). Taking race out of human genetics. Science, 351(6273), 564–565. [DOI] [PubMed] [Google Scholar]
- Yzerbyt V, Corneille O, and Estrada C (2001). The interplay of subjective essentialism and entitativity in the formation of stereotypes. Personality and Social Psychology Review 5, 141–155. [Google Scholar]