PLOS ONE logoLink to PLOS ONE
. 2020 Dec 4;15(12):e0243609. doi: 10.1371/journal.pone.0243609

MANTA, an integrative database and analysis platform that relates microbiome and phenotypic data

Yi-An Chen 1,*, Jonguk Park 1,#, Yayoi Natsume-Kitatani 1,#, Hitoshi Kawashima 1, Attayeb Mohsen 1, Koji Hosomi 2, Kumpei Tanisawa 3, Harumi Ohno 3, Kana Konishi 3, Haruka Murakami 3, Motohiko Miyachi 3, Jun Kunisawa 2, Kenji Mizuguchi 1,*
Editor: Lingling An4
PMCID: PMC7717536  PMID: 33275647

Abstract

With an ever-increasing interest in understanding the relationships between the microbiota and the host, more tools to map, analyze and interpret these relationships have been developed. Most of these tools, however, focus on taxonomic profiling and comparative analysis among groups, with very few analytical tools designed to correlate microbiota and the host phenotypic data. We have developed a software program for creating a web-based integrative database and analysis platform called MANTA (Microbiota And pheNoType correlation Analysis platform). In addition to storing the data, MANTA is equipped with an intuitive user interface that can be used to correlate the microbial composition with phenotypic parameters. Using a case study, we demonstrated that MANTA was able to quickly identify the significant correlations between microbial abundances and phenotypes that are supported by previous studies. Moreover, MANTA enabled the users to quick access locally stored data that can help interpret microbiota-phenotype relations. MANTA is available at https://mizuguchilab.org/manta/ for download and the source code can be found at https://github.com/chenyian-nibio/manta.

Introduction

The genetic material of microorganisms residing within or upon the surface of the human body, especially gut microbiome, live in a mutualistic relationship with the host. These associations are key contributors to the host metabolism and are usually essential for human health. The microbiota of the intestinal tract (gut microbiota) can assist in breaking down nutrients that the host cannot digest or synthesizing vitamins that the host cannot produce. Alterations in the microbiota can lead to diseases such as obesity [14]. Therefore, the study of microbiota has considerable importance for public health.

The improvement of next generation sequencing technology, along with the decrease in the cost of large-scale analyses, has facilitated research on microorganism communities, for example, by 16S rRNA gene amplicon sequencing. However, processing these sequencing data requires a large amount of computational efforts. Post-sequencing the computational analysis [5] of microbial data broadly consists of three phases. (1) Data cleaning and normalization: comprised of multiple steps depending on the data source and sequencing technology, such as binning, pair-ends joining, and quality filtering; (2) Taxonomy and abundance estimation: in which taxonomy is assigned to the processed sequence reads, and their abundance in biological samples is estimated; and (3) analysis and interpretation of alpha and beta diversities, and functional annotation and the correlation between the microbial abundances and the physiological, environmental, or behavioral factors.

Both the first and the second phases above are sophisticated, time-consuming, and require high computational resources, in both 16S amplicon profiling and shotgun sequencing. QIIME [6] and Kraken [7] are well-known examples in this category. Other related tools include MEGAN [8], METAGEN-assist [9], EBI metagenomics, and MG-RAST [10].

In contrast, the third phase requires extensive user-interaction with researchers to select parameters and visualizing the output, especially when parameters with high dimensionality such as dietary, behavioral, and economic statuses are considered. The organization and storage of such multi-dimensional data types is challenging and a non-trivial task. MicrobiomeAnalyst [11], Calypso [12], Shiny-phyloseq [13], and Mian [14] are web-based online tools to address these challenges. Those tools provide interactive web interfaces to mediate R (such as phyloseq [15], vegan [16], and ade4 [17]) or Python packages. Although those well-designed tools provide various kinds of visualization and many sophisticated analytical approaches, they cannot store the data for sharing and reuse among project members. Moreover, some of those tools require the researchers to upload their data to third-party servers, which often invites data security concerns. When handling big multi-dimensional metadata, researchers often need to explore iteratively the efficacy of combining different parameters, or using different subsets of the data in the analytical framework. A database that can allow the users to manipulate stratified datasets quickly and efficiently would be extremely useful for such analysis.

We, therefore, aimed to develop a tool to facilitate the third phase of the analysis with the following features; (1) a smooth and interactive user interface to quickly and efficiently analyze the data with no programming efforts on the part of the user, (2) the ability to save the data in a readily accessible format, and (3) to be flexible and easily installed on individual workstations or servers to ensure quick access and secure data storage.

In this paper, we describe MANTA, a software program for creating an integrative database and analysis platform for microbiome and phenotypic data. MANTA has two important unique features: (1) the ability to store and share the data, either on-line or locally, in a user friendly easily-accessible database, and (2) providing an interactive environment to examine the correlation between the microbial abundances and other data collected such as dietary habits and lifestyle parameters, which can be of huge size and in multiple dimensions. MANTA is scalable, and further functionalities can be added as desired to the open-source code made available.

We have also demonstrated the usefulness of this platform by using a real-life dataset of microbiome and lifestyle-related data, which included dietary intake and physical activity obtained from 20 Japanese individuals. This case study shows that our platform can provide a novel hypothesis on the relationship between the relative abundance of specific bacteria and specific lifestyle parameters.

Materials and methods

Implementation

Our aim in this study was to develop a database framework that is able to store and share the data on human microbiome studies. The framework consists of a database and a web application, including a suite of analytical and visualization tools; it provides analytical features via a graphical user interface that can easily facilitate visualizing and correlating microbiome and phenotypic data. MANTA-based instances can be accessed from any computer through a modern web browser.

We store all the microbiome and phenotypic data using PostgreSQL [18], an open-source relational database. The microbiome data need to be pre-processed and prepared in a standard format. In addition to microbiota composition, pre-processing was also performed to provide additional information. These additions included the identification of the dominating taxonomy for each sample, to allow for the plotting of easily readable bar charts or heat maps. This annotation was achieved by merging the low abundance taxonomies in the “others” category that was always set to be below a specific threshold (we used 10 percent in our application). Next, we added the alpha diversity indices, including Shannon, Simpson, and Chao1 [1921]. Finally, we included the phylogenetic distances used for hierarchical clustering and principal coordinate analysis, such as Jaccard distance, weighted and unweighted UniFrac distance [22] or Bray-Curtis dissimilarity [23] for each pair of samples. These phylogenetic distances could be calculated using the R phyloseq, or vegan packages.

The phenotypic data can include—but are not limited to—multiple physical measurements and the measurements taken while exercising such as blood profiles, lifestyle questionnaires, and immunological studies. For convenience, we refer to these data as ‘parameters’. The parameters were classified into continuous, nominal, and ordinal variables, and text. The data that are labeled as text type can only be browsed in the application and are not to be used for further analysis. To deal with variable sets of parameters, possibly from different studies, we designed database tables to store the parameters in the form of name-value pairs. The database schema is shown in the form of Entity-relationship (ER) diagram and is released together with the source code.

The user interface was developed using Google Web Toolkit, a Java-based framework for web application development [24]. All calculations were implemented in Java programming language.

Case study: Correlations between dietary fat intake and microbiome

To demonstrate main functions of MANTA, we prepared an example database and named it MANTA demonstration database (MDD). The data stored in MDD is a subset of the NIBIOHN cohort data, a project conducted by National Institutes of Biomedical Innovation, health and Nutrition (manuscript in preparation). MDD includes twenty fecal samples collected from 20 healthy adult volunteers (21–41 years old, male) from Minamiuonuma City, Niigata Prefecture, Japan. The NIBIOHN cohort study also collected a wide range of parameters from the participants, including physical and exercise measurements, blood profiles, lifestyle questionnaires, and immunological parameters. (MDD includes only a subset of these parameters.) To enable quick access to these parameters, we further classified them into categories and subgroups (as listed in Table 1). Informed consent was obtained from all the participants. This study was approved by the Ethical Committee of National Institutes of Biomedical Innovation, Health, and Nutrition (KENEI-78).

Table 1. Main and subcategories of the parameters.

Class Category Subgroup
Information Basic information Basic information
Health condition Medical history Medical history
Family medical history
Presence of any malaise
Medication
Menstruation Menstruation
Defecation habit Defecation habit
Physical characteristics Body composition Body composition
Blood profile Blood profile
Lifestyle Physical activity (accelerometer) Physical activity
Diet Food Intake frequency
Amount of Food intake
Amount of Food class intake
Nutrients
Nutrition statistics
Eating behaviour
Other lifestyle Smoking
Physical activity (subjective)
Exercise habit
Working status
Sleep & rest
Stress and tiredness

The fecal samples were processed, and 16S rRNA gene amplicon sequencing was performed using Illumina MiSeq in the National Institutes of Biomedical Innovation, Health, and Nutrition, as described by Hosomi et al. [25]. The resulted sequences were analyzed using the QIIME software package [6]. The steps from trimming of paired-end reads to OTU picking were performed by QIIME Analysis Automating Script (Auto-q) [26, 27]. The pre-processed sequences were clustered into OTUs based on the sequence similarity (> 97%) using open-reference OTU picking with UCLUST software [28] against the SILVA reference sequence library v128 [29, 30]. The taxonomy (phylum, class, order, family, and genus) and relative abundances were calculated using the SILVA database [29] as the reference database. MANTA does not depend on any specific taxonomy systems but for MDD, we decided to use the NCBI Taxonomy Database [31] identifiers (taxon IDs). We converted the SILVA taxon names to the corresponding taxon IDs using TargetMine [32, 33]. We annotated the names that were not found in the NCBI Taxonomy Database as ‘unclassified’. Although we have used QIIME in this case study, in principle, any suitable analysis tool can be used to provide the taxonomy and abundance data if prepared as per the guidelines on our website.

Results

We have developed MANTA, a software program for creating an integrative database and analysis platform, that can store and correlate microbiome and phenotypic data. The platform is a web-based application and can be accessed with any modern web browser. The platform is designed for integrating and hosting a large quantity of data from multiple studies. MANTA can be installed on a local server. For users who wish to use the platform in PC or Mac, we also developed a stand-alone version (MANTA basic), which can be installed on a PC or Mac and provides a user interface to import the data with minimal effort (details described below). The source code and an example database (MANTA demonstration database, MDD) can be found at https://mizuguchilab.org/manta/. MDD demonstrates the main (but not all) functions of MANTA and does not provide user data upload and account management functions.

Data import

The database schema of MANTA is available along with the source code. To build a new web-based database using MANTA, the user needs to pre-process the microbiome data and phenotypic parameters to fit in the corresponding tables. In addition, the sample-to-sample distance, and the alpha-diversity should be calculated in advance.

MANTA basic offers smaller functionalities but provides a user interface for importing data more efficiently. The user can upload the data from the 'Data management' function using a graphical user interface. For more details, see S1 Appendix. The Jaccard distance and Bray-Curtis dissimilarity will be calculated instantly for the uploaded data.

Data visualization and data analysis

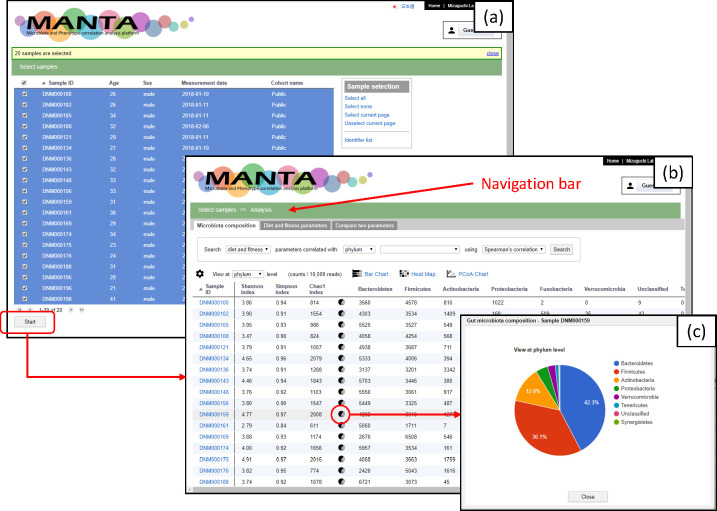
The main page of the application shows a list of available samples in a scrollable table (Fig 1A). Above the table, there is a navigation bar that helps the user to navigate among the different views. On this sample list page, the user can browse all the details of an individual sample by clicking on the sample entry in the table. Since the primary purpose of this framework is to correlate the microbiota composition with the phenotypic data, the samples without microbiota data are shaded in grey and are not selectable for further analysis.

Fig 1. General view of the application user interface.

Fig 1

(a) The main page of the application shows a list of available samples in a scrollable table. (b) The first tab of the analysis page, ‘Microbiota composition’, shows a table of the microbiota data of a specific rank. (c) Clicking on the Pie Chart icon displays the current microbiota composition for the current rank as a pie chart.

After a set of samples are chosen, an analysis screen with a few tabs appears (Fig 1B). Each tab represents a different start point for data visualization and data analysis. Currently, we propose three entry points as follows: ‘Microbiota composition’, ‘Phenotypic parameters’, and ‘Compare two parameters’.

The first tab, ‘Microbiota composition’, shows a table of the microbiota data of a specific rank (Fig 1B). The default rank is ‘phylum’, and the user can change the rank using the drop-down list. If there are more than ten taxa, only the ten most abundant ones will be shown by default. The user can change the displayed taxa (columns) by clicking on the column management icon—the gear icon at the upper left. Each row contains three types of diversity indexes and a pie chart icon. Clicking on the pie chart icon displays the current microbiota composition for the current rank as a pie chart (Fig 1C). Clicking on the taxon expands the pie chart and shows the taxon composition of the next rank for the selected taxon.

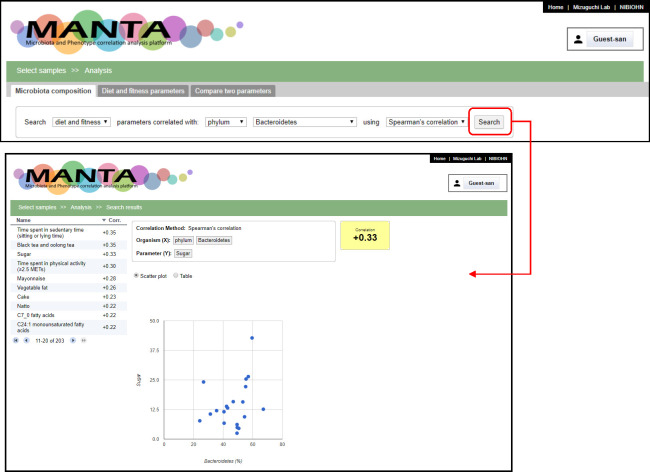
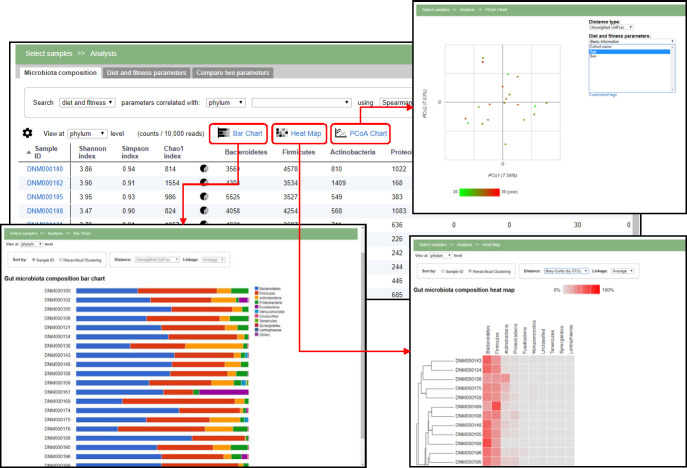
At the beginning of the page, there is a box to compare the microbiota composition with the parameter measurements (limited to continuous variables). After choosing a taxon and clicking on the search button, the system will calculate the correlation between the selected microbial taxon and the available numeric parameters (Fig 2). Two types of correlation calculations are available, the Pearson’s correlation coefficient and the Spearman’s rank correlation coefficient, which is known to be more robust against outliers [34, 35]. The results are displayed as a table showing the obtained correlation coefficient in descending order. Clicking on the parameter name displays the correlation between ‘Organism (x-axis)’ and ‘Parameter (y-axis)’ in a scatter plot or table view. Three visualization options are available above the composition table: ‘Bar Chart’, ‘Heat Map’, and ‘PCoA Chart’ (Fig 3). The Bar Chart option displays the microbiota composition in a stacked composite bar chart plot, whereas the Heat Map option colors different taxa by proportion.

Fig 2. Correlation search for Bacteroidetes.

Fig 2

The table in the left part of the search results shows the correlation coefficient in descending order. The user can toggle the order by clicking on the column header. The right part shows the scatter plot for Bacteroidetes relative abundance and the selected parameter (sugar intake in this example).

Fig 3. Microbiome data visualization.

Fig 3

Clicking on the Bar Chart and Heat Map icons will display the microbiome data. The samples can be ordered by sample identifiers or hierarchical clustering. There are several options for the distance metric and linkages. The users can perform principal coordinate analysis (PCoA) by clicking on the PCoA Chart icon, display its result in a 2D scatter plot, and color the dot in the scatter plot according to the selected parameter from the drop-down list at the right side.

The hierarchical clustering feature allows the user to cluster the samples using three different linkage types, average, complete, and single. The clustering is based on the pre-calculated distances, for example, weighted and unweighted UniFrac [22] or Bray-Curtis dissimilarity [23], and the samples are sorted according to the dendrogram obtained by this clustering operation. The user can change the displayed rank using the drop-down menu at the top; the default rank is set to the one chosen on the previous (microbiota composition) page. Clicking on the taxon bar expands the bar chart visualization and shows the composition of the next rank of the selected taxon. The items displayed here are chosen according to the pre-calculated dominant taxa.

PCoA, also known as classical multi-dimensional scaling, is an analytical approach that visualizes distance matrix information in the form of a two-dimensional scatter plot. Four different distance metrics are available in the system, as described above. Each point in the PCoA plot represents a sample. The continuous or nominal parameters can be used to color the sample points (Fig 3), which can help to identify the correlation between microbiota composition and the chosen parameter.

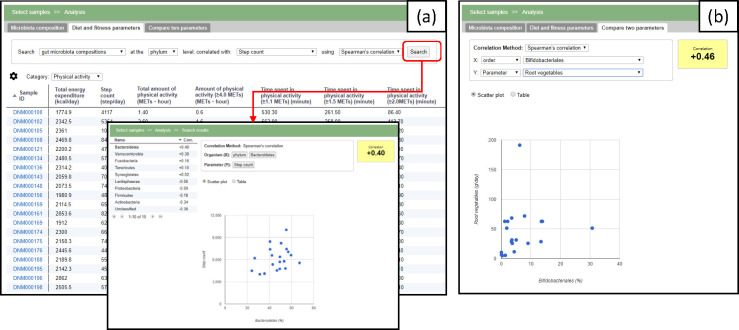
The tab ‘Phenotypic parameters’ provides an alternative entry point for the data analysis (Fig 4A). The system calculates the correlation coefficient (Pearson’s or Spearman’s) for the selected parameter against the microbial taxonomies. The last tab provides a function to show the correlation coefficient of an arbitrary pair of designated taxa or the parameter (Fig 4B).

Fig 4. Screenshots of the other two tabs.

Fig 4

(a) The phenotypic parameters can be browsed in the ‘Phenotypic parameters’ tab. The user can examine the correlations to the microbiota composition for a selected parameter. (b) In the ‘Compare two parameters’ tab, the correlation of any combination of the taxa or parameter is calculated and also displayed in a scatter plot.

Case study: Correlations between fat intake and microbiome

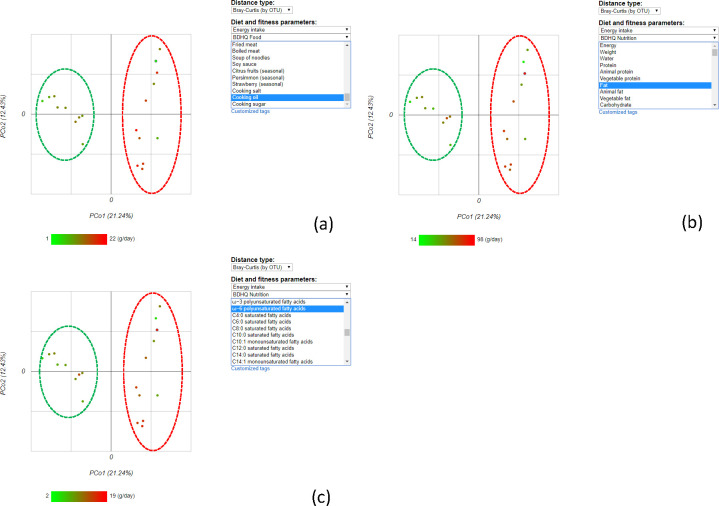
The microbiome data from 20 Japanese adults (21–41 years old, male) were analyzed as a case study to test the efficacy and usefulness of our tool. More information about the sample collection is described in the “Materials and methods” section. This example database, MDD, can be found at https://mizuguchilab.org/manta/mdd/. First, we performed PCoA using Bray-Curtis based on OTUs as distance type to evaluate the similarity among the volunteers. The 1st and 2nd principal coordinates explained 21.24% and 12.43% of the variance, respectively (Fig 5). For this plot, the user can change the color of the dots according to the selected ‘Diet and physical activity parameters’ by clicking on one of the parameters of interest from the pull-down menus. This function led us to find that the volunteers were grouped separately according to several specific parameters such as ‘Cooking oil’, ‘Fat’, or ‘ω-6 polyunsaturated fatty acids’ (Fig 5A, 5B and 5C, respectively). Next, we searched for the gut microbiota compositions that correlated with ‘Fat’ based on the Spearman’s correlation coefficient. This analysis showed that Lachnospiraceae had a positive correlation with fat intake, estimated using a brief-type self-administered diet history questionnaire (Fig 6).

Fig 5. Relationship between microbiome composition and fat intake as detected by Principal Coordinate Analysis (PCoA).

Fig 5

The dots are colored by the energy intake from (a) cooking oil, (b) fat, and (c) ω-6 polyunsaturated fatty acids. The coloring suggests that the participants could be separated into two groups, namely, High-fat (red dashed circle) and low-fat consumption (green dashed circle).

Fig 6. Search for microbiota that correlates with the parameter ‘Fat’.

Fig 6

Our tool enables investigation of the correlation between ‘microbiota composition’ and ‘Diet and physical activity parameters’ by a simple operation (selecting parameters of interest from the drop-down list). The tool shows that Lachnospiraceae was the family most positively correlated with fat intake.

Lachnospiraceae comprises butyrate producers, and it was reported that a high-fat diet with low carbohydrate intake is associated with the abundance ratios of Firmicutes to Lachnospiraceae and Ruminococcaceae [36]. With these results, we hypothesized that the ratios of Lachnospiraceae to Ruminococcaceae were affected mainly by diet, and especially fat intake.

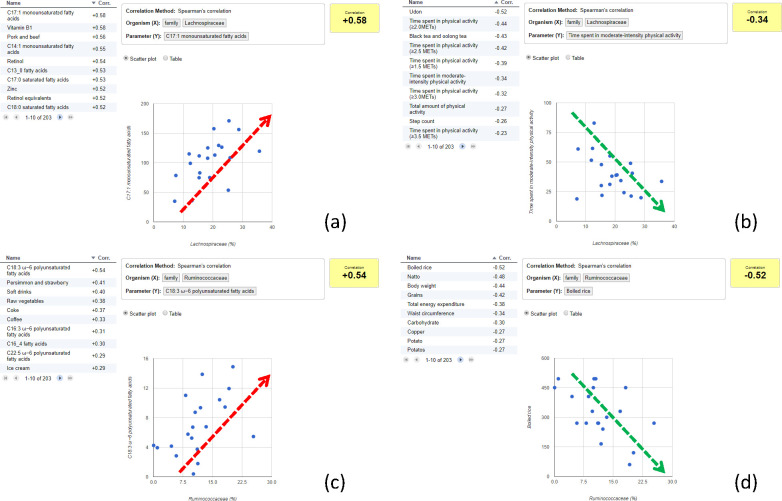
We then explored the dietary and physical activity parameters that correlated with Lachnospiraceae. We observed a positive correlation between this group and monounsaturated fatty acid or saturated fatty acid intake (Fig 7A), and a negative correlation with parameters related to the time spent doing physical activity (Fig 7B). Interestingly, Ruminococcaceae showed a similar but notably distinct tendency. This family showed a positive correlation with ω-6 polyunsaturated fatty acid intake (Fig 7C) and a negative correlation with parameters related to body composition, such as body weight and total energy expenditure, as well as the intake of carbohydrate sources such as boiled rice and grains (Fig 7D). Since Lachnospiraceae showed no strong correlation with the parameters that correlated with the Ruminococcaceae relative abundance, and vice versa, it was suggested that these two microbes are independently affected by diet.

Fig 7. Search of ‘diet and physical activity parameters’ that correlate with Lachnospiraceae or Ruminococcaceae.

Fig 7

(a) Positive correlation between monounsaturated fatty acids (MUFAs) and Lachnospiraceae. The table (left) shows the top 10 positively correlated parameters. The scatter plot (right) shows the relationship between Lachnospiraceae (x-axis) and C17:1 monounsaturated fatty acids (y-axis), which exhibited a positive correlation. (b) Negative correlation between physical activity and Lachnospiraceae. The table (left) shows the top 10 negatively correlated parameters. The scatter plot (right) shows the relationship between Lachnospiraceae (x-axis) and time spent in moderate-intensity physical activity (y-axis), which showed a negative correlation. (c) Positive correlation between polyunsaturated fatty acids (PUFA) and Ruminococcaceae. The table (left) shows the top 10 positively correlated parameters. The scatter plot (right) shows the relationship between Ruminococcaceae (x-axis) and C18:3 ω-6 polyunsaturated fatty acids (y-axis), which showed a positive correlation. (d) Negative correlation between carbohydrates (e.g. boiled rice) and Ruminococcaceae. The table (left) shows the top 10 negatively correlated parameters. The scatter plot (right) shows the relationship between Ruminococcaceae (x-axis) and ‘Boiled rice’ (y-axis), which exhibited a negative correlation.

As shown in the case study, our tool allowed us to hypothesize the relationship between gut microbiota composition (Lachnospiraceae or Ruminococcaceae) and diet and physical activity parameters (fatty acids, physical activity, or body composition). Our results are consistent with those of Zhang et al. [36], who suggested that different types of fatty acids independently affect Lachnospiraceae and Ruminococcaceae. Although these findings will require further verification for a deeper understanding of the relevant relationships, it is noteworthy that our tool successfully hypothesized probable links between microbiome and lifestyle.

Discussion

To fully understand how the microbiota affect lifestyle and vice versa, it is essential to collect microbiome data together with a detailed information about the host or the environment, in which the microbiome data were obtained. However, the analysis of such heterogeneous data is a non-trivial task. So far, the web applications that may easily allow the users to browse and analyze such data are not publicly available. Therefore, we developed a software platform for microbiome studies that allows the creation of an integrative database of the microbiome and phenotypic data and provides a user-friendly interface with online analytical functions to uncover the relationships between bacterial composition and phenotypic features.

Our case study suggested that MANTA is not only adept at storing microbiome data but is also capable of clearly demonstrating the correlations between the microbiome and lifestyle parameters. MANTA is user friendly and much of the operations can be performed by the user with only a few clicks of the mouse. Although we have analyzed the data from the human gut microbiome as the case study, MANTA framework can easily be used to investigate microbiome data from non-human hosts.

While MANTA can accommodate different data structures, it requires significant efforts by the database administrator to format the data into specific tables. To address this issue, we have developed MANTA basic, which contains a smaller number of database tables (and hence, slightly limited capabilities) but has retained the core MANTA functionality. In addition, MANTA basic is bundled with a portable web server and hence requires no additional applications to be installed separately. A comparison of MANTA and MANTA basic is listed in Table 2. In MANTA basic, we have implemented a data management interface to allow the user to upload their data; the user only needs to prepare two file types, microbiota and phenotypic parameter data in the form of tab-delimited text. Further details on how to use MANTA basic can be found in the online documentation (https://mizuguchilab.org/manta/manta-basic.html). Both MANTA and MANTA basic are available at https://mizuguchilab.org/manta/.

Table 2. A comparison of MANTA and MANTA basic.

Features MANTA MANTA basic
Visualization (Heat map, Bar chart, Pie chart) Yes Yes
Hierarchical clustering Yes Yes
Correlation analysis Yes Yes
PCoA Yes Yes
Parameter grouping* Yes No
User login Yes No
Data upload interface No Yes

* The grouping here means there is no categories or subgroup for the parameters like we described in Table 1.

We are in the process of expanding our global collaborations to elucidate associations between microbiota and the host using a variety of cohorts; thus, data will be provided by various users, and a more comprehensive user administration function will be necessary. In addition, a well-organized ontology is required to integrate the phenotypic descriptions from different cohorts. Moreover, some studies may collect data from multiple time points and thus necessitating an ability to perform temporal analysis as required. We will continuously develop new features to address these and other emerging issues in microbiome research.

Conclusions

MANTA is an analysis platform that can assist researchers working on human microbiome studies with data sharing and analysis, either on-line or on their desktop. The focus on data storage and sharing implies that MANTA is not designed to replace other tools, for example, for processing the raw sequencing data. However, MANTA is more than a generic database tool and provides some specialist functionalities; currently our emphasis is to examine the correlation between the microbial abundances and parameters such as dietary or life style parameters. MANTA addresses a long-standing challenge in microbiome research and not so easily achievable by other tools that are currently available. The MANTA framework has the potential to adequately assist studies involving human data as well those from other organisms.

Supporting information

S1 Appendix. An illustration for importing data into MANTA basic.

(DOCX)

Acknowledgments

We thank the members in the Mizuguchi lab for the critical reading of the manuscript.

Data Availability

All relevant data are within the paper and its Supporting Information files.

Funding Statement

This work was supported by the Japan Society for the Promotion of Science under grant numbers 17K07268 (K.M.), 18H02150 (J.K.), 18H02674 (J.K.), 17K09604 (J.K.), and 18K17997 (K.H.); the Japan Agency for Medical Research and Development (AMED) under grant numbers 17fk0108223h0002 (J.K.), 17ek0410032s0102 (J.K.), 17fk0108207h0002 (J.K.), 17ek0210078h0002 (J.K.), 17ak0101068h0001 (J.K.), 17gm1010006s0101 (J.K.), and 18ck0106243h0003 (J.K.); the Ministry of Health, Labour and Welfare of Japan under grant number 15654110 (M.M.); the ONO Medical Research Foundation (J.K.). The funders had no role in study design, data collection and analysis, decision to publish, or preparation of the manuscript.

References

  • 1.Backhed F, Ding H, Wang T, Hooper LV, Koh GY, Nagy A, et al. The gut microbiota as an environmental factor that regulates fat storage. Proceedings of the National Academy of Sciences of the United States of America. 2004;101(44):15718–23. 10.1073/pnas.0407076101 [DOI] [PMC free article] [PubMed] [Google Scholar]
  • 2.Ley RE, Turnbaugh PJ, Klein S, Gordon JI. Microbial ecology: human gut microbes associated with obesity. Nature. 2006;444(7122):1022–3. 10.1038/4441022a . [DOI] [PubMed] [Google Scholar]
  • 3.Gkouskou KK, Deligianni C, Tsatsanis C, Eliopoulos AG. The gut microbiota in mouse models of inflammatory bowel disease. Frontiers in cellular and infection microbiology. 2014;4:28 10.3389/fcimb.2014.00028 [DOI] [PMC free article] [PubMed] [Google Scholar]
  • 4.Clavel T, Desmarchelier C, Haller D, Gerard P, Rohn S, Lepage P, et al. Intestinal microbiota in metabolic diseases: from bacterial community structure and functions to species of pathophysiological relevance. Gut microbes. 2014;5(4):544–51. 10.4161/gmic.29331 . [DOI] [PubMed] [Google Scholar]
  • 5.Allaband C, McDonald D, Vazquez-Baeza Y, Minich JJ, Tripathi A, Brenner DA, et al. Microbiome 101: Studying, Analyzing, and Interpreting Gut Microbiome Data for Clinicians. Clin Gastroenterol Hepatol. 2019;17(2):218–30. 10.1016/j.cgh.2018.09.017 [DOI] [PMC free article] [PubMed] [Google Scholar]
  • 6.Caporaso JG, Kuczynski J, Stombaugh J, Bittinger K, Bushman FD, Costello EK, et al. QIIME allows analysis of high-throughput community sequencing data. Nature methods. 2010;7(5):335–6. 10.1038/nmeth.f.303 [DOI] [PMC free article] [PubMed] [Google Scholar]
  • 7.Wood DE, Salzberg SL. Kraken: ultrafast metagenomic sequence classification using exact alignments. Genome biology. 2014;15(3):R46 10.1186/gb-2014-15-3-r46 [DOI] [PMC free article] [PubMed] [Google Scholar]
  • 8.Huson DH, Beier S, Flade I, Gorska A, El-Hadidi M, Mitra S, et al. MEGAN Community Edition—Interactive Exploration and Analysis of Large-Scale Microbiome Sequencing Data. PLoS computational biology. 2016;12(6):e1004957 10.1371/journal.pcbi.1004957 [DOI] [PMC free article] [PubMed] [Google Scholar]
  • 9.Arndt D, Xia J, Liu Y, Zhou Y, Guo AC, Cruz JA, et al. METAGENassist: a comprehensive web server for comparative metagenomics. Nucleic acids research. 2012;40(Web Server issue):W88–95. 10.1093/nar/gks497 [DOI] [PMC free article] [PubMed] [Google Scholar]
  • 10.Wilke A, Bischof J, Gerlach W, Glass E, Harrison T, Keegan KP, et al. The MG-RAST metagenomics database and portal in 2015. Nucleic acids research. 2016;44(D1):D590–4. 10.1093/nar/gkv1322 [DOI] [PMC free article] [PubMed] [Google Scholar]
  • 11.Dhariwal A, Chong J, Habib S, King IL, Agellon LB, Xia J. MicrobiomeAnalyst: a web-based tool for comprehensive statistical, visual and meta-analysis of microbiome data. Nucleic acids research. 2017;45(W1):W180–W8. 10.1093/nar/gkx295 [DOI] [PMC free article] [PubMed] [Google Scholar]
  • 12.Zakrzewski M, Proietti C, Ellis JJ, Hasan S, Brion MJ, Berger B, et al. Calypso: a user-friendly web-server for mining and visualizing microbiome-environment interactions. Bioinformatics. 2017;33(5):782–3. 10.1093/bioinformatics/btw725 [DOI] [PMC free article] [PubMed] [Google Scholar]
  • 13.McMurdie PJ, Holmes S. Shiny-phyloseq: Web application for interactive microbiome analysis with provenance tracking. Bioinformatics. 2015;31(2):282–3. 10.1093/bioinformatics/btu616 [DOI] [PMC free article] [PubMed] [Google Scholar]
  • 14.Jin BT. Mian: Interactive Web-Based 16S rRNA Operational Taxonomic Unit Table Data Visualization and Discovery Platform. bioRxiv. 2018:416073 10.1101/416073 [DOI] [Google Scholar]
  • 15.McMurdie PJ, Holmes S. phyloseq: an R package for reproducible interactive analysis and graphics of microbiome census data. PloS one. 2013;8(4):e61217 10.1371/journal.pone.0061217 [DOI] [PMC free article] [PubMed] [Google Scholar]
  • 16.Oksanen J, Blanchet FG, Friendly M, Kindt R, Legendre P, McGlinn D, et al. vegan: Community Ecology Package. 2018. [Google Scholar]
  • 17.Bougeard S, Dray S. Supervised Multiblock Analysis in R with the ade4 Package. J Stat Softw. 2018;86(1):17 Epub 2018-09-03. 10.18637/jss.v086.i01 [DOI] [Google Scholar]
  • 18.PostgreSQL. Available from: https://www.postgresql.org/.
  • 19.Nagendra H. Opposite trends in response for the Shannon and Simpson indices of landscape diversity. Appl Geogr. 2002;22(2):175–86. 10.1016/s0143-6228(02)00002-4 [DOI] [Google Scholar]
  • 20.Hill TC, Walsh KA, Harris JA, Moffett BF. Using ecological diversity measures with bacterial communities. FEMS Microbiol Ecol. 2003;43(1):1–11. 10.1111/j.1574-6941.2003.tb01040.x . [DOI] [PubMed] [Google Scholar]
  • 21.Morris EK, Caruso T, Buscot F, Fischer M, Hancock C, Maier TS, et al. Choosing and using diversity indices: insights for ecological applications from the German Biodiversity Exploratories. Ecol Evol. 2014;4(18):3514–24. 10.1002/ece3.1155 [DOI] [PMC free article] [PubMed] [Google Scholar]
  • 22.Lozupone C, Knight R. UniFrac: a new phylogenetic method for comparing microbial communities. Applied and environmental microbiology. 2005;71(12):8228–35. 10.1128/AEM.71.12.8228-8235.2005 [DOI] [PMC free article] [PubMed] [Google Scholar]
  • 23.Bray JR, Curtis JT. An Ordination of the Upland Forest Communities of Southern Wisconsin. Ecol Monogr. 1957;27(4):325–49. 10.2307/1942268 [DOI] [Google Scholar]
  • 24.Google Web Toolkit. Available from: http://www.gwtproject.org/.
  • 25.Hosomi K, Ohno H, Murakami H, Natsume-Kitatani Y, Tanisawa K, Hirata S, et al. Method for preparing DNA from feces in guanidine thiocyanate solution affects 16S rRNA-based profiling of human microbiota diversity. Scientific reports. 2017;7(1):4339 10.1038/s41598-017-04511-0 . [DOI] [PMC free article] [PubMed] [Google Scholar]
  • 26.Mohsen A, Park J, Chen YA, Kawashima H, Mizuguchi K. Impact of quality trimming on the efficiency of reads joining and diversity analysis of Illumina paired-end reads in the context of QIIME1 and QIIME2 microbiome analysis frameworks. BMC Bioinformatics. 2019;20(1):581 10.1186/s12859-019-3187-5 [DOI] [PMC free article] [PubMed] [Google Scholar]
  • 27.Mohsen A, Park J, Kawashima H, Chen YA, Natsume-Kitatani Y, Mizuguchi K. Auto-q Qiime Analysis Automating Script. 1.0 ed: Zenodo; 2018. [Google Scholar]
  • 28.Edgar RC. Search and clustering orders of magnitude faster than BLAST. Bioinformatics. 2010;26(19):2460–1. 10.1093/bioinformatics/btq461 . [DOI] [PubMed] [Google Scholar]
  • 29.Quast C, Pruesse E, Yilmaz P, Gerken J, Schweer T, Yarza P, et al. The SILVA ribosomal RNA gene database project: improved data processing and web-based tools. Nucleic acids research. 2013;41(Database issue):D590–6. 10.1093/nar/gks1219 [DOI] [PMC free article] [PubMed] [Google Scholar]
  • 30.Yilmaz P, Parfrey LW, Yarza P, Gerken J, Pruesse E, Quast C, et al. The SILVA and "All-species Living Tree Project (LTP)" taxonomic frameworks. Nucleic acids research. 2014;42(Database issue):D643–8. 10.1093/nar/gkt1209 [DOI] [PMC free article] [PubMed] [Google Scholar]
  • 31.NCBI Taxonomy Database. Available from: https://www.ncbi.nlm.nih.gov/taxonomy/.
  • 32.Chen YA, Tripathi LP, Mizuguchi K. TargetMine, an integrated data warehouse for candidate gene prioritisation and target discovery. PloS one. 2011;6(3):e17844 10.1371/journal.pone.0017844 [DOI] [PMC free article] [PubMed] [Google Scholar]
  • 33.Chen YA, Tripathi LP, Mizuguchi K. An integrative data analysis platform for gene set analysis and knowledge discovery in a data warehouse framework. Database: the journal of biological databases and curation. 2016;2016:baw009 10.1093/database/baw009 [DOI] [PMC free article] [PubMed] [Google Scholar]
  • 34.Morgenthaler S. A survey of robust statistics. Stat Methods Appl. 2007;15(3):271–93. 10.1007/s10260-006-0034-4 [DOI] [Google Scholar]
  • 35.Croux C, Dehon C. Influence functions of the Spearman and Kendall correlation measures. Stat Methods Appl. 2010;19(4):497–515. 10.1007/s10260-010-0142-z [DOI] [Google Scholar]
  • 36.Zhang C, Zhang M, Pang X, Zhao Y, Wang L, Zhao L. Structural resilience of the gut microbiota in adult mice under high-fat dietary perturbations. ISME J. 2012;6(10):1848–57. 10.1038/ismej.2012.27 [DOI] [PMC free article] [PubMed] [Google Scholar]

Decision Letter 0

Lingling An

13 Jul 2020

PONE-D-20-09945

MANTA, an integrative database and analysis platform that relates microbiome and phenotypic data

PLOS ONE

Dear Dr. Chen,

Thank you for submitting your manuscript to PLOS ONE. After careful consideration, we feel that it has merit but does not fully meet PLOS ONE’s publication criteria as it currently stands. Therefore, we invite you to submit a revised version of the manuscript that addresses the points raised during the review process.

Please submit your revised manuscript by Aug 27 2020 11:59PM. If you will need more time than this to complete your revisions, please reply to this message or contact the journal office at plosone@plos.org. When you're ready to submit your revision, log on to https://www.editorialmanager.com/pone/ and select the 'Submissions Needing Revision' folder to locate your manuscript file.

Please include the following items when submitting your revised manuscript:

  • A rebuttal letter that responds to each point raised by the academic editor and reviewer(s). You should upload this letter as a separate file labeled 'Response to Reviewers'.

  • A marked-up copy of your manuscript that highlights changes made to the original version. You should upload this as a separate file labeled 'Revised Manuscript with Track Changes'.

  • An unmarked version of your revised paper without tracked changes. You should upload this as a separate file labeled 'Manuscript'.

If you would like to make changes to your financial disclosure, please include your updated statement in your cover letter. Guidelines for resubmitting your figure files are available below the reviewer comments at the end of this letter.

If applicable, we recommend that you deposit your laboratory protocols in protocols.io to enhance the reproducibility of your results. Protocols.io assigns your protocol its own identifier (DOI) so that it can be cited independently in the future. For instructions see: http://journals.plos.org/plosone/s/submission-guidelines#loc-laboratory-protocols

We look forward to receiving your revised manuscript.

Kind regards,

Lingling An

Academic Editor

PLOS ONE

Journal Requirements:

When submitting your revision, we need you to address these additional requirements.

1. Please ensure that your manuscript meets PLOS ONE's style requirements, including those for file naming. The PLOS ONE style templates can be found at

https://journals.plos.org/plosone/s/file?id=wjVg/PLOSOne_formatting_sample_main_body.pdf and

https://journals.plos.org/plosone/s/file?id=ba62/PLOSOne_formatting_sample_title_authors_affiliations.pdf

[Note: HTML markup is below. Please do not edit.]

Reviewers' comments:

Reviewer's Responses to Questions

Comments to the Author

1. Is the manuscript technically sound, and do the data support the conclusions?

The manuscript must describe a technically sound piece of scientific research with data that supports the conclusions. Experiments must have been conducted rigorously, with appropriate controls, replication, and sample sizes. The conclusions must be drawn appropriately based on the data presented.

Reviewer #1: Partly

Reviewer #2: Yes

Reviewer #3: Partly

**********

2. Has the statistical analysis been performed appropriately and rigorously?

Reviewer #1: N/A

Reviewer #2: N/A

Reviewer #3: N/A

**********

3. Have the authors made all data underlying the findings in their manuscript fully available?

The PLOS Data policy requires authors to make all data underlying the findings described in their manuscript fully available without restriction, with rare exception (please refer to the Data Availability Statement in the manuscript PDF file). The data should be provided as part of the manuscript or its supporting information, or deposited to a public repository. For example, in addition to summary statistics, the data points behind means, medians and variance measures should be available. If there are restrictions on publicly sharing data—e.g. participant privacy or use of data from a third party—those must be specified.

Reviewer #1: Yes

Reviewer #2: Yes

Reviewer #3: No

**********

4. Is the manuscript presented in an intelligible fashion and written in standard English?

PLOS ONE does not copyedit accepted manuscripts, so the language in submitted articles must be clear, correct, and unambiguous. Any typographical or grammatical errors should be corrected at revision, so please note any specific errors here.

Reviewer #1: No

Reviewer #2: Yes

Reviewer #3: Yes

**********

5. Review Comments to the Author

Please use the space provided to explain your answers to the questions above. You may also include additional comments for the author, including concerns about dual publication, research ethics, or publication ethics. (Please upload your review as an attachment if it exceeds 20,000 characters)

Reviewer #1: This reviewer is not a bioinformatician by training, but has basic understanding. Therefore, the comments are more from a end-user perspective.

The article requires substantial rewriting. The reviewer had to jump across manuscript to find and link information.

Should follow the pattern of guiding the readers from what the tool is about to how one can use it properly.

The introduction is vague and requires restructuring. It can be importance of microbiota, challenges in microbiota data, currently available tools and what MANTA does in more succinct way.

MANTA provides an alternative to currently available tools. However, lacks functionality commonly found in tools that were cited in the paper. There are many tools (MicrobiomeAnalyst or Calypso, shiny-phyloseq) which can do more than MANTA. A comparison table of MANTA functionality and other tools the authors mention will be useful.

The concept to database is a bit far fetched in this study. As far as I see, it is like other tools e.g. MicrobiomeAnalyst or Calypso where you just upload tables and do analysis. It is somewhat similar to a phyloseq object only that MANTA is implemented in java and stores info in *.db which can have its advantages. However, there is a need to incorporate phylogenetic and sequence information.

I would also like the authors to check the analysis options that are provided by tool called Main (still testing phase). https://www.biorxiv.org/content/10.1101/416073v1

For MANTA to have application for broader analysis, it should have provision for making database using ASV sequences. In this way you can compare across studies to identify common ASVs for analysis. OTU-taxonomy based approach is not recommended (Callahan et al. 2017 PMID: 28731476). For e.g. if I have first project for cancer and healthy microbiota for which I have ASVs sequence abundances and another project for IBD and healthy microbiota, I should be able to analyse these together for a meta analysis. This would be the advantage of having a database like structure. The advantage will be that the web server of authors may not be overloaded by analyzing raw reads but still has high utility because sequence information is stored for every project. This can be organized at user level where only specific user who owns the data can access all their projects that have been processed in similar way.

For research groups that do not have data scientists, they can still do basic analysis that MANTA provides. What they need is advanced analysis with well written documentation and tutorials to guide such analysis. e.g Machine learning random forests etc.

Minor comments:

Through out the article please use the term microbiome and microbiota appropriately, see https://microbiomejournal.biomedcentral.com/articles/10.1186/s40168-015-0094-5.

In addiiton, the name of the tool can be changed to its betterment as the name MANTA has been used previously.

manta http://www.bioconductor.org/packages/release/bioc/html/manta.html

manta: https://msystems.asm.org/content/5/1/e00903-19

In summary, I see great potential for the tool but it requires substantial improvements for having a wider impact or usefulness.

Reviewer #2: This manuscript provides a well-designed website to analyze microbiome datasets. The key idea is to provide a graphical interface to enable users to browse or analyze their own data or the example datasets. To my understanding, this work has overlapping features with MicrobiomeAnalyst. Thus the validity of the innovation is not clear. I have also listed other issues as follows.

1. The website (https://mizuguchilab.org/manta-example/#en_heatmap) does not function well (Mac Mojave). It always shows “An error occurred while attempting to contact the server. Please check your network connection and try again.” I cannot test this database as a reviewer.

2. The online account system is probably incomplete. Users cannot register. This limits the use of MANTA website to only its developers.

3. I am not clear which function is uniquely available for MANTA and not in other software/websites.

4. The authors claims that MANTA is ‘an integrative database’. As database should allow users to create, read, update, or delete data entries, I do not see MANTA currently support these functions in its website.

5. For ordinal parameters, how the correlation is calculated and visualized?

6. “The assigned ranks and names were searched against the TargetMine data warehouse… ” TargetMine seems to be a gene analysis website developed by the same first author. I am not clear how this website can be used for searching microbiome names.

7. There is no download link for “MANTA basic”. I cannot find the download link and cannot test it either.

Reviewer #3: The manuscript describes a website, MANTA, that can be used to store user-uploaded information and perform analysis through web-based user interface. That being said, I encountered some difficulties when I was trying this website and cannot evaluate whether the website is good-to-go or not (will be described below). So I mostly comment on the manuscript itself, trying to guess what the authors were trying to do and how it should look like. Below please find my comments.

1. This is about the website itself. When I want to try this website by clicking on the link in the example dataset tab (https://mizuguchilab.org/manta-example/), the system popped up a message saying that “An error occurred while attempting to contact the server. Please check your network connection and try again”. Due to this I cannot evaluate the full functionality of this website. Please see attached Figure 1 for a screenshot.

2. From the description of the manuscript it looks like the users can upload some information and conduct some analysis by themselves. The tutorial also offers such helps. I however do not see the same figure as shown in the tutorial, in which users are supposed to upload their own data through “Data management” menu items but I just cannot see such thing exists (see attached Figure 2). Two possible reasons may be that the website is down when I was trying to test it, or that there are certain problems associated with the website. I suggest the authors carefully check their websites before submitting their manuscript.

3. The manuscript claims that it is able to relate microbiome and phenotypic data. Yet the functionality that they supported is simply invoking existing R commands/libraries on the datasets without providing novel insights. Furthermore, while the authors claim that they want to develop a website for people not familiar with running programs on command line-based platforms, they still require the microbiota to be analyzed and the OTUs extracted before submitting the data to the MANTA website. This creates a dilemma—researchers that can run the microbiota analysis by themselves do not need their website for phenotypic correlation analysis, and that people who do not know how to run commands cannot analyze microbiota as the authors require. I hence doubt the very existence meaning of the MANTA website and hope that the authors can very carefully think and discuss with non-computational scientists about their needs.

4. The authors are mixing up 16S-based methods with whole-metagenome-based methods, as seen when they are talking about tools such as QIIME, MEGAN, Kraken, and Metaphlan2. The web-based systems that they talked about are mostly whole-metagenome-based methods as well. I suggest the authors at least distinguishing to their best effort between 16S and whole-metagenome and/or discussing their potential uses toward their own systems.

5. There is not “Data preprocessing section” as mentioned in line 96.

6. I am not very sure why the authors mention “free text” in line 101 as one of their parameter forms. I frankly do not think their system can deal with free text according to their description of the website functionalities. Maybe they just want to raise a possible example. If this is the case then this part needs to be re-written in order not to confuse the readers.

7. The authors talked about converting absolute abundances to relative ones for analysis purpose (line 108). Pardon me, but to the best of my knowledge common software packages provide mostly proportions. Therefore I have no idea why the authors want to claim this function.

8. For the description of the case study in Methods, the authors should provide more details, including when the 20 Japanese adults study was conducted. The authors may also want to explain why only a subset of parameters was released. (hence that perhaps not all data are publicly available for publication or review purpose)

9. The analysis pipeline using QIIME was not up-to-date. I understand that some people still use QIIME instead of QIIME2 since they are quite different in some sense; however the SILVA database is outdated. I also don’t understand what the authors mean by mentioning “the taxonomy hierarchy is continuous refined and updated…we reconstructed the phylogenetic lineages using the NCBI taxonomy database (line 143-145).” This part is vague at best, and I honestly do not know what their purposes to “reconstruct” the SILVA-based taxonomic inferences are. Please check your pipeline and conduct the analysis using the most up-to-date datasets/software/versions.

10. The authors mention that the parameters that they are able to asses are “limited to continuous variables (line 200)”. I wonder why they set such restrictions. Does it also mean that their system cannot handle nominal or categorical data?

11. I highly suggest the authors check QIIME2 visualization support since a lot of functionalities that they claim are already supported by QIIME2, for example the coloring of sample points according to the numerical or nominal parameters (line 238).

12. The resolutions of the figures are very poor. Please consider making higher quality ones.

13. Due to poor figure quality and the inability to test the website, I cannot tell whether the authors provide significance metrics such as p-value/FDR or adjust R-squared. Please consider adding such metrics in order to help your users interpreting data if these are not supported.

14. The authors claim that “for users who wish to use the platform for analyzing their data, we also developed MANTA basic.” This is also very intriguing since it hinted that the existing MANTA website only supports the display of the 20-Japanese data, and that the users need to install their own system if they want to analyze their data. If this is true then I honestly do not know the existence meaning of the MANTA website. Please clarify if this is the case.

15. I don’t understand what does “parameter grouping” mean during the comparison between MANTA and MANTA Basic. Please clarify.

16. (line 173) pageable --> do you mean scrollable?

17. (line 192) 10 most abundant will --> 10 most abundant ones will

**********

6. PLOS authors have the option to publish the peer review history of their article (what does this mean?). If published, this will include your full peer review and any attached files.

If you choose “no”, your identity will remain anonymous but your review may still be made public.

Do you want your identity to be public for this peer review? For information about this choice, including consent withdrawal, please see our Privacy Policy.

Reviewer #1: No

Reviewer #2: No

Reviewer #3: No

[NOTE: If reviewer comments were submitted as an attachment file, they will be attached to this email and accessible via the submission site. Please log into your account, locate the manuscript record, and check for the action link "View Attachments". If this link does not appear, there are no attachment files.]

While revising your submission, please upload your figure files to the Preflight Analysis and Conversion Engine (PACE) digital diagnostic tool, https://pacev2.apexcovantage.com/. PACE helps ensure that figures meet PLOS requirements. To use PACE, you must first register as a user. Registration is free. Then, login and navigate to the UPLOAD tab, where you will find detailed instructions on how to use the tool. If you encounter any issues or have any questions when using PACE, please email PLOS at figures@plos.org. Please note that Supporting Information files do not need this step.

PLoS One. 2020 Dec 4;15(12):e0243609. doi: 10.1371/journal.pone.0243609.r002

Author response to Decision Letter 0


26 Aug 2020

Response to Reviewers

To present the aim of our work clearly, we have reorganized the introduction. Besides, we also refined several paragraphs that may have led to some misunderstandings. Concerning the failure of the website, we have fixed the problem and started to monitor the availability of the service.

Details:

Reviewer #1: This reviewer is not a bioinformatician by training, but has basic understanding. Therefore, the comments are more from a end-user perspective.

The article requires substantial rewriting. The reviewer had to jump across manuscript to find and link information.

Should follow the pattern of guiding the readers from what the tool is about to how one can use it properly.

The introduction is vague and requires restructuring. It can be importance of microbiota, challenges in microbiota data, currently available tools and what MANTA does in more succinct way.

Thank you for the comments. We have reorganized the introduction following the reviewer’s suggestions. We rewrote it to reflect precisely the purpose and the aim of our work, and we believe that the current changes have increased the clarity of our article.

MANTA provides an alternative to currently available tools. However, lacks functionality commonly found in tools that were cited in the paper. There are many tools (MicrobiomeAnalyst or Calypso, shiny-phyloseq) which can do more than MANTA. A comparison table of MANTA functionality and other tools the authors mention will be useful.

The concept to database is a bit far fetched in this study. As far as I see, it is like other tools e.g. MicrobiomeAnalyst or Calypso where you just upload tables and do analysis. It is somewhat similar to a phyloseq object only that MANTA is implemented in java and stores info in *.db which can have its advantages. However, there is a need to incorporate phylogenetic and sequence information.

I would also like the authors to check the analysis options that are provided by tool called Main (still testing phase). https://www.biorxiv.org/content/10.1101/416073v1

MANTA is a software program that can assist researchers working on human microbiome studies with data sharing and analysis, either on-line or on their desktop. The focus of the data storage and sharing means that MANTA is not designed to replace other tools, for example, for processing the raw sequencing data. However, it is beyond a generic database tool and provides some specialist functionalities; currently our emphasis is on the ability to examine the correlation between the microbial abundances and other parameters such as dietary or life style parameters, an arbitrary (large) number of them that are being collected by the study. We chose to implement this function in MANTA because it is typically requested by our collaborators and yet it is not so easily achievable by other tools that are currently available. For some other analysis functions (such as phylogenetic distances), we may have to rely on external tools, and we have now described those tools including R phyloseq, or vegan package in the implementation section of the materials and methods. Still, MANTA’s flexible structure allows us to add new functionalities easily, and we plan to do so in the future versions.

For MANTA to have application for broader analysis, it should have provision for making database using ASV sequences. In this way you can compare across studies to identify common ASVs for analysis. OTU-taxonomy based approach is not recommended (Callahan et al. 2017 PMID: 28731476). For e.g. if I have first project for cancer and healthy microbiota for which I have ASVs sequence abundances and another project for IBD and healthy microbiota, I should be able to analyse these together for a meta analysis. This would be the advantage of having a database like structure. The advantage will be that the web server of authors may not be overloaded by analyzing raw reads but still has high utility because sequence information is stored for every project. This can be organized at user level where only specific user who owns the data can access all their projects that have been processed in similar way.

MANTA can be used for either ASVs or OTUs, with no difference. In our case study, we showed an example, which happened to have used OTUs. We have revised the paragraph to clarify this concept; we have also added further clarification in the section related to MANTA’s functions to avoid this confusion.

For research groups that do not have data scientists, they can still do basic analysis that MANTA provides. What they need is advanced analysis with well written documentation and tutorials to guide such analysis. e.g Machine learning random forests etc.

We are aware that users competent with command-line tools could do the same analysis using other tools. However, our typical use case scenarios will involve an interactive examination of a few thousand parameter combinations, especially dealing with diverse data types such as dietary habits, which can consist of hundreds of measurements. Sharing both the original data and the analysis results among all the project members would be a complicated task and instead, we believe that a tool such as MANTA can do a better job by allowing all the members to browse and examine the data.

Minor comments:

Through out the article please use the term microbiome and microbiota appropriately, see https://microbiomejournal.biomedcentral.com/articles/10.1186/s40168-015-0094-5.

Thank you for raising this issue. We have replaced all the occurrences of the term to be compatible with the suggestions in this article.

In addition, the name of the tool can be changed to its betterment as the name MANTA has been used previously.

manta http://www.bioconductor.org/packages/release/bioc/html/manta.html

manta: https://msystems.asm.org/content/5/1/e00903-19

We appreciate the information but we wish to retain the name MANTA, because we released the project on GitHub in March 2019 (earlier than the resources above), and we have already presented the work in several conferences including ISMB 2019 (Intelligent Systems for Molecular Biology). In addition, several microbiome projects have adopted MANTA to host their data.

In summary, I see great potential for the tool but it requires substantial improvements for having a wider impact or usefulness.

We thank the reviewer for their constructive and critical feedback.

Reviewer #2: This manuscript provides a well-designed website to analyze microbiome datasets. The key idea is to provide a graphical interface to enable users to browse or analyze their own data or the example datasets. To my understanding, this work has overlapping features with MicrobiomeAnalyst. Thus the validity of the innovation is not clear. I have also listed other issues as follows.

1. The website (https://mizuguchilab.org/manta-example/#en_heatmap) does not function well (Mac Mojave). It always shows “An error occurred while attempting to contact the server. Please check your network connection and try again.” I cannot test this database as a reviewer.

We apologize for the service having been temporarily unavailable. We have fixed the problem and it is fully functional now. We have also started monitoring the service to prevent any connection failure.

2. The online account system is probably incomplete. Users cannot register. This limits the use of MANTA website to only its developers.

The example database MANTA demonstration database (MDD) is a demonstration of main (but not all) functions of MANTA; it does not provide user data upload and account management functions. We clarified this point by adding notes on both the manuscript and the website.

3. I am not clear which function is uniquely available for MANTA and not in other software/websites.

MANTA has two important unique features: 1) the ability to store and share the data, either on-line or locally, in a user friendly easily-accessible database, and 2) providing an interactive environment to examine the correlation between the microbial abundances and other data collected such as dietary habits and lifestyle parameters, which can be of huge size and in multiple dimensions. We have made these two unique features mentioned clearly in the manuscript.

4. The authors claims that MANTA is ‘an integrative database’. As database should allow users to create, read, update, or delete data entries, I do not see MANTA currently support these functions in its website.

At the moment, the data management in MANTA relies on the database management system in PostgreSQL database. To transform MANTA into a more mature data storage/sharing system, we will work on adding functions for data manipulation within the system.

5. For ordinal parameters, how the correlation is calculated and visualized?

At the moment, only the continuous variables are used for the correlation analysis. We plan to make use of the ordinal parameters for analysis in the future development.

6. “The assigned ranks and names were searched against the TargetMine data warehouse… ” TargetMine seems to be a gene analysis website developed by the same first author. I am not clear how this website can be used for searching microbiome names.

TargetMine is an integrated data warehouse for target prioritization. It integrates, among many other data types, taxonomy information. In building our example database, we used TargetMine to determine the taxonomy identifiers for our data but users can use any tool for preparing their data. We have clarified this point in the manuscript.

7. There is no download link for “MANTA basic”. I cannot find the download link and cannot test it either.

Thank you for telling us the difficulty in finding the download link. Maybe we did not design our website very well. We have reorganized it and we hope these changes can increase the visibility of the download link.

Reviewer #3: The manuscript describes a website, MANTA, that can be used to store user-uploaded information and perform analysis through web-based user interface. That being said, I encountered some difficulties when I was trying this website and cannot evaluate whether the website is good-to-go or not (will be described below). So I mostly comment on the manuscript itself, trying to guess what the authors were trying to do and how it should look like. Below please find my comments.

1. This is about the website itself. When I want to try this website by clicking on the link in the example dataset tab (https://mizuguchilab.org/manta-example/), the system popped up a message saying that “An error occurred while attempting to contact the server. Please check your network connection and try again”. Due to this I cannot evaluate the full functionality of this website. Please see attached Figure 1 for a screenshot.

We apologize for the service having been temporarily unavailable. We have fixed the problem and it is fully functional now.

2. From the description of the manuscript it looks like the users can upload some information and conduct some analysis by themselves. The tutorial also offers such helps. I however do not see the same figure as shown in the tutorial, in which users are supposed to upload their own data through “Data management” menu items but I just cannot see such thing exists (see attached Figure 2). Two possible reasons may be that the website is down when I was trying to test it, or that there are certain problems associated with the website. I suggest the authors carefully check their websites before submitting their manuscript.

We have presented an analysis platform named MANTA, which can assist building an online data storage and sharing system for microbiota composition and various types of phenotypic data. Recognizing the amount of tasks for pre-processing the data and setting up an on-line database system, we have also developed a simplified tool named MANTA basic. MANTA basic can be installed and run on a PC/Mac and also provides a data importing interface (the “Data management” function).

3. The manuscript claims that it is able to relate microbiome and phenotypic data. Yet the functionality that they supported is simply invoking existing R commands/libraries on the datasets without providing novel insights. Furthermore, while the authors claim that they want to develop a website for people not familiar with running programs on command line-based platforms, they still require the microbiota to be analyzed and the OTUs extracted before submitting the data to the MANTA website. This creates a dilemma—researchers that can run the microbiota analysis by themselves do not need their website for phenotypic correlation analysis, and that people who do not know how to run commands cannot analyze microbiota as the authors require. I hence doubt the very existence meaning of the MANTA website and hope that the authors can very carefully think and discuss with non-computational scientists about their needs.

We have rewritten the Introduction and tried to define what we would like to achieve in the manuscript.

Yes, visualization and correlation analysis could be done using R. However, unlike processing the sequencing data, which is usually a one-time task, this type of analysis requires the examination of a large number of parameters in a repeated manner, a tedious job to do using the command line tools. MANTA allows the users to reproduce and share their analysis results easily.

4. The authors are mixing up 16S-based methods with whole-metagenome-based methods, as seen when they are talking about tools such as QIIME, MEGAN, Kraken, and Metaphlan2. The web-based systems that they talked about are mostly whole-metagenome-based methods as well. I suggest the authors at least distinguishing to their best effort between 16S and whole-metagenome and/or discussing their potential uses toward their own systems.

Thank you for pointing this out. We have refined the introduction and explained that different tools are used for different purposes.

5. There is not “Data preprocessing section” as mentioned in line 96.

We apologize for this mistake. After reorganizing the article, there is no “Data preprocessing section” any more. We have removed the phrase.

6. I am not very sure why the authors mention “free text” in line 101 as one of their parameter forms. I frankly do not think their system can deal with free text according to their description of the website functionalities. Maybe they just want to raise a possible example. If this is the case then this part needs to be re-written in order not to confuse the readers.

We apologize for the confusion. The “free text” here means that the value is a character string, and will not be used for any calculation. We have removed the word “free” in the manuscript.

7. The authors talked about converting absolute abundances to relative ones for analysis purpose (line 108). Pardon me, but to the best of my knowledge common software packages provide mostly proportions. Therefore I have no idea why the authors want to claim this function.

We agree that the use of the term "absolute" is not appropriate here. What we meant here was the counts before rarefication. We have updated the related paragraph by removing the confusing sentence.

8. For the description of the case study in Methods, the authors should provide more details, including when the 20 Japanese adults study was conducted. The authors may also want to explain why only a subset of parameters was released. (hence that perhaps not all data are publicly available for publication or review purpose)

This example database (now called MDD, to make its purpose clear) was developed to demonstrate main functions of MANTA. We took a small subset, sufficient for this purpose, of the data collected in a cohort study involving a few thousand healthy Japanese adults. Details of the original study will be described elsewhere and the whole data will be released with a new publication. In this manuscript, we have provided necessary information to understand this example database. The whole case study was conducted using only this subset of the data. We have clarified this point in the manuscript.

9. The analysis pipeline using QIIME was not up-to-date. I understand that some people still use QIIME instead of QIIME2 since they are quite different in some sense; however the SILVA database is outdated. I also don’t understand what the authors mean by mentioning “the taxonomy hierarchy is continuous refined and updated…we reconstructed the phylogenetic lineages using the NCBI taxonomy database (line 143-145).” This part is vague at best, and I honestly do not know what their purposes to “reconstruct” the SILVA-based taxonomic inferences are. Please check your pipeline and conduct the analysis using the most up-to-date datasets/software/versions.

We understand that the QIIME and SILVA versions used in the manuscript are somewhat old, but our objective here was to demonstrate the main functionality of MANTA, which is unaffected by the version numbers.

Regarding the “reconstruct” description, what we would like to explain was that the genus identified from the SILVA database was converted to taxonomy ID and we used the taxonomy hierarchy in the NCBI Taxonomy database. We agree that it can be a confusing description and we have refined it in the manuscript to improve clarity.

10. The authors mention that the parameters that they are able to asses are “limited to continuous variables (line 200)”. I wonder why they set such restrictions. Does it also mean that their system cannot handle nominal or categorical data?

At the moment, the correlation analysis only deals with the continuous variables. The nominal or categorical data are only used for visualization. We plan to add other analysis approaches, which use the categorical data in the future development.

11. I highly suggest the authors check QIIME2 visualization support since a lot of functionalities that they claim are already supported by QIIME2, for example the coloring of sample points according to the numerical or nominal parameters (line 238).

We agree that some visualization functions of MANTA can be also achieved by using QIIME2 as well as other tools such as R. However, MANTA’s main focus is the ability to data storage and data/analysis sharing among the project members. We have, nevertheless, added an appropriate discussion on these related tools in the revised manuscript.

12. The resolutions of the figures are very poor. Please consider making higher quality ones.

We did submit high quality images but the PDF processing steps may have decreased the image resolution. We will confirm the image quality when submitting the revised manuscript.

13. Due to poor figure quality and the inability to test the website, I cannot tell whether the authors provide significance metrics such as p-value/FDR or adjust R-squared. Please consider adding such metrics in order to help your users interpreting data if these are not supported.

Thank you for the suggestions. We have added p-value for the correlation in the application. We will also consider adding other significance metrics in the future developments.

14. The authors claim that “for users who wish to use the platform for analyzing their data, we also developed MANTA basic.” This is also very intriguing since it hinted that the existing MANTA website only supports the display of the 20-Japanese data, and that the users need to install their own system if they want to analyze their data. If this is true then I honestly do not know the existence meaning of the MANTA website. Please clarify if this is the case.

We apologize for the confusion. We explicitly named what the reviewer called the MANTA website “MDD” (MANTA demonstration database); MDD is designed for demonstrating the functionality of MANTA by using a small example data set. MANTA needs to be installed in a server setting or a local machine (MANTA basic) to be used for both storing and analyzing the data. We have presented a software program, instead of an online resource. We have extensively modified the manuscript to clarify these points.

15. I don’t understand what does “parameter grouping” mean during the comparison between MANTA and MANTA Basic. Please clarify.

To browse a large number of phenotypic parameters easily, MANTA implements a function of classifying them into groups (see Table 1). In MANTA basic, this function is unavailable due to the simplified data structure. We have added a footnote to comparison table (Table 2) to clarify this point.

16. (line 173) pageable --> do you mean scrollable?

We agree that this term is ambiguous. We have used the word "scrollable" instead.

17. (line 192) 10 most abundant will --> 10 most abundant ones will

We have rephrased the sentence.

Attachment

Submitted filename: manta-response-to-reviewers.docx

Decision Letter 1

Lingling An

16 Oct 2020

PONE-D-20-09945R1

MANTA, an integrative database and analysis platform that relates microbiome and phenotypic data

PLOS ONE

Dear Dr. Chen,

Thank you for submitting your manuscript to PLOS ONE. After careful consideration, we feel that it has merit but does not fully meet PLOS ONE’s publication criteria as it currently stands. Therefore, we invite you to submit a revised version of the manuscript that addresses the points raised during the review process.

Please submit your revised manuscript by Nov 30 2020 11:59PM. If you will need more time than this to complete your revisions, please reply to this message or contact the journal office at plosone@plos.org. When you're ready to submit your revision, log on to https://www.editorialmanager.com/pone/ and select the 'Submissions Needing Revision' folder to locate your manuscript file.

Please include the following items when submitting your revised manuscript:

  • A rebuttal letter that responds to each point raised by the academic editor and reviewer(s). You should upload this letter as a separate file labeled 'Response to Reviewers'.

  • A marked-up copy of your manuscript that highlights changes made to the original version. You should upload this as a separate file labeled 'Revised Manuscript with Track Changes'.

  • An unmarked version of your revised paper without tracked changes. You should upload this as a separate file labeled 'Manuscript'.

If you would like to make changes to your financial disclosure, please include your updated statement in your cover letter. Guidelines for resubmitting your figure files are available below the reviewer comments at the end of this letter.

If applicable, we recommend that you deposit your laboratory protocols in protocols.io to enhance the reproducibility of your results. Protocols.io assigns your protocol its own identifier (DOI) so that it can be cited independently in the future. For instructions see: http://journals.plos.org/plosone/s/submission-guidelines#loc-laboratory-protocols

We look forward to receiving your revised manuscript.

Kind regards,

Lingling An

Academic Editor

PLOS ONE

[Note: HTML markup is below. Please do not edit.]

Reviewers' comments:

Reviewer's Responses to Questions

Comments to the Author

1. If the authors have adequately addressed your comments raised in a previous round of review and you feel that this manuscript is now acceptable for publication, you may indicate that here to bypass the “Comments to the Author” section, enter your conflict of interest statement in the “Confidential to Editor” section, and submit your "Accept" recommendation.

Reviewer #1: All comments have been addressed

Reviewer #2: (No Response)

Reviewer #3: (No Response)

**********

2. Is the manuscript technically sound, and do the data support the conclusions?

The manuscript must describe a technically sound piece of scientific research with data that supports the conclusions. Experiments must have been conducted rigorously, with appropriate controls, replication, and sample sizes. The conclusions must be drawn appropriately based on the data presented.

Reviewer #1: Yes

Reviewer #2: Yes

Reviewer #3: Partly

**********

3. Has the statistical analysis been performed appropriately and rigorously?

Reviewer #1: I Don't Know

Reviewer #2: N/A

Reviewer #3: Yes

**********

4. Have the authors made all data underlying the findings in their manuscript fully available?

The PLOS Data policy requires authors to make all data underlying the findings described in their manuscript fully available without restriction, with rare exception (please refer to the Data Availability Statement in the manuscript PDF file). The data should be provided as part of the manuscript or its supporting information, or deposited to a public repository. For example, in addition to summary statistics, the data points behind means, medians and variance measures should be available. If there are restrictions on publicly sharing data—e.g. participant privacy or use of data from a third party—those must be specified.

Reviewer #1: Yes

Reviewer #2: Yes

Reviewer #3: No

**********

5. Is the manuscript presented in an intelligible fashion and written in standard English?

PLOS ONE does not copyedit accepted manuscripts, so the language in submitted articles must be clear, correct, and unambiguous. Any typographical or grammatical errors should be corrected at revision, so please note any specific errors here.

Reviewer #1: Yes

Reviewer #2: Yes

Reviewer #3: Yes

**********

6. Review Comments to the Author

Please use the space provided to explain your answers to the questions above. You may also include additional comments for the author, including concerns about dual publication, research ethics, or publication ethics. (Please upload your review as an attachment if it exceeds 20,000 characters)

Reviewer #1: I appreciate the changes authors have made in the revised MS. Thank you for clarifying my queries and restructuring the manuscript. If possible, the authors must give a statement indicating their plans on how long is the tool expected to be supported and maintained given the funding they have. This is important because many tools after publication are forgotten by developers. I hope that this tool will be maintained and updated for at least 5-10 years.

Reviewer #2: This revision has addressed most of my concerns. I can use the online manta website and the offline software. I suggest improving the documentation by at least provide:

1) How to generate the microbiota file (what software, what file format is accepted)?

2) What file format is expected for user’s phenotype file?

3) Explain “Parameter type”. What does “others” mean? How does MANTA treat “others” compared to other types? The example phenotypic file has 290 variables, and I suggest automatically inferring the parameter types in MANTA.

Reviewer #3: Upon this revision I now understand that the website described in the first version of the MANTA manuscript was totally fake--or I should say that it is a useless website only for demonstration purpose. The most critical point, as I identified, is that the installation procedure of the webpage components (jdk, tomcat, postgresql, data preprocessing, gwt compilation, to name just a few) can be much more challenging to users compared to ordinary pipelines. Due to this I do not know why users need to spend efforts to set up their own website--using command line pipelines can be easier than that. Thus, again, I doubt the very existence meaning of MANTA.

I have said it in my first review but allow me to say it again: please think and discuss with non-computational guys (or just let them try) in order to know their needs. Setting up a website can also be challenging even for people working on computational tasks. Please ponder the needs of non-computational people and design the system/pipeline accordingly.

**********

7. PLOS authors have the option to publish the peer review history of their article (what does this mean?). If published, this will include your full peer review and any attached files.

If you choose “no”, your identity will remain anonymous but your review may still be made public.

Do you want your identity to be public for this peer review? For information about this choice, including consent withdrawal, please see our Privacy Policy.

Reviewer #1: No

Reviewer #2: No

Reviewer #3: No

[NOTE: If reviewer comments were submitted as an attachment file, they will be attached to this email and accessible via the submission site. Please log into your account, locate the manuscript record, and check for the action link "View Attachments". If this link does not appear, there are no attachment files.]

While revising your submission, please upload your figure files to the Preflight Analysis and Conversion Engine (PACE) digital diagnostic tool, https://pacev2.apexcovantage.com/. PACE helps ensure that figures meet PLOS requirements. To use PACE, you must first register as a user. Registration is free. Then, login and navigate to the UPLOAD tab, where you will find detailed instructions on how to use the tool. If you encounter any issues or have any questions when using PACE, please email PLOS at figures@plos.org. Please note that Supporting Information files do not need this step.

PLoS One. 2020 Dec 4;15(12):e0243609. doi: 10.1371/journal.pone.0243609.r004

Author response to Decision Letter 1


26 Oct 2020

Response to Reviewers

Details:

Reviewer #1: I appreciate the changes authors have made in the revised MS. Thank you for clarifying my queries and restructuring the manuscript. If possible, the authors must give a statement indicating their plans on how long is the tool expected to be supported and maintained given the funding they have. This is important because many tools after publication are forgotten by developers. I hope that this tool will be maintained and updated for at least 5-10 years.

Our current funding supports tool development and related activities for the next five years. We hope that we can continuously improve and maintain the MANTA project for at least 5-10 years.

Reviewer #2: This revision has addressed most of my concerns. I can use the online manta website and the offline software. I suggest improving the documentation by at least provide:

1) How to generate the microbiota file (what software, what file format is accepted)?

2) What file format is expected for user’s phenotype file?

3) Explain “Parameter type”. What does “others” mean? How does MANTA treat “others” compared to other types? The example phenotypic file has 290 variables, and I suggest automatically inferring the parameter types in MANTA.

Thank you for the suggestions. We have improved the online documentation to address those issues. The following explanation has been added:

1) The currently accepted microbiota file format is a tab-delimited table format (see the sample data as an example), which can be easily converted from the BIOM (The Biological Observation Matrix) format file (https://biom-format.org/). The BIOM format is adopted by several popular projects including QIIME and MG-RAST. Kraken/Bracken produces results in a different format and we are working on enabling the system to import this type of data.

2) At the moment, the accepted format is a tab delimited table format that contains different parameters in each column and different samples in each row.

3) The “others” type was designed for the data types that do not belong to any of the rest. At the moment, this type of data is treated in the same way as the type ‘free text’, and not used for any correlation calculation.

Regarding the auto assignment of the data types, we will add this feature in a future release.

Reviewer #3: Upon this revision I now understand that the website described in the first version of the MANTA manuscript was totally fake--or I should say that it is a useless website only for demonstration purpose. The most critical point, as I identified, is that the installation procedure of the webpage components (jdk, tomcat, postgresql, data preprocessing, gwt compilation, to name just a few) can be much more challenging to users compared to ordinary pipelines. Due to this I do not know why users need to spend efforts to set up their own website--using command line pipelines can be easier than that. Thus, again, I doubt the very existence meaning of MANTA.

I have said it in my first review but allow me to say it again: please think and discuss with non-computational guys (or just let them try) in order to know their needs. Setting up a website can also be challenging even for people working on computational tasks. Please ponder the needs of non-computational people and design the system/pipeline accordingly.

Our demonstration database includes real-life (albeit small sample size) data. We believe that such a website, in line with many other open source projects, will be useful for showing key features of the software tool. We appreciate the hurdles for the non-computational users. In the revised version of the manuscript, we already discussed the importance of addressing the needs of non-technical users (in the paragraph starting from line 371), and this is exactly why we developed and released a standalone version named MANTA basic; the user can simply download a single all-in-one package and launch the application with a double click. To clarify these points, we have updated the documentation on our website.

Attachment

Submitted filename: manta-response-to-reviewers-2.docx

Decision Letter 2

Lingling An

25 Nov 2020

MANTA, an integrative database and analysis platform that relates microbiome and phenotypic data

PONE-D-20-09945R2

Dear Dr. Chen,

We’re pleased to inform you that your manuscript has been judged scientifically suitable for publication and will be formally accepted for publication once it meets all outstanding technical requirements.

Within one week, you’ll receive an e-mail detailing the required amendments. When these have been addressed, you’ll receive a formal acceptance letter and your manuscript will be scheduled for publication.

An invoice for payment will follow shortly after the formal acceptance. To ensure an efficient process, please log into Editorial Manager at http://www.editorialmanager.com/pone/, click the 'Update My Information' link at the top of the page, and double check that your user information is up-to-date. If you have any billing related questions, please contact our Author Billing department directly at authorbilling@plos.org.

If your institution or institutions have a press office, please notify them about your upcoming paper to help maximize its impact. If they’ll be preparing press materials, please inform our press team as soon as possible -- no later than 48 hours after receiving the formal acceptance. Your manuscript will remain under strict press embargo until 2 pm Eastern Time on the date of publication. For more information, please contact onepress@plos.org.

Kind regards,

Lingling An

Academic Editor

PLOS ONE

Additional Editor Comments (optional):

Reviewers' comments:

Reviewer's Responses to Questions

Comments to the Author

1. If the authors have adequately addressed your comments raised in a previous round of review and you feel that this manuscript is now acceptable for publication, you may indicate that here to bypass the “Comments to the Author” section, enter your conflict of interest statement in the “Confidential to Editor” section, and submit your "Accept" recommendation.

Reviewer #2: All comments have been addressed

**********

2. Is the manuscript technically sound, and do the data support the conclusions?

The manuscript must describe a technically sound piece of scientific research with data that supports the conclusions. Experiments must have been conducted rigorously, with appropriate controls, replication, and sample sizes. The conclusions must be drawn appropriately based on the data presented.

Reviewer #2: Yes

**********

3. Has the statistical analysis been performed appropriately and rigorously?

Reviewer #2: N/A

**********

4. Have the authors made all data underlying the findings in their manuscript fully available?

The PLOS Data policy requires authors to make all data underlying the findings described in their manuscript fully available without restriction, with rare exception (please refer to the Data Availability Statement in the manuscript PDF file). The data should be provided as part of the manuscript or its supporting information, or deposited to a public repository. For example, in addition to summary statistics, the data points behind means, medians and variance measures should be available. If there are restrictions on publicly sharing data—e.g. participant privacy or use of data from a third party—those must be specified.

Reviewer #2: Yes

**********

5. Is the manuscript presented in an intelligible fashion and written in standard English?

PLOS ONE does not copyedit accepted manuscripts, so the language in submitted articles must be clear, correct, and unambiguous. Any typographical or grammatical errors should be corrected at revision, so please note any specific errors here.

Reviewer #2: Yes

**********

6. Review Comments to the Author

Please use the space provided to explain your answers to the questions above. You may also include additional comments for the author, including concerns about dual publication, research ethics, or publication ethics. (Please upload your review as an attachment if it exceeds 20,000 characters)

Reviewer #2: This revision has addressed all my concerns. In the future, I hope that the authors can continue maintaining the website and add more microbiome projects in the MANTA database.

**********

7. PLOS authors have the option to publish the peer review history of their article (what does this mean?). If published, this will include your full peer review and any attached files.

If you choose “no”, your identity will remain anonymous but your review may still be made public.

Do you want your identity to be public for this peer review? For information about this choice, including consent withdrawal, please see our Privacy Policy.

Reviewer #2: No

Acceptance letter

Lingling An

27 Nov 2020

PONE-D-20-09945R2

MANTA, an integrative database and analysis platform that relates microbiome and phenotypic data

Dear Dr. Chen:

I'm pleased to inform you that your manuscript has been deemed suitable for publication in PLOS ONE. Congratulations! Your manuscript is now with our production department.

If your institution or institutions have a press office, please let them know about your upcoming paper now to help maximize its impact. If they'll be preparing press materials, please inform our press team within the next 48 hours. Your manuscript will remain under strict press embargo until 2 pm Eastern Time on the date of publication. For more information please contact onepress@plos.org.

If we can help with anything else, please email us at plosone@plos.org.

Thank you for submitting your work to PLOS ONE and supporting open access.

Kind regards,

PLOS ONE Editorial Office Staff

on behalf of

Dr. Lingling An

Academic Editor

PLOS ONE

Associated Data

    This section collects any data citations, data availability statements, or supplementary materials included in this article.

    Supplementary Materials

    S1 Appendix. An illustration for importing data into MANTA basic.

    (DOCX)

    Attachment

    Submitted filename: manta-response-to-reviewers.docx

    Attachment

    Submitted filename: manta-response-to-reviewers-2.docx

    Data Availability Statement

    All relevant data are within the paper and its Supporting Information files.


    Articles from PLoS ONE are provided here courtesy of PLOS

    RESOURCES