

Abstract
Objective:
To develop and pilot-test Wellness Champions for Change (WCC) to enhance local wellness policy (LWP) implementation by forming wellness teams.
Design:
Randomized, controlled school-level pilot study.
Setting:
Five Maryland school districts.
Participants:
A total of 63 elementary, middle, or high schools.
Intervention(s):
Developed from stakeholder interviews, focus groups, and existing programs. Schools were randomized within district to (1) WCC training (6-hour, single-day teacher training), (2) WCC training plus technical assistance (TA), or (3) delayed training (control).
Main Outcome Measure(s):
Online teacher/administrator survey pre-post (spring, 1 year apart) that examined the direct effect of the intervention on active wellness team formation (postintervention, 8-item sum score) and LWP implementation (29 items, not implemented to fully implemented)/indirect effect of intervention on LWP implementation via active wellness team formation.
Analysis:
Adjusted linear or logistic regression and mediation modeling.
Results:
Postintervention, WCC plus TA and WCC had more active wellness teams (vs control, β= 1.49, P = .02 and β = 1.42, P = .03, respectively). No direct effect of intervention on LWP implementation was found. Formation of active wellness teams mediated the association between both WCC plus TA and WCC and LWP implementation (WCC plus TA confidence interval [CI], 1.22–16.25; WCC CI, 10.98–15.61 [CI was significant without 0]).
Conclusions and Implications:
The WCC intervention approaches indirectly affected LWP implementation through the formation of active wellness teams. These results support building and school-level wellness teams.
Keywords: pediatric obesity, policy, school, wellness programs
INTRODUCTION
Childhood obesity is a significant public health problem in the US; approximately 17.5% of children (aged 6–11 years) and 20.5% of adolescents (aged 12–19) were classified as obese from 2011 to 2014.1 Children who are overweight or obese are likely to develop into obese adults and have major health complications such as type 2 diabetes, hypertension, sleep apnea, stroke, cardiovascular diseases, and cancer.2–4
Children and adolescents consume about a third of total daily calories at school and spend more time in school than any other place besides home; thus, schools are logical targets for pediatric obesity prevention.5 Furthermore, obesity-related behaviors, including diet/physical activity (PA), are highly influenced by peers, teachers, and the social and physical environment at school.5,6 Thus, school-wide obesity prevention strategies are needed to address these influences.
Federal legislation addressed childhood obesity through a focus on schools. In 2004, the Child Nutrition Reauthorization Act mandated all school districts participating in the US Department of Agriculture (USDA) National School Lunch and/or Breakfast Program to create a local wellness policy (LWP), a written document intended to guide school efforts to establish nutrition/PA standards.7 The 2010 Healthy Hunger-Free Kids Act (HHFKA) added provisions to emphasize implementation, evaluation, and reporting of LWPs in schools.8 In 2016, the HHFKA LWP implementation final rule required the establishment of wellness policy leadership (district or school level), public participation, and public reporting of school-level LWP implementation.9 Although researchers extensively examined the existence and strength of district-level LWPs,10–13 factors associated with school-level LWP implementation (ie, accountability, resources, support) are under-studied. The few studies that assessed these factors report mixed findings partly owing to a lack of consideration of school-specific culture, barriers, and resource needs.14,15
Recent evidence suggested that forming and providing tailored training to stakeholder teams (ie, wellness teams) can address these considerations, thus enhancing implementation of LWPs and accelerating changes to the school environment that promote obesity prevention.16–18 In addition, a recent study demonstrated that among schools with wellness teams, those with active wellness teams that met best practices (met ≥4 times/y; set goals for healthy eating and PA; had representation from key school staff, parents, and students; and had mechanisms to inform the public) were more likely to implement wellness policies and practices.19 There is a need to investigate this relationship further as well as to understand strategies better, such as tailored training, that can support the formation of active, sustainable wellness teams in schools.
The purpose of this study was to develop and pilot-test an intervention to enhance LWP implementation in schools. The intervention, Wellness Champions for Change (WCC), was a randomized, controlled pilot study aiming to promote LWP implementation by training teachers to become wellness champions and lead school-based wellness teams. The WCC training was based in Social Cognitive Theory (specifically, observational learning, self-efficacy, and reciprocal determinism)20 and Social Ecological Theory (focusing on social networks and organizational factors).21 The added impact of providing technical assistance (TA) to wellness teams in the form of support for setting and meeting goals throughout the school year was also examined. This article describes the intervention development process and examines the impact of the intervention on planned school-level outcomes: (1) wellness team formation, specifically the formation of active wellness teams (meeting wellness team best practices19), and (2) LWP implementation (endorsing implementation of wellness policy best practices16). The mediating role of forming active wellness teams (school survey: 8-item active wellness team sum score) in the relation between the interventions and greater LWP implementation (school survey: 29-item LWP implementation scale) is also examined.
METHODS
Institutional Review Board
The study team represented a partnership among 2 state universities, the state department of education, state and local health departments, and participating school districts. Methods consisted of formative research that informed the intervention development and pilot study procedures. The institutional review boards at University of Maryland School of Medicine and University of Maryland College Park approved these methods separately. Formative study participants provided informed consent for participation. Pilot study participants were asked about school policies and practices, did not report on personal opinions, and did not provide personal information beyond their roles in the school (ie, administrator, teacher). Therefore, the pilot study was deemed exempt by the institutional review board and written informed consent was not required.
Formative Research and Intervention Development
The researchers conducted formative research to inform the WCC training curriculum. The formative research plan included qualitative method triangulation in which individual in-depth interviews with school wellness stakeholders (n = 6) and a teacher/administrator focus group (n = 8 participants) were combined to generate complementary views of a phenomenon.22 A standardized protocol and detailed scripts were developed. Using the protocol, the focus group meeting and in-depth interviews were conducted by 3 trained extension field educators with substantial interview experience.
Because the WCC training was to be developed based on Social Cognitive Theory20 and Social Ecological Theory,21 interview guides were developed with probes to collect key constructs of these theories. For example, organizational factors were explored by asking, What have you found to be key factors influencing successful wellness policy implementation in schools? Were there any specific partnerships? Moreover, to apply the concept of observational learning to the WCC curriculum, proxy questions were probed, such as What makes some school wellness champions more effective than others in leading a wellness team? All interviews were audio-recorded with participants’ permission and transcribed verbatim. Using inductive content analysis,23 an open-coding, grouping, categorization, and abstraction procedure was followed.
Formative research findings indicated the importance of (1) forming a wellness team; (2) having buy-in and support from key stakeholders including teachers, principals, parents, and district administrators; (3) offering resources (eg, a list of healthy snacks or sample letters sent to parents); (4) building partnerships (eg, partnering with parent-teacher and community groups to provide additional resources, creating school-level clubs for students, such as a running club); (5) overcoming possible barriers (eg, finding co-champions, using peer sharing, ensuring district support); (6) setting clear, attainable, and simple goals with an evaluation and monitoring plan; and (7) providing an avenue to share information among schools and wellness teams.
From these findings and an extensive literature review, a single-day training was developed for wellness team leaders based in both Social Cognitive Theory and Social Ecological Theory. Specifically, for Social Cognitive Theory, reciprocal determinism was a major thread throughout the training, homing in on the relation between building teachers’ skills, knowledge, and self-efficacy regarding school wellness, their behaviors in leading a school wellness team, and the broader school environment, including an emphasis on interactions within and among the whole school community including students, parents, teachers, cafeteria staff, and community.20 Additional Social Cognitive Theory constructs were observational learning and self-efficacy, in that training was interactive and focused on skills.20 Social Ecological Theory was used through a focus on social networks and organizational factors.21 This training was tested in 1 school district several months before the start of the pilot intervention. School district partners invited potential participants via e-mail, including 37 school teachers and staff, 5 administrators, and school district leadership. Timing and flow were documented by study staff, teacher participants completed detailed evaluations, and district leaders provided informal verbal feedback. The researchers made structure and content changes from this feedback. Specifically, training content specific to building an effective team, personality styles, and leadership skills was reduced and more training time was allocated to conduct a needs assessment and action planning. Figure 1 describes the final curriculum.
Figure 1.
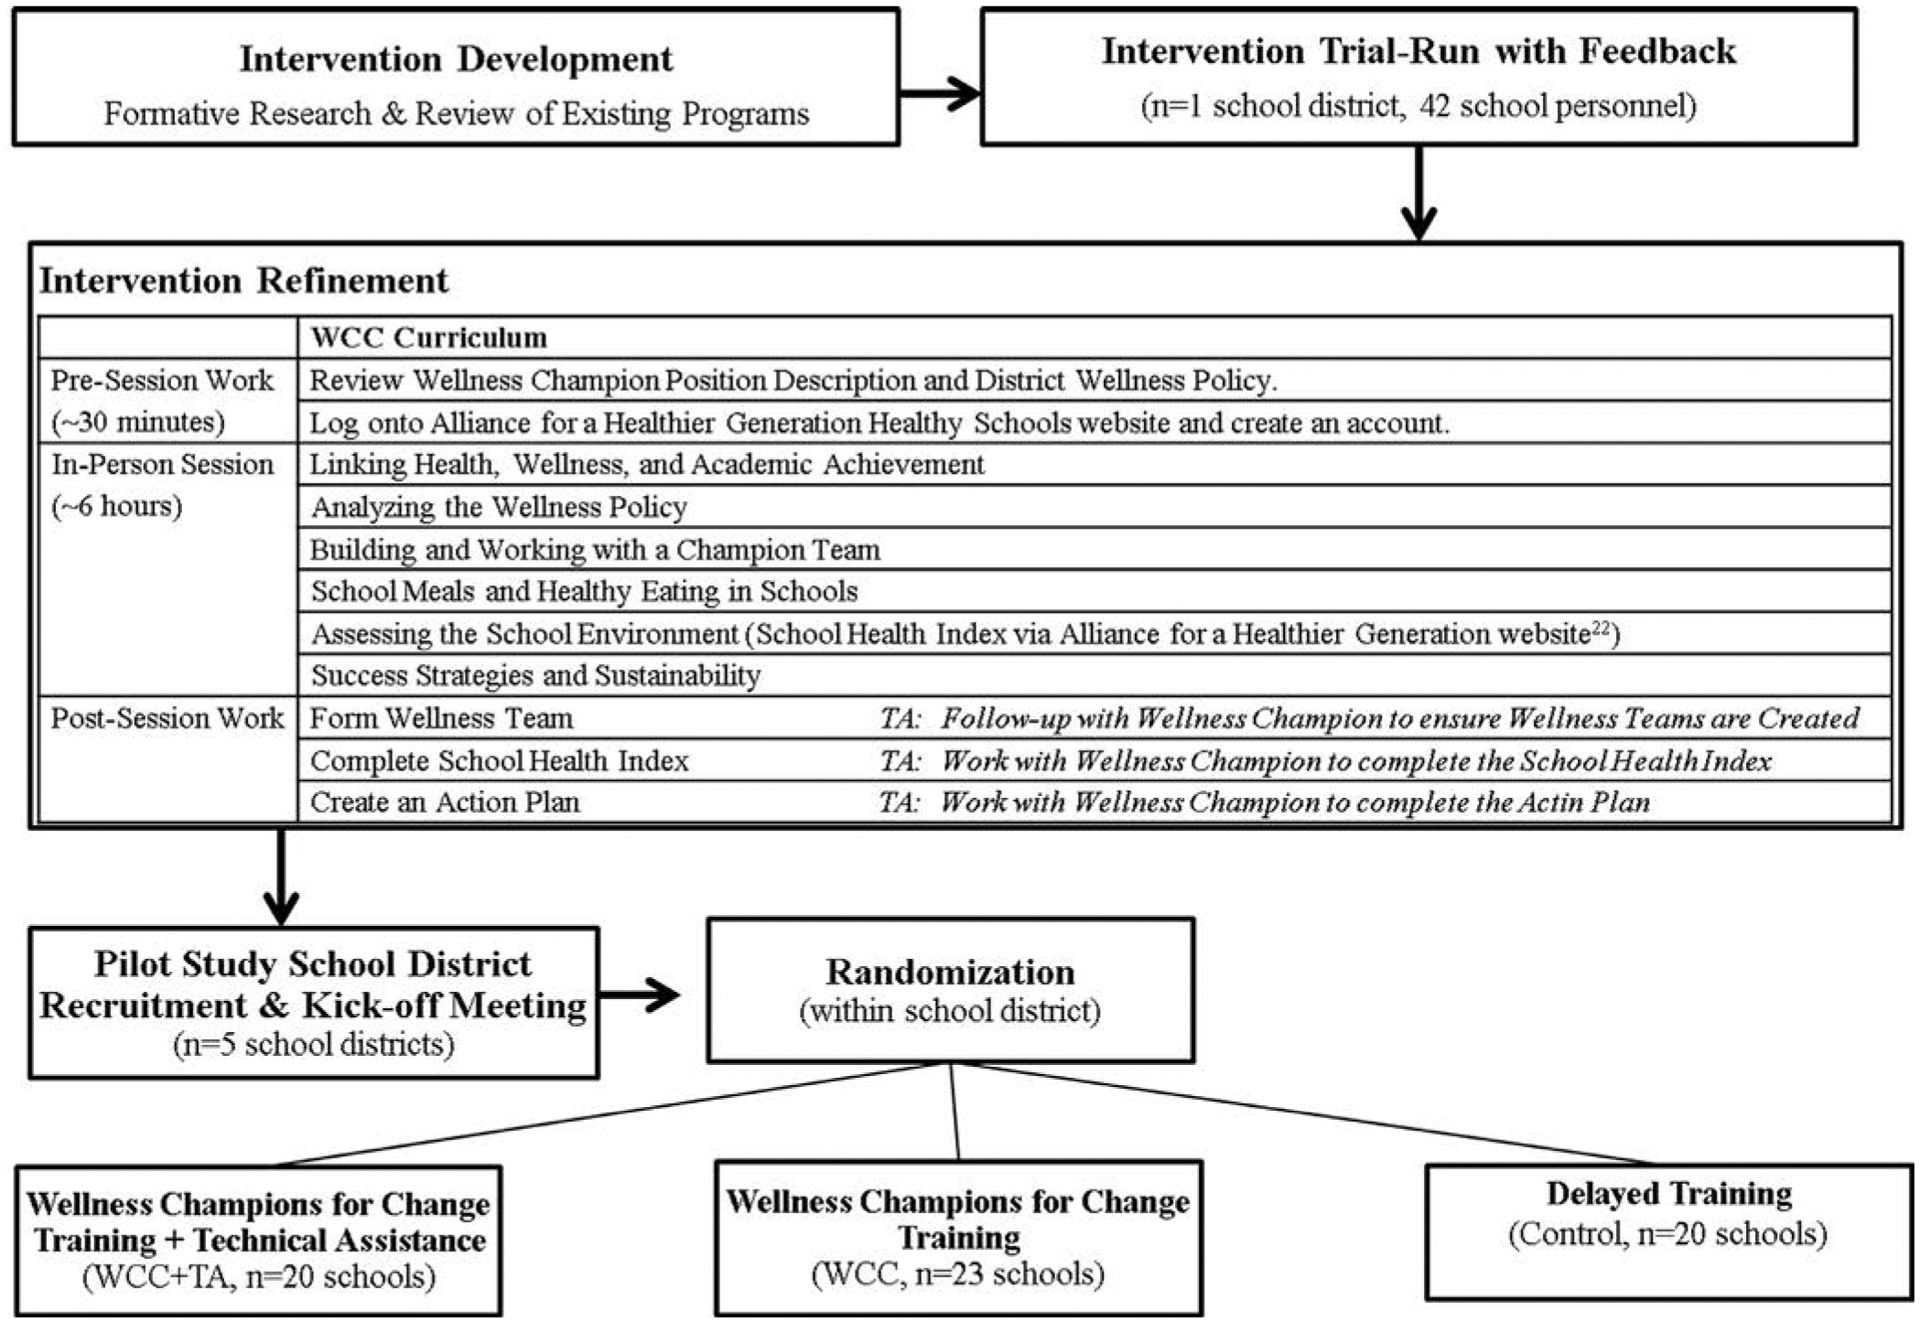
Pilot study design and curriculum overview. TA indicates technical assistance; WCC, Wellness Champions for Change.
The study team also developed a TA plan; it included facilitating completion of the nutrition/PA components of the School Health Index assessment24 (an evaluation of the health-promoting environment in schools), creating an action plan (a template developed for this study), and providing assistance and/or guidance for wellness goals. The TA plan specified that a wellness specialist (1/district, either an extension agent or a local health department employee assigned to this role based on prior experience or concurrent responsibilities) would serve as a consultant for the wellness champion and not lead or colead the wellness team. Contact logs were developed for the wellness specialists to complete after in-person meetings, e-mails, and phone calls with school-level wellness teams.
Pilot Study Design
This pilot study was conducted in school districts in a single mid-Atlantic state (of 6 districts approached, 5 agreed to participate; 83.3%). School districts were approached based on results from a 2012–2013 state-wide survey,16 2 years before the pilot study, indicating that the districts had a low proportion of schools (<40%) with wellness teams. After district recruitment, a kickoff meeting was held with leaders from each participating district to describe the study design and answer questions. After the meeting, district leaders nominated elementary, middle, and high schools within their district to participate, based on 3 guidelines: (1) a specified number of schools (range, 6–15 schools/district, depending on the district size [the number of schools per district ranged from >100 schools to <10 schools]), (2) preference was given to schools with higher free and reduced-price meal (FARMS) eligibility rates (>40%) (per funder request, not a mandatory inclusion criterion), and (3) only standard schools (no part-day high schools, exclusive pre-kindergarten schools, or alternative schools, for example). A minimum of 60 schools were needed based on an a priori sample size calculation for the primary outcome (LWP implementation) with the assumptions of a pre-post assessment correlation of 0.7. This sample size allowed enough power (>0.8) to detect a medium to large intervention effect (Cohen’s d = 0.6) (eg, an LWP implementation score difference of 2.62 between intervention and control schools). This sample size did not account for clustering within district, as randomization of schools would occur within school district. Principals of nominated schools were e-mailed by the study team and asked to participate. All 63 schools approached within the 5 recruited districts agreed to participate and nominate an individual to be a wellness champion if randomized to the intervention.
Baseline evaluations took place during the spring semester before the start of the intervention year. The evaluation consisted of an online survey assessing school-level implementation of wellness policies and practices, as well as wellness team composition and activities (described subsequently under Measures). Surveys were sent via e-mail to a school administrator or the head of an ongoing wellness team, relying on a single respondent per school.
After the baseline evaluation, schools were randomized within the school district to 1 of 3 intervention arms (Figure 1): WCC training plus TA, WCC training, or delayed control (received training the following summer). Schools were randomized within districts based on school type (elementary, middle, or high) (Table 1). All participating districts were offered financial resources (approximately $1,000/school), with guidance that the funds could be used to purchase items to support Smarter Lunchroom25 initiatives, purchase supplies that supported wellness activities, pay for substitute time for trainings, and/or pay a wellness champion stipend. Funds could be used for intervention and control schools. Schools in the WCC or WCC plus TA groups were notified that they had been selected for an intervention group and would need to send a wellness champion to a district-specific training. Two districts requested to communicate training information directly to the school administrators. Others were notified by the research team.
Table 1.
Description of Schools by Intervention Group (n = 63)
| School Characteristics | Total (n = 63) | WCC Training Plus Technical Assistance (n = 20) | WCC Training (n = 23) | Control (n = 20) | Between-Group χ2 (P) |
|---|---|---|---|---|---|
| School type | |||||
| Elementary | 31 (42.9) | 10 (50.0) | 12 (52.2) | 9 (45.0) | 0.28 (.99) |
| Middle | 17 (27.0) | 5 (10.0) | 6 (26.1) | 6 (30.0) | |
| High | 15 (23.8) | 5 (10.0) | 5 (21.7) | 5 (25.0) | |
| Eligible for Free and Reduced-Price Meals (%) | |||||
| >40 | 50 (79.4) | 16 (80.0) | 17 (73.9) | 17 (85.0) | 0.81 (.67) |
| ≤40 | 13 (20.6) | 4 (20.0) | 6 (26.1) | 3 (15.0) | |
| Majority African American or Hispanic student body (%) | |||||
| ≥75 | 5 (7.9) | 2 (10.0) | 1 (4.3) | 2 (10.0) | 0.64 (.73) |
| <75 | 58 (92.1) | 18 (90.0) | 22 (95.7) | 18 (90.0) | |
| Majority Caucasian student body (%) | |||||
| ≥75 | 13 (20.6) | 5 (25.0) | 4 (17.4) | 4 (20.0) | 0.39 (.83) |
| <75 | 50 (79.4) | 15 (75.0) | 19 (82.6) | 16 (80.0) | |
| Geographic location of schools | |||||
| Rural/town | 24 (38.1) | 7 (35.0) | 11 (47.8) | 6 (30.0) | 2.04 (.73) |
| Suburban | 21 (33.3) | 6 (30.0) | 7 (30.4) | 8 (40.0) | |
| Urban | 18 (28.6) | 7 (35.0) | 5 (21.7) | 6 (30.0) | |
WCC indicates Wellness Champions for Change.
Note: Chi-square test for homogeneity was performed.
The WCC training took place in August to September, before or at the beginning of the school year. In addition to providing TA, the wellness specialists led the WCC trainings. Wellness specialists attended a full-day training on how to lead the WCC training session (including a tool kit with detailed training notes and background readings), how to complete the School Health Index via the Alliance for a Healthier Generation website,24 and TA provision. After the WCC training, schools that were randomized to the WCC plus TA group were notified that they would be receiving TA throughout the year (this was not known to the schools during the training). School districts were unaware of which schools were randomized to WCC vs WCC plus TA; however, they knew which schools were in the control group.
A follow-up survey (1 year after baseline) was administered the following spring or summer via e-mail to the school contacts from baseline. The survey was again completed by a school administrator or the head of an ongoing wellness team, relying on a single respondent per school. The same respondent did not necessarily complete the survey at both times, because identifiable information about survey participants was not gathered and data collection was specific to the school-level practices.
Measures
An online survey, Maryland Wellness Policies and Practices Project School Survey II,26 assessed the primary outcome variables: the formation of a wellness team, whether wellness teams were active, and whether implementation of LWP components occurred. The presence of a wellness team was determined by a single item, My school had a school-level wellness team responsible for implementing local wellness policies in place during the [2014–2015 (baseline) or 2015–2016 (follow-up)] school year. Possible responses were yes, no, or don’t know. Schools responding yes were considered to have a wellness team.
Schools with wellness teams at follow-up were asked additional questions to determine whether teams were meeting 6 wellness team best practices (components of an active wellness team).19 Because the intervention also focused on monitoring and reporting, 2 items were added to this score: conducting a needs assessment and creating an action plan. From these dichotomous variables, an 8-item active wellness team sum score was generated.
The researchers measured LWP Implementation using a scale adapted from the original Maryland Wellness Policies and Practices Project School Survey.16,27 The original scale (17 items) demonstrated test-retest reliability (Spearman correlation = .70; P < .001; item-by-item percent agreement = 75.6%) and high internal consistency (α = .923).16 Items in version II (29 items) were added based on the updated School Health Index28 and language in the LWP proposed rule stemming from the HHFKA.29 The version II LWP implementation scale also demonstrated high internal consistency (α = .933). The response set, used to create a sum score, included: fully implemented (3 points), partially implemented (2 points), under development (1 point), not implemented (0 points), and don’t know (0 points).
School-level demographic information, including school type, size, race/ethnicity of student body, and percentage of students eligible for FARMS, was provided by the state department of education. Information on the geographic locale of each school (rural/town, suburban, or urban) was obtained via the National Center for Educational Statistics.30
Data Analysis
All analyses were conducted using SPSS (version 22, IBM Corp, Armonk, NY, 2013). Significance was set at P < .05. The researchers examined the distribution of continuous variables using the Skewness command. Differences in baseline school demographics by intervention group were examined using ANOVA (with LSD post hoc testing) or chi-square test for homogeneity. All regression models were adjusted for wellness team in place at baseline and matched respondent role (ie, administrator responded at both time points = matched; administrator at baseline and a teacher at follow-up = not matched). Clustering of schools within school district was not accounted for in the models because randomization occurred within districts.31
To examine the impact of the intervention on the formation of wellness teams, the researchers conducted unadjusted bivariate analyses within (McNemar tests) and between (chi-square) groups. A logistic regression model was conducted predicting wellness team formation at 1-year follow-up.
To examine the impact of the intervention on active wellness team formation, a restricted analysis was conducted only among schools with a wellness team at the 1-year follow-up (having an active wellness team depended on having a wellness team). Differences in each of the 8 components in the active wellness team sum score were examined independently between groups using a chi-square test for homogeneity. Unadjusted differences in active wellness team sum scores between groups were analyzed using ANOVA with LSD post hoc testing (the sum score was normally distributed; skewness = 0.310). A linear regression model was conducted that predicted active wellness teams at follow-up.
Change in LWP implementation pre-post was examined using an ANOVA model (with LSD post hoc testing) followed by adjusted linear regression predicting LWP implementation at follow-up (the postintervention LWP implementation sum score was normally distributed; skewness = 0.214), adjusting for the baseline LWP implementation score.
The researchers conducted a mediation model using the SPSS macro PROCESS32 to examine the indirect effect of the intervention on LWP implementation at follow-up via the active wellness team sum score, adjusting for the baseline LWP implementation score. Models were conducted using bootstrapping, which draws repeated samples from the data (with replacement) to gain multiple estimates of the indirect effect.32 This method generated 5,000 bootstrapped samples. Statistical significance is based on the finding that the 95% confidence interval (CI) did not contain 0.
RESULTS
Sample
A total of 63 schools within 5 school districts were recruited to participate. Randomization yielded 21 schools/arm. The 2 districts that communicated independently with schools inadvertently instructed 3 control schools to attend the training; at the same time, they did not send 2 schools that were randomized to WCC plus TA to attend the training. This led the researchers to switch assigned arms for 5 schools: specifically, 2 schools randomized to WCC plus TA were moved to control and 3 schools randomized to the control were moved to an intervention group (1 to WCC plus TA and 2 to WCC). This was not identified by the evaluation team until after the WCC training. All analyses were conducted using both the planned (intent-to-treat) and real randomization, and final regression findings did not differ; therefore, all data presented are for real group assignments.
Schools are described in Table 1 and included 28 elementary and 3 elementary/middle (grouped together under elementary), 14 middle and 3 middle/high (grouped together under middle), and 15 high schools. Most schools (79.4%) had a FARMS rate >40%. Few schools were attended by predominantly (≥75%) African American or Hispanic (7.9%) or Caucasian (20.6%) students, which suggested that most had a diverse student body. Schools were located in a range of geographic locations, with nearly a third each in rural/town, suburban, and urban areas. There were no significant differences in school demographics by intervention group (Table 1).
The majority of respondents at baseline were administrators (61.9%), followed by physical education teachers (15.9%), other teachers (12.7%), nurses (6.3%), and other school personnel (3.2%). At follow-up, primary respondents were physical education teachers (38.1%), followed by other teachers (30.2%), administrators (27.0%), other school staff (3.2%), and a nurse (1.6%). Respondent role did not differ by intervention group at baseline or follow-up. There was also no difference by intervention group regarding whether the survey was answered by an individual in the same role at both time points (matched respondent role = 28.6%).
Wellness Team Formation
At baseline, approximately one third of schools reported having wellness teams (Table 2). The prevalence was lowest in WCC plus TA schools (20%) compared with WCC (43.5%) and control (45.0%). This difference was not significant (P = .18). At follow-up, the prevalence of wellness teams increased significantly within all groups (McNemar P < .05). The WCC plus TA schools demonstrated the greatest relative increase (75.0%) compared with WCC (39.1%) and control (45.0%; 1 school lost its team); this difference was significant in a bivariate test (P = .05); however, in an adjusted logistic regression model, there was no significant difference in wellness team formation by intervention group (Table 2).
Table 2.
Change in the Presence of Wellness Teams and LWP Implementation by Intervention Group Pre-Post (n = 63)
| Variables | Total (n = 63) | WCC Training Plus Technical Assistance (n = 20) | WCC Training (n = 23) | Control (n = 20) | Between-Groupa χ2 (P) or F (P) |
|---|---|---|---|---|---|
| Presence of wellness team | |||||
| Baseline, n (%) | |||||
| Yes | 23 (36.5) | 4 (20.0) | 10 (43.5) | 9 (45.0) | 3.46 (0.178) |
| No | 40 (63.5) | 16 (80.0) | 13 (56.5) | 11 (55.0) | |
| Follow-up, n (%) | |||||
| Yes | 55 (87.3) | 19 (95.0) | 19 (82.6) | 17 (85.0) | 1.62 (0.444) |
| No | 8 (12.7) | 1 (5.0) | 4 (17.4) | 3 (15.0) | |
| Change: baseline to follow-up, n (%) | 33 (52.4) | 15 (75.0) | 9 (39.1) | 9 (45.0) | 6.16 (0.046) |
| Within-Group McNemar P | < .001 | < .001 | .004 | .021 | – |
| Adjusted logistic regression predicting wellness team at follow-upb (odds ratio [95% confidence interval]) | – | 7.45 (0.6–101.0) | 0.89 (0.2–5.1) | Reference | – |
| LWP implementation | |||||
| Baseline (mean ± SD) | 42.78 ± 20.2 | 40.40 ± 20.7 | 42.04 ± 20.9 | 46.00 ± 19.3 | 0.40 (0.671) |
| Follow-up (mean ± SD) | 51.38 ± 18.1 | 49.35 ± 19.3 | 54.96 ± 17.3 | 49.30 ± 18.1 | 0.70 (0.501) |
| Change: baseline to follow-up (mean ± SD) | 8.60 ± 22.8 | 8.95 ± 29.0 | 12.92 ± 20.7 | 3.30 ± 17.7 | 0.95 (0.393) |
| Adjusted linear regression predicting LWP implementation at follow-upc (β [P]) | – | 2.28 (0.687) | 6.77 (0.209) | Reference | – |
LWP indicates local wellness policy; WCC, Wellness Champions for Change.
Chi-square test for homogeneity or ANOVA;
Logistic regression, adjusting for wellness team in place at baseline and matched respondent (baseline and follow-up);
Linear regression, adjusting for wellness team in place at baseline, LWP implementation at baseline, and matched respondent (baseline and follow-up).
Active Wellness Teams
Table 3 shows the prevalence of endorsement of the 8 active wellness team criteria. The only factor that differed significantly by group at the 1-year follow-up was conducted a needs assessment; 89.5% of WCC plus TA schools, 47.4% of WCC schools, and 17.6% of control schools endorsed this (P < .001). Overall, the active wellness team sum score differed by intervention group such that both WCC plus TA and WCC had higher scores at follow-up compared with the control (LSD post hoc testing, P < .05). There was no difference between intervention groups, WCC and WCC plus TA. In an adjusted regression model, this association held: both WCC plus TA and WCC schools had higher active wellness team sum scores compared with the control (Table 3).
Table 3.
Presence of Active Wellness Teams Among Schools With Wellness Teams at Follow-up (n = 55; 87.3% of Sample) by Intervention Group
| Active Wellness Team Components and Sum Score | Total (%) (n = 55) | WCC Training Plus Technical Assistance (%) (n = 19) | WCC Training (%) (n = 19) | Control (%) (n = 17) | χ2 (P) or F (P)a Unadjusted |
|---|---|---|---|---|---|
| Set goals for healthy eating and physical activity | |||||
| Yes | 81.8 | 84.2 | 89.5 | 70.6 | 2.26 (.32) |
| No | 18.2 | 15.8 | 10.5 | 29.4 | |
| Met ≥4 times/y | |||||
| Yes | 50.9 | 42.1 | 63.2 | 47.1 | 1.83 (.40) |
| No | 49.1 | 57.9 | 36.8 | 52.9 | |
| Key school staff representationb | |||||
| Yes | 43.6 | 47.4 | 52.6 | 29.4 | 2.13 (.35) |
| No | 56.4 | 52.6 | 47.4 | 70.6 | |
| Parent representation | |||||
| Yes | 22.2 | 30.0 | 26.1 | 10.0 | 2.63 (.27) |
| No | 77.8 | 70.0 | 73.9 | 90.0 | |
| Student representation | |||||
| Yes | 11.1 | 10.0 | 17.4 | 5.0 | 1.70 (.43) |
| No | 88.9 | 90.0 | 82.6 | 95.0 | |
| Mechanism to inform publicc | |||||
| Yes | 76.4 | 73.7 | 78.9 | 76.5 | 0.15 (.93) |
| No | 23.6 | 26.3 | 21.1 | 23.5 | |
| Conducted needs assessment | |||||
| Yes | 52.7 | 89.5 | 47.4 | 17.6 | 18.9 (< .001) |
| No | 47.3 | 10.5 | 52.6 | 82.4 | |
| Created action plan | |||||
| Yes | 81.8 | 84.2 | 89.5 | 70.6 | 2.26 (.32) |
| No | 18.2 | 15.8 | 10.5 | 29.4 | |
| Active wellness team sum score (maximum = 8) | 4.3 + 2.0 | 4.6 + 2.0 | 4.7 + 2.0 | 3.3 + 1.6e | 3.2 (0.04) |
| Adjustedd linear regression predicting active wellness team score: β (P) | – | 1.46 (0.03) | 1.45 (0.03) | Reference | – |
WCC indicates Wellness Champions for Change.
Chi-square test for homogeneity or ANOVA;
≥3 of the following: administrator, physical education teacher, nurse, food service;
≥1 of the following: website, newsletter, parent-teacher association meetings, phone, e-mail, other school-wide announcement;
Control significantly different from WCC plus technical assistance (P = .04) and WCC (P = .03), least significant difference post hoc testing;
Linear regression adjusting for wellness team in place at baseline and matched respondent (baseline and follow-up).
Implementation of Wellness Policies and Practices
There was no direct effect of the interventions on LWP implementation pre-post in bivariate or adjusted models (Table 2). The average change in LWP implementation was positive for all groups with a greater raw magnitude of change among WCC plus TA (13 points) and WCC (9 points) vs control (3 points).
Mediating Role of Active Wellness Teams on LWP Implementation
Figure 2 presents specific mediation path estimates. Following the path, both WCC plus TA and WCC were significantly associated with higher active wellness team sum scores, and active wellness team sum scores were significantly associated with change in LWP implementation (as shown in a prior study19). Estimates of the indirect effect indicated that the active wellness team sum score mediated the association between WCC and WCC plus TA interventions and LWP implementation pre-post (WCC CI, 0.98–15.61 and WCC plus TA CI, 1.22–16.25); therefore, the interventions indirectly enhanced LWP implementation pre-post via the formation of active wellness teams.
Figure 2.
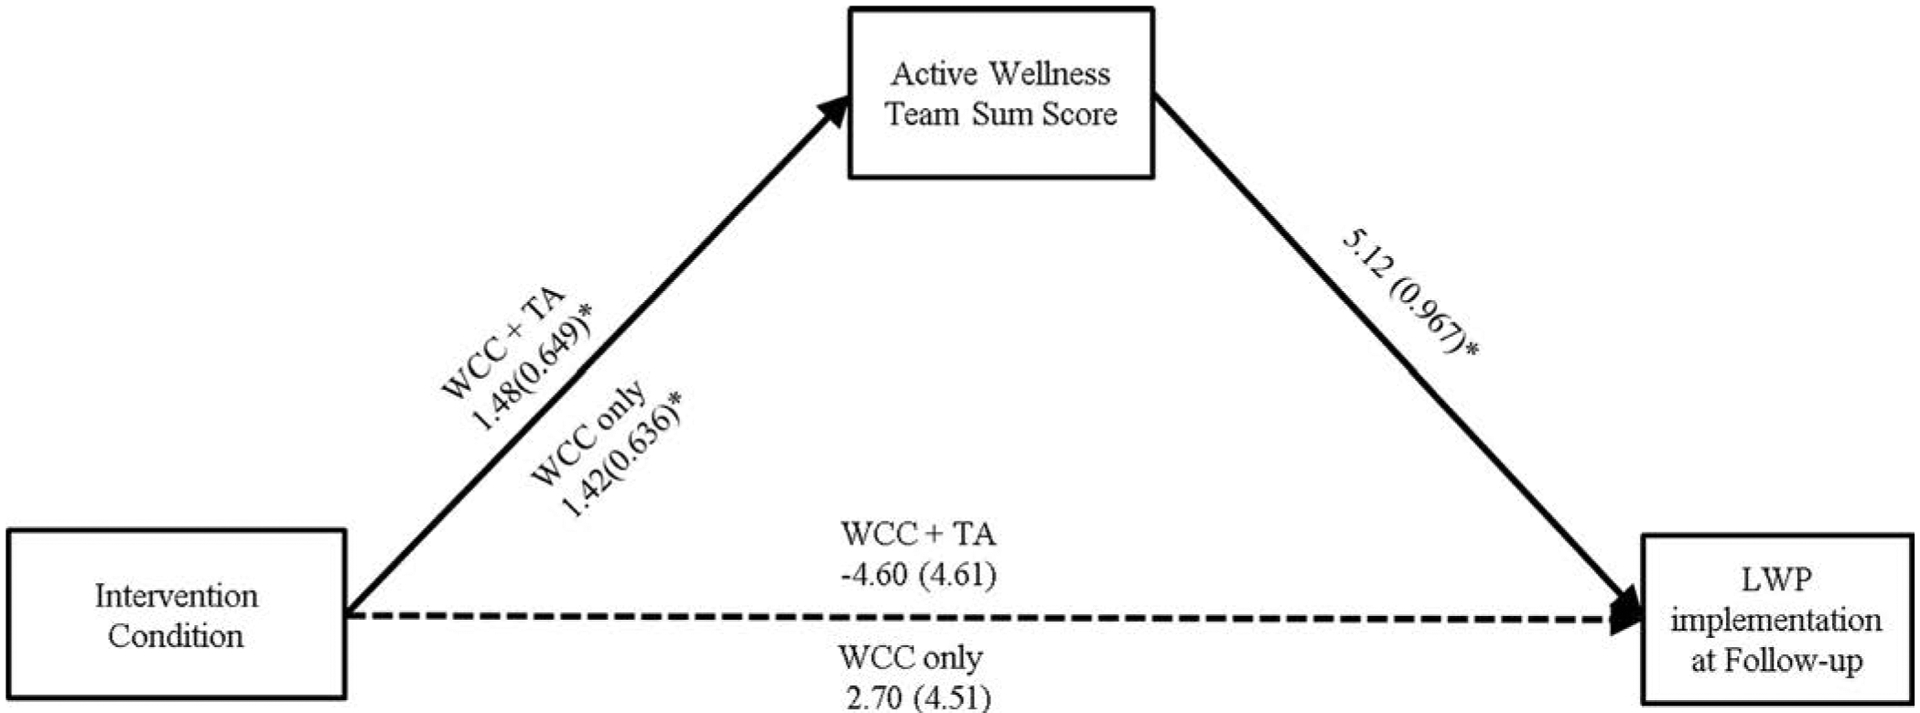
Active wellness teams mediate the relation between both the Wellness Champions for Change plus technical assistance and Wellness Champions for Change intervention and change in local wellness policy implementation. LWP indicates local wellness policy; TA, technical assistance; WCC, Wellness Champions for Change.
DISCUSSION
This article describes the development of WCC, an intervention to enhance LWP implementation in schools by training teachers to build and lead active wellness teams. The intervention was grounded in Social Cognitive Theory20 and Social Ecological Theory,21 developed by an interagency team through formative research, and rigorously pilot-tested in a randomized study. Findings suggested that WCC training, with and without TA, indirectly led to higher LWP implementation via the formation of active wellness teams.
The formation of wellness teams was recommended by government agencies (ie, the Centers for Disease Control and Prevention33 and the USDA34) and nonprofit school wellness promotion entities (ie, Alliance for a Healthier Generation35 and Action for Healthy Kids36) as a mechanism for enhancing LWP implementation and creating health-promoting environments. Research showed that when schools have wellness teams, they are more likely to implement LWPs16 and when those wellness teams are active and engage in best practices, they endorse greater LWP implementation.19 Much of the research into the role of wellness teams in LWP implementation has been cross-sectional. Few studies examined the impact of creating wellness teams on LWP implementation over time. This randomized pilot study demonstrated that training teachers to become wellness champions may lead to the formation of active wellness teams that, in turn, are more likely to implement LWPs. This provides clear support for the role of wellness teams in LWP implementation.
Schools in all randomization groups formed wellness teams over time. This may reflect a national emphasis on building wellness teams. A recent LWP final rule stemming from the 2010 Healthy Hunger-Free Kids Act requires school districts to establish LWP leadership at the school or district level and to assess how each school is implementing the wellness policy through a triennial assessment.9 These federal requirements may be fueling a national movement toward building wellness teams; however, wellness team formation is only the first step. Study findings suggested that providing training and support for wellness teams is a promising method for fully implementing LWPs.
Contrary to the a priori hypothesis, the provision of TA did not enhance intervention impact in this pilot study. Although a TA contact log was developed for the wellness specialists before the start of the intervention, the logs were not used consistently or uniformly, so it is difficult to fully understand the type and extent of TA provided. Wellness specialists were instructed to provide assistance in specific areas (assessment and action plan) but they were cautioned to avoid taking too large a role, to allow the wellness champion to be the true leader of the wellness team.
This cautionary advice may have led to technical assistance being more responsive rather than proactive. Prior research showed that TA recipients with fewer skills were less likely to make TA requests;37 therefore, proactive TA is recommended, in which TA providers are both responsive and anticipatory, to catalyze the process.38 The literature on proactive TA is growing38 and future studies should ensure a proactive TA approach in supporting wellness teams.
Local wellness policy mandates were established to address childhood obesity. This pilot study demonstrated the school-level impact of active wellness team formation via the WCC intervention; however, future studies might examine the impact of this strategy on students’ obesity-related behaviors as well as weight outcomes. In addition, this intervention required a single day and limited financial resources for execution, yet it led to active wellness team formation and LWP implementation; therefore, the cost-effectiveness of this approach might also be examined.39 Given the financial and resource constraints that exist in many school districts and state agencies, it is essential to identify effective approaches that are financially viable.
There were several notable strengths to this study, including the systematic approach to the development of the intervention. The use of a theoretical framework in developing and executing the intervention was a strength, specifically in that connections between individual teachers, their behaviors in building a wellness team, and the school environment were emphasized throughout.
Future analyses will incorporate qualitative interviews to understand specifically how using theory in this way may have facilitated or hindered the success. Moreover, the collaborative partnership and involvement of multiple stakeholders was a major strength, in addition to the high recruitment and retention rates. Finally, the findings were strengthened by the ability to execute a randomized, controlled trial within the limits of a pilot study. Controls are needed to understand the impact of a given strategy above and beyond the current climate supporting school wellness, as evidenced in this study by the positive changes seen in the control group pre-post.
Limitations of this study should also be considered. First, despite explicit discussion of the randomization process with participating school districts, several schools changed group assignment after randomization. To account for this, the researchers conducted analyses using both the intended (intent-to-treat) and real randomization groups, with no differences in findings. Second, the role of the school-level survey respondent often was not the same at baseline and follow-up (ie, first an administrator and then a teacher), and information beyond role was not collected. This was accounted for by adjusting for matched-respondent role in the analysis. Future studies should recruit and follow 1 respondent for all data collection. Third, this study relied on a single respondent survey, a limitation that is common in most LWP implementation studies.40,41 Future studies should incorporate additional methods, such as student perception surveys or audits. Finally, although this pilot study took place in 5 diverse school districts, all were within Maryland. This approach should be replicated in other states.
IMPLICATIONS FOR RESEARCH AND PRACTICE.
This pilot study found that a 1-day intervention involving teacher training was able to affect LWP implementation indirectly through the formation of active wellness teams. Findings provide additional support for the importance of wellness teams in LWP implementation and hold promise as a strategy for enhancing LWP implementation in schools. Wellness teams can also provide school districts with a structure for meeting the LWP reporting requirement outlined in the LWP final rule.9 Before widespread dissemination, replicability in other states and the impact on student behaviors, including both health and academic outcomes, should be examined.
Theory-based training programs that incorporate practical strategies such as needs assessments/action planning are recommended for local wellness policy implementation.
Training teachers to be wellness leaders in their schools may lead to better LWP implementation through forming active wellness teams.
Supporting the formation of wellness teams may be a promising strategy for enhancing school-based LWP implementation.
ACKNOWLEDGMENTS
Funding for this study was provided by a USDA Team Nutrition Training Grant, Centers for Disease Control and Prevention Cooperative Agreement No. 2B01OT009025 through the Maryland Department of Health, and the Summer Program in Obesity, Diabetes, and Nutrition Research Training Grant under National Institutes of Health Award No. T35DK095737. The authors would like to acknowledge the study participants in both the school districts and schools for their time and dedication. They also would like to acknowledge the study team/partners, including Liat Mackey, MS, Patsy Ezell, PhD, and Shauna Henley, PhD, from the University of Maryland Extension; and G. Stewart Eidel, MS, from the Maryland State Department of Education, for their leadership in developing the intervention. They would also like to acknowledge the evaluation team at the University of Maryland, Baltimore, including Erika Profilli, MPH, Doris Yimgang, MPH, and Rachel Deitch, MS, and especially Yan Wang, DrPH, and Bridget Armstrong, PhD of the University of Maryland School of Medicine, for statistical technical assistance.
Footnotes
Conflict of Interest Disclosure: The authors have not stated any conflicts of interest.
REFERENCES
- 1.Ogden CL, Carroll MD, Lawman HG, et al. Trends in obesity prevalence among children and adolescents in the United States, 1988–1994 through 2013–2014. JAMA. 2016;315:2292–2299. [DOI] [PMC free article] [PubMed] [Google Scholar]
- 2.Anari R, Amani R, Latifi SM, Veissi M, Shahbazian H. Association of obesity with hypertension and dyslipidemia in type 2 diabetes mellitus subjects. Diabetes Metab Syndr. 2017;11:37–41. [DOI] [PubMed] [Google Scholar]
- 3.Must A, Spadano J, Coakley EH, Field AE, Colditz G, Dietz WH. The disease burden associated with overweight and obesity. JAMA. 1999;282:1523–1529. [DOI] [PubMed] [Google Scholar]
- 4.Story M, Nanney MS, Schwartz MB. Schools and obesity prevention: creating school environments and policies to promote healthy eating and physical activity. Milbank Q. 2009;87: 71–100. [DOI] [PMC free article] [PubMed] [Google Scholar]
- 5.Waters E, de Silva-Sanigorski A, Hall BJ, et al. Interventions for preventing obesity in children. Cochrane Database Syst Rev. 2011;12:CD001871. [DOI] [PubMed] [Google Scholar]
- 6.Wechsler H, Devereaux RS, Davis M, Collins J. Using the school environment to promote physical activity and healthy eating. Preventive Medicine. 2000;31:S121–S137. [Google Scholar]
- 7.Child Nutrition and Women, Infants, and Children Reauthorization Act of 2004. Pub L No. 108–265, 118 Stat 729.
- 8.Healthy Hunger-Free Kids Act of 2010. Pub L No. 111–296, 124 Stat 3183.
- 9.US Department of Agriculture, Food and Nutrition Service. Final rule: local school wellness policy implementation under the HHFKA of 2010. http://www.fns.usda.gov/school-meals/fr-072916c. Accessed July 20, 2018.
- 10.Budd EL, Schwarz C, Yount BW, Haire-Joshu D. Factors influencing the implementation of school wellness policies in the United States, 2009. Prev Chronic Dis. 2012;9:E118. [DOI] [PMC free article] [PubMed] [Google Scholar]
- 11.Schwartz MB, Lund AE, Grow HM, et al. A comprehensive coding system to measure the quality of school wellness policies. J Am Diet Assoc. 2009;109:1256–1262. [DOI] [PubMed] [Google Scholar]
- 12.Gaines AB, Lonis-Shumate SR, Gropper SS. Evaluation of Alabama public school wellness policies and state school mandate implementation. J Sch Health. 2011;81:281–287. [DOI] [PubMed] [Google Scholar]
- 13.Metos J, Murtaugh M. Words or reality: are school district wellness policies implemented? A systematic review of the literature. Child Obes. 2011;7:90–100. [Google Scholar]
- 14.Coleman KJ, Shordon M, Caparosa SL, Pomichowski ME, Dzewaltowski DA. The healthy options for nutrition environments in schools (Healthy ONES) group randomized trial: using implementation models to change nutrition policy and environments in low income schools. Int J Behav Nutr Phys Act. 2012;9:80. [DOI] [PMC free article] [PubMed] [Google Scholar]
- 15.Piekarz E, Schermbeck R, Young S, Leider J, Ziemann M, Chriqui J. School District Wellness Policies: Evaluating Progress and Potential for Improving Children’s Health Eight Years after the Federal Mandate. School Years 2006–07 through 2013–14 Vol. 4 University of Illinois at Chicago: Chicago, IL; 2016. https://www.ihrp.uic.edu/files/District-Monograph-1Jul16-norw.pdf. Accessed July 20, 2018. [Google Scholar]
- 16.Hager ER, Rubio DS, Eidel GS, et al. Implementation of local wellness policies in schools: role of school systems, school health councils, and health disparities. J Sch Health. 2016;86:742–750. [DOI] [PubMed] [Google Scholar]
- 17.Beam M, Ehrlich G, Black JD, Block A, Leviton LC. Evaluation of the healthy schools program: part II. The role of technical assistance. Prev Chronic Dis. 2012;9:E64. [DOI] [PMC free article] [PubMed] [Google Scholar]
- 18.Kakietek J, Dunn L, O’Dell SA, Jernigan J, Kettel Khan L. Training and technical assistance for compliance with beverage and physical activity components of New York City’s regulations for early child care centers. Prev Chronic Dis. 2014;11:E177. [DOI] [PMC free article] [PubMed] [Google Scholar]
- 19.Profili E, Rubio DS, Lane HG, et al. School wellness team best practices to promote wellness policy implementation. Prev Med. 2017;101:34–37. [DOI] [PubMed] [Google Scholar]
- 20.Bandura A. Social Foundations of Thought and Action: A Social Cognitive Theory. Englewood Cliffs, NJ: Prentice Hall; 1986. [Google Scholar]
- 21.Bronfenbrenner U. Ecological Models of Human Development, Vol 3 2nd ed. Oxford, UK: Elsevier; 1994. [Google Scholar]
- 22.Lambert SD, Loiselle CG. Combining individual interviews and focus groups to enhance data richness. J Adv Nurs. 2008;62:228–237. [DOI] [PubMed] [Google Scholar]
- 23.Elo S, Kyngäs H. The qualitative content analysis process. J Adv Nurs. 2008;62:107–115. [DOI] [PubMed] [Google Scholar]
- 24.Alliance for a Healthier Generation. Healthy Schools Program: about the assessment. https://schools.healthier-generation.org/dashboard/about_assessment/. Accessed July 20, 2018.
- 25.The Smarter Lunchrooms National Office Team. Smarter lunchrooms movement. https://www.smarter-lunchrooms.org/. Accessed July 20, 2018. [Google Scholar]
- 26.Maryland School Wellness Partnership. 2015 MWPPP School Survey. http://www.marylandschoolwellness.org/tools/. Accessed July 20, 2018.
- 27.Maryland School Wellness Partnership. 2013 MWPPP school survey. http://www.marylandschoolwellness.org/tools/. Accessed July 20, 2018.
- 28.Centers for Disease Control and Prevention. School Health Index: A Self-assessment and Planning Guide. Atlanta, GA. [Google Scholar]
- 29.US Department of Agriculture, Food and Nutrition Service. Proposed rule: local school wellness policy implementation under the Healthy, Hunger-Free Kids Act of 2010. https://www.fns.usda.gov/school-meals/fr-022614. Accessed July 20, 2018. [PubMed]
- 30.National Center for Educational Statistics. Public elementary/secondary school universe survey data. https://nces.ed.gov/ccd/pubschuniv.asp. Accessed July 22, 2018.
- 31.Cunningham TD, Johnson RE. Design effects for sample size computation in three-level designs. Stat Methods Med Res. 2016;25:505–519. [DOI] [PubMed] [Google Scholar]
- 32.Hayes AF. Introduction to Mediation, Moderation, and Conditional Process Analysis: A Regression-Based Approach. New York: The Guilford Press; 2013. [Google Scholar]
- 33.Centers for Disease Control and Prevention. Putting local school wellness policies into action. Atlanta, GA: US Department of Health and Human Services; 2014. [Google Scholar]
- 34.US Department of Agriculture, Food and Nutrition Service. Local school wellness policy outreach toolkit. https://www.fns.usda.gov/tn/local-school-wellness-policy-outreach-toolkit. Accessed July 20, 2018.
- 35.Alliance for a Healthier Generation. School wellness committee toolkit. https://www.healthiergeneration.org/_asset/wwj4dq/09-875_SWCToolkit.pdf. Accessed July 20, 2018.
- 36.Action for Healthy Kids. Game on: 6 steps to building a healthy school. http://www.actionforhealthykids.org/tools-for-schools/game-on. Accessed July 20, 2018.
- 37.Kegeles SM, Rebchook GM, Tebbetts S. Challenges and facilitators to building program evaluation capacity among community-based organizations. AIDS Educ Prevent. 2005;17:284–299. [DOI] [PubMed] [Google Scholar]
- 38.Wandersman A, Chien VH, Katz J. Toward an evidence-based system for innovation support for implementing innovations with quality: tools, training, technical assistance, and quality assurance/quality improvement. Am J Commun Psychol. 2012;50:445–459. [DOI] [PubMed] [Google Scholar]
- 39.Cradock AL, Barrett JL, Kenney EL, et al. Using cost-effectiveness analysis to prioritize policy and programmatic approaches to physical activity promotion and obeprevention in childhood. Prev Med. 2017;95(suppl):S17–S27. [DOI] [PMC free article] [PubMed] [Google Scholar]
- 40.Turner LSA, Chaloupka FJ. Bridging the Gap’s Food and Fitness Elementary School Survey: Technical Report on Survey Development, Sampling, and Methodology. Chicago, IL: Bridging the Gap Program, Health Policy Center, Institute for Health Research and Policy, University of Illinois at Chicago; 2015. [Google Scholar]
- 41.Schwartz MB, Henderson KE, Falbe J, et al. Strength and comprehensiveness of district school wellness policies predict policy implementation at the school level. J Sch Health. 2012;82:262–267. [DOI] [PMC free article] [PubMed] [Google Scholar]