Abstract
X-chromosome dosage compensation in female placental mammals is achieved by X-chromosome inactivation (XCI). An exception are human pre-implantation embryos, where dosage compensation occurs by X-chromosome dampening (XCD). Here, we examined whether XCD extends to human prenatal germ cells given their similarities with naïve pluripotent cells. We found that female human primordial germ cells (hPGCs) display reduced X-linked gene expression before entering meiosis. Moreover, in hPGCs, both X-chromosome are active and express the long non-coding RNAs XACT and XIST, the master regulator of XCI, which are silenced upon entry into meiosis. These findings uncover XACT as hPGC-marker, describe XCD associated with XIST-expression in hPGCs, and suggest that XCD evolved in humans to regulate X-linked genes in pre-implantation embryos and PGCs. Additionally, we found a unique X-chromosome regulation in human primordial oocytes. Therefore, future studies of human germline development must consider the sexually dimorphic X-chromosome dosage compensation mechanisms in the prenatal germline.
Dosage compensation of genes on the X-chromosome is an essential epigenetic event that equalizes the X-linked gene imbalance between males and females1–8. In mice, dosage compensation is mediated by X-chromosome inactivation (XCI)1–7, which is established early during development, first in an imprinted form and after a brief phase of reactivation in naïve pluripotent epiblast cells, through the random form by silencing either the maternal or paternal X-chromosome1–7. Molecularly, XCI is mediated by the long non-coding RNA (lncRNA) XIST (X-inactive specific transcript), which coats the X-chromosome in cis to establish and maintain a silencing compartment over the X-chromosome territory1–7. Once established, XCI is stably maintained in female somatic cells, yet in female mouse primordial germ cells (mPGCs) the inactive X-chromosome (Xi) is reactivated, coincident with global epigenetic reprogramming9–11. Following epigenetic reprogramming and as mPGCs differentiate into meiotic cells in females or pro-spermatogonia in males, germ cells display X-chromosome dosage excess or X-chromosome dosage decompensation, respectively12, highlighting a sexually dimorphic regulation of gene expression on the X-chromosome in mouse germ cells.
Despite the conservation of XIST and XCI across placental mammals13, it is now appreciated that there is no evidence for the imprinted form of XCI in human pre-implantation embryos14–16. Moreover, in human female pre-implantation blastocyst, XIST is uniquely expressed from both X-chromosomes14,15,17 and the expression of X-linked genes on both alleles is transcriptionally reduced, yet not silenced, a compensated state that is referred to as ‘X-chromosome dampening’ (XCD)14. Another striking difference in humans is the existence of XACT (X active coating transcript), a primate-specific lncRNA that is expressed from the active X-chromosome(s) in both human pre-implantation embryos and pluripotent stem cells that may oppose XIST’s function14,17,18. The expression of XACT in human PGCs (hPGCs) is unknown.
The unique state of X-chromosome dosage compensation in human pre-implantation embryos has been puzzling and XCD is speculated to resolve to XCI within 1–2 weeks19. Therefore, it has been postulated that the transient accumulation of XIST on both X-chromosomes with XCD represents the initiating stages of the normal process of XCI20. This interpretation is consistent with bi-allelic XIST expression observed in differentiating female mouse embryonic stem cells (ESCs) during the XCI initiation process21, yet inconsistent with other findings that suggest a transient state with two active X-chromosomes (Xa’s) without XIST expression in cells transitioning between XCD and XCI22,23. Since mouse and human PGCs capture many of the epigenetic features of epiblast cells from the pre-implantation embryo24–26, yet hPGCs stably persist for around two months during development, we hypothesized that female hPGCs could serve as an alternate model to evaluate the possibility that XCD is an independent and stable regulatory mechanism for X-chromosome dosage compensation in humans.
Results
Female hPGCs express XACT from two active X-chromosomes
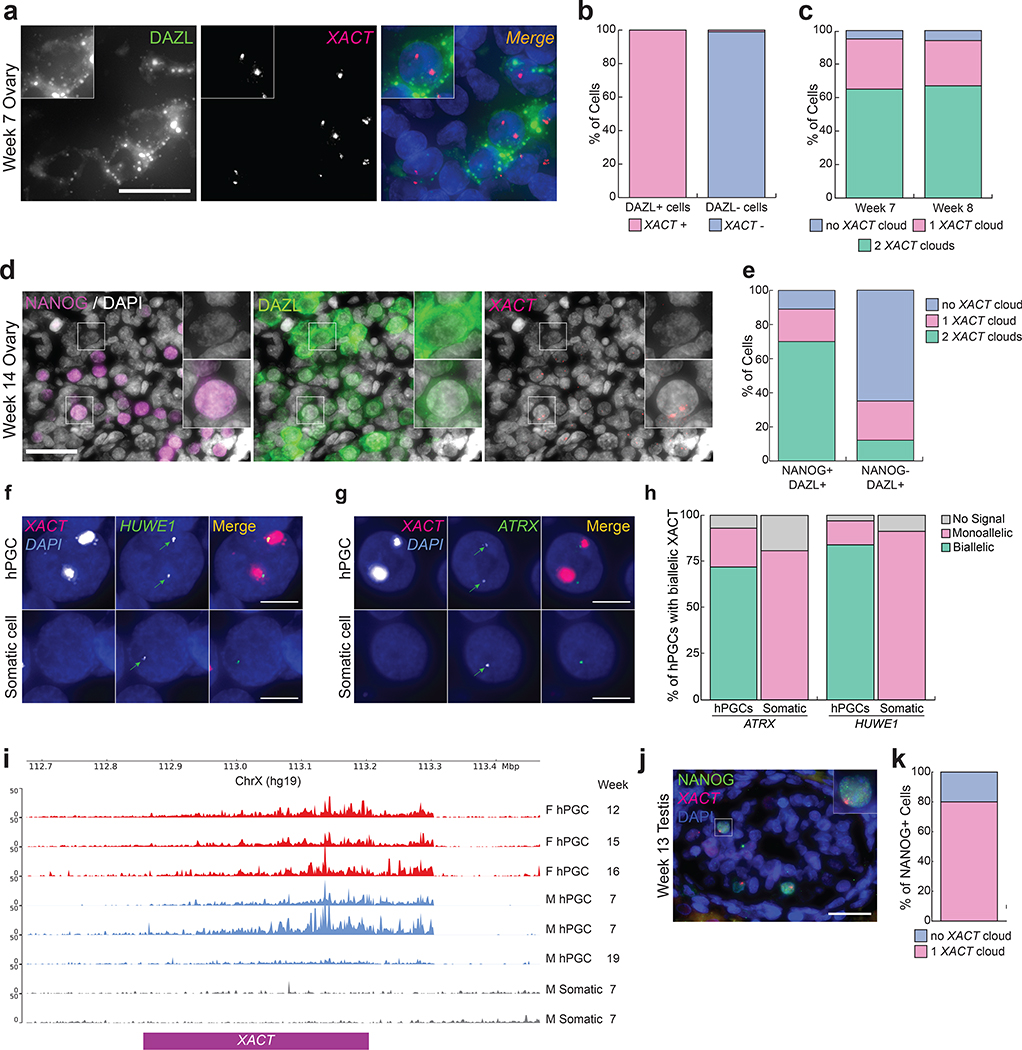
Since expression of the X-linked lncRNA XACT is associated with the unique X-chromosome state of human pre-implantation embryos14,17, we performed RNA fluorescence in situ hybridization (FISH) for XACT on prenatal ovaries together with immunostaining for the germ cell-specific protein Deleted in azoospermia like (DAZL), which marks hPGCs27. We observed XACT transcripts in nearly all female hPGCs (DAZL-positive cells) at weeks 7–8 post-fertilization (pf), whereas somatic cells (DAZL-negative) lacked XACT expression (Fig. 1a,b). We identified two XACT clouds in approximately 60–70% of hPGCs, each likely associated with the X-chromosome the RNA is transcribed from (Fig. 1c). Starting from 10 weeks pf, hPGCs heterogeneously differentiate into meiotic germ cells in females28, repressing pluripotency genes such as NANOG29. We therefore additionally detected NANOG to distinguish NANOG+/DAZL+ hPGCs from NANOG-/DAZL+ meiotic germ cells. We discovered that XACT is still expressed in the majority of NANOG+/DAZL+ female hPGCs at week 14 pf (Fig. 1d–e). In contrast, the majority of NANOG-/DAZL+ meiotic germ cells are XACT-negative (Fig. 1d–e). Thus, XACT is expressed from both X-chromosomes in hPGCs, and is not expressed by ovarian somatic cells.
Fig. 1. Male and female hPGCs express lncRNA XACT and female hPGCs carry two active X chromosomes in vivo.
a. Immuno-RNA FISH for DAZL (green) and XACT (red) in a week 7 pf embryonic ovary (1 pair of ovaries were analyzed) with DAPI staining (blue) to detect nuclei, scale bar 30 microns. b. Quantification of cells with XACT clouds based on the experiment in (a) (n=100 cells). c. Quantification of the number of XACT clouds in DAZL+ hPGCs at week 7 and 8 pf (n=100 cells/timepoint). d. Immuno-RNA FISH for XACT (red), NANOG (magenta), DAZL (green) and DAPI (grey) in a week 14 pf fetal ovary (1 pair of ovaries were analyzed). Top inset shows a NANOG-/DAZL+ hPGC negative for XACT, lower inset a NANOG+/DAZL+ hPGC with two XACT clouds; scale bar 30 microns. e. Quantification of the proportion of cells with a different XACT cloud patterns in hPGCs (NANOG+/DAZL+) and differentiating hPGCs (NANOG-/DAZL+) from (d). 92 and 95 cells, respectively, were assessed. f-g. Representative RNA FISH images for detection of nascent transcripts of the X-linked genes HUWE1 and ATRX, respectively, both normally subject to XCI, in a week 8 pf ovary. hPGCs are marked by XACT expression. The experiments have been performed twice with similar results. h. Signal quantification for (g); n=60 and n=70 cells for ATRX and HUWE1, respectively. i. Published bulk RNA-seq read mapped to the XACT genomic locus in female hPGCs (red, isolated using cKITbright or using INTa6/EpCAM), male hPGCs (blue, enriched for TNAP/KIT expression) and gonadal somatic cells (grey)25,52,53. j. Immuno-RNA FISH in fetal male testis at week 13 pf (1 pair of testis were analyzed) with XACT (red), NANOG (green) and DAPI (blue), scale bar 30 microns. k. Quantification of the proportion of cells with one XACT cloud in NANOG+ male hPGCs from (j) (n=75 cells). Statistical source data are provided in Source data fig. 1.
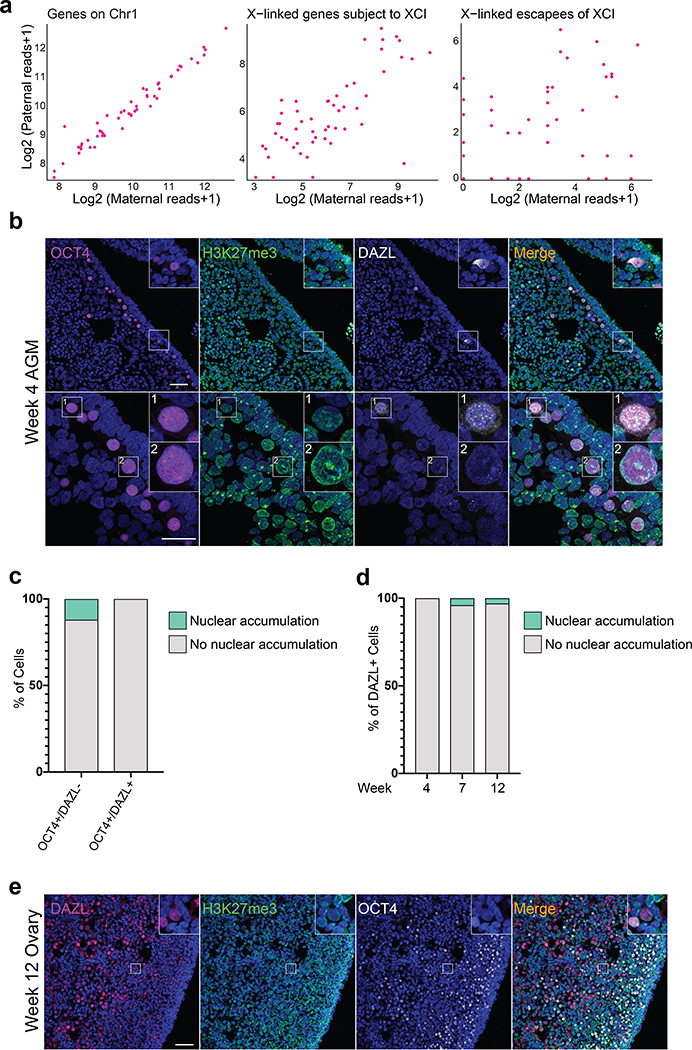
To evaluate whether additional genes are biallelically expressed in hPGCs, we performed RNA FISH for the X-linked genes HUWE1 and ATRX, detecting their nascent transcription foci in week 8 pf ovaries. We found that the majority of hPGCs marked by XACT also biallelically expresses HUWE1 and ATRX (Fig. 1f–h). In contrast, the somatic cells express these genes from a single allele due to XCI (Fig. 1f–h). These results are consistent with prior allelic analysis of X-linked gene expression from 53 sorted female germ cells30, which revealed biallelic expression of X-linked genes (Extended Data Fig. 1a). Consequently, we conclude that female hPGCs carry two active X-chromosomes.
To confirm the active state of the X-chromosome in female hPGCs, we assessed a chromatin mark specific for the Xi. In mouse, newly specified female PGCs have an enrichment of H3K27me3 on the Xi which is progressively lost as the cells undergo Xi-reactivation9,11. Given that 23% of female hPGCs have one XACT cloud (Fig. 1c), we evaluated whether female hPGCs show any evidence of nuclear H3K27me3 accumulation, indicative of an Xi31,32. At week 4 pf, we identified early stage hPGCs entering the genital ridge epithelium before induction of DAZL expression through OCT4 expression (Extended Data Fig. 1b). We found that around 10% of OCT4+/DAZL- female hPGCs have an Xi-like nuclear accumulation of H3K27me3, which is reduced to less than 5% at weeks 7 and 12 pf, once the hPGCs have settled in the ovary (Extended Data Fig. 1b–e). The lack of a H3K27me3 Xi-like enrichment suggests that the monoallelic expression of XACT observed in a portion of female hPGCs is not linked to residual XCI.
Since a naïve-like pluripotent expression program is common to both male and female hPGCs33, we explored whether XACT also marks male hPGCs. Using published bulk RNA-seq data of sorted male and female hPGCs24,25, we detected XACT expression in hPGCs but not somatic cells (Fig. 1i). We confirmed this result using RNA FISH on a fetal testis at 13 weeks pf, detecting XACT in 80% of NANOG+ hPGCs (Fig. 1j–k). Thus, as is the case for human pre-implantation embryos, both female and male hPGCs express XACT.
XACT is expressed in male and female hPGCLCs in vitro
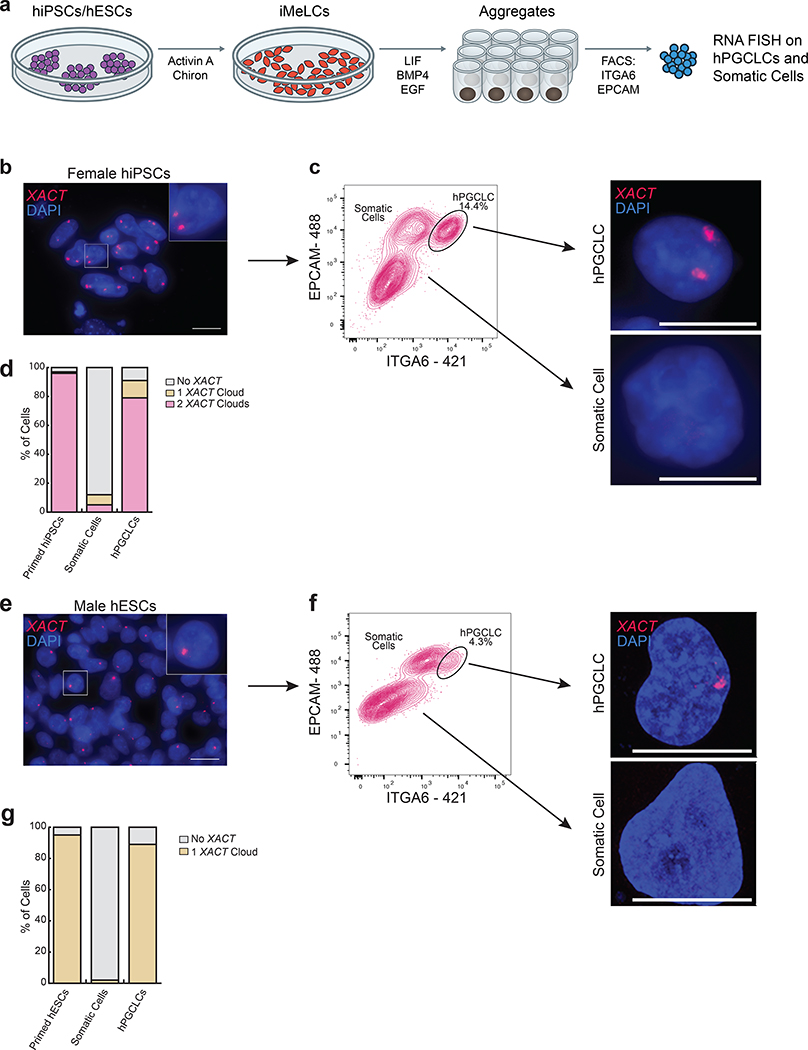
The expression of XACT in male and female hPGCs in vivo suggested that XACT may be expressed from the moment of hPGC specification. Given that hPGCs are thought to be specified between week 2–3 pf34, it is not possible to study hPGC specification in vivo. Therefore, we modelled hPGC specification using the differentiation of hPGC-like cells (hPGCLCs)35 from male (UCLA2 ESCs36) and female (MZT04-J iPSCs37) pluripotent stem cells, by analyzing XACT distribution in ITGA6+/EPCAM+ hPGCLCs and somatic cells at day 4 of differentiation (Fig. 2a). We discovered that most male hPGCLCs had one XACT cloud, whereas most female hPGCLCs had two (Fig. 2b–g). In contrast, >90% of the somatic cells were XACT-negative (Fig. 2b–g). The detection of biallelic XACT in female hPGCLCs is consistent with maintenance of the eroded Xi in differentiating hESCs23. Collectively, these data uncover the lncRNA XACT as a new marker of male and female hPGCs in vivo and in vitro.
Fig. 2. The lncRNA XACT is restricted to male and female hPGCLCs and is not expressed in somatic cells in vitro.
a. Differentiation of hPGCLCs from hiPSCs or hESCs through a incipient mesoderm like cells (iMeLC) intermediate. PGCLCs and somatic cells within the aggregates are separated at day 4 (D4) by FACS using antibodies that recognize EPCAM and ITGA6. b. RNA FISH for XACT in primed female hiPSCs (MZT04-J), that harbor a Xa and an eroded X-chromosome (Xe) with XACT (red) and DAPI (blue) stainings. XACT clouds are detected from the Xa and Xe; scale bar 20 microns. The experiments have been performed twice with similar results. c. Female hiPSCs are differentiated to hPGCLCs and isolated from the aggregates by FACS at D4. The hPGCLC population is indicated. Right panel: XACT RNA FISH in hPGCLCs and somatic cells. The experiments have been performed twice with similar results; scale bar 10microns. d. Quantification of the proportion of cells with different numbers of XACT clouds in starting hiPSCs (n=100 cells), hPGCLCs (n=82 cells) and somatic cells (n=100 cells) from (c). e. XACT RNA FISH (red) in male hESCs (UCLA2); scale bar 20 microns similar to (b). f. As in (c), except for UCLA2 hESCs; the experiments have been performed twice with similar results, scale bar 10microns. g. Quantification of the proportion of cells with a different number of XACT clouds in UCLA2 hESCs (n=100 cells) and derived hPGCLCs (n=92 cells) and somatic cells (n=100 cells pooled from the two experiments). Statistical source data are provided in Source data fig. 2.
XACT expression is epiblast-specific in human embryo attachment cultures
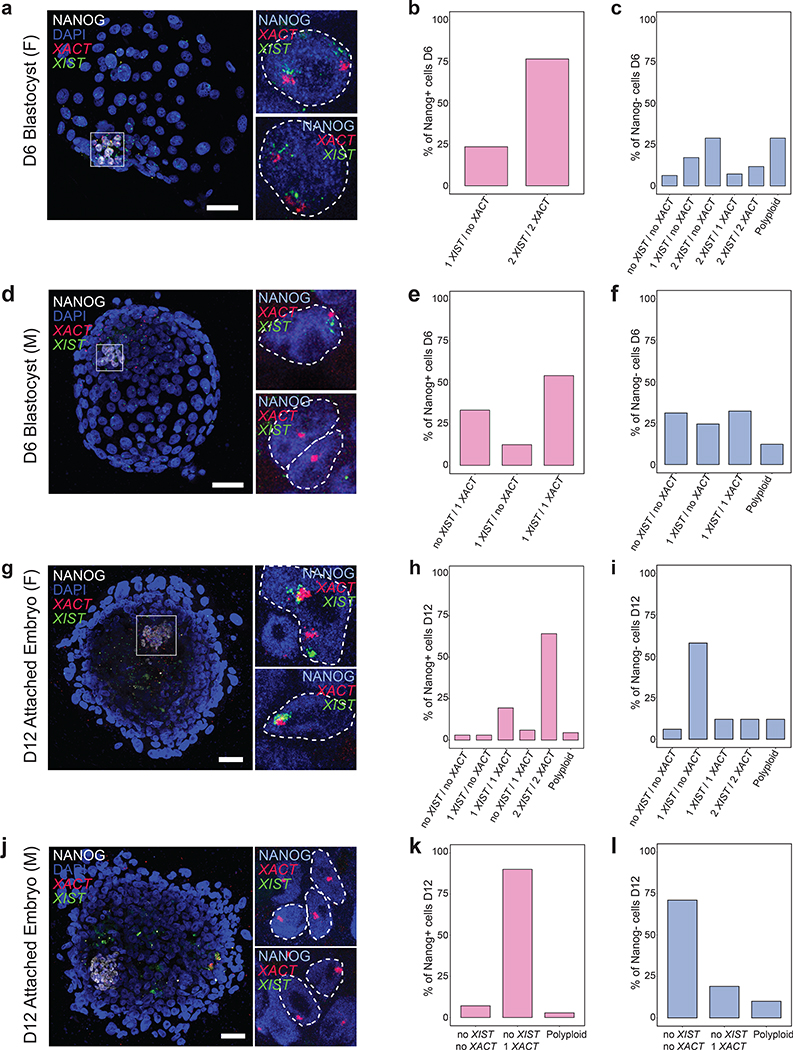
Given that XACT is expressed in NANOG+ hPGCs/hPGCLCs, we next investigated XACT distribution during the peri-implantation window of human development using human embryo attachment culture38,39. Specifically, we explored the pattern of XACT expression in NANOG+ epiblast cells versus NANOG-negative trophectoderm (TE) and primitive endoderm (PE) cells. We additionally detected the lncRNA XIST to uncover changes in its distribution. First, we performed RNA FISH for XACT and XIST in combination with immunostaining for NANOG on D6 pf female and male human blastocysts. At D6, both XIST and XACT clouds could be identified on all X-chromosomes (one in males and two in females) in 75% of female and 55% of male NANOG+ epiblast cells (Fig. 3a,b,d,e). Additionally, 30% of male epiblast cells also express only XACT (Fig. 3e). Conversely, NANOG-negative TE/PE cells have more diverse XIST and XACT expression states with XACT being more often repressed (Fig. 3c,f). These observations indicate that XACT expression is more strongly associated with the NANOG+ epiblast. Using human embryo attachment culture38,39 grown to D12 pf, the legal limit for human embryo culture in California, we discovered that the majority of female NANOG+ epiblast cells continued to display XIST and XACT clouds on both X-chromosomes (Fig. 3g,h), whereas male epiblast cells maintained expression of XACT but not of XIST (Fig. 3j,k). In the majority of female NANOG-negative cells, XACT was repressed and XIST was expressed from one X-chromosome (Fig. 3i), suggesting that these cells have transitioned to the initiation of XCI. In contrast in male embryos, both lncRNAs were silenced in 70% of NANOG-negative cells (Fig. 3l). Together, these data reveal that XACT is expressed by the majority of NANOG+ epiblast cells in the pre-implantation and early peri-implantation stages of male and female human embryo development. In contrast, XIST is rapidly repressed in male NANOG+ epiblast between D6 and D12, highlighting differences in XIST regulation in male and female human peri-implantation development.
Fig. 3. XACT is predominantly expressed in NANOG+ pre- and post-implantation epiblast cells.
a, d, g, j. Immuno-RNA FISH for NANOG (white), XIST (green) and XACT (red) in; a. day 6 (D6) intact female (F) pre-implantation blastocysts (2 blastocysts were analyzed); d. D6 male (M) pre-implantation blastocysts (3 blastocysts were analyzed); g. female embryo cultured to D12 using human embryo attachment culture (3 embryos were analyzed); j. male human embryos cultured to D12 using human embryo attachment culture (2 embryos were analyzed); scale bar 30 microns. Insets for a, d, g, j are showing NANOG+ (blue) nuclei with XIST and XACT clouds. b. Quantification of the proportion of cells with different numbers of XIST and XACT clouds in NANOG+ epiblast cells from female blastocysts in (a); 17 cells analyzed in 2 blastocysts. c. As in (b), except for quantification of the RNA pattern in NANOG-negative trophectoderm and primitive endoderm cells, with 111 cells quantified from the two blastocysts. e. As in (b), except for that NANOG+ epiblast cells from male blastocysts in (d) were assessed; with 24 cells from 3 blastocysts counted. f. Quantification as in (c), except for NANOG-negative trophectoderm and primitive endoderm cells from male blastocysts in (d); 180 cells from 3 blastocysts were counted. h. Quantification as in (b) for female D12 embryos from (g); 67 cells from 3 embryos were counted. i. Quantification as in (c) for female D12 embryos in (g); with 180 cells from 3 embryos counted. k. Quantification as in (b) for male D12 embryos from (j); with 70 cells from 2 embryos assessed. l Quantification as in (c) for male D12 embryos in (j); with 120 cells from 2 embryos quantified. Statistical source data are provided in Source data fig. 3.
Female hPGCs dampen expression from the active X chromosomes
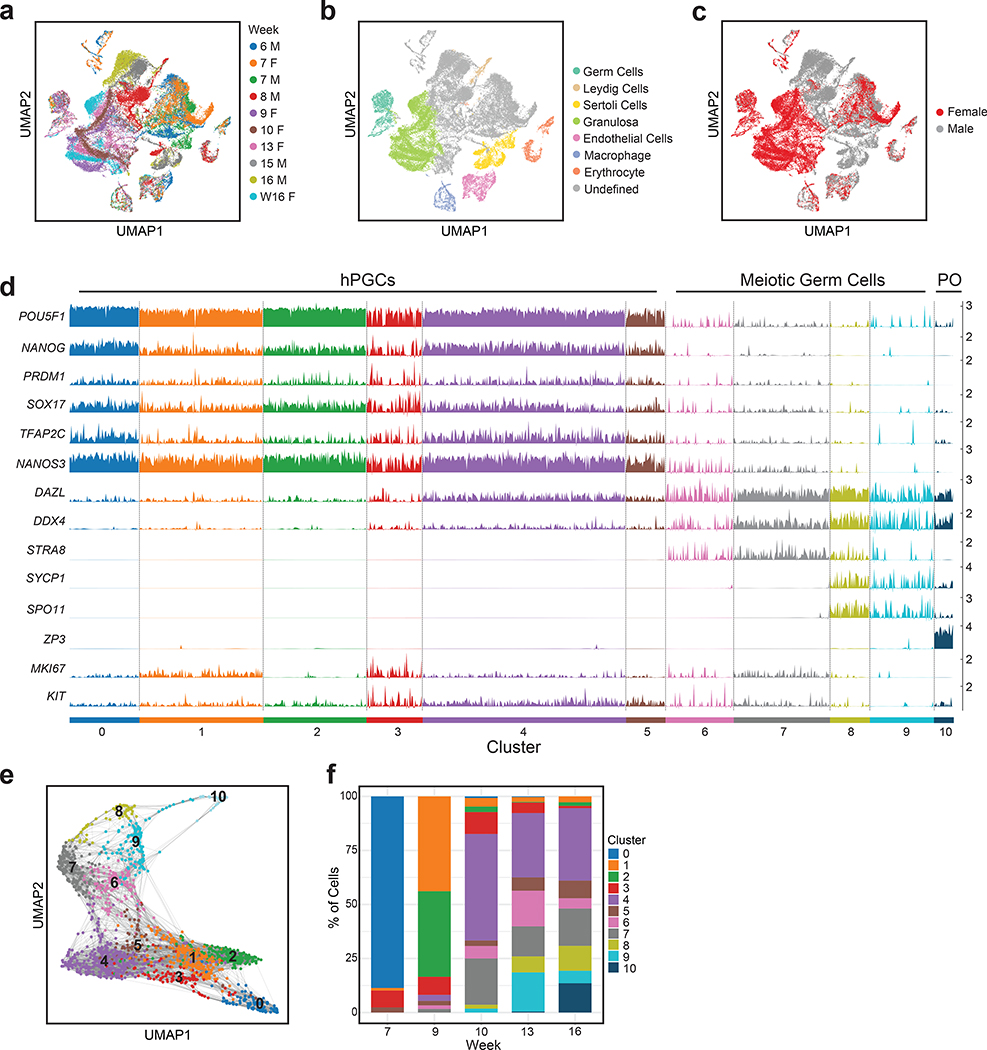
Since female hPGCs express XACT from both X-chromosomes, our next goal was to determine whether XCD is occurring in hPGCs. We performed single cell (sc) RNA-seq on single cell suspensions of five prenatal ovaries and five prenatal testes from week 6 to 16 pf (Fig. 4a–c). This unbiased approach yielded a total of ~50,000 prenatal gonadal cells, with ~281 male and 1938 female germ cells for the analysis of the X-chromosome/autosome gene expression ratio (X/A ratio) (summarized in Supplemental Table 1).
Fig. 4. Heterogenous differentiation of female hPGCs into meiotic germ cells begins around week 9–10 pf.
a. Distribution of single cell data derived from scRNA-seq from five prenatal male and five prenatal female gonads from 6–16 weeks pf on UMAP (n=49674 cells). b. Annotation of gonadal cell types in the map from (a), based on the expression of cell type-specific markers. c. Distribution of male and female cells on the map from (a). d. Ordering of female germ cells along the developmental trajectory from cluster 0 to cluster 10, with classification into hPGCs (clusters 0–5), meiotic germ cells (clusters 6–9) and primordial oocytes (PO, cluster 10), based on diagnostic germ cell marker gene expression. Each cluster contains many individual cells (columns), for which expression of indicated marker is given (rows). n= 1938 cells from n=5 samples. e. Female germ cells displayed on UMAP plot, labelled by their cluster assignment from (d). f. For each of the five female gonads described in (a), the proportion of cells in the clusters defined in (d) is given. These data show that the repression of the pluripotency expression program and meiotic licensing (expression of STRA8) begins between 9–10 weeks pf, and that all germ cells at week 7 are in the hPGC state. Statistical source data are provided in Source data fig. 4.
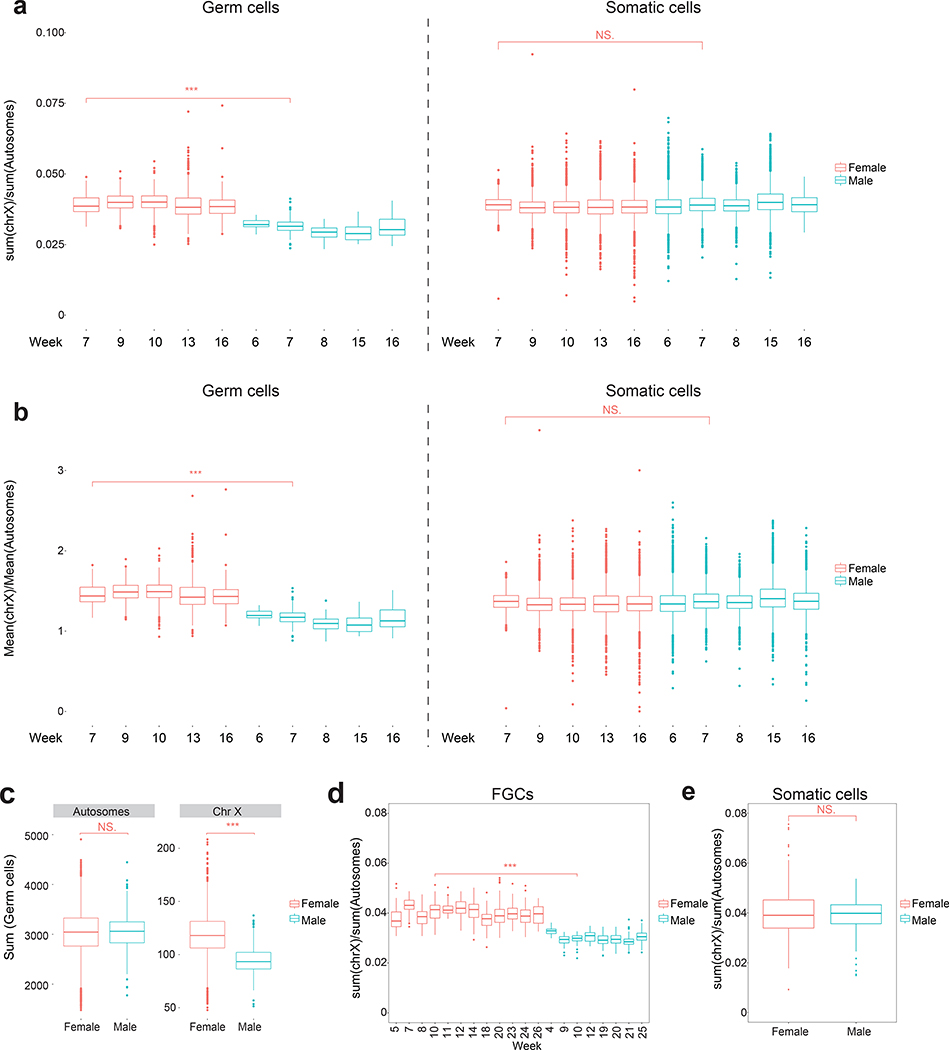
Calculating the X/A ratio across individual cells per developmental age revealed that female germ cells consistently had a higher X/A ratio than male germ cells (Extended Data Fig. 2a,b). This difference between female and male germ cells is arising from significantly lower X-linked gene expression in males (Extended Data Fig. 2c). In contrast, we found no difference in the X/A ratio between male and female gonadal somatic cells (Extended Data Fig. 2a,b). We confirmed these results with published scRNA-seq data set of cKIT/size-selected germ cells40, where germline cells are called fetal germ cells (FGCs) (Extended Data Fig. 2d,e). Thus, the X/A ratio is higher in female germ cells relative to the male, whereas male and female gonadal somatic cells are equivalent.
Since germ cell differentiation into meiotic cells is heterogeneous, we created an unsupervised developmental trajectory41, which ordered female human germ cells across 11 clusters (Fig. 4d,e). Clusters 0–5 represent hPGCs expressing the transcription factors NANOG and OCT4, together with the hPGC markers NANOS3, PRDM1 and SOX17 (Fig. 4d). Starting in cluster 6, we observed downregulation of naïve-like pluripotency genes and upregulation of the meiotic licensing gene STRA842 and of genes encoding RNA binding proteins such as DAZL and DDX4 (VASA) (clusters 6–7). This was followed by expression of the meiotic prophase I genes SPO11 and SYCP1 in clusters 8–9, and ultimately, in cluster 10, up-regulation of primordial oocyte (PO) genes including the Zona Pellucida Protein 3 (ZP3)43 (Fig. 4d). Thus, consistent with previous reports24–26,28,30,40, our data capture the heterogenous differentiation of female hPGCs into meiotic germ cells beginning around week 9–10 pf, which results in a complex mixture of germ cells including hPGCs, meiotic germ cells and primordial oocytes in a given prenatal ovary (Fig. 4f).
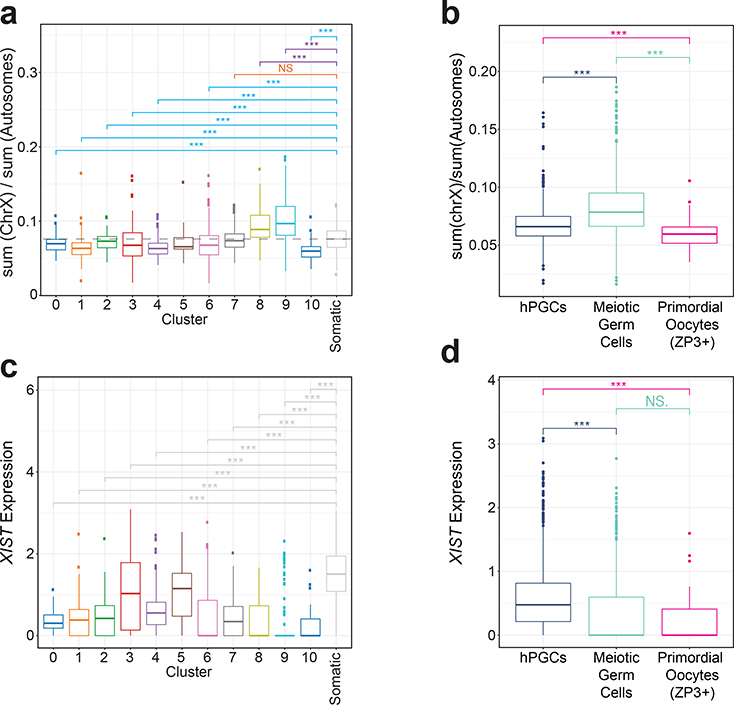
Analysis of the X/A ratio in female germ cells along the developmental trajectory (Fig. 5a) showed that as hPGCs begin differentiating into meiotic germ cells (cluster 6 onwards), the X/A ratio increases, reaching maximal levels in cluster 9 before precipitously dropping in primordial oocytes (cluster 10). Moreover, the X/A ratio in hPGCs (clusters 0–6) is lower than in gonadal somatic cells (Fig. 5a, Extended Data Fig. 3a–c). Overall X/A ratio in hPGCs (clusters 0–5) is significantly lower compared to meiotic germ cells (clusters 6–9) but higher than primordial oocytes (cluster 10) (Fig 5b). These changes were largely due to changes in X-linked gene expression (Extended Data Fig. 3d,e). We confirmed these observations in the FGC scRNA-seq data40. Similar to our analysis, female FGCs displayed a slightly lower X/A ratio than gonadal somatic cells in the hPGC state, and a subtle but significant increase in the X/A ratio after expression of STRA8 (Extended Data Fig. 3f,g). Based on these results, we conclude that the dosage of X-linked genes is dampened in female hPGCs and that this dosage compensation is erased as cells enter prophase I of meiosis I.
Fig. 5. XIST expression is associated with XCD in female hPGCs.
a. Box plots of the ratios of X-linked gene to autosomal gene expression in single female germ cells (n= 1938 cells), for each cluster along the developmental trajectory described in Figure 4d. In addition, the X/A ratio of gonadal somatic cells are given. The dotted line indicates the median level of the X/A ratio in female somatic gonadal cells. Significance testing given with blue lines shows clusters in which the X/A ratio is significantly lower compared to that in the somatic cell cluster; the orange line shows that the difference was not significant; and the purple line shows comparisons where the X/A ratio was significantly higher than in in the somatic cell cluster. b. Box plots of the X/A ratios of individual female germ cells in the hPGC-state, meiotic germ cell-state and ZP3+ primordial oocytes, merged based on developmental classification (hPGC-state, clusters 0–5; meiotic germ cells, clusters 6–9; and ZP3+ primordial oocytes, cluster 10). c. Box plots of normalized counts of XIST transcripts in individual female germ cells for each cluster along the developmental trajectory described in Figure 4d and female gonadal somatic cells. These results show female hPGCs express significantly lower levels of XIST and an abrupt loss of XIST coincident loss of the pluripotency program in cluster 6. d. Box plots of normalized XIST transcript counts in individual female germ cells, as defined in (b). Significance was assessed with the Wilcoxon Test; NS-Not Significant, *** p<0.001. n=1938 cells analyzed across 5 independent experiments.
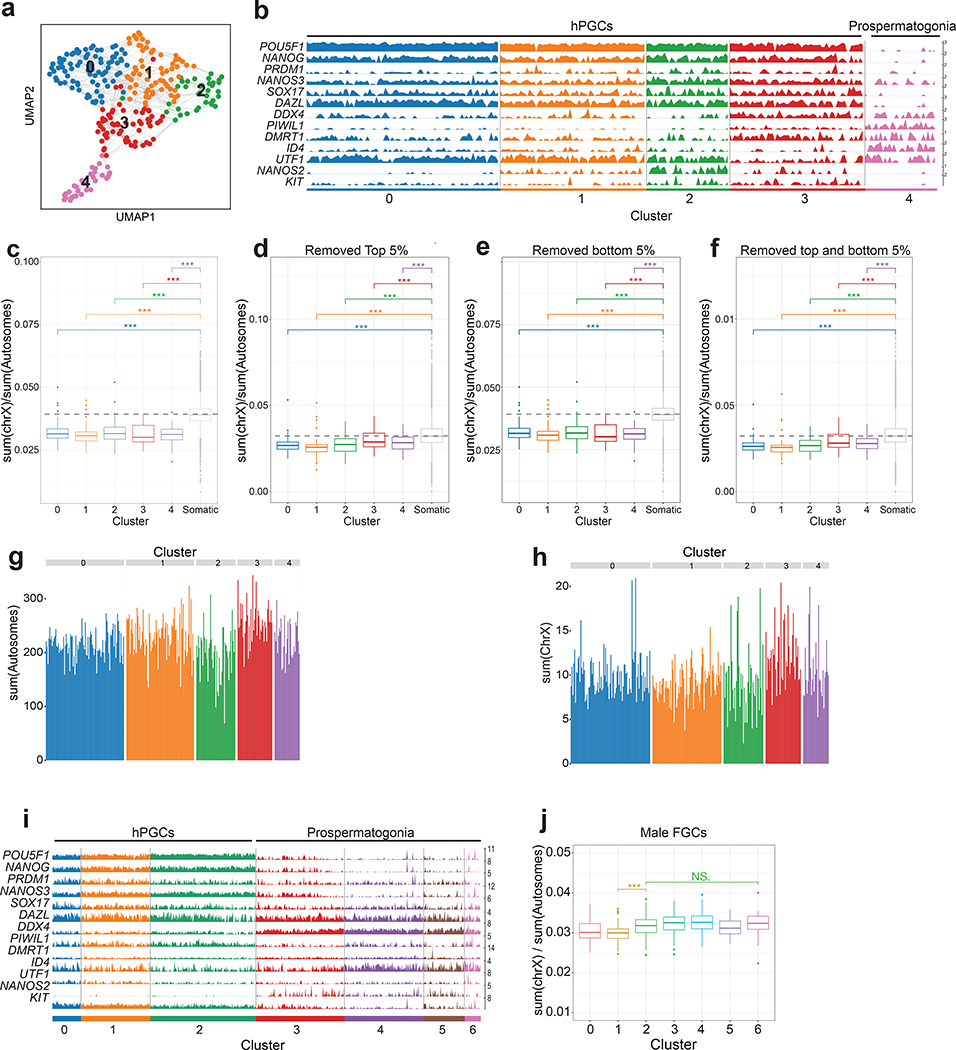
To evaluate X/A ratios in male prenatal germ cells, we ordered the cells along a developmental trajectory, which divided the male germ cells from week 6–16 pf gonads into five clusters (0–4), with the hPGC program corresponding to clusters 0–3 and cluster 4 capturing differentiating germ cells (prospermatogonia) (Extended Data Fig. 4a,b). Unlike female germ cells that exhibit X-chromosome dosage excess with exit from the hPGC state, the X/A ratio does not change when male hPGCs differentiate into prospermatogonia (Extended Data Fig. 4c–h), which was confirmed with published data sets40 (Extended Data Fig. 4i,j). Therefore, an increase in X/A ratios as hPGCs differentiate, is a female-specific phenomenon associated with entrance into prophase I of meiosis I.
XCD in female hPGCs is associated with XIST expression
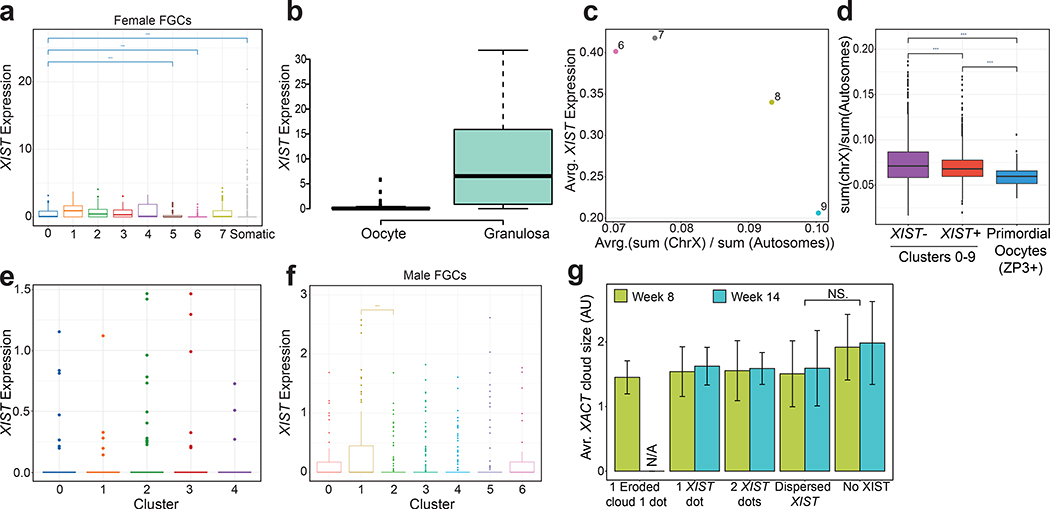
To evaluate whether XCD in female hPGCs is associated with expression of XIST, as in female human pre-implantation embryos, we examined XIST in individual female germ cells along the developmental trajectory. We discovered that XIST expression is significantly higher in hPGCs (clusters 0–5) compared to meiotic germ cells (clusters 6–9) and primordial oocytes (cluster 10) (Fig. 5c,d). This result was also validated in the female FGC data set40 (Extended Data Fig. 5a). In agreement with the low expression of XIST in primordial oocytes, the levels of the RNA are also low in adult oocytes44 (Extended Data Fig. 5b). Thus, the increase in the X/A ratio from hPGCs to meiotic germ cells is accompanied by a reduction in XIST (Fig. 5b,d and Extended Data Fig. 5c). Consistent with this result, when analyzing hPGCs and meiotic germ cells together (clusters 0–9) based on XIST expression, XIST+ cells displayed a significantly lower X/A ratio than XIST-negative cells. Primordial oocytes (cluster 10) have an even lower X/A ratio, yet express XIST at a very low level (Fig. 6b,d, Extended Data Fig. 5d).
Fig 6. XIST is repressed as hPGCs enter meiosis.
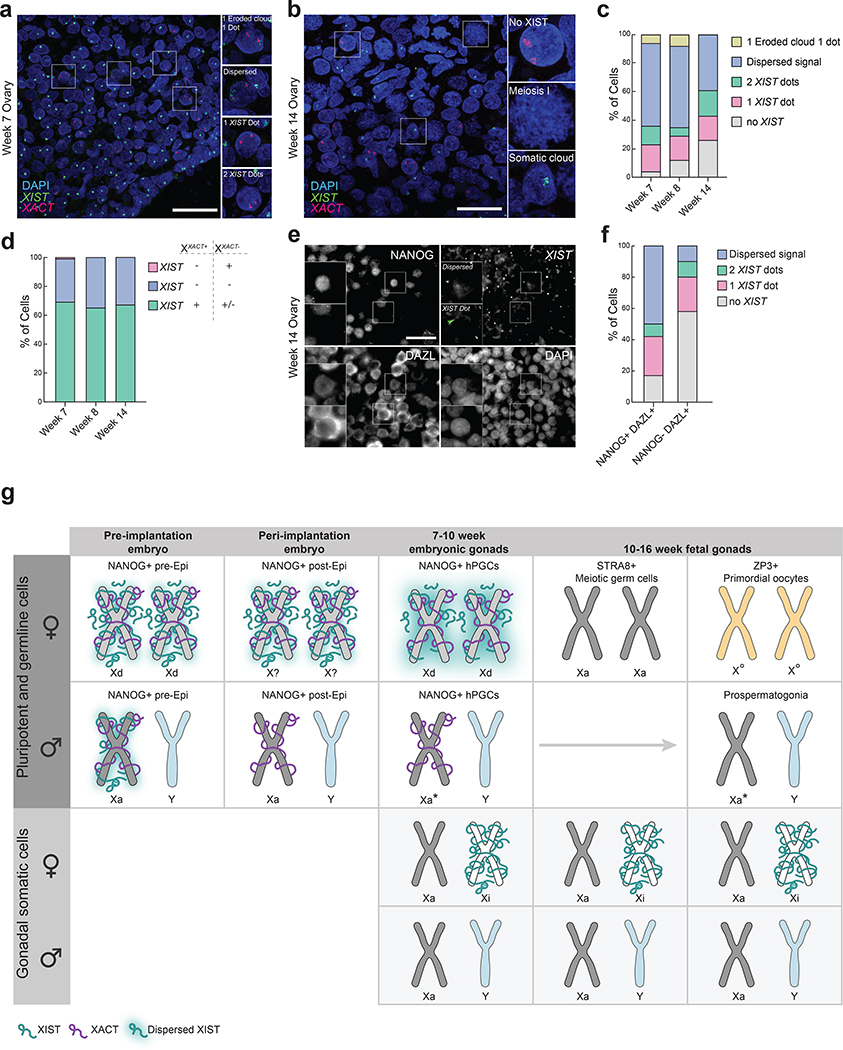
a. RNA FISH for XIST (green) and XACT (red) with DAPI (blue) identifying nuclei (week 7 n=1 pair of ovaries); scale bar 30 microns. b. As in (a), except for week 14 pf 1 pair of ovaries. c. Proportion of cells with indicated XIST expression patterns in female hPGCs with 2 XACT clouds (for each time point: n=100 cells from 1 pair of ovaries). d. Similar to (c) except in female hPGCs with a single XACT cloud. Cells with dispersed XIST signal where it was not clear to identify if XIST was expressed from one or both alleles are included in green category (total n=42 cells from 3 ovaries). e. Immuno-RNA FISH image for NANOG, DAZL and XIST RNA in week 14 pf ovary (1 pair of ovaries); scale bar 30 microns. f. Similar to (c) in female hPGCs (NANOG+/DAZL+) and meiotic germ cells (NANOG-/DAZL+) from (e) (n=104 and 98 cells, respectively from 1 sample). g. Female NANOG+ pre- and post-implantation epiblast (Epi) cells predominantly express XACT and XIST from both X-chromosomes. While genes on both X-chromosomes in pre-Epi cells are dampened due to XCD (Xd)14 it is unclear whether XCD also occurs in female post-Epi cells. However, expression of both XACT and XIST from both X-chromosomes indicates that XCI has not occurred yet. NANOG+ female hPGCs similar to pre-Epi exhibit XCD with expression of XIST and XACT from both alleles. Notably, XIST is more dispersed in the nucleus of hPGCs (depicted by glow around the X-chromosome) than pre/post-Epi cells. Upon advancement to meiosis they silence both XIST and XACT and upregulate X-linked gene expression, transitioning to the Xa-state. Next, in primordial oocytes, the X/A ratio is reduced lower than in female hPGCs without expression of XIST. This XIST-independent repression of the X/A ratio we call ‘oocyte-specific X-chromosome regulation’ (X°). Male hPGCs harbor an Xa but exhibit a lower X/A ratio compared to male somatic cells, and this state is retained upon differentiation into prospermatogonia. We refer to this state as Xa*. Gonadal somatic cells display XCI at each stage analyzed.
Next, we evaluated the localization of XIST in female hPGCs by RNA FISH from week 7 to week 14 pf, using XACT as a marker of hPGCs. We found that XIST is detectable in the vast majority of XACT-expressing hPGCs, with diverse patterns of the XIST signal (Fig. 6a–c). These include (i) an eroded cloud pattern, where XIST is restricted over one X-chromosome in a pattern characteristic of Xi-localization, yet less enriched compared to the Xi in somatic cells, combined with a nascent transcription spot of XIST on the second X-chromosome; (ii) a dispersed configuration where the XIST signal is detected throughout a large portion of the nucleus albeit in the vicinity of both XACT clouds, suggesting that XIST is expressed from both X-chromosomes; (iii) one dot in the vicinity of one of the two XACT signals, indicating expression from one X-chromosome; and (iv) two dots representing the nascent transcription sites of XIST on both X-chromosomes (Fig. 6a). Quantification of XIST expression patterns in female hPGCs with two XACT clouds, which enabled the localization of both X-chromosomes, revealed that the majority of hPGCs (58%) at week 7 pf had a dispersed XIST signal (Fig. 6c). Around 6% of cells with biallelic XACT expression displayed an eroded XIST cloud pattern and 19% and 15%, respectively, exhibited mono- and bi-allelic nascent XIST transcription foci (Fig. 6c). At later stages of embryo development (week 8 and week 14 pf), XACT-positive female hPGCs displayed similar patterns of XIST RNA with an increasing fraction of XIST-negative cells (Fig. 6b,c).
Since we observed an Xi-like distribution of XIST in 6% of week 7 and 8 pf hPGCs with two XACT clouds, we tested whether female hPGCs with one XACT cloud represent cells that have undergone XCI. In this case, XACT should be expressed from the Xa and XIST from the Xi. However, we found that XIST is typically expressed from the same X-chromosome as XACT in cells with monoallelic XIST/XACT expression (Fig. 6d), providing additional evidence for XCD instead of XCI in female hPGCs.
To confirm that the loss of XIST expression was associated with differentiation of NANOG+/DAZL+ hPGCs into NANOG-/DAZL+ meiotic germ cells, we evaluated a fetal ovary at 14 weeks pf by RNA FISH. We found that XIST was detectable in the majority of NANOG+/DAZL+ hPGCs, with the dispersed pattern being most prominent. In contrast, the majority of NANOG-/DAZL+ germ cells were negative for XIST and the subset of cells with XIST expression displayed the dot-like distribution (Fig. 6e,f). The quantification suggests that cells transition from the “dispersed XIST” pattern to the “2 XIST dot” and “1 XIST dot” patterns before XIST is turned off during germ cell differentiation. Furthermore, evaluating XIST localization around the X-chromosomes in female hPGCs relative to female human pre-implantation embryos, revealed a higher degree of XIST dispersal in hPGCs (compare Fig. 3/6), suggesting that the association of XIST with chromatin differs between the two cell types.
In addition to detecting XIST expression in female hPGCs, XIST transcripts could also be detected in male hPGCs based on scRNA-seq data, albeit at much lower level than in female cells (Extended Data Fig. 5 e,f). Furthermore, a small but significant reduction in the X/A ratio in male hPGCs correlated with significant increase in XIST levels (Extended Data Fig. 4j and 5f). Thus, a subset of male hPGCs can express XIST and display slight dampening of X-chromosome dosage. Moreover, female germ cells that lacked XIST displayed an increase, albeit not significant, in the XACT cloud size compared to cells with XIST expression (Extended Data Fig. 5g). Taken together, these data suggest that XIST may mediate dampening of X-linked gene expression in hPGCs.
Discussion
In this study, by analyzing human pre-implantation embryos, human embryo attachment culture, hPGCLC differentiation in vitro, and hPGCs in vivo, we revealed that the lncRNA XACT is expressed in pluripotent epiblast cells and hPGCs/hPGCLCs (Fig. 6g, Extended Data Fig. 6). Mechanistically, this result may be explained by the presence of an enhancer that threads XACT into the pluripotency network common to these cell types45. From this analysis, we describe XACT as a unique marker of hPGCs, and speculate that it could be used to trace hPGCs from the time of lineage specification by RNA FISH. Additionally, our RNA FISH analysis of the X-linked genes XACT, ATRX and HUWE1, together with absence of H3K27me3 accumulation in the nucleus of most female hPGCs demonstrates that female hPGCs harbor two Xa’s from at least week 4 pf onwards.
Although our imaging approaches demonstrated the presence of two active X-chromosomes in female hPGCs, the scRNA-seq data revealed that the X/A ratio is reduced in female hPGCs compared to female meiotic germ cells (Fig. 6g). These results indicate that X-linked dosage compensation in female hPGCs is regulated by the XCD mechanism, similar to female naïve human pluripotent stem cells22 and female human pre-implantation embryos14. While in pre-implantation embryos XCD is a transient state, in case of hPGCs, we show that XCD is not a transitional state into XCI, rather a stable state lasting at least 6 weeks until the point of meiotic initiation (Fig. 6g). Similar to female mouse PGCs12, we also show that X/A ratio excess occurs as female hPGCs initiate meiosis. Following prophase I of meiosis I, the X/A ratio rapidly declines coincident with primordial oocyte formation indicating a third unique state of X-chromosome dosage compensation, which we have called X° (Fig. 6g). Intriguingly, the loss of XCD in the female germline upon meiotic entry is linked to the silencing of XIST (Fig. 6g), suggesting that XIST is the mediator of XCD. In contrast, the further decline in the X/A ratio in primordial oocytes occurs in the absence of XIST expression. It remains unclear whether this regulation is achieved by XCD or other mechanisms.
Given that male hPGCs have a reduced X/A ratio compared to female and male somatic cells and female hPGCs, we refer to the active X-chromosome in male prenatal germ cells as Xa* (Fig. 6g). The lower X/A ratio in male hPGCs relative to female hPGCs could be due to inefficient dampening of X-linked gene expression from both X-chromosomes by XIST in female hPGCs, such that the levels in female hPGCs are higher than males. In support of this hypothesis, XIST is very dispersed in female hPGCs, which may lead to less efficient XCD compared to the more cloud-like distribution of XIST reported for the pre-implantation embryo14,15. On the other hand, a higher X/A ratio in female and male somatic cells could be explained by upregulation of single Xa in somatic cells12,46,47, which may not be occurring in female or male hPGCs. Combined with XCD occurring on the X-chromosomes in female hPGCs, this alternate explanation would explain lower X-linked gene expression in female hPGCs compared to somatic cells.
Since germline specification in humans takes days compared to hours in mice, and hPGC development is a much lengthier process than in mice, it is conceivable that the maintenance of X-chromosome dosage compensation in germ cells between the two species are different. It is likely that a primate specific X-chromosome regulation mechanism might be necessary to compensate dosage of X-linked genes in the human embryo during PGC specification and the first trimester of pregnancy. However, how XIST and XACT contribute to X-chromosome gene regulation in the developing human germline will need to be studied mechanistically. Achieving this goal will require new in vitro cell models of hPGC development that are able to reliably promote the differentiation of hPGCLCs into meiotic germ cells and primordial oocytes combined with functional approaches48.
X-chromosome dosage regulation might be extremely important for Turner (XO) and Klinefelter (XXY) syndrome patients, who suffer from infertility associated with loss of germline cells49,50. Although germline development in fetuses diagnosed with Turner syndrome is morphologically normal, oocyte loss occurs within the first few months after birth51. Potentially, meiosis is not occurring correctly in Turner syndrome patients due to diminished levels of critical X-linked genes in differentiating XO hPGCs compared to XX hPGCs. Thus, upregulation of X-linked gene expression with entrance into meiosis may be necessary for the formation of mature oocytes.
In summary, with the demonstration of XCD, our work draws parallels between the X-chromosome state of human epiblast and hPGCs. Our work sheds light on mechanisms that regulate X-linked gene expression in hPGCs prior to meiosis, and reveal a unique X-chromosome state in oocytes, which potentially could be important for oocyte formation and zygote development downstream.
Methods
Human fetal tissues
Prenatal gonads from 4 to 16 weeks post-fertilization were obtained from either the University of Washington Birth Defects Research Laboratory (BDRL) or the University of Tubingen. At BDRL, prenatal gonads were obtained with regulatory oversight from the University of Washington IRB approved Human Subjects protocol, combined with a Certificate of Confidentiality from the Federal Government. BDRL collected the fetal testes and ovaries and shipped them overnight in HBSS with ice pack for immediate processing at UCLA. Prenatal samples from University of Tübingen were delivered to UCLA 24–48 hours after the procedure. The research project was also approved by the research ethics committee of the University of Tübingen (IRB# 584/2018BO2 and 634/2017BO1). All human fetal tissue used in the current study were obtained following informed consent. The donated human fetal tissue sent to UCLA did not carry any personal identifiers. No payments were made to donors and the donors knowingly and willingly consented to provide research materials without restrictions for research and for use without identifiers. Developmental age was documented by BDRL and University of Tübingen as days post fertilization using a combination of prenatal intakes and carnegie staging. A total of 16 fetal samples was used for this study.
Human pre-implantation embryos
Use of human embryos in this research project followed California State law and upon review by the Institutional Review Board (IRB) and the human embryonic stem cell research oversight committee (ESCRO) at UCLA. The ESCRO committee at UCLA approves human pluripotent stem cell and human embryo work at UCLA based on 2016 ISSCR guidelines. Together, these committees approve the process of informed consent, and experiments using human embryos for research purposes on an annual basis. Patients were not paid for participation, and all donors were informed that the embryos would be destroyed as part of the research study. All research with human embryos in this study complied with the principles laid out in the International Society for Stem Cell Research. Frozen human blastocysts at day 6–7 pf were used in this study and thawed using Vit Kit-Thaw (Irvine Scientific) according to manufacturer protocol. After thawing, embryos were cultured overnight in 5% O2, 6% CO2 at 37°C, and the zona pellucida was removed with Tyrode’s acidified solution (Irvine Scientific). A total of 28 human blastocysts were used here. The sex of the blastocysts was determined by cloud counts of lncRNA XIST and XACT expression from a single (male) or both X chromosomes (female).
Tissue processing for scRNA-seq
Fetal tissues were processed 24–48 hours after termination. Upon arrival, tissues were gently washed with PBS and placed in dissociation buffer containing of Collagenase IV 10mg/ml (Life Technologies #17104–019), Dispase II 250 ug/ml (Life Technologies #17105041), DNAseI 1:1000 (Sigma 4716728001), 10% FBS (Life Technologies 10099141) in 1x PBS. Tissues were dissociated for 15 minutes at 37°C. After every 5 minutes, the tissues were pipetted against the bottom of Eppendorf tube. Subsequently, cells were centrifuged for 5 minutes at 500g, resuspended in 1x PBS with 0.04% BSA, and strained through 40-micron strainer and counted using automated cell counter (Thermo Fisher, Countess II). The cell concentration was adjusted to 800–1200 cells per microliter and immediately used for scRNA-seq.
scRNA-seq library preparation and sequencing
scRNA-seq libraries were generated using the 10X Genomics Chromium instrument and Chromium single cell 3’ reagent kit V2. Each individual library was designed to target 6000 cells. Libraries were generated according to manufacturer’s instructions and library fragment size distribution was determined by BioAnalyzer instrument. Libraries were pooled together and sequenced on Illumina Novaseq 6000 platform, at average depth of 400–420 million reads per sample.
scRNA-seq data analysis
scRNA-seq reads were aligned to human hg38 genome assembly using 10X Genomics Cell ranger v2.2. Expression matrixes generated by Cell Ranger were imported to Scanpy54 for downstream analysis. First, all libraries were merged, and cells were subjected to the same filtering. All genes expressed in less than five cells were discarded and cells with less than 250 detected genes were filtered out. The UMI counts were then normalized for each cell by the total expression, multiplied by 10000 and log-transformed. Using Scanpy’s default method, highly variable genes were identified, and data were scaled to regress out variation from UMI counts and mitochondrial genes. Cells were clustered by Louvain algorithm55 and the UMAP package was used to visualize cells in 2D plot54. Germ cell clusters were identified by expression of germ cell-specific markers such NANOS3, DAZL, DDX4, SYCP1. Gonadal somatic cells were annotated by previously published literature40. The female and male germline trajectories were created by partition-based graph abstraction (PAGA)41. The Li at al dataset40 was analyzed through the same pipeline as described above. Gene expression matrixes of female and male germ cells were exported from Scanpy and X linked gene expression ratios with autosomal gene expression ratio per cell were calculated with custom R script.
Tissue processing and cryo-sectioning
Upon arrival, fetal tissues were gently washed with 1x PBS and fixed with freshly made 4% Paraformaldehyde in 1x PBS for 3–4 hours on a rotator at room temperature. Tissues were washed with 1xPBS 3 times for 5 minutes and moved through increasing concentrations of sucrose, 10% sucrose 1 hour. 20% 1 hour and 30% overnight at 4°C. Afterwards, tissues were embedded in OCT (Tissue-Tek O.C.T) and 7micron sections were cut. Sections and tissue blocks were kept at −80°C.
Human ESC culture
Human ESC/hiPSC lines used in this study include UCLA2 (46, XY)36 and MZTO4 iPSC (46, XX)37. hESCs/hiPSCs were cultured on mitomycin C-inactivated mouse embryonic fibroblasts (MEFs) in hESC media, which is composed of 20% knockout serum replacement (KSR) (GIBCO, 10828–028), 100mM L-Glutamine (GIBCO, 25030–081), 1x MEM Non-Essential Amino Acids (NEAA) (GIBCO, 11140–050), 55mM 2-Mercaptoethanol (GIBCO, 21985–023), 10ng/mL recombinant human FGF basic (R&D systems, 233-FB), 1x Penicillin-Streptomycin (GIBCO, 15140–122), and 50ng/mL primocin (InvivoGen, ant-pm-2) in DMEM/F12 media (GIBCO, 11330–032). The hESCs and iPSCs were split every 7–8 days using Collagenase type IV (GIBCO, 17104–019). The hESC line used in this study is registered with the National Institute of Health Human Embryonic Stem Cell Registry and available for research use with NIH funds. Mycoplasma test (Lonza, LT07–418) was performed every month to all cell lines used in this study. All experiments were approved by the UCLA ESCRO Committee.
hPGCLC differentiation
hPGCLCs were induced from primed hESCs/hiPSCsas described before53 with Stem Cell Factor (SCF) omitted from the differentiation media and starting with human pluripotent stem cells grown on MEFs. Briefly, hESCs/hiPSCs were dissociated into single cells with 0.05% Trypsin-EDTA (GIBCO, 25300–054) and plated on Human Plasma Fibronectin (Invitrogen, 33016–015)-coated 12-well- plates at the density of 200,000 cells/well in 2mL/well of iMeLC media - 15% KSR (GIBCO, 10828–028), 1x NEAA (GIBCO, 11140–050), 0.1mM 2-Mercaptoethanol (GIBCO, 21985–023), 1x Penicillin-Streptomycin-Glutamine (GIBCO, 10378–016), 1mM sodium pyruvate (GIBCO, 11360–070), 50ng/mL Activin A (Peprotech, AF-120–14E), 3mM CHIR99021 (Stemgent04–0004), 10mM of ROCKi (Y27632, Stemgent, 04–0012-10), and 50ng/mL primocin in Glasgow’s MEM (GMEM) (GIBCO, 11710–035). After 24 hrs, iMeLCs were dissociated into single cells with 0.05% Trypsin-EDTA and plated into ultra-low cell attachment U-bottom 96-well plates (Corning, 7007) at the density of 3,000 cells/well in 200ml/well of hPGCLC media, which is composed of 15% KSR (GIBCO, 10828–028), 1x NEAA (GIBCO, 11140–050), 0.1mM 2-Mercaptoethanol (GIBCO, 21985–023), 1x Penicillin-Streptomycin- Glutamine (GIBCO, 10378–016), 1mM sodium pyruvate (GIBCO, 11360–070), 10ng/mL human LIF (Millipore, LIF1005), 200ng/mL human BMP4 (R&D systems, 314-BP), 50ng/mL human EGF (R&D systems, 236-EG), 10mM of ROCKi (Y27632, Stemgent, 04–0012-10), and 50ng/mL primocin in Glasgow’s MEM (GMEM) (GIBCO, 11710–035).
hPGCLC sorting and preparation for RNA FISH
hPGCLC aggregates were dissociated 0.05% Trypsin-EDTA (GIBCO, 25300–054) for 10 min at 37o C. The dissociated cells were stained with conjugated antibodies, washed with FACS buffer (1% BSA in PBS) and resuspended in FACS buffer with 7-AAD (BD PharMingen, 559925) as viability dye. The conjugated antibodies used in this study include ITGA6 conjugated with BV421 (BioLegend, 313624, 1:60), EPCAM conjugated with 488 (BioLegend, 324210, 1:60). The single cell suspension was sorted for further experiments using BD FACSAria fluorescence-activated cell sorting machine. FACS data was analyzed with FlowJo v10 software. Double positive cells for ITGA6 and EPCAM (hPGCLCs) and negative cells (non-hPGCLCs) were collected in hPGCLC media and plated on human plasma fibronectin coated coverslips overnight. Following morning, RNA FISH was performed using the coverslips.
Immunofluorescence
Slides of paraffin-embedded sections were deparaffinized by successive treatment with xylene and 100%, 95%, 70% and 50% ethanol. Antigen retrieval was performed by incubation with 10mM Tris pH 9.0, 1mM EDTA, 0.05% Tween at 95C for 40 min. The slides were cooled and washed with 1xPBS (phosphate buffered saline) and 1xTBS (PBS + 0.2% Tween). Cryo sections and Blastocysts attached to ibidi chambers were fixed with 4% PFA for 10 minutes and washed with 1xPBS. Afterwards paraffin-embedded, cryo sections and blastocysts were treated similarly. The samples were permeabilized with 0.5% Triton X-100 in 1xPBS, then washed with 1xTBS and blocked with 1% BSA in 1xTBS. Primary antibody incubation was conducted 1% BSA for 1h at RT. Samples were again washed with 3xTBS-tween and incubated with fluorescent secondary antibodies at 1:200 for 45 min, then washed and counterstained with DAPI for 5 min and mounted using Vectashield. The primary antibodies used for immunofluorescence in this study are listed in supplemental table 1 under Antibody List tab. The secondary antibodies used in this study were all from Life technologies used at 1:400 dilution. Images were taken using LSM 880 Confocal Instrument (Zeiss) or Zeiss Axio Imager M1. For image processing and analysis Fiji (ImageJ) was used. For signal quantification, images were converted into 8-bit images and afterwards performed using profile plot tool. Intensity values were exported as a csv file and afterwards R Studio and ggplot2 package was used for plotting.
RNA FISH
hPGCLCs and non-hPGCLCs after sorting were attached to fibronectin coated 18mm circular glass coverslips (Fisher Scientific, 12–545-100) overnight. Next morning, the coverslips were washed with DPBS, fixed with 4% formaldehyde for 10 min, permeabilized with cold (4°C) 0.5% Triton X-100 in DPBS for 10 min, and serially dehydrated with cold (4°C) 70–100% ethanol. Coverslips were air dried and hybridized with labeled DNA probes in a humidified chamber at 37°C overnight, washed for three 5-min intervals with 50% formamide in 2x SSC, 2x SSC, then 1x SSC at 42°C, counterstained with DAPI and mounted with Vectashield (Vector labs: H-1000). Double- stranded DNA probes were generated from full length cDNA constructs or BACs as described previously56. The BACs used include XIST (RP11–13M9), XACT (RP11–35D3), ATRX (RP11–1145J4), and HUWE1 (RP11–975N19). Every new batch of probes was tested on normal human dermal fibroblasts before use in experiments.
Immuno-RNA FISH
Immuno-RNA FISH on cryo sections was performed as described previously described56. Briefly, immuno staining was performed first on cryo sections and blastocysts as described above. Samples were post fixed with 4% PFA after IF staining and RNA FISH was performed after post fixation as described in RNA FISH section above.
Immuno-RNA FISH on human blastocysts was performed as described previously23, with the following modifications: Embryos at day 5 and day 6 post fertilization were thawed for these experiments and cultured for 24 hours before staining. First zona pellucida was removed with Tyrode’s acid and blastocysts were washed with 6 mg/mL BSA (Sigma) in RNAse-DNAse-free PBS. They were then individually transferred to ibidi chambers (Ibidi 80827), coated with polylysine (Sigma P4832–50ML). fluid aspirated until dry and blastocysts were fixed with ice-cold 4% paraformaldehyde (PFA) for 10 min at room temperature. Immunostaining was performed as described above. In all buffers and antibody solutions RNAseOUT 1:200 (Thermo 10777019) was added to preserve RNA. Before performing RNA FISH samples were post fixed with 4% PFA for 10 min at RT. Afterwards RNA FISH was performed using DNA probes as described above.
Attached blastocyst culture
Human embryo attachment culture was performed following the procedures of (Deglincerti et al., 201638; Shahbazi et al., 201639). Briefly, cryopreserved human blastocysts were received vitrified from the IVF clinic following consent and thawed using Vit Kit-Thaw (Irvine Scientific) according to manufacturer protocol. The embryos were cultured in drops of Continuous Single Culture Complete medium pre-supplemented with HSA (Irvine Scientific) under mineral oil (Irvine Scientific) overnight at 37°C, 6% CO2 and 5% O2. The zona pellucida was removed using Tyrode’s solution acidified (Irvine Scientific) and plated onto an m-Slide 8-well chamber slide (ibidi) in IVC-1 medium (Cell Guidance Systems) and incubated for 2 days at 37°C and 5% CO2 to allow for attachment. Media was half replaced on the second and third day with IVC-1. From the fourth day and onward, media was fully replaced with IVC-2 medium (Cell Guidance Systems) until the appropriate developmental day was reached up to a maximum of Day 12, which includes the blastocyst stage plus days in culture. For these experiments, 9 blastocysts were cultured up to day 12 post fertilization, out of which 5 were used for immuno-RNA FISH experiments.
Bulk RNA-seq data analysis
Published Raw population RNA-seq data sets25,52,53 of male and female hPGCs and somatic cells were downloaded and realigned to hg19 genome as described previously17 for lncRNA XACT expression analysis. Expression tracks were generated using pyGenomeTracks package 57.
Code availability
Custom scripts used for aligning population RNA-seq, scRNA-seq, data processing and plotting are available upon request.
Statistics and Reproducibility
In the quantitative data, significance was assessed using Wilcoxon tests; *P < 0.05, **P < 0.01, ***P < 0.001, NS - non-significant. Statistical analyses are described in detail for each panel. Immuno-RNA FISH experiments were performed in 2 independent experiments with similar results, unless specified otherwise in the legends. scRNA-seq datasets were pooled from 10 independent experiments. No statistical methods were used to predetermine the sample size, rather sample size was limited by availability of prenatal tissues. Signal intensity measurement details are described in Immunofluorescence section. For plotting and statistical analysis of scRNA-seq datasets and immune-RNA FISH quantifications ggsignif and ggplot2 R packages were used.
Extended Data
Extended Data Fig. 1. Female hPGCs from week 4 pf ovaries have lost the H3K27me3 nuclear accumulation.
a. Distribution of single nucleotide polymorphisms (SNPs) from maternally inherited (x-axis) and paternally inherited (y-axis) alleles in gene expression data of female hPGCs. Each dot represents sum of all detected SNPs per cell for genes on chromosome 1 (Chr1), X-linked genes subject to XCI and escapees of XCI, respectively, based on published scRNA-seq data30. b. Representative immunofluorescence staining of OCT4 (magenta), H3K27me3 (green), DAZL (grey) and DAPI (blue) on female hPGCs at week 4 pf prior to gonad formation, when hPGCs are migrating through the aorta-gonad-mesonephros (AGM) (1 sample was analyzed). Insets show a rare OCT4+/DAZL+ cell with no nuclear accumulation of H3K27me3 (inset 1) and an OCT4+/DAZL- cell with H3K27me3 accumulation (inset 2) along the genital ridge of the AGM. Scale bar upper panel 50 microns, lower panel 30 microns. c. Percentage of OCT4+/DAZL+ and OCT4+/DAZL- cells with an Xi-like nuclear accumulation of H3K27me3 from the experiment shown in (c); (n=58 cells from 1 AGM). d. Quantification of the proportion of DAZL+ female hPGCs at weeks 4, 7 and 12 pf with an Xi-like nuclear accumulation of H3K27me3 (n=50–100 cells per sample in 2 replicates). e. Representative immunofluorescence staining of a fetal ovary at week 12 pf with DAZL (magenta), H3K27me3 (green), OCT4 (grey) and DAPI (blue). Inset shows a DAZL+/OCT4 negative female germ cell that is negative for H3K27me3 (1 pair of ovaries were analyzed), scale bar 50 microns. Statistical source data are provided in Source data extended data fig. 1.
Extended Data Fig. 2. The X/A ratio is higher in female germ cells than in male germ cells.
a. Boxplots presenting the X/A ratio, calculated from the sum of X-linked linked gene expression and the sum of autosomal gene expression, of individual female (red) or male (cyan) germ cells (left panel) and surrounding somatic cells (right panel) obtained from gonads harvested from indicated developmental timepoints (week). b. As in (a), except that the X/A ratio was determined from the mean expression levels of X-linked and autosomal genes per cell. c. Boxplot showing the distribution of the sum of all autosomal (left) and X-linked (right) gene expression, respectively, in individual female and male germ cells across for developmental time points shown in (a). d. As in (a), except that the X/A ratios in female and male FGCs across developmental time from a published study are shown40. e. X/A ratio per single cell in female and male gonadal somatic cells from all developmental ages accompanying the data shown in (d). Wilcoxon statistical testing between age matched samples, NS- Not Significant, * p<0.05, ** p<0.01, *** p<0.001. a-c: n = 49528 cells analyzed across 10 independent experiments and d-e: 1016 cells analyzed from published dataset40 in total.
Extended Data Fig. 3. Female hPGCs dampen X linked gene expression before entering meiosis.
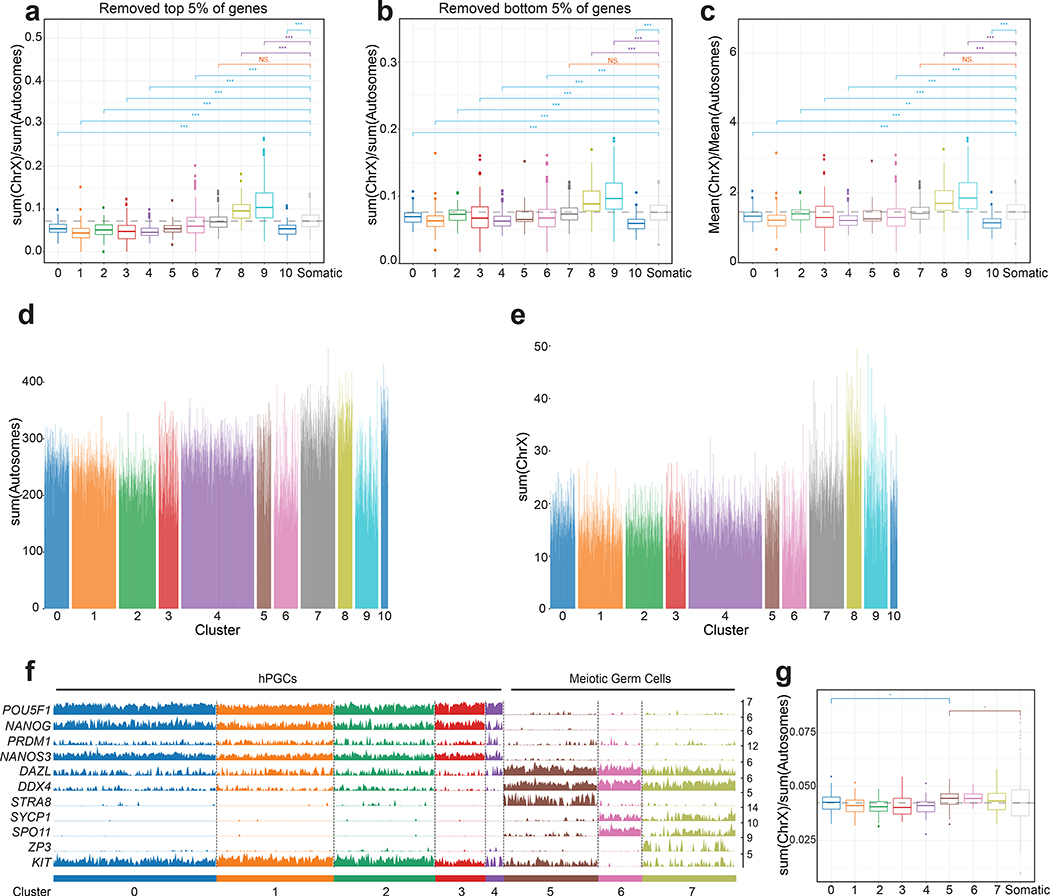
a. Boxplots of the X/A ratios of female germ cells along the developmental trajectory and in female gonadal somatic cells, as described in Figure 5, except that the top 5% highest expressed genes were excluded from the analysis. b. As in (a), except that the bottom 5% of expressed genes were excluded from the analysis. c. Boxplots of the X/A ratios in female germ cells and female gonadal cells as described in Figure 5, except that the X/A ratios were calculated from the mean value of X-linked and autosomal gene expression per cell. d. Sum of all autosomal gene expression normalized counts in female germ cells organized by clusters along the developmental trajectory. e. Sum of all X-linked gene expression in female germ cells organized by clusters along the developmental trajectory. X-linked gene expression increases in clusters 7–9 coincident with entrance into meiosis and repression of the naïve-like pluripotency program. f. Germline trajectory analysis of previously published scRNA-seq data from female FCGs40. The hPGCs state with pluripotency program expression is captured with clusters 0–4, and meiotic entry in cluster 5–7. g. Boxplots of the X/A ratios for female germ cells and female gonadal somatic cells for the data set shown in (f). From cluster 5 onwards, X/A ratios in differentiating female germ cells are higher than gonadal somatic cells. Wilcoxon statistical testing for (a), (b), (c), (g). NS- Not Significant, * p<0.05, ** p<0.01, *** p<0.001.
Extended Data Fig. 4. Male hPGCs do not change X/A ratio upon sex specific differentiation.
a. Male germ cells from the scRNA-seq data shown in Figures 4a–c were projected along the developmental trajectory, and five clusters (0–4) were identified (n= 282 cells pulled from 5 samples). The pluripotency program is repressed in cluster 4, coincident with increased expression of prospermatogonia genes and exit from the cell cycle. b. Expression of marker genes along the developmental trajectory of male germ cells defined in (a). c. Box plots showing that X/A ratios in male germ cells along the developmental trajectory and in surrounding male somatic cells. d. As in (c), except that the top 5% highest expressed genes were excluded from the analysis. e. As in (c), except that bottom 5% of genes were excluded. f. As in (c), except that the top and bottom 5% of expressed genes were excluded. In total n = 24740 cells analyzed across 5 independent experiments in c-f. g. Sum of all autosomal gene expression per cell in male germ cells along the developmental trajectory, showing no dramatic differences across the clusters. h. As in (g), except for X-linked gene expression, showing no dramatic differences across the clusters. i. Germline trajectory analysis for male FGCs40, identified 7 clusters (0–6). Marker gene expression is given for these clusters. j. Box plots of the X/A ratios in male FCGs along the developmental trajectory defined in (i), showing an increase in cluster 2 relative to cluster 1. In total, n = 779 cells analyzed from published dataset40 in j. Wilcoxon statistical testing used for (c-f) and (j). NS- Not Significant, * p<0.05, ** p<0.01, *** p<0.001.
Extended Data Fig. 5. XIST expression correlates with the X/A ratio.
a. Boxplot depicting the expression of XIST in female germ cells organized by clusters along the developmental trajectory defined for the published FCG data set40 in Extended Data Fig. 3f,g. XIST expression is significantly reduced from cluster 5 onwards. b. XIST expression in mature oocytes and granulosa cells from scRNA-seq data of adult ovary44. c. Scatter plot of average XIST expression (y-axis) and average X/A ratio (x-axis) for female germ cells clusters 6–9 (from Figure 4d), capturing the entrance into meiosis. d. X/A ratios in female hPGCs and meiotic germ cells clustered based on expression of lncRNA XIST, ZP3+ primordial oocytes are clustered separately. e. Boxplots depicting XIST expression in male germ cells ordered along the developmental trajectory defined in Extended Data Fig. 4a–h, indicating that XIST transcripts are rarely detected in male germ cells. f. As in (e), except for male FGCs40 from Extended Data Fig 4i,j. g. Average XACT cloud size in week 8 and 14 pf hPGCs with different patterns of XIST expression, error bars show standard deviation of the cloud sizes (76 cells analyzed in total from 2 independent experiments). Wilcoxon statistical testing used for (a), (d), (f), (g). NS- Not Significant, * p<0.05, ** p<0.01, *** p<0.001. Number of cells analyzed across 5 independent experiments: a. n = 1016 cells40, b. n = 148 cells44, d. n = 1938 cells, f. n = 779 cells40.
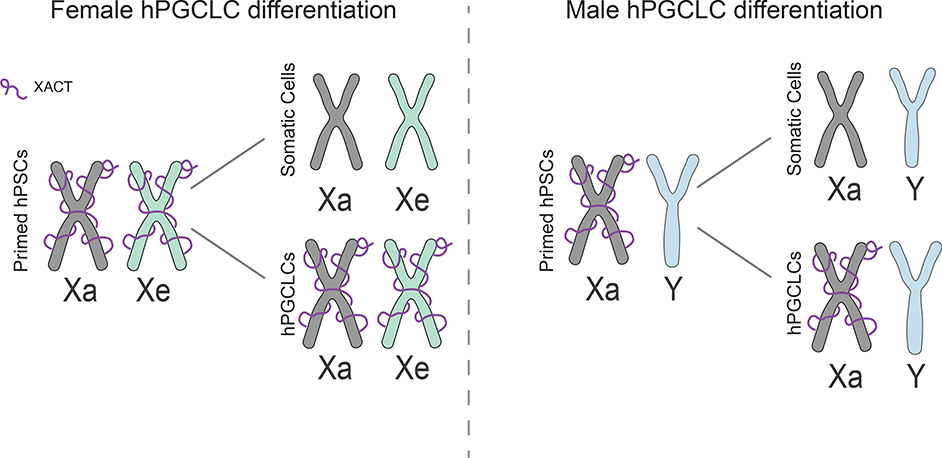
Extended Data Fig. 6. XACT marks male and female hPGCLCs in vitro.
Summary of the hPSC differentiation figure shown in Figure 2. Due to XCI erosion, XACT is expressed from the Xa and the eroded X-chromosome in primed, female human pluripotent stem cells. The Xe state is transmitted into differentiated cells and upon hPGCLC differentiation. Moreover, XACT is maintained in hPGCLCs, whereas somatic cells silence XACT. Consequently, female hPSC-derived PGCLCs carry two XACT clouds and male hPSC-derived PGCLCs one.
Supplementary Material
Acknowledgments
We would like to thank Jessica Scholes, Felicia Codrea, and Jeffery Calimlim for support with FACS, Jinghua Tang for banking and culturing of the UCLA hESC lines, and the microscopy cores at the UCLA Eli and Edythe Broad Center of Regenerative Medicine and Stem Cell Research Center (BSCRC) for help with imaging, the Technology Center for Genomics and Bioinformatics at the UCLA Johnson Comprehensive Cancer Center (JCCC) and the Next Generation Sequencing core at BSCRC for help with genomics approaches, and the Translational Pathology Core Laboratory for help with histology. T.C. was supported by Boehringer Ingelheim PhD Fellowship. This work is supported by funds from the NIH to ATC (R01HD079546). K.P. was supported by the BSCRC at UCLA, the David Geffen School of Medicine at UCLA, and the UCLA JCCC, the NIH (R01HD098387, P01GM099134), and a Faculty Scholar grant from the Howard Hughes Medical Institute. All human pre-implantation embryo and human embryo attachment culture studies were performed using funds from the UCLA Eli and Edythe Broad Center of Regenerative Medicine and Stem Cell Research Innovation Award. No NIH funds were used for research with human pre-implantation embryos. Human fetal tissue research is supported by a grant to Ian Glass at the University of Washington Birth Defects laboratory, 5R24HD000836-53. Human conceptus tissue requests can be made to bdrl@u.washington.edu.
Footnotes
Ethics declarations
Competing interests
The authors declare no competing interests.
Data availability
The accession number for the scRNA-seq data of prenatal tissues reported in this paper are GSE143380 (female cell data) and GSE143356 (male cell data). scRNA-seq data sets are also available for interactive exploration at http://germline.mcdb.ucla.edu.
Previously published RNA-seq data of male and female hPGCs and somatic cells25,52,53 and single-cell RNA-seq data from female germ cells30 and from female FCGs40 that were re-analyzed here are available under accession codes: GSE6339225, GSE6013852, GSE9312653, GSE7928030 and GSE8614640 respectively. All other data supporting the findings of this study are available from the corresponding author on reasonable request.
References
- 1.Deng X, Berletch JB, Nguyen DK & Disteche CM X chromosome regulation: diverse patterns in development, tissues and disease. Nat. Rev. Genet 15, 367–378 (2014). [DOI] [PMC free article] [PubMed] [Google Scholar]
- 2.Payer B & Lee JT X Chromosome Dosage Compensation: How Mammals Keep the Balance. Annu. Rev. Genet 42, 733–772 (2008). [DOI] [PubMed] [Google Scholar]
- 3.Wutz A Gene silencing in X-chromosome inactivation: advances in understanding facultative heterochromatin formation. Nat. Rev. Genet 12, 542–553 (2011). [DOI] [PubMed] [Google Scholar]
- 4.Gendrel A-V & Heard E Fifty years of X-inactivation research. Development 138, 5049–5055 (2011). [DOI] [PubMed] [Google Scholar]
- 5.Plath K, Mlynarczyk-Evans S, Nusinow DA & Panning B Xist RNA and the Mechanism of X Chromosome Inactivation. Annu. Rev. Genet 36, 233–278 (2002). [DOI] [PubMed] [Google Scholar]
- 6.Robert Finestra T & Gribnau J X chromosome inactivation: silencing, topology and reactivation. Curr. Opin. Cell Biol 46, 54–61 (2017). [DOI] [PubMed] [Google Scholar]
- 7.Brockdorff N Localized accumulation of Xist RNA in X chromosome inactivation. Open Biol. 9, 190213 (2020). [DOI] [PMC free article] [PubMed] [Google Scholar]
- 8.Sahakyan A, Plath K & Rougeulle C Regulation of X-chromosome dosage compensation in human: mechanisms and model systems. Philos. Trans. R. Soc. Lond. B. Biol. Sci 372, 20160363 (2017). [DOI] [PMC free article] [PubMed] [Google Scholar]
- 9.Chuva de Sousa Lopes SM et al. X Chromosome Activity in Mouse XX Primordial Germ Cells. PLOS Genet. 4, e30 (2008). [DOI] [PMC free article] [PubMed] [Google Scholar]
- 10.Sugimoto M & Abe K X chromosome reactivation initiates in nascent primordial germ cells in mice. PLoS Genet. 3, 1309–1317 (2007). [DOI] [PMC free article] [PubMed] [Google Scholar]
- 11.de Napoles M, Nesterova T & Brockdorff N Early Loss of Xist RNA Expression and Inactive X Chromosome Associated Chromatin Modification in Developing Primordial Germ Cells. PLoS One 2, e860 (2007). [DOI] [PMC free article] [PubMed] [Google Scholar]
- 12.Sangrithi MN et al. Non-Canonical and Sexually Dimorphic X Dosage Compensation States in the Mouse and Human Germline. Dev. Cell 40, 289–301.e3 (2017). [DOI] [PMC free article] [PubMed] [Google Scholar]
- 13.Nesterova TB et al. Characterization of the genomic Xist locus in rodents reveals conservation of overall gene structure and tandem repeats but rapid evolution of unique sequence. Genome Res. 11, 833–849 (2001). [DOI] [PMC free article] [PubMed] [Google Scholar]
- 14.Petropoulos S et al. Single-Cell RNA-Seq Reveals Lineage and X Chromosome Dynamics in Human Preimplantation Embryos. Cell (2016). doi: 10.1016/j.cell.2016.03.023 [DOI] [PMC free article] [PubMed] [Google Scholar]
- 15.Okamoto I et al. Eutherian mammals use diverse strategies to initiate X-chromosome inactivation during development. Nature 472, 370–374 (2011). [DOI] [PubMed] [Google Scholar]
- 16.Moreira de Mello JC et al. Random X Inactivation and Extensive Mosaicism in Human Placenta Revealed by Analysis of Allele-Specific Gene Expression along the X Chromosome. PLoS One 5, e10947 (2010). [DOI] [PMC free article] [PubMed] [Google Scholar]
- 17.Vallot C et al. XACT Noncoding RNA Competes with XIST in the Control of X Chromosome Activity during Human Early Development. Cell Stem Cell 20, 102–111 (2017). [DOI] [PMC free article] [PubMed] [Google Scholar]
- 18.Vallot C et al. XACT, a long noncoding transcript coating the active X chromosome in human pluripotent cells. Nat. Genet 45, 239 (2013). [DOI] [PubMed] [Google Scholar]
- 19.Patrat C, Ouimette J-F & Rougeulle C X chromosome inactivation in human development. Development 147, dev183095 (2020). [DOI] [PubMed] [Google Scholar]
- 20.Moreira de Mello JC, Fernandes GR, Vibranovski MD & Pereira LV Early X chromosome inactivation during human preimplantation development revealed by single-cell RNA-sequencing. Sci. Rep 7, 10794 (2017). [DOI] [PMC free article] [PubMed] [Google Scholar]
- 21.Sousa EJ et al. Exit from Naive Pluripotency Induces a Transient X Chromosome Inactivation-like State in Males. Cell Stem Cell 22, 919–928.e6 (2018). [DOI] [PMC free article] [PubMed] [Google Scholar]
- 22.Sahakyan A et al. Human Naive Pluripotent Stem Cells Model X Chromosome Dampening and X Inactivation. Cell Stem Cell 20, 87–101 (2016). [DOI] [PMC free article] [PubMed] [Google Scholar]
- 23.Patel S et al. Human Embryonic Stem Cells Do Not Change Their X Inactivation Status during Differentiation. Cell Rep. 18, 54–67 (2016). [DOI] [PMC free article] [PubMed] [Google Scholar]
- 24.Tang WWC et al. A Unique Gene Regulatory Network Resets the Human Germline Epigenome for Development. Cell 161, 1453–1467 (2015). [DOI] [PMC free article] [PubMed] [Google Scholar]
- 25.Gkountela S et al. DNA demethylation dynamics in the human prenatal germline. Cell 161, 1425–1436 (2015). [DOI] [PMC free article] [PubMed] [Google Scholar]
- 26.Guo F et al. The transcriptome and DNA methylome landscapes of human primordial germ cells. Cell 161, 1437–1452 (2015). [DOI] [PubMed] [Google Scholar]
- 27.Anderson RA, Fulton N, Cowan G, Coutts S & Saunders PTK Conserved and divergent patterns of expression of DAZL, VASA and OCT4 in the germ cells of the human fetal ovary and testis. BMC Dev. Biol 7, 136 (2007). [DOI] [PMC free article] [PubMed] [Google Scholar]
- 28.Gkountela S et al. The ontogeny of cKIT+ human primordial germ cells proves to be a resource for human germ line reprogramming, imprint erasure and in vitro differentiation. Nat. Cell Biol 15, 113–122 (2012). [DOI] [PMC free article] [PubMed] [Google Scholar]
- 29.Perrett RM et al. The Early Human Germ Cell Lineage Does Not Express SOX2 During In Vivo Development or upon In Vitro Culture1. Biol. Reprod 78, 852–858 (2008). [DOI] [PubMed] [Google Scholar]
- 30.Vértesy Á et al. Parental haplotype-specific single-cell transcriptomics reveal incomplete epigenetic reprogramming in human female germ cells. Nat. Commun 9, 1873 (2018). [DOI] [PMC free article] [PubMed] [Google Scholar]
- 31.Plath K et al. Role of Histone H3 Lysine 27 Methylation in X Inactivation. Science (80-. ). 300, 131 LP–135 (2003). [DOI] [PubMed] [Google Scholar]
- 32.Silva J et al. Establishment of Histone H3 Methylation on the Inactive X Chromosome Requires Transient Recruitment of Eed-Enx1 Polycomb Group Complexes. Dev. Cell 4, 481–495 (2003). [DOI] [PubMed] [Google Scholar]
- 33.Chen D et al. The TFAP2C-Regulated OCT4 Naive Enhancer Is Involved in Human Germline Formation. Cell Rep. 25, 3591–3602.e5 (2018). [DOI] [PMC free article] [PubMed] [Google Scholar]
- 34.Kobayashi T & Surani MA On the origin of the human germline. Development 145, dev150433 (2018). [DOI] [PubMed] [Google Scholar]
- 35.Sasaki K et al. Robust In Vitro Induction of Human Germ Cell Fate from Pluripotent Stem Cells. Cell Stem Cell 17, 178–194 (2015). [DOI] [PubMed] [Google Scholar]
- 36.Diaz Perez SV et al. Derivation of new human embryonic stem cell lines reveals rapid epigenetic progression in vitro that can be prevented by chemical modification of chromatin. Hum. Mol. Genet 21, 751–764 (2011). [DOI] [PMC free article] [PubMed] [Google Scholar]
- 37.Pandolfi EC et al. Generation of three human induced pluripotent stem cell sublines (MZT04D, MZT04J, MZT04C) for reproductive science research. Stem Cell Res. 40, 101576 (2019). [DOI] [PubMed] [Google Scholar]
- 38.Deglincerti A et al. Self-organization of the in vitro attached human embryo. Nature 533, 251 (2016). [DOI] [PubMed] [Google Scholar]
- 39.Shahbazi MN et al. Self-organization of the human embryo in the absence of maternal tissues. Nat. Cell Biol. 18, 700–708 (2016). [DOI] [PMC free article] [PubMed] [Google Scholar]
- 40.Li L et al. Single-Cell RNA-Seq Analysis Maps Development of Human Germline Cells and Gonadal Niche Interactions. Cell Stem Cell 1–16 (2017). doi: 10.1016/j.stem.2017.03.007 [DOI] [PubMed] [Google Scholar]
- 41.Wolf FA et al. PAGA: graph abstraction reconciles clustering with trajectory inference through a topology preserving map of single cells. Genome Biol. 20, 59 (2019). [DOI] [PMC free article] [PubMed] [Google Scholar]
- 42.Anderson EL et al. Stra8 and its inducer, retinoic acid, regulate meiotic initiation in both spermatogenesis and oogenesis in mice. Proc. Natl. Acad. Sci. U. S. A 105, 14976–80 (2008). [DOI] [PMC free article] [PubMed] [Google Scholar]
- 43.Törmälä RM et al. Zona pellucida components are present in human fetal ovary before follicle formation. Mol. Cell. Endocrinol 289, 10–15 (2008). [DOI] [PubMed] [Google Scholar]
- 44.Zhang Y et al. Transcriptome Landscape of Human Folliculogenesis Reveals Oocyte and Granulosa Cell Interactions. Mol. Cell 72, 1021–1034.e4 (2018). [DOI] [PubMed] [Google Scholar]
- 45.Casanova M et al. A primate-specific retroviral enhancer wires the XACT lncRNA into the core pluripotency network in humans. Nat. Commun 10, 5652 (2019). [DOI] [PMC free article] [PubMed] [Google Scholar]
- 46.Larsson AJM, Coucoravas C, Sandberg R & Reinius B X-chromosome upregulation is driven by increased burst frequency. Nat. Struct. Mol. Biol 26, 963–969 (2019). [DOI] [PubMed] [Google Scholar]
- 47.Deng X et al. Evidence for compensatory upregulation of expressed X-linked genes in mammals, Caenorhabditis elegans and Drosophila melanogaster. Nat. Genet 43, 1179–1185 (2011). [DOI] [PMC free article] [PubMed] [Google Scholar]
- 48.Yamashiro C et al. Generation of human oogonia from induced pluripotent stem cells in vitro. Science (80-. ). 362, 356 LP–360 (2018). [DOI] [PubMed] [Google Scholar]
- 49.Folsom LJ & Fuqua JS Reproductive Issues in Women with Turner Syndrome. Endocrinol. Metab. Clin. North Am 44, 723–737 (2015). [DOI] [PMC free article] [PubMed] [Google Scholar]
- 50.Franik S et al. Klinefelter syndrome and fertility—Impact of X-chromosomal inheritance on spermatogenesis. Andrologia 50, 1–5 (2018). [DOI] [PubMed] [Google Scholar]
- 51.Reynaud K et al. Number of ovarian follicles in human fetuses with the 45,X karyotype. Fertil. Steril 81, 1112–1119 (2004). [DOI] [PubMed] [Google Scholar]
- 52.Irie N et al. SOX17 is a critical specifier of human primordial germ cell fate. Cell 160, 253–268 (2015). [DOI] [PMC free article] [PubMed] [Google Scholar]
- 53.Chen D et al. Germline competency of human embryonic stem cells depends on eomesodermin†. Biol. Reprod 97, 850–861 (2017). [DOI] [PMC free article] [PubMed] [Google Scholar]
- 54.Wolf FA, Angerer P & Theis FJ SCANPY: large-scale single-cell gene expression data analysis. Genome Biol. 19, 15 (2018). [DOI] [PMC free article] [PubMed] [Google Scholar]
- 55.Blondel VD, Guillaume J-L, Lambiotte R & Lefebvre E Fast unfolding of communities in large networks. J. Stat. Mech. Theory Exp 2008, P10008 (2008). [Google Scholar]
- 56.Solovei I Fluorescence in situ Hybridization (FISH) on Tissue Cryosections. Methods Mol. Biol 659, 71–82 (2010). [DOI] [PubMed] [Google Scholar]
- 57.Ramírez F et al. High-resolution TADs reveal DNA sequences underlying genome organization in flies. Nat. Commun 9, 189 (2018). [DOI] [PMC free article] [PubMed] [Google Scholar]
Associated Data
This section collects any data citations, data availability statements, or supplementary materials included in this article.
Supplementary Materials
Data Availability Statement
The accession number for the scRNA-seq data of prenatal tissues reported in this paper are GSE143380 (female cell data) and GSE143356 (male cell data). scRNA-seq data sets are also available for interactive exploration at http://germline.mcdb.ucla.edu.
Previously published RNA-seq data of male and female hPGCs and somatic cells25,52,53 and single-cell RNA-seq data from female germ cells30 and from female FCGs40 that were re-analyzed here are available under accession codes: GSE6339225, GSE6013852, GSE9312653, GSE7928030 and GSE8614640 respectively. All other data supporting the findings of this study are available from the corresponding author on reasonable request.


