

Abstract
Human mesenchymal stromal cells (hMSCs) hold great promise in the treatment of inflammatory and immune diseases, due to their immunomodulatory capacity. Their therapeutic activity is often assessed measuring levels of expression of immunomodulatory genes such as indoleamine 2,3-dioxygenase 1 (IDO1) and real-time RT-qPCR is most predominantly the method of choice due to its high sensitivity and relative simplicity. Currently, multiple strategies are explored to promote hMSC-mediated immunomodulation, overlooking the effects they pose in the expression of genes commonly used as internal calibrators in real-time RT-qPCR analyses. However, variations in their expression could introduce significant errors in the evaluation of the therapeutic potential of hMSCs. This work investigates, for the first time, how some of these strategies - 3D encapsulation, the mechanical properties of the 3D matrix and inflammatory licensing - influence the expression of common reference genes in hMSCs. Both 3D encapsulation and inflammatory licensing alter significantly the expression of β-actin (ACTB) and Ubiquitin C (UBC), respectively. Using them as normalization factors leads to an erroneous assessment of IDO1 mRNA levels, therefore resulting in over or underestimation of the therapeutic potential of hMSCs. In contrast, the range of mechanical properties of the matrix encapsulating the cells did not significantly affect the expression of any of the reference genes studied. Moreover, we identify RPS13 and RPL30 as reference genes of choice under these particular experimental conditions. These results demonstrate the vital importance of validating the expression of reference genes to correctly assess the therapeutic potential of hMSCs by real-time RT-qPCR.
Keywords: reference gene, real-time RT-qPCR, MSCs, immunomodulation, hydrogel
Graphical Abstract
Strategies employed to promote the immunomodulatory capacity of mesenchymal stromal cells (MSCs) alter the expression of calibrator reference genes, introducing significant errors in the assessment of the therapeutic potential of MSCs.
1. Introduction
Mesenchymal stromal cells (MSCs) are multipotent cells that hold great clinical promise. Owing to their ability to differentiate into various mesodermal cell lineages (osteogenic, chondrogenic and adipogenic) 1,2, they have been extensively explored for tissue regeneration applications 3–5. In addition, MSCs are also promising candidates for the treatment of inflammatory and immune disorders, since they regulate innate and adaptive immunity via direct cell-to cell contact, or by the production of soluble factors, such as indoleamine 2,3-dioxygenase (IDO), prostaglandin E2 (PGE2) and interleukin-6 (IL-6), that mediate a paracrine immunomodulatory effect 6–8.
The MSC secretome is highly dependent on the local microenvironment, since cells adopt an anti-inflammatory and immunoregulatory phenotype in the presence of inflammatory conditions 9. Therefore, MSC activation with inflammatory cytokines, also known as inflammatory licensing, has been explored to enhance their immunomodulatory effects and ultimately, therapeutic potential 10. Treatment with interferon γ (IFN-γ) or tumor necrosis factor α (TNF-α) 11,12 has been widely employed, and the combination of both cytokines has a synergistic effect 13. Three-dimensional (3D) culture has also been suggested as a strategy to increase the anti-inflammatory phenotype of MSCs 14–16, as the natural microenvironment of a tissue is more closely mimicked than in 2D culture 17. In this regard, the combination of 3D culture and sustained inflammatory licensing has been proven to synergistically enhance the immunomodulatory potential of MSCs 18. Furthermore, the mechanical properties of hydrogels in which MSCs are encapsulated regulate intracellular pathways 19–21 and such biophysical signaling has been reported as a tool to tune the inflammatory activation of MSCs to control the innate immune system 22.
The therapeutic potential of MSCs is usually assessed by exploring the expression of immunomodulatory genes such as IDO1 or prostaglandin-endoperoxide synthase 2 (PTGS2). Real-time, reverse transcription, quantitative polymerase chain reaction (RT-qPCR) is widely employed for mRNA detection and quantitative gene expression analysis, because of its high sensitivity and specificity 23. However, variations in the amount of starting material, RNA recovery and integrity, efficiency of cDNA synthesis or reverse transcription may lead to inaccurate results 24. To minimize the impact of these possible errors, target gene expression is normalized to that of so-called reference genes, under the assumption that the latter are constitutively expressed 25,26. However, multiple studies highlight the variability in the expression of many traditionally used reference genes under several experimental conditions, which in the particular case of MSCs include treatment with growth factors such as vascular endothelial growth factor (VEGF) 27, culture under differentiation conditions 28 or obtaining cells from different species 29,30 or tissues 27,31,32. Such variability can lead to inaccurate results in real-time RT-qPCR analyses and flawed conclusions 33. In 2009, the Minimum Information for Publication of Quantitative Real-Time PCR Experiments (MIQE) guidelines were published, which advise to validate reference genes to each experimental set-up in order to produce reliable real-time RT-qPCR data 34. Along with these guidelines, multiple software tools have been developed to analyze the stability of candidate reference genes in different experimental conditions 35–37.
In the present study, our aim was to determine if inflammatory licensing of MSCs together with 3D culture in collagen-alginate hydrogels interfered in the stability of 10 widely employed reference genes (HMBS, UBC, GAPDH, OAZ1, RPL27, RPL30, RPS13, TBP, MAPK1 and ACTB). Moreover, the influence of the mechanical properties of the hydrogel was also explored by tuning the viscoelasticity and stiffness of the gels. This stability assessment was performed by means of BestKeeper, NormFinder and geNorm algorithms. The expression of the target gene IDO1 was normalized to the most dysregulated reference genes to detect possible misleading results due to incorrect normalizations, and the expression of these dysregulated housekeeping genes was further analyzed to evaluate the actual impact of cytokine stimulation, 3D encapsulation and mechanical properties.
2. Methods
2.1. Primary cell isolation and culture
Primary human MSCs (hMSCs) were obtained from fresh bone marrow (Lonza). Cells were isolated by a density gradient employing Lymphoprep (StemCell Technologies) followed by adherent culture to tissue culture plastic. After 2 passages, cells were cryopreserved in complete media and 7.5 % dimethyl sulfoxide (DMSO) (Thermo). Statistical analyses in this study reflect 3 independent experimental replicates with cells obtained from a single donor.
For hMSCs culture, minimum essential medium α (α-MEM) (no nucleosides, +GlutaMax, Gibco) was supplemented with 20 % heat-inactivated fetal bovine serum (FBS) and 1 % penicillin/streptomycin (P/S) (Thermo). Cells were grown at 37 °C in a 5 % CO2 / 95 % air atmosphere and passaged at 70 - 90 % confluence. Passage 2 - 4 hMSCs were employed for the experiments included in this paper.
2.2. hMSCs inflammatory licensing and experimental conditions
Control (unstimulated) hMSCs were cultured in α-MEM (20% heat-inactivated FBS, 1 % P/S). Cells were detached from the culture flaks and either encapsulated in collagen-alginate artificial extracellular matrix (aECM) hydrogels (3D), as described below, or seeded on tissue culture plates (TCP) at a density of 2.5 × 10⁵ cells per well (2D), and maintained in culture for 3 days in α-MEM (10% heat-inactivated FBS, 1 % P/S).
Stimulated hMSCs were licensed overnight by supplementing α-MEM (20% heat-inactivated FBS, 1 % P/S) with IFN-γ (20 ng mL−1) and TNF-α (10 ng mL−1). After 12 - 16 h, cells were retrieved from the culture flasks and either encapsulated in aECM hydrogels (3D) or seeded on TCP at a density of 2.5 × 10⁵ cells per well (2D), and maintained in culture for 3 days in α-MEM (10% heat-inactivated FBS, 1 % P/S).
2.3. hMSCs encapsulation in aECM hydrogels
aECM fabrication was performed as previously described 38. In brief, a collagen stock solution (Rat tail telo-collagen, Type I 8–11 mg mL−1, Corning) was incorporated in a buffer consisting of Hanks’ balanced salt solution (HBSS) (without calcium and magnesium, with phenol red, Sigma-Aldrich), supplemented with N-2-hydroxyethylpiperazine- N-2-ethane sulfonic acid (HEPES) (Gibco) (20mM final concentration). 1M NaOH (~ 1 % final concentration) was incorporated to achieve a pH of 5 – 6.5. The same buffer (HBSS, 20 mM HEPES) was employed to prepare ultra-pure very low viscosity sodium alginates (UP-VLVG) solutions at a 5 % concentration. pH was adjusted to 7 with 1M NaOH. In the case of viscoelastic hydrogels, unmodified alginates were used, whereas for elastic gels a mixture of unmodified and norborene and tetrazine modified alginates (Alg-Nb, Alg-Tz) were employed. The latter were modified as described in 39. Finally, a CaCO3 slurry (100 mg mL−1) was prepared by suspending precipitated calcium carbonate nanoparticles (nano-PCC, Multifex-MM, Specialty Minerals) in water for injection (Gibco). The resulting suspension was ultra-sonicated (70 % amplitude, 15 s) immediately prior to gel manufacture. Finally, cells were retrieved from culture and suspended at 40 x 106 cells mL−1 in the buffered salt solution (HBSS, 20 mM HEPES).
The process of hydrogel fabrication was carried out on ice and all the components were continuously mixed with micro-stir bars. As a first step, the calcium slurry was added to the collagen solution. Next, the appropriate volume of stock cell solution to obtain a final concentration of 2 × 10⁶ cells mL−1 was included. Subsequently, alginates were incorporated into the mixture. In the case of viscoelastic hydrogels, the unmodified alginate solution was added, whereas for elastic hydrogels, Alg-Nb was included too (Alg-Tz was reserved to be added as a final step). Next, freshly dissolved glucono-delta-lactone (GDL) (EMD Millipore. 0.4 g mLȒ1 in HBSS/HEPES) was incorporated to cause the rupture of the nanoparticles and release of calcium for gelation purposes. For the elastic gels, the reserved amount of Alg-Tz was incorporated as a final step. Final concentrations of each component in the hydrogels are detailed in Table 1.
Table 1. Formulation of the different types of aECM hydrogels.
aECM, artificial extracellular matrix. Nb, norborene. Tz, tetrazine. VLVG, very low viscosity. GDL, glucono-delta-lactone.
| VLVG alginate (% w/v) |
Nb-alginate (% w/v) |
Tz-alginate (% w/v) |
Total alginate (% w/v) |
Collagen (mg/mL) |
CaCO3 (% w/v) |
GDL (mM) |
G’ (Pa)* |
G” (Pa)* |
|
|---|---|---|---|---|---|---|---|---|---|
| Viscoelastic soft | 1.5 | 0 | 0 | 1.5 | 4 | 0.1 | 40 | 250 | 32 |
| Viscoelastic stiff | 1.5 | 0 | 0 | 1.5 | 4 | 0.3 | 120 | 2500 | 230 |
| Elastic soft | 0.5 | 0.5 | 0.5 | 1.5 | 4 | 0.1 | 40 | 250 | 18 |
| Elastic stiff | 0.5 | 0.5 | 0.5 | 1.5 | 4 | 0.3 | 120 | 2500 | 90 |
from 38.
Hydrogel solutions were quickly transferred to non-tissue culture treated 12 well plates and incubated for 1 h at 37 °C for initial gelation. Once gelation had occurred, hydrogels were covered with 1 mL of buffered salt solution (HBSS, 20 mM HEPES) for equilibration, and incubated for an additional 1 h at 37 °C. The buffer was then replaced by fresh culture media (α-MEM 10 % heat-inactivated FBS, 1 % P/S) and gels were cultured in a 5 % CO2 atmosphere at 37 °C for 3 days.
2.4. Compliance with Minimum Information for real-time RT-qPCR Experiments (MIQE) guidelines
All gene expression analyses in this work adhered to the MIQE guidelines 34, which promote transparency and ensure result reliability. The MIQE checklist is detailed in Table S1. Experimental procedures were carried out in the investigators’ laboratory, with the exception of the RNA quality assessment, which was performed with Agilent TapeStation 4200 at the Bauer Core (Harvard University).
2.5. RNA extraction, RNA quality assessment and cDNA synthesis
After 3 days of culture, cells were retrieved for RNA extraction. For encapsulated hMSCs, α-MEM was replaced by 500 μL of a solution containing 34 U mL−1 alginate lyase (Sigma-Aldrich) and 300 U mL−1 collagenase type I (Sigma-Aldrich) and incubated for 40 minutes at 37 °C, when the remaining hydrogel was triturated with a pipet until total fragmentation. TCP seeded hMSCs were treated with Accutase (Thermo) for 15 min at 37 °C and the total content of each well was transferred to a RNA-se free low binding eppendorf tube and centrifuged at 400 g for 5 min at 4 °C. The supernatant was discarded and a set of 3 washes was performed with cold wash buffer (Dulbecco’s phosphate-buffered saline (DPBS) without Ca/Mg, 2mM ethylenediaminetetraacetic acid (EDTA), 0.5% bovine serum albumin (BSA), followed by centrifugation to obtain a cell pellet.
For RNA isolation and purification, PureLink RNA Micro Kit (Cat. 12183-016, Invitrogen) was employed following the manufacturer’s indications. Cell pellets were lysed in 300 μl lysis buffer provided in the kit, previously supplemented with 1 % β-mercaptoethanol (M6250, Sigma). DNAse treatment was carried out on-column by means of Purelink DNA-se set (12185010, Invitrogen). RNA was eluted in 15 μl nuclease-free water. Samples were stored at − 80 °C and used within a month.
For preliminary RNA yield and quality assessment, NanoDrop spectrophotometer was employed. RNA concentrations and A260/280 and A260/230 ratios are shown in supplementary Table S2. RNA integrity was further analyzed in Agilent 4200 TapeStation (Agilent Genomics). In brief, samples were diluted to a range of 30-500 ng μl−1. 1 μl of the resulting dilution was incorporated in 5 μl RNA Screen Tape Sample Buffer (5067-5577, Agilent Genomics) and denatured for 3 min at 72 °C. After cooling for 2 min on ice, samples were run in RNA Screen Tape (5067-5576, Agilent Genomics). 28S/18S ratios and RNA integrity number (RIN) scores are reported in supplementary Table S2.
For cDNA synthesis, RNA was defrosted on ice, and immediately reverse-transcribed by means of iScript Advanced Reverse Transcription Supermix for real-time RT-qPCR (172-5038 Bio-Rad). Reverse transcription (20 μl volume) was performed according to the following steps: 46 °C for 20 min, 95 °C for 1 min, cool down to 4 °C. cDNA was stored at − 20 °C until real-time RT-qPCR analyses.
2.6. Primer design
Primers sequences for reference genes employed in this study are detailed in supplementary Table S3. We utilized the Primer Basic Local Alignment Search Tool (Primer BLAST) to design primer sequences that met the following criteria: amplicon size 75-200 bp, GC content 50-65%, ≤3 G or C repetitions, ≥4 base repetitions, melting temperature (Tm) 55-65°C. When gene targets had several splicing variants (including predicted variants), primer pairs were designed to amplify all at the same product length. Each primer pair was verified with Blast Tool (NCBI) to confirm its specificity for the desired target. Primers were synthetized and purchased from Sigma and purified by desalting. To detect IDO1, we used qHsaCED0044371 primer pair from BioRad.
2.7. Real-time RT-qPCR analyses
For each sample reaction, 10 ng of cDNA were mixed with 2 × AdvancedSSO SYBR Green Supermix (172-5274, Bio-Rad) and 0.5 μM of primers to a total volume of 20 μl. Reactions were loaded in duplicate on low profile, unskirted, clear 96-well plates (MLL9601, Bio-Rad) and run on a CFX96 Touch real-time RT-qPCR detection system (BioRad) according to the following protocol:2 min at 50°C, 2 min at 95°C, (15 sec at 95°C and 1 min at 60°C) x 40 cycles. Assessment of each gene was carried out in the same run for the totality of the samples to avoid inter-run variability. Moreover, a melt curve analysis was performed to confirm the single-product amplification. No amplification was detected in non-template (NTC) and non-reverse transcription (NRT) controls. Cq values were determined with the Single Threshold mode in the CFX Manager software (BioRad). To determine primer efficiency (E), the slope of a linear regression of the Cq values obtained from a dilution series of the starting cDNA was employed and applied in the following equation: .
2.8. Candidate reference gene stability assessment
The BestKeeper (BK) algorithm provides descriptive statistics of Cq values. By means of the BK Excel tool, a pair-wise correlation of raw Cq values for each sample was performed, obtaining standard deviation (SD) and coefficient of variance (CV) values. The most stable reference genes are those with the lowest SD and CV. The latter was calculated as the percentage of the Cq SD to the Cq mean. For data normalization, the algorithm provides the BK index: the geometric mean of the Cq values of all candidate reference genes that presented a SD < 1 35.
NormFinder (NF) is an analysis of variance (ANOVA)-based model that provides each candidate reference gene with a stability value, considering both, intra and intergroup variation, and ranks them based on this parameter 36. For this analysis, Cq values were transformed to relative quantities by means of the following formula: E (lowest Cq - Cq), which considers E and uses the lowest Cq as a calibrator. The resulting relative quantities were employed as input data in NF to calculate stability values for the 10 candidate reference genes under analysis. The lowest stability value represents the lowest variation, and therefore, the best stability. Moreover, the software also provides the best combination of two reference genes for data normalization.
The geNorm (GN) algorithm is based on the principle that the expression ratio of two ideal reference genes is identical in all samples, regardless of the experimental condition 37. Therefore, differences on ratios of two housekeeping genes means that one, or both, are not constantly expressed. For analysis of candidate reference genes with GN, the qbase+ software was employed. Each candidate reference gene was scored with the stability value M, which is based on the average pairwise variation of a particular gene with all other control genes. The lower the M value, the higher the reference gene stability. The software also provided the combination of the two housekeeping genes with the most stable expression for data normalization purposes. Moreover, GN also generates a V value, which refers to the suitability of employing a particular number of reference genes in a study.
2.9. Relative gene expression analyses
The Livak method 40 was performed to calculate relative gene expression. As calibrator, either the BK index or the geometric mean of Cq values of two reference genes calculated by NF or GN algorithms was employed. Error was propagated by means of the formula:
2.10. Statistical analysis of relative gene expression data
For statistical analyses, ΔΔCq values were employed to determine differences among the different candidate reference genes and ΔCq data for the rest of studies. The normal distribution of the data was confirmed by the Shapiro-Wilk test. To detect statistically significant differences between two groups, a two-tailed t-test was performed. For multiple comparisons, one-way ANOVA was employed. In this case, the Levene test was used to determine the homogeneity of variances. If homogeneous, the Bonferroni post-hoc was applied and if non-homogeneous, the Tamhane test was selected. p values < 0.05 were considered significant. All statistical computations were performed with SPSS 23 (IBM SPSS, Chicago, IL).
3. Results
3.1. RNA quality and expression levels of candidate reference genes
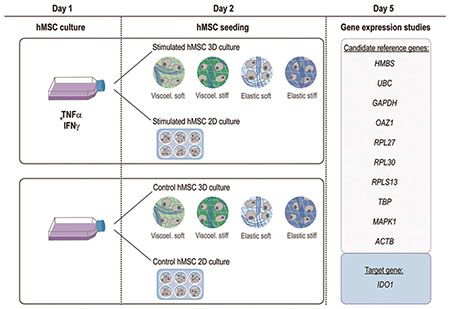
Primary hMSCs were isolated from fresh bone marrow of human donors by means of a density gradient. In order to study the influence of hMSCs licensing and encapsulation on the expression of candidate reference genes, non-stimulated control hMSCs or overnight IFN-γ / TNF-α stimulated hMSCs were used as starting materials, and either seeded in TCP (2D) or encapsulated in collagen-alginate artificial extracellular matrix (aECM) hydrogels (3D) (Fig. 1A). Furthermore, to investigate the effect of the mechanical properties (viscoelasticity and stiffness) of the local microenvironment on gene expression, hMSCs were encapsulated in four different types of aECM hydrogels: viscoelastic soft, viscoelastic stiff, elastic soft and elastic stiff. Viscoelasticity and stiffness were tuned by varying the mode and magnitude of alginate crosslinking, as indicated in Fig. 1B and C. Viscoelastic aECM hydrogels present a rapid stress-relaxation behavior as a result of the reversible ionic crosslinks between alginate and calcium. Reinforcement of these ionic crosslinks by permanent covalent crosslinking imparts more elastic properties to the hydrogels. In this case, we incorporated tetrazine (Tz) and norborene (Nb) groups to the alginate chains, which undergo bio-orthogonal inverse electron demand Diels-Alder reactions and “click” together the existing ionic crosslinks 38,39. The sequential ionic and covalent crosslinking used to fabricate the aECM hydrogels yields tunable viscoelasticity, without significantly affecting the modulus. This is because the click groups do not introduce a higher density of crosslinks but rather reinforce the existing ionic crosslinks. Formulations of aECM hydrogels are detailed in Table 1. Full characterization of the hydrogel system has been previously reported in 38. Gene expression was assessed by real-time RT-qPCR 3 days after hMSCs TCP seeding or encapsulation. A schematic representation of the experimental design is shown in Fig. 1D. To ensure reproducibility and reliability of the results, all experiments were performed in strict compliance with MIQE guidelines 34 (see checklist provided in supplementary Table S1).
Fig. 1. hMSC encapsulation in aECM hydrogels.
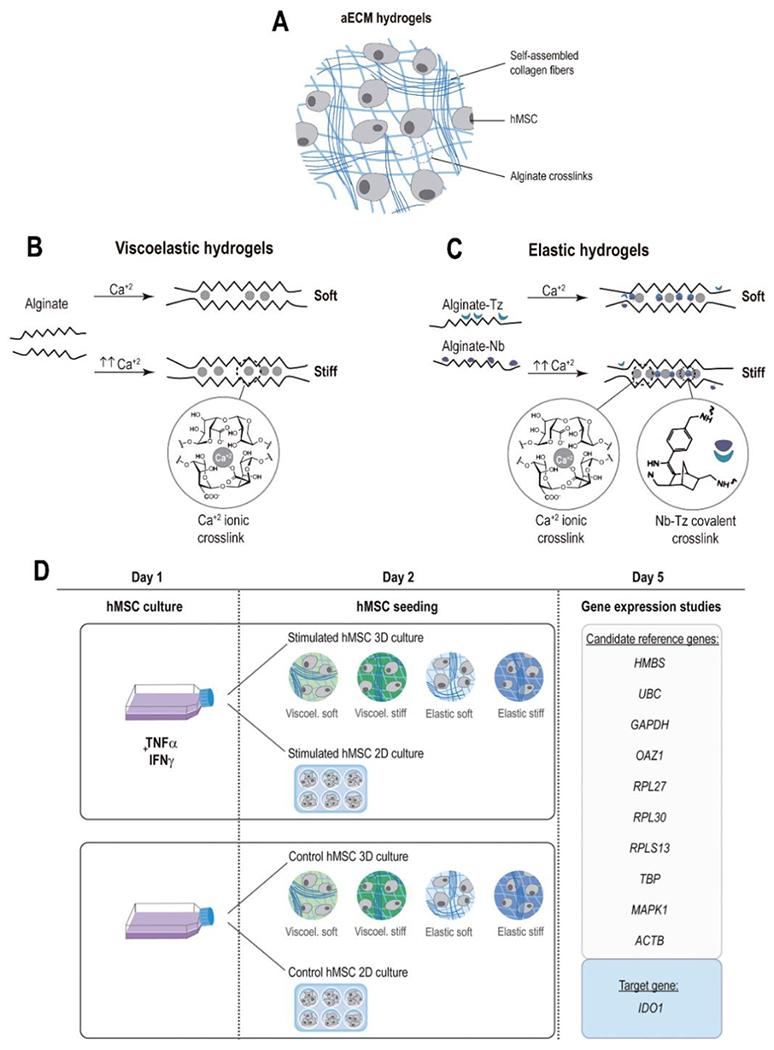
(A) Schematics of the structure and major components of aECM hydrogels. (B) In viscoelastic hydrogels, alginates are ionically crosslinked with calcium, whereas in elastic hydrogels (C) the ionic crosslinking is combined with covalent crosslinking between Norborene and Tetrazine groups. (D) Schematic representation of the experimental procedure. Human primary mesenchymal stromal cells (hMSCs) were stimulated overnight with IFN-γ and TNF-α. The following day, hMSCs were detached and encapsulated in four hydrogels with different mechanical properties (3D) or seeded in tissue culture plates (2D). The same procedure was followed with unstimulated control hMSCs. After 3 days of culture, RNA was extracted from the cells and real time RT-qPCR analysis of 10 different reference genes and the target gene IDO1 was performed. IFN-γ, interferon γ. TNF-α, tumor necrosis factor α.
The samples included in the study met RNA quality criteria. A detailed list of RNA amount, quality and integrity (RIN values, 28S/18S, A260/280 and A260/230 ratios and RNA concentrations) is displayed in supplementary Table S2. Our selection of candidate reference genes is shown in Table 2. We included ten of the most frequently used housekeeping genes in real-time RT-qPCR normalization 41 taking special care to include candidates with distinct cellular functions to minimize possible bias caused by co-regulated genes. As previously reported 42, ideal reference genes are expressed at relatively high and stable levels. Among our 10 candidate genes, the expression levels ranged between 18.65 ± 0.29 (GAPDH) to 27.88 ± 1.00 (UBC) as shown in supplementary Fig. S1.
Table 2.
Selection of candidate reference genes for stability assessment in primary human mesenchymal stromal cells.
| Protein function | Gene ID | Gene symbol | Gene name |
|---|---|---|---|
| Metabolic enzyme | 3145 | HMBS | Hydroxymethylbilane synthase |
| 7316 | UBC | Ubiquitin C | |
| 2597 | GAPDH | Glyceraldehyde-3 phosphate dehydroqenase | |
| 4946 | OAZ1 | Ornithine decarboxylase antizyme 1 | |
| Translation | 6155 | RPL27 | Ribosomal protein L27 |
| 852853 | RPL30 | Ribosomal protein L30 | |
| 6207 | RPLS13 | Ribosomal protein S13 | |
| Transcription | 6908 | TBP | TATA-box binding protein |
| Signalling | 5594 | MAPK1 | Mitogen-activated protein kinase 1 |
| Structural | 60 | ACTB | β-actin |
The primer pairs employed in the study were designed in house, and details are provided in supplementary Table S3. All the real-time RT-qPCR reactions produced single amplicons. The efficiency of each primer pair was determined by serial dilution of the cDNA samples. Primer pairs demonstrated E values between 1.93 – 2.05 with correlation coefficients > 0.99 (Table S3).
3.2. Stability assessment of the candidate reference genes
Candidate reference gene stability was first analyzed with BK (Fig. 2A). According to this algorithm, genes with Cq values showing a SD > 1 should be considered unacceptable for real-time RT-qPCR normalization and excluded from further analysis. Among our selection, all genes showed an acceptable range of variation (SD < 1). Therefore, the BK index, the normalization index the algorithm provides to normalize each sample, was calculated as the geometric mean of Cq values of all the 10 genes. GAPDH scored as the most stable reference gene, with the lowest SD and CV values (0.24 and 1.3, respectively), followed by OAZ1 (CV = 1.88) and TBP (CV = 2.26). On the contrary, ACTB (CV = 2.49), RPL30 (CV = 2.61), UBC (CV = 2.79) and MAPK1 (CV = 3.03) were the least stable candidate reference genes. SD and CV values for each gene are reported in supplementary Table S4.
Fig. 2. Reference gene stability determination upon 3D encapsulation in aECM hydrogels with differing mechanical properties and inflammatory licensing.
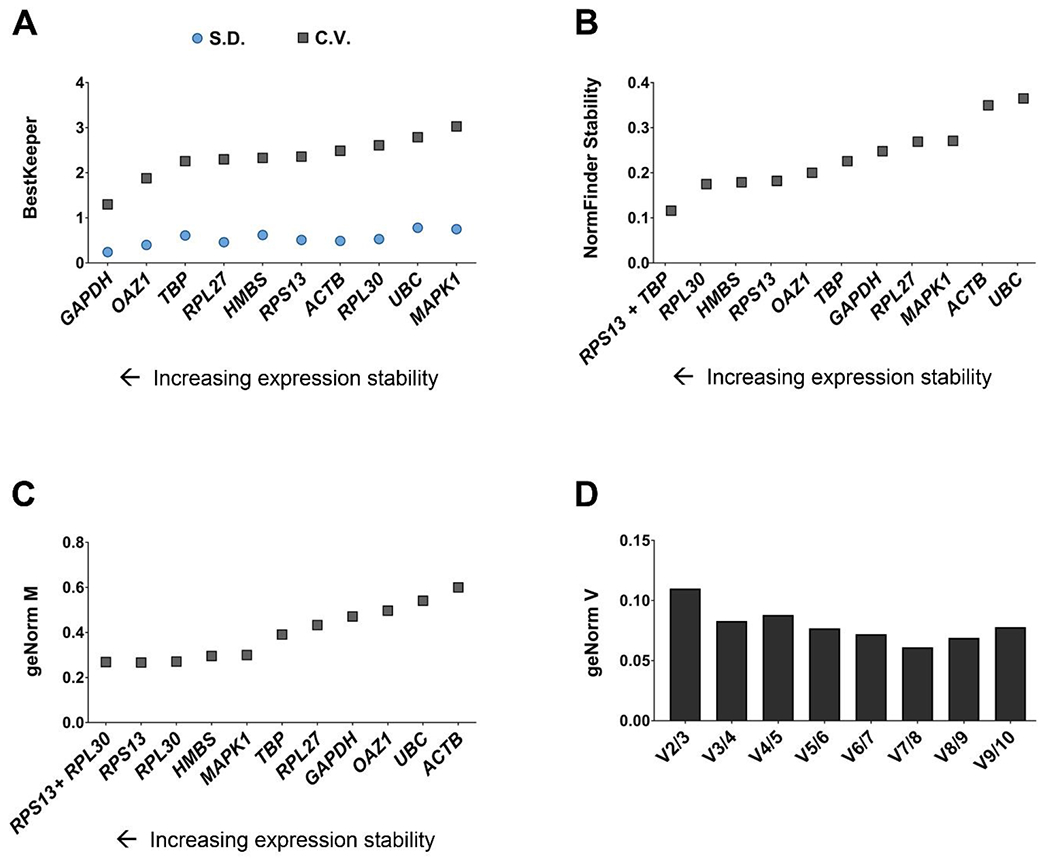
(A) C.V. and S.D. values determined by BestKeeper. (B) NormFinder stability values. (C) Average expression stability of reference targets determined by geNorm. (D) Determination of the optimal number of reference targets by geNorm. n = 3 samples per experimental condition.
NF analysis is an ANOVA-based model that assigns each candidate reference gene a stability value, considering both intra and intergroup variation. According to this parameter, the algorithm provides a precise ranking from the most stable (presenting the lowest stability value) to the most variable (with the highest stability value) candidate reference gene (Fig. 2B). Here, RPL30 was ranked as the most stable housekeeping gene, with a stability value of 0.175. In accordance with the results obtained with BK, ACTB and UBC were defined as the least stable (with stability values of 0.35 and 0.36, respectively). All stability values are detailed in supplementary Table S5. Moreover, the analysis also determines the combination of two reference genes that provides a lower stability value than any obtained for a single candidate. The combination of RPS13 and TBP provided a lower stability value (0.12) than RLP30 (0.17). Consequently, the optimal data normalization factor by this analysis would be calculated as the geometric mean of RPS13 and TBP.
GN analysis also provides a ranking of the most stable candidate reference genes, but in this case, it is based on the M values that the algorithm assigns to each. The lower the M value, the most stable expression. As shown in Fig. 2C, in the present study, the most stable housekeeping gene was RPS13 (M = 0.27), closely followed by RPL30 (M = 0.271). Similar to NF, GN also provides a combination of two reference genes to obtain the best normalization factor. However, here, the suggested combination of RPS13 and RPL30 scored an M value of 0.27, the same stability value as RPS13 alone. The least stable candidate reference genes, UBC (M = 0.54) and ACTB (M = 0.60) scored the highest M values, in agreement with the results obtained with BK and NF. M values of reference genes determined by geNorm are shown in supplementary Table S6. GN also calculates the pairwise variation (V), which provides information regarding the optimal number of reference genes to employ in a study. Starting with the combination of 2 genes, the algorithm provides V, a ratio based on the normalization factor values (normalization factor obtained with n reference genes / normalization factor obtained with n + 1 reference genes). If the obtained V factor is below the threshold of 0.15, n represents a sufficient number of housekeeping genes. In this case, the inclusion of 2 reference genes would be enough to obtain an optimal normalization factor (Fig. 2D).
In sum, both NF and GN ranked UBC and ACTB as the least stable candidate reference genes, and these also scored poor stability values in BK.
3.3. Effect of hMSCs encapsulation on the expression of candidate reference genes
Once we assessed the stability of all selected candidate reference genes, we investigated whether the use of those with the least stable expression as real-time RT-qPCR calibrators (namely, UBC and ACTB), would lead to misleading expression levels of a target gene, under our specific experimental conditions. IDO1 was chosen as target gene as it is an important marker of hMSC immunomodulatory potential, and widely employed in a wealth of studies regarding hMSC therapy in inflammatory and immune diseases 13,15.
Real-time RT-qPCR data was analyzed following the 2−ΔΔCT method, also known as the Livak method 40. First, the Cq of the target gene was normalized to that of the reference gene, obtaining the ΔCT. Next, the ΔCT of the sample group was normalized to the ΔCT of the calibrator group (ΔCT sample group - ΔCT calibrator group), obtaining the ΔΔCT, and finally, the normalized expression ratio was calculated (2−ΔΔCT).
First, to explore if hMSC encapsulation had an impact on the expression of the reference genes, we normalized IDO1 Cq values to the Cq of different reference candidates: the BK index, the combination of reference genes suggested by NF (RPS13 + TBP), and the combination of reference genes proposed by GN (RPS13 + RPL30), ACTB or UBC. Next, using IDO1 ΔCT values of 3D encapsulated hMSCs as the sample group, and IDO1 ΔCT values of 2D cultured hMSCs as the calibrator group, we calculated the normalized expression ratio. As expected, the levels of IDO1 expression did not change when GN, NF or BK were used to normalize the data. However, when normalizing the data with ACTB or UBC, statistically different results were obtained in the four hydrogel types (Fig. 3 A–D). In particular, we determined an overestimation of IDO1 expression when normalizing to ACTB, versus an underestimation of IDO1 expression when normalizing to UBC.
Fig. 3. Effect of 3D encapsulation on reference gene stability.
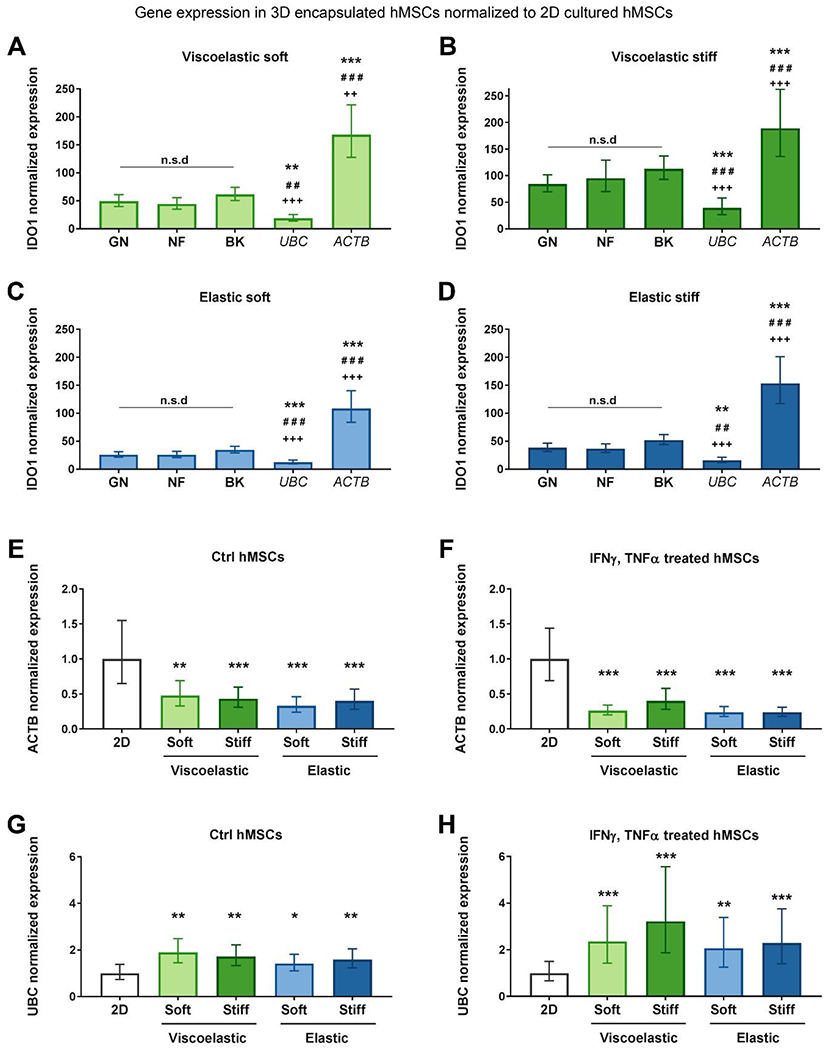
IDO1 expression in cells encapsulated in (A) soft viscoelastic, (B) stiff viscoelastic, (C) soft elastic, and (D) stiff elastic gels. IDO1 expression was normalized to 2D cultured cells, using the reference gene combinations provided by GN and NF, the BK index or the reference genes UBC or ACTB. Data is normalized to 1 as fold increase. Values represent mean ± S.E. (n = 3 samples per experimental condition). Statistical significance: one-way ANOVA with Bonferroni multiple comparisons test: *p < 0.05, **p < 0.01 and ***p < 0.001 compared to GN ##p < 0.01 and ###p < 0.001 compared to NF and ++p < 0.01 and +++p < 0.001 compared to BK. NF, NormFinder. GN, geNorm. BK, BestKeeper. Evaluation of ACTB expression in all encapsulated conditions: (E) unstimulated cells and (F) stimulated cells. Evaluation of UBC expression in all encapsulated conditions: (G) non-stimulated cells and (H) stimulated cells, all normalized to their 2D controls. The reference gene combination employed was that recommended by NormFinder. Data is normalized to 1 as fold increase. Values represent mean ± S.E. (n = 3 samples per experimental condition). Statistical significance: one-way ANOVA with Bonferroni multiple comparisons test: **p < 0.01 and ***p < 0.001 compared to 2D.
To confirm if ACTB and UBC expression varied depending on hMSC 2D or 3D culture, we used the most stable combination of reference genes, as proposed by NF, and normalized ACTB or UBC expression in 3D cultured cells (sample group) to their expression in 2D cultured cells (calibrator group). We performed the analysis in parallel with control and stimulated cells. Confirming our previous observations, ACTB was significantly downregulated in 3D encapsulated hMSCs (Fig. 3 E–F). UBC, on the contrary, was significantly upregulated in encapsulated hMSCs (Fig. 3 G–H). These results explained the over and underestimation of IDO1 observed when these genes were used as the reference gene (Fig. 3 A–D). Taken together, these results highlight the inadequacy of ACTB and UBC as reference genes when gene expression in 2D and 3D cultured cells is investigated.
3.4. Effect of the mechanical properties of the matrix on the expression of candidate reference genes
Next, the impact of the mechanical properties of the matrix in which hMSCs were encapsulated on reference gene expression was evaluated. The effect of both viscoelasticity and stiffness was analyzed. To determine the effect of viscoelasticity, we used IDO1 ΔCT values of hMSCs encapsulated in viscoelastic hydrogels as the sample group, and the IDO1 ΔCT values of hMSCs encapsulated in elastic hydrogels as the calibrator group (Fig. 4 A–B). To analyze the influence of matrix stiffness, we employed IDO1 ΔCT values of hMSCs encapsulated in soft hydrogels (sample group) and IDO1 ΔCT values of hMSCs encapsulated in stiff hydrogels (calibrator group) (Fig. 4 C–D). In both cases, data normalization with all the different reference genes led to the same IDO1 expression results, suggesting that their expression remained stable within the specific variations of the hydrogels’ mechanical properties tested here.
Fig. 4. Effect of the mechanical properties of aECM hydrogels on reference gene stability.
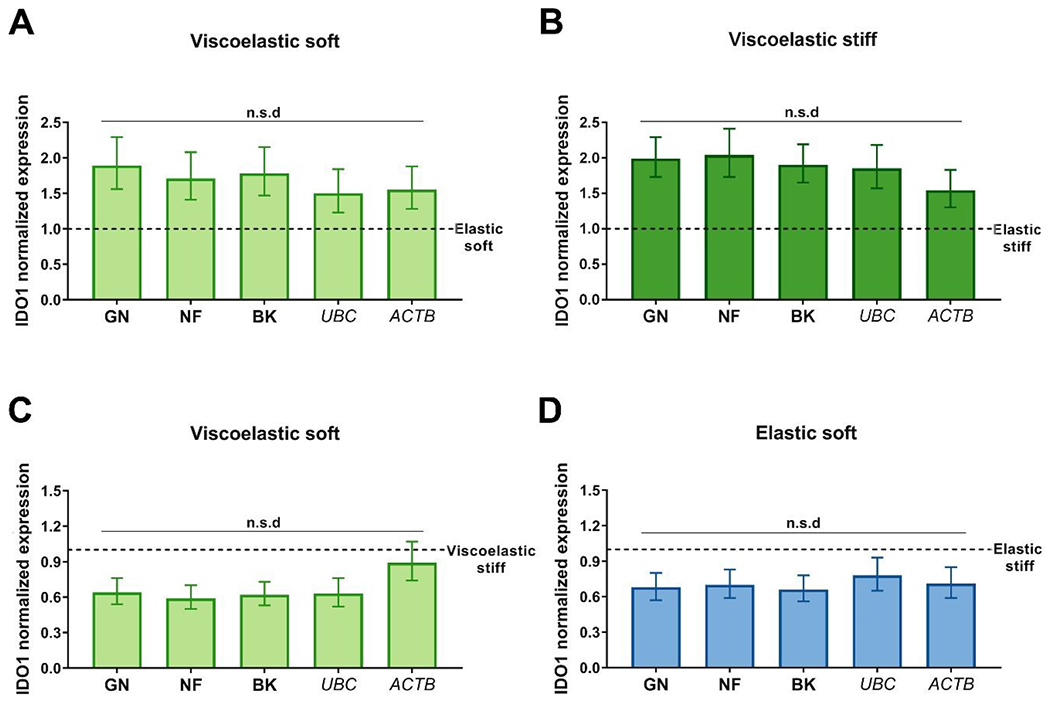
IDO1 expression in cells encapsulated in (A) soft viscoelastic, and (B) stiff viscoelastic gels normalized to their elastic controls using the reference gene combinations. IDO1 expression when normalizing soft viscoelastic (C) and soft elastic (D) gels to their stiff controls. Error bars mean ± S.E. (n = 3 samples per experimental condition). Statistical significance: one-way ANOVA. NF, NormFinder. GN, geNorm. BK, BestKeeper. n.s.d, no significant difference.
3.5. Effect of hMSCs IFN-γ / TNF-α stimulation on the expression of candidate reference genes
Finally, following the same analysis, we explored the influence of hMSC overnight stimulation with IFN-γ/TNF-α. In this case, we used the IDO1 ΔCT values of IFN-γ / TNF-α stimulated hMSCs as the sample group, and the IDO1 ΔCT values of control hMSCs as the calibrator group. Once again, data normalization with the reference genes proposed by the 3 different algorithms led to equal IDO1 expression values. On the contrary, statistically different results were obtained when normalizing the data with ACTB or UBC, for all the four hydrogel types (Fig. 5 A–D). As in the 2D versus 3D comparison, IDO1 was over and underestimated when normalized to ACTB and UBC, respectively. However, the differences in mRNA levels were less striking than in the previous comparison. To confirm the observations above, we normalized ACTB and UBC expression in stimulated hMSCs with NF. As shown in Fig. 5 E, ACTB expression was downregulated in IFN-γ and TNF-α stimulated hMSCs, leading to an overestimation of target gene expression if used as a reference gene under these experimental conditions (Fig. 5 A–D). On the other hand, UBC upregulation was observed (Fig. 5 F), explaining why when used as a reference gene, target gene expression resulted in an underestimation (Fig. 5 A–D).
Fig. 5. Effect of inflammatory licensing on reference gene stability.
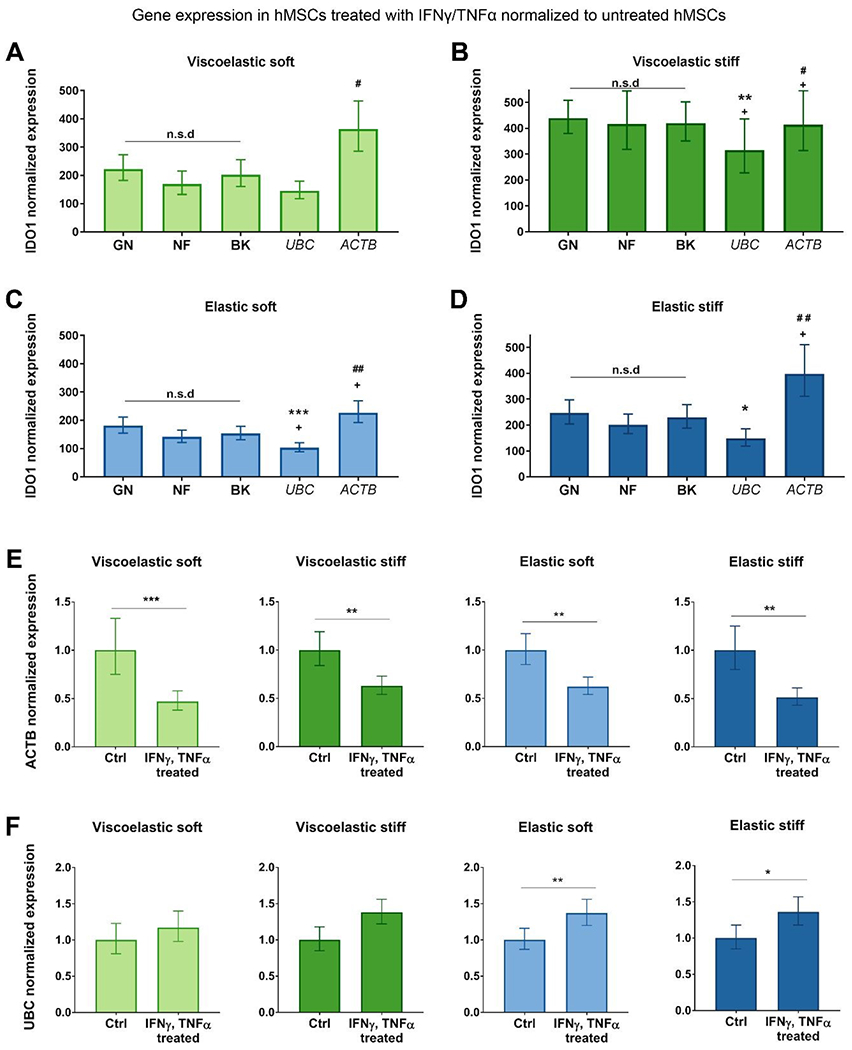
IDO1 expression in stimulated cells encapsulated in (A) soft viscoelastic, (B) stiff viscoelastic, (C) soft elastic, and (D) stiff viscoelastic gels. IDO1 expression was normalized to the non-stimulated controls using the reference gene combinations provided by GN and NF, the BK index or the reference genes UBC or ACTB. Data is normalized to 1 as fold increase. Values represent mean ± S.E. (n = 3 samples per experimental condition). Statistical significance: one-way ANOVA with Bonferroni multiple comparisons test: *p < 0.05, **p < 0.01 and ***p < 0.001 compared to GN #p < 0.05 and ##p < 0.01 compared to NF and +p < 0.05 compared to BK. NF, NormFinder. GN, geNorm. BK, BestKeeper. ACTB expression in stimulated cells in the four gel types (E), and UBC expression in stimulated cells in the gel types (F), all normalized to their non-stimulated controls. Data is normalized to 1 as fold increase. The reference gene combination employed was that recommended by NormFinder. Values represent mean ± S.E. (n = 3 samples per experimental condition). Statistical significance: Student’s t-test: *p < 0.05, **p < 0.01 and ***p < 0.001 compared to the non-stimulated control. Ctrl: control.
4. Discussion
The results of these studies demonstrate that experimental conditions intended to promote the immunomodulatory properties of hMSCs induce significant changes in the stability of commonly employed housekeeping genes. Here we explored the combination of both hMSC inflammatory licensing with IFN-γ and TNF-α, and encapsulation in four different types of alginate-collagen hydrogels with differing viscoelasticity and stiffness. To the best of our knowledge, this is the first study that evaluates reference gene stability in hMSCs across a pool of licensed or non-licensed control cells in either 2D or 3D culture in hydrogels with different mechanical properties. These studies are highly relevant considering the vast number of studies aiming to precondition hMSCs to enhance their anti-inflammatory potential.
The results obtained with BK, NF and GN algorithms revealed the ribosomal proteins RPS13 and RPL30 as two of the most stable reference genes. This matches the results obtained in a meta-analysis conducted by de Jonge et al41, where RPS13 and RPL30 ranked as the first and fourth reference genes, respectively, in terms of stability among multiple cell types and a multitude of experimental conditions. Indeed, in our study, GN proposed the combination of RPS13 and RPL30 as the most stable, whereas NF suggested combining RPS13 and TBP. Regarding the latter, TBP has been proposed as a stable housekeeping gene in previous studies evaluating MSC 3D culture in cancellous bone cube 43 and fibrinogen or fibrinogen-alginate scaffolds 44. In our case, TBP was ranked as the third most stable gene by BK, and was positioned in the middle by NF and GN. Despite not scoring as the most stable; it still presented adequate stability values. Importantly, one should consider, taking NF as an example, that stability values from the 1st to the 8th position only varied from 0.17 to 0.27 (TBP scored 0.23). On the contrary, the last two candidates, namely ACTB and UBC, presented stability values of 0.35 and 0.36, differing significantly from the rest of housekeeping genes.
BK and GN also ranked UBC and ACTB among the least stable candidates. Although ACTB has been reported to be among the 12 most widely used reference genes 41; in agreement with our results, its instability upon different experimental conditions has previously been demonstrated in multiple publications 28,43,45. The differences we detected within the rankings provided by BK, NF and GN were expected, since each one of these tools is based on a different algorithm. Indeed, discrepancies among them have been previously reported 45. However, we demonstrated that choosing either one of them for IDO1 normalization resulted in the same relative expression values (Fig. 3 A–D, Fig. 4 A–D, Fig. 5 A–D), supporting the significance of the results reported in this study.
The poor stability of ACTB and UBC led to misleading results when studying the expression of the target gene IDO1 in these experiments. We observed important differences in the expression of these two candidate reference genes when comparing 2D to 3D cultured hMSCs. Normalization to ACTB resulted in an overestimation of IDO1, whereas when employing UBC, IDO1 expression was underestimated. This was caused by a downregulation of ACTB and an upregulation of UBC in 3D cultured hMSCs, when compared to 2D cultured cells. These results are consistent with previous studies, where geNorm and NormFinder analyses identified ACTB among the three least stable reference genes in 3D cultivated bone marrow MSCs 43. In addition, Liu et al. ranked ACTB as the least stable candidate housekeeping gene in MSCs under dynamic hydrostatic pressure and concluded that ACTB is not a suitable internal control gene for mRNA assay in mechanobiology studies 46. While the rigidity of the microenvironment 20,21 and the matrix stress-relaxation 19 have been reported to regulate intracellular pathways, the expression of ACTB and UBC was not significantly altered in hMSCs encapsulated in aECM hydrogels with varying viscoelasticity and stiffness.
Significant differences were noted in ACTB and UBC expression when comparing IFN-γ / TNF-α licensed hMSCs to control, non-stimulated cells. ACTB expression was downregulated and UBC upregulated in IFN-γ / TNF-α stimulated hMSCs, in comparison to control, non-stimulated cells, although these effects was not as drastic as observed when comparing 3D versus 2D expression. In agreement with our results, a recent publication demonstrated the poor stability of some miRNA reference genes extensively employed to quantify the nucleic acid content of extracellular vesicles produced by MSCs, upon cell inflammatory licensing with IFN-γ 31. Together, these results indicate that the utilization of ACTB and UBC is not advisable in studies that explore the immunomodulatory potential of hMSCs in 3D culture or via inflammatory licensing.
5. Conclusion
This work demonstrates that some of the current strategies employed to promote MSC-mediated immunomodulation can alter the expression of common reference genes, introducing significant errors in the assessment of the therapeutic potential of these cells. Here, we determined that widely used reference genes including UBC and ACTB are significantly altered upon hMSC 3D encapsulation in collagen-alginate hydrogels, as well as upon inflammatory licensing with IFN-γ/TNF-α. Their use as housekeeping genes can lead to significant over and underestimation of target gene mRNA levels in real-time RT-qPCR studies, and therefore to an erroneous evaluation of the immunomodulatory capacity of MSCs. Moreover, under our particular experimental conditions, we identify the ribosomal proteins RPS13 and RPL30 as the most suitable reference genes. Together, these results highlight the importance of reference gene validation in studies employing pre-conditioning strategies to enhance the immunomodulatory potential of hMSCs.
Supplementary Material
Acknowledgements
Research reported in this publication was supported by the projects SAF2017-82292-R (MINECO/AEI/FEDER, UE), ICTS “NANBIOSIS” (Drug Formulation Unit, U10), the Basque Country Government (Grupos Consolidados, No ref: IT907-16), the National Institute of Dental & Craniofacial Research of the National Institutes of Health under Award Numbers R01DE013033 (DM), and K08DE025292 (KV) and the National Cancer Institute of the National Institutes of Health under Award Number R01CA223255. The content is solely the responsibility of the authors and does not necessarily represent the official views of the National Institutes of Health. A. Gonzalez-Pujana thanks the Basque Government (Department of Education, Universities and Research) for the PhD grant (PRE_2018_2_0133).
Footnotes
Conflicts of interest
There are no conflicts to declare.
References
- 1.Friedenstein AJ, Deriglasova UF, Kulagina NN, Panasuk AF, Rudakowa SF, Luria EA and Ruadkow IA, Exp. Hematol, 1974, 2, 83–92. [PubMed] [Google Scholar]
- 2.Phinney DG, Kopen G, Isaacson RL and Prockop DJ, J. Cell. Biochem, 1999, 72, 570–585. [PubMed] [Google Scholar]
- 3.Zhang Y, Chen M, Tian J, Gu P, Cao H, Fan X and Zhang W, Biomater. Sci, 2019, (DOI: 10.1039/c9bm00561g). [DOI] [PubMed] [Google Scholar]
- 4.Ribeiro VP, da Silva Morais A, Maia FR, Canadas RF, Costa JB, Oliveira AL, Oliveira JM and Reis RL, Acta Biomater., 2018, 72, 167–181 (DOI: 10.1016/j.actbio.2018.03.047). [DOI] [PubMed] [Google Scholar]
- 5.Jiang L, Su D, Ding S, Zhang Q, Li Z, Chen F, Ding W, Zhang S and Dong J, Adv. Funct. Mater, 2019, 0, 1901314 (DOI: 10.1002/adfm.201901314). [DOI] [Google Scholar]
- 6.Ferreira JR, Teixeira GQ, Santos SG, Barbosa MA, Almeida-Porada G and Goncalves RM, Front. Immunol, 2018, 9, 2837 (DOI: 10.3389/fimmu.2018.02837). [DOI] [PMC free article] [PubMed] [Google Scholar]
- 7.Gao F, Chiu SM, Motan DA, Zhang Z, Chen L, Ji HL, Tse HF, Fu QL and Lian Q, Cell. Death Dis, 2016, 7, e2062 (DOI: 10.1038/cddis.2015.327). [DOI] [PMC free article] [PubMed] [Google Scholar]
- 8.Gonzalez-Pujana A, Igartua M, Santos-Vizcaino E and Hernandez RM, Expert Opin. Drug Deliv, 2020, 17, 189–200 (DOI: 10.1080/17425247.2020.1714587). [DOI] [PubMed] [Google Scholar]
- 9.Bernardo ME and Fibbe WE, Cell. Stem Cell, 2013, 13, 392–402 (DOI: 10.1016/j.stem.2013.09.006). [DOI] [PubMed] [Google Scholar]
- 10.Shi Y, Su J, Roberts AI, Shou P, Rabson AB and Ren G, Trends Immunol., 2012, 33, 136–143 (DOI: 10.1016/j.it.2011.11.004). [DOI] [PMC free article] [PubMed] [Google Scholar]
- 11.Krampera M, Cosmi L, Angeli R, Pasini A, Liotta F, Andreini A, Santarlasci V, Mazzinghi B, Pizzolo G, Vinante F, Romagnani P, Maggi E, Romagnani S and Annunziato F, Stem Cells, 2006, 24, 386–398 (DOI: 10.1634/stemcells.2005-0008). [DOI] [PubMed] [Google Scholar]
- 12.Murphy N, Treacy O, Lynch K, Morcos M, Lohan P, Howard L, Fahy G, Griffin MD, Ryan AE and Ritter T, FASEB J., 2019, , fj201900047R (DOI: 10.1096/fj.201900047R). [DOI] [PubMed] [Google Scholar]
- 13.Jin P, Zhao Y, Liu H, Chen J, Ren J, Jin J, Bedognetti D, Liu S, Wang E, Marincola F and Stroncek D, Sci. Rep, 2016, 6, 26345 (DOI: 10.1038/srep26345). [DOI] [PMC free article] [PubMed] [Google Scholar]
- 14.Bartosh TJ, Ylostalo JH, Mohammadipoor A, Bazhanov N, Coble K, Claypool K, Lee RH, Choi H and Prockop DJ, Proc. Natl. Acad. Sci. U. S. A, 2010, 107, 13724–13729 (DOI: 10.1073/pnas.1008117107). [DOI] [PMC free article] [PubMed] [Google Scholar]
- 15.Leijs MJ, Villafuertes E, Haeck JC, Koevoet WJ, Fernandez-Gutierrez B, Hoogduijn MJ, Verhaar JA, Bernsen MR, van Buul GM and van Osch GJ, Eur. Cell. Mater, 2017, 33, 43–58 (DOI: 10.22203/eCM.v033a04). [DOI] [PubMed] [Google Scholar]
- 16.Goren A, Dahan N, Goren E, Baruch L and Machluf M, FASEB J., 2010, 24, 22–31 (DOI: 10.1096/fj.09-131888). [DOI] [PubMed] [Google Scholar]
- 17.Petrenko Y, Sykova E and Kubinova S, Stem Cell. Res. Ther, 2017, 8, 94-017-0558-6 (DOI: 10.1186/s13287-017-0558-6). [DOI] [PMC free article] [PubMed] [Google Scholar]
- 18.Gonzalez-Pujana A, Vining KH, Zhang DKY, Santos-Vizcaino E, Igartua M, Hernandez RM and Mooney DJ, Biomaterials, 2020, 257, 120266 (DOI:S0142-9612(20)30512-3 [pii]). [DOI] [PMC free article] [PubMed] [Google Scholar]
- 19.Chaudhuri O, Gu L, Klumpers D, Darnell M, Bencherif SA, Weaver JC, Huebsch N, Lee HP, Lippens E, Duda GN and Mooney DJ, Nat. Mater, 2016, 15, 326–334 (DOI: 10.1038/nmat4489). [DOI] [PMC free article] [PubMed] [Google Scholar]
- 20.Gonzalez-Pujana A, Rementeria A, Blanco FJ, Igartua M, Pedraz JL, Santos-Vizcaino E and Hernandez RM, Drug Deliv., 2017, 24, 1654–1666 (DOI: 10.1080/10717544.2017.1391894). [DOI] [PMC free article] [PubMed] [Google Scholar]
- 21.Huebsch N, Arany PR, Mao AS, Shvartsman D, AN OA, Bencherif SA, Rivera-Feliciano J and Mooney DJ, Nat. Mater, 2010, 9, 518–526 (DOI: 10.1038/nmat2732). [DOI] [PMC free article] [PubMed] [Google Scholar]
- 22.Wong SW, Lenzini S, Cooper MH, Mooney DJ and Shin JW, Sci. Adv, 2020, 6, eaaw0158 (DOI: 10.1126/sciadv.aaw0158). [DOI] [PMC free article] [PubMed] [Google Scholar]
- 23.VanGuilder HD, Vrana KE and Freeman WM, BioTechniques, 2008, 44, 619–626 (DOI: 10.2144/000112776). [DOI] [PubMed] [Google Scholar]
- 24.Chervoneva I, Li Y, Schulz S, Croker S, Wilson C, Waldman SA and Hyslop T, BMC Bioinformatics, 2010, 11, 253-2105-1-253 (DOI: 10.1186/1471-2105-11-253). [DOI] [PMC free article] [PubMed] [Google Scholar]
- 25.Nolan T, Hands RE and Bustin SA, Nat. Protoc, 2006, 1, 1559–1582 (DOI: 10.1038/nprot.2006.236). [DOI] [PubMed] [Google Scholar]
- 26.Kozera B and Rapacz M, J. Appl. Genet, 2013, 54, 391–406 (DOI: 10.1007/s13353-013-0173-x). [DOI] [PMC free article] [PubMed] [Google Scholar]
- 27.Tratwal J, Follin B, Ekblond A, Kastrup J and Haack-Sorensen M, BMC Mol. Biol, 2014, 15, 11-2199-15-11 (DOI: 10.1186/1471-2199-15-11). [DOI] [PMC free article] [PubMed] [Google Scholar]
- 28.Jacobi A, Rauh J, Bernstein P, Liebers C, Zou X and Stiehler M, Biotechnol. Prog, 2013, 29, 1034–1042 (DOI: 10.1002/btpr.1747). [DOI] [PubMed] [Google Scholar]
- 29.Schulze F, Malhan D, El Khassawna T, Heiss C, Seckinger A, Hose D and Rosen-Wolff A, BMC Genomics, 2017, 18, 975-017-4356-4 (DOI: 10.1186/s12864-017-4356-4). [DOI] [PMC free article] [PubMed] [Google Scholar]
- 30.Lee WJ, Jeon RH, Jang SJ, Park JS, Lee SC, Baregundi Subbarao R, Lee SL, Park BW, King WA and Rho GJ, Stem Cells Int., 2015, 2015, 235192 (DOI: 10.1155/2015/235192). [DOI] [PMC free article] [PubMed] [Google Scholar]
- 31.Ragni E, De Luca P, Perucca Orfei C, Colombini A, Vigano M, Lugano G, Bollati V and de Girolamo L, Cells, 2019, 8, 10.3390/cells8040369 (DOI: 10.3390/cells8040369). [DOI] [PMC free article] [PubMed] [Google Scholar]
- 32.Banfi F, Colombini A, Perucca Orfei C, Parazzi V and Ragni E, Stem Cell. Rev, 2018, 14, 837–846 (DOI: 10.1007/s12015-018-9822-0). [DOI] [PubMed] [Google Scholar]
- 33.Dheda K, Huggett JF, Chang JS, Kim LU, Bustin SA, Johnson MA, Rook GA and Zumla A, Anal. Biochem, 2005, 344, 141–143 (DOI: 10.1016/j.ab.2005.05.022). [DOI] [PubMed] [Google Scholar]
- 34.Bustin SA, Benes V, Garson JA, Hellemans J, Huggett J, Kubista M, Mueller R, Nolan T, Pfaffl MW, Shipley GL, Vandesompele J and Wittwer CT, Clin. Chem, 2009, 55, 611–622 (DOI: 10.1373/clinchem.2008.112797). [DOI] [PubMed] [Google Scholar]
- 35.Pfaffl MW, Tichopad A, Prgomet C and Neuvians TP, Biotechnol. Lett, 2004, 26, 509–515. [DOI] [PubMed] [Google Scholar]
- 36.Andersen CL, Jensen JL and Orntoft TF, Cancer Res, 2004, 64, 5245–5250 (DOI: 10.1158/0008-5472.CAN-04-0496). [DOI] [PubMed] [Google Scholar]
- 37.Vandesompele J, De Prefer K, Pattyn F, Poppe B, Van Roy N, De Paepe A and Speleman F, Genome Biol., 2002, 3, RESEARCH0034 (DOI: 10.1186/gb-2002-3-7-research0034). [DOI] [PMC free article] [PubMed] [Google Scholar]
- 38.Vining KH, Stafford A and Mooney DJ, Biomaterials, 2019, 188, 187–197 (DOI: 10.1016/j.biomaterials.2018.10.013). [DOI] [PMC free article] [PubMed] [Google Scholar]
- 39.Desai RM, Koshy ST, Hilderbrand SA, Mooney DJ and Joshi NS, Biomaterials, 2015, 50, 30–37 (DOI: 10.1016/j.biomaterials.2015.01.048). [DOI] [PubMed] [Google Scholar]
- 40.Livak KJ and Schmittgen TD, Methods, 2001, 25, 402–408 (DOI: 10.1006/meth.2001.1262). [DOI] [PubMed] [Google Scholar]
- 41.de Jonge HJ, Fehrmann RS, de Bont ES, Hofstra RM, Gerbens F, Kamps WA, de Vries EG, van der Zee AG, te Meerman GJ and ter Elst A, PLoS One, 2007, 2, e898 (DOI: 10.1371/journal.pone.0000898). [DOI] [PMC free article] [PubMed] [Google Scholar]
- 42.Huggett J, Dheda K, Bustin S and Zumla A, Genes Immun., 2005, 6, 279–284 (DOI: 10.1038/sj.gene.6364190). [DOI] [PubMed] [Google Scholar]
- 43.Rauh J, Jacobi A and Stiehler M, Tissue Eng. Part C. Methods, 2015, 21, 192–206 (DOI: 10.1089/ten.TEC.2014.0230). [DOI] [PMC free article] [PubMed] [Google Scholar]
- 44.Brinkhof B, Jia H, Zhang B, Cui Z, Ye H and Wang H, PLoS One, 2018, 13, e0209772 (DOI: 10.1371/journal.pone.0209772). [DOI] [PMC free article] [PubMed] [Google Scholar]
- 45.de Lázaro I and Kostarelos K, Scientific Reports, 2019, 9, 12520 (DOI: 10.1038/s41598-019-48970-z). [DOI] [PMC free article] [PubMed] [Google Scholar]
- 46.Liu J, Zou L, Wang J and Zhao Z, Stem Cells, 2009, 27, 2371–2372 (DOI: 10.1002/stem.160). [DOI] [PubMed] [Google Scholar]
Associated Data
This section collects any data citations, data availability statements, or supplementary materials included in this article.