Abstract
Background
The function of the peripheral vestibular system can nowadays be quantified. The video head impulse test (vHIT) and caloric irrigation are used for the semicircular canals, cervical vestibular evoked myogenic potentials (cVEMP) for the sacculus, and ocular vestibular evoked myogenic potentials (oVEMP) for the utriculus. Because there is no agreement on normal and pathologic values, we performed a worldwide survey.
Methods
A web-based standardized survey questionnaire was used to collect data on “reference values” and “cutoff” values. Thirty-eight centers from all continents (except Africa) replied.
Results
“Reference values”: vHIT: mean for the vestibulo-ocular reflex gain of the left horizontal canal 0.91 (range: 0.7–1.01) and of the left horizontal canal 0.92 (0.7–1.05); side difference 0.15 (0.25–0.3). Caloric irrigation: mean peak slow phase velocity of caloric-induced nystagmus for warm (44°C) water 18.65°/s (12–30°/s); cold (30°C) water 18.21°/s (10–25°/s). cVEMP: P13-N23 amplitude mean for the lower limit 28.67 μV (16–50 μV); upper limit 200 μV (50–350 μV). “Cutoff values”: vHIT: side difference 0.26 (0.1–0.4), bilateral vestibulopathy <0.61 (0.3–0.8); unilateral vestibulopathy (UVP) <0.68 (0.4–0.8). Caloric irrigation pathologic side difference mean 25.93% (17.7%–40%) or 12°/sec (5–30°/s); side difference UVP 26.73% (20%–40%) or 29.8°/s (5–100°/s). cVEMP: P13/N23 amplitude mean lower cutoff 32.5 μV (15–50 μV), mean upper cutoff 125 μV (50–200 μV), asymmetry 36.08 μV (20–50 μV).
Conclusion
This worldwide survey showed a large variability in terms of reference and pathologic cutoff values in the 38 centers included. Therefore, standardization of how to achieve these values and agreement on which values should be used is highly warranted to guarantee a high quality of vestibular testing and interpretation of clinical and scientific results.
Nowadays, the function of the peripheral vestibular system can be quantified using the video head impulse test (vHIT) for the high frequency of the angular vestibulo-ocular reflex (aVOR), caloric testing for the low frequency of the aVOR of the semicircular canals, and vestibular evoked myogenic potentials (VEMP) for the otolith organs.1–3 These laboratory tests are used worldwide in clinical practice and in research. For instance, 360+ articles listed on PubMed have been published with the vHIT and 1500+ with the VEMP.
In particular, while working on the classification of vestibular disorders, such as bilateral vestibulopathy4 or acute unilateral vestibulopathy (UVP) (“vestibular neuritis”), we realized that there seems to be a wide range of what are assumed to be “normal” and “pathologic” values for the outcome parameters of these laboratory tests in terms of absolute values and side differences. This also became apparent during elaboration of the current practice guidelines for cervical VEMP (cVEMP) and ocular VEMP (oVEMP).2 Important methodological issues are the variety in devices, variety in test conditions and test execution, different stimulation and recording techniques, various ways of analyzing and interpreting the data, and the fact that “normative values” derive from various sources.
All these aspects have major implications, such as the diagnosis of a clinically relevant vestibular deficit and thereby a diagnosis made by the doctors in daily clinical practice; the classification of vestibular disorders; and the comparison of findings between different laboratories. Therefore, we performed a standardized worldwide web-based survey, supported by the Bárány Society, on quantitative laboratory testing to evaluate the following questions: Which systems are used? How are “normal” and “pathologic” findings derived? What are the reported absolute and relative normal and pathologic values and side differences for testing semicircular and otolith function? On the basis of this survey, recommendations can be given for the standardization of quantitative vestibular testing, including what clinically meaningful vestibular deficits are. This will have a major effect on future clinical practice and research. Finally, the issues we evaluated here are not limited to only vestibular testing but apply to all fields in medicine, and we should always be aware of such limitations.
Methods
Data collection procedures and participants
Data were collected cross-sectionally by means of an online survey conducted between August 2017 and July 2018. Potential participants were identified via the members of the International Bárány Society and the members of the DizzyNet, a European network initiative for vertigo and balance research, and using a snowball approach to ensure inclusion of the most experienced centers and laboratories for management and research of vestibular disease.
Respondents entered their data directly in an online survey instrument hosted at soscisurvey.de. Data were stored and managed on a virtual server with a static Internet Protocol, fixed domain, and Secure Sockets Layer certificate situated within the hospital firewall. Nonresponders were reminded to send their data.
Standard protocol approvals, registrations, and patient consents
Because neither patients nor healthy controls were directly included, neither an approval nor a registration or patients' consents were required for this survey.
Measures
The online survey questionnaire consisted of 102 items, including questions on the structural parameters of the participating centers, such as the average number of patients with vertigo per year and the medical specialization. Nine quantitative tests of vestibular function were examined in detail: (1) vHIT, (2) caloric testing, (3) cVEMP, (4) oVEMP, as well as (5) subjective visual vertical (SVV), (6) scleral search coil, (7) rotatory chair, (8) posturography, and (9) gait analysis; (5) to (9) are not reported. Respondents were asked which of the 9 tests each center used for diagnosis, which device/instrument/system was used, which thresholds and ranges of test values were used, and if these thresholds and ranges had been defined by own studies. The questionnaire was available in English only.
Statistical analysis
Ranges and upper/lower limits or means were calculated for continuous measures; percentages were calculated for categorical measures, where appropriate. For vHIT and caloric irrigation, side differences were evaluated. Outliers were identified graphically and excluded from analysis if they were considered to be invalid in an expert's opinion. Descriptive statistical analysis was performed with IBM SPSS Statistics 25.0.0.1.
Data availability
Anonymized data will be shared on request by any qualified investigator.
Results
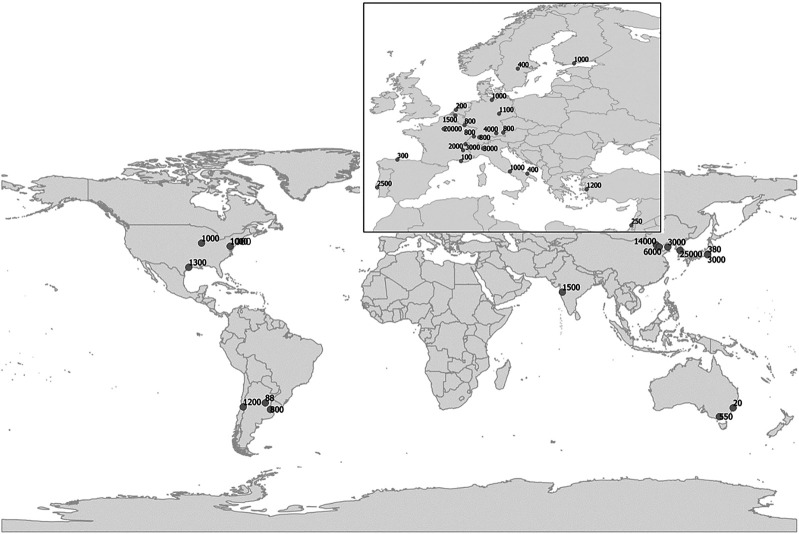
This study includes data of n = 38 centers from 20 different countries across the world (figure 1), from all continents except Africa. Centers reported an annual average of 2847 patients (SD, 5,304.1; range 20–25,000). Table e-1 (links.lww.com/CPJ/A139) summarizes the various technical systems used for vestibular testing.
Figure 1. Centers that replied to the worldwide survey in 5 continents, including the estimated number of dizzy patients they examine per year.
Usage of the various technologies
Thirty-three of 38 centers (86.8%) reported using vHIT. The same number reported using caloric irrigation. Twenty-eight centers (73.7%) reported using cVEMP and 25 centers (65.8%) oVEMP. Twenty-three centers (60.5%) reported using SVV. Five centers (13.2%) reported using the scleral search coil and 23 centers (60.5%) the rotatory chair. Twenty-four centers (63.2%) reported using posturography and 10 centers (26.3%) gait analysis (for details, see table e-1, links.lww.com/CPJ/A139).
Video head impulse test
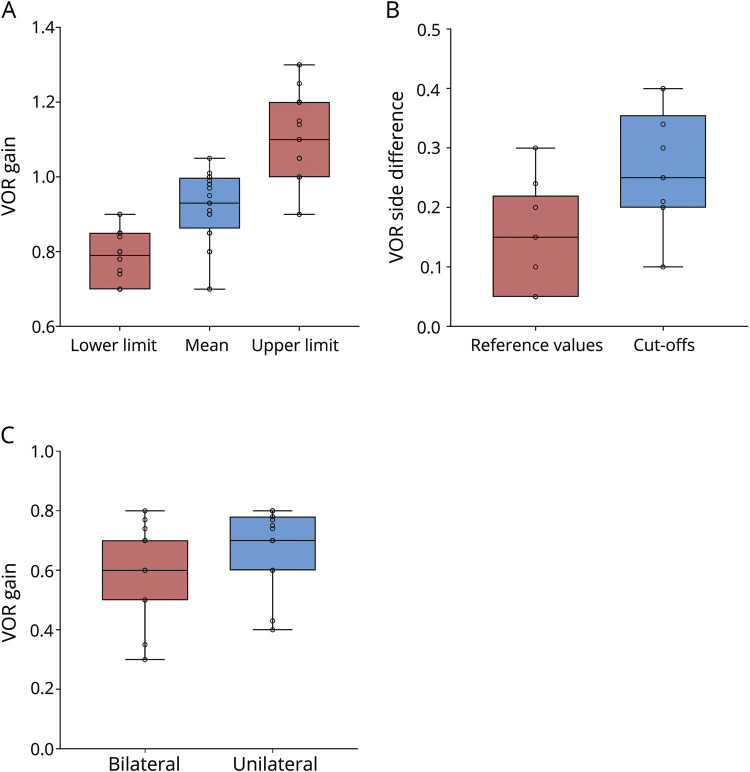
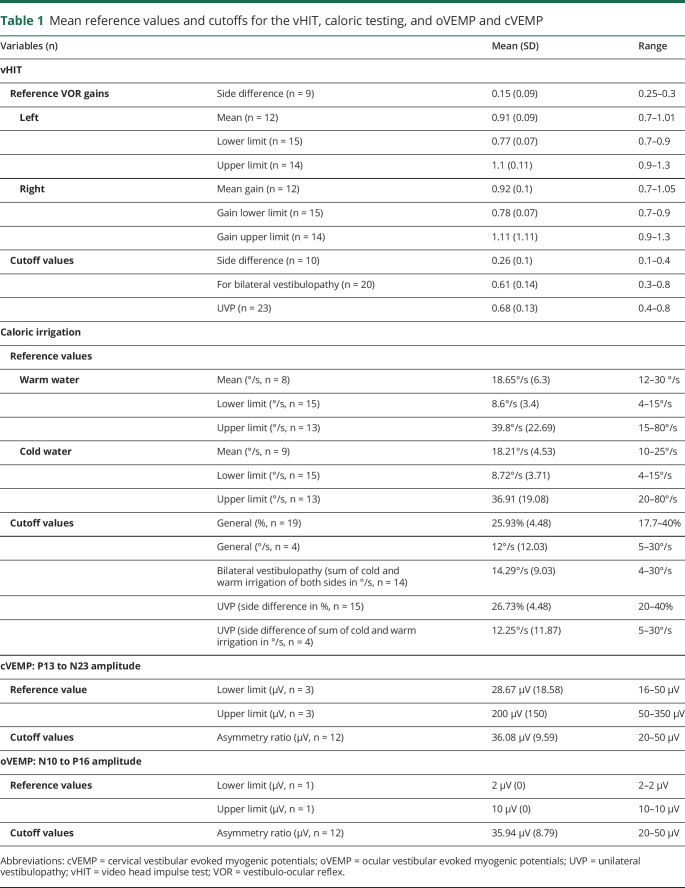
For the vHIT, 18 centers (47.3%) reported that they had performed their own validation study to determine cutoffs, whereas 10 centers (26.3%) reported that they had not, and a further 10 centers (26.3%) did not answer this question. The reported mean referential vestibulo-ocular reflex (VOR) gain in horizontal orientation was 0.91 (SD, 0.09; range, 0.7–1.01) for the left side and 0.92 (SD, 0.1; range, 0.7–1.05) for the right side (figure 2A). The reported mean referential VOR side difference for vHIT in horizontal orientation was 0.15 (SD, 0.09; range, 0.25–0.3). The reported mean VOR side difference in horizontal direction considered to be critical in general was 0.26 (SD, 0.1; range, 0.1–0.4) (figure 2B). For the diagnosis of bilateral vestibulopathy, the cutoff was 0.61 (SD, 0.14; range, 0.3–0.8). For the diagnosis of UVP, the cutoff was 0.68 (SD, 0.13; range, 0.4–0.8) (figure 2C). In table 1, the results are described in detail for the reference values and cutoff values.
Figure 2. Video head impulse test (vHIT).
(A) Median, interquartile range (the middle 50% of the values), minimum, and maximum of referential VOR gain for vHIT. (B) Median, interquartile range (the middle 50% of the values), minimum, and maximum of VOR side difference for the vHIT. (C) Median, interquartile range (the middle 50% of the values), minimum, and maximum of cutoffs for the diagnosis of bilateral vestibulopathy and unilateral vestibulopathy for vHIT. VOR = vestibulo-ocular reflex.
Table 1.
Mean reference values and cutoffs for the vHIT, caloric testing, and oVEMP and cVEMP
Caloric irrigation
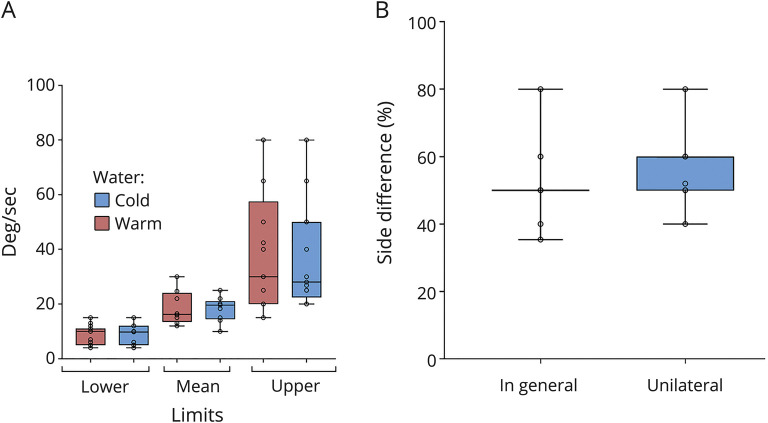
For caloric irrigation, 12 centers (31.6%) reported that they had performed their own validation study to determine cutoffs, whereas 12 centers (31.6%) reported that they had not, and a further 14 centers (36.8%) did not answer. The reported mean reference value for caloric irrigation (peak slow phase velocity of the caloric-induced nystagmus, deg/sec) using warm water was 18.65°/s (SD, 6.3°/s; range, 12–30°/s). For caloric irrigation using cold water, it was 18.21°/s (SD, 4.53°/s; range, 10–25°/s) (figure 3A). The mean cutoff for the side difference was 25.93% (SD, 4.48%; range, 17.7%–40%) or 12°/s (SD, 12.03°/s; range, 5–30°/s). For bilateral vestibulopathy (sum of the mean peak slow phase velocity of both sides for warm and cold irrigation in deg/sec), the reported mean cutoff for the side difference was 14.29°/s (SD, 9.03°/s; range, 4–30°/s). For the diagnosis of UVP, the cutoff for the side difference was 26.73% (SD, 4.48%; range, 20%–40%) according to Jonkees formula (figure 3B) or for the absolute values (sum of warm and cold irrigation), 12.25°/s (SD, 11.87; range, 5–30°/s) (for details, see table 1).
Figure 3. Caloric irrigation.
(A) Median, interquartile range (the middle 50% of the values), minimum, and maximum of reference values of the mean peak slow phase velocity for caloric irrigation. (B) Median, interquartile range (the middle 50% of the values), minimum, and maximum cutoffs for side difference in % for the diagnosis of unilateral vestibulopathy for caloric irrigation.
Vestibular evoked myogenic potentials
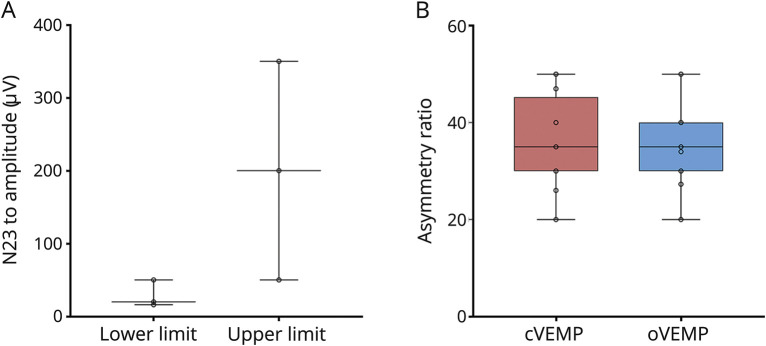
For cVEMP, 6 centers (15.8%) reported that they had performed their own validation study to determine cutoffs, whereas 10 centers (26.3%) reported that they had not, and a further 22 centers (57.9%) did not answer. The reported lower reference limit of cVEMP P13 to N23 amplitude (μV) was 28.67 μV (SD, 18.58 μV; range, 16–50 μV); the reported upper reference limit was 200 μV (SD, 150 μV; range, 50–350 μV) (figure 4A and table 1). The mean cutoff value for the asymmetry ratio of the P13 to N23 amplitude was 36.08 μV (SD, 9.59 μV; range, 20–50 μV) (figure 4B). Five centers (13.2%) reported that they had performed their own validation study to determine cutoffs for oVEMP, whereas 8 centers (21.1%) reported that they had not, and a further 25 centers (65.8%) did not answer. For oVEMP, we received only 1 reply on the lower and upper reference limits of the N10 to P16 amplitude: they were 2 μV (SD, 0; range, 2–2) and 10 μV (SD, 0; range, 10–10 μV). The reported mean cutoff for the asymmetry ratio was 35.94 μV (SD, 8.79 μV; range, 20–50 μV). Reference values and cutoffs are also displayed in table 1. Figure 1 shows the distribution of values.
Figure 4. cVEMP and oVEMP.
(A) Median, interquartile range (the middle 50% of the values), minimum, and maximum of reference values for the P13 to N23 amplitude in cVEMP. (B) Median, interquartile range (the middle 50% of the values), minimum, and maximum of cutoffs for asymmetry ratio for cVEMP and oVEMP in %. cVEMP = cervical vestibular evoked myogenic potentials; oVEMP = ocular vestibular evoked myogenic potentials.
Discussion
This worldwide survey focuses on reference and pathologic values of 3 laboratory tests for vestibular testing, which are widely used: vHIT for the high-frequency aVOR, caloric testing for the low-frequency aVOR, and VEMP for otolith function.
For the vHIT, normative values can arise from: (1) published data in healthy controls (e.g., Refs. 5, 6); (2) recommendations by the manufacturers of the devices; and (3) data based on studies in healthy subjects within each hospital. One should thus also take the following aspects into consideration: the various devices used for the vHIT differ in terms of eye velocity detection, artifact rejection, and algorithms applied to calculate the VOR gain, e.g., the area under the curve or peak angular eye and head velocity7,8; the age of the subjects, which requires normative values for each decade,9,10 sex and ethnic groups. In addition, recently a significant 5% so far unexplained right-left imbalance of the normal values for the vHIT depending on the position of the video camera in front of the eye of the individual was detected.11
Although Robert Bárány already described caloric irrigation in 1907,12 there is still no consensus about normal absolute or relative values or correcting values for age reported in the literature.13–16 For instance, the average maximum slow phase varies between laboratories from 14.9 to 29.7°/s for cold irrigations and from 12.1 to 30.9°/s for warm irrigations.13,17,18 This variability may partly be due to uncontrollable factors, such as differences in the anatomy of the temporal bone (differences in temperature conduction), and controllable factors, such as stimulus parameters and technical skills optimized to absolutely avoid any visual suppression.17 The asymmetry between labyrinths may be up to 19% and still be within the normal range.17 For caloric irrigation, a side difference >20% to 25% according to Jonkees formula19 has been assumed to be pathologic for decades, but this has not been really validated in up-to-date studies taking into consideration signs and symptoms of patients (for Ref. 16).
For cVEMP and oVEMP, the situation is even more difficult, in particular because of the various stimulation and recording paradigms used (for Refs. 20, 21). There may be large variations, even within the same laboratory depending on the individual technician who performs the study, as was demonstrated for the VEMP.22
Therefore, we performed a worldwide survey on the quantitative vestibular testing of the function of the semicircular canal function by vHIT and caloric testing and of the otolith function by c/oVEMP to evaluate the current status in various centers. The major findings are as follows:
First, only about 50% of the centers have their own normative values for vHIT and only 30% for VEMP. The other centers evidently use the values given by the companies distributing the technology, use data from other studies in healthy controls, or it remained unclear. We think that there is a bias, which reflects an even worse situation in clinical practice because we can assume that it was the better qualified centers that replied to the survey.
Second, there is a wide range of reported “normal or lower/upper reference limits” and pathologic “cutoff” values for the diagnosis of unilateral and bilateral vestibular semicircular canal and otolith organ deficits. There is also an overlap between what is assumed to be normal and pathologic between the different centers. This makes the diagnosis of a vestibular dysfunction and a comparison of data reported in the literature from various laboratories very difficult.
Third, it also became evident that there is also no agreement as to whether absolute quantitative values (e.g., in deg/sec or μV) or relative values are more appropriate, as was already reflected in the past by using Jonkees formula19 instead of absolute differences for comparing caloric excitability.
Fourth, there is no agreement between “lower/upper reference limit” vs pathologic cutoffs to define a clinically relevant unilateral or bilateral vestibular deficit.
What are the strategies to solve these issues? In theory, some of them seem simple and straightforward. They may sound trivial but are necessary to guarantee the quality of these laboratory examinations and also the definition of what is assumed to be “pathologic”.
First, it is recommended that each specialist center should evaluate their own normative values in healthy subjects. This also includes measurements across all age brackets—with a sufficient number of individuals for each age bracket (the sufficient number will depend on measurement precision and expected age gradient)—because vestibular function slowly decreases during aging (for Refs. 23, 24). There is, for instance, a decline of normal horizontal VOR velocity gain by 0.017 per decade (95% confidence interval 0.006–0.029; p = 0.005).25 Notably, this requires specific reference values for aged adults and for children. Furthermore, possible sex or ethnic group differences should also be considered. Any reference range should be determined based on the natural variability and on the empirical precision and reliability that can realistically be attained. Ideally, measuring a reference group of healthy controls and a group of patients with known diagnoses should give an idea of natural variability and clinically relevant thresholds. Likewise, measuring the same group of patients repeatedly by the same or by varying investigators will give estimates of the inter- and intra-rater and test and retest reliability of the respective measurements.
If such an approach is not possible, for instance, in smaller centers or, of course, a private practice, the user should either refer to published studies performed with the specific device or reference values given by the manufacturer, which have to be based on methodologically state-of-the-art studies. This could also mean that these companies have to perform such studies and deliver the data with their devices. Finally, the American Academy of Neurology (AAN) and the Bárány Society are working on standardization and classification papers, which can also be the basis of more precise diagnosis.
Second, the situation could be even worse because—as mentioned above—there may even be a relevant variability between individual medical technicians who perform the tests, which was demonstrated by a systematic study on VEMP.22 Therefore, a standardization of the examination and evaluation procedures and of the training of the technicians is a prerequisite for each laboratory with continuing medical and technical education with certification.
Third, in publications, the methods and analysis used must be described very precisely, in particular for VEMP because of the various stimulation and recording procedures. The normative values for each laboratory must be explicitly stated. Finally, in publications, a sufficient number of original recordings have to be shown—at least in the supplement—so that the reviewers and readers can evaluate the quality of the measurements.
Fourth, the definition of clinically relevant cutoff values for impaired unilateral and bilateral vestibular function seems to be even more challenging because this requires additional measures, including patients' symptoms, quality of life, and functioning26 of dizzy patients, which may serve as the gold standard for dysfunction and vice versa. Even worse, a frequently used scale, the Dizziness Handicap Inventory does not correlate with measured vestibular deficits, as was shown in a study with 799 patients.27 All in all, in this area, we are facing a general problem in all fields of medicine, i.e., how well do laboratory findings, ranging from clinical chemistry to MRI studies, correlate with patients signs and symptoms? One approach is to have standardization committees, as the AAN or the Bárány Society have, to agree on such measures and the clinical relevance of laboratory tests. This was, for instance, done for VEMP by the AAN2 and by the Bárány Society to define bilateral vestibulopathy: for its diagnosis, it is required that the horizontal aVOR gain on both sides is <0.6 (angular velocity 150–300°/s) and/or the sum of the maximal peak velocities of the slow phase caloric-induced nystagmus for stimulation with warm and cold water on each side is <6°/s.4 These values are intentionally below the “lower/upper reference limits” to achieve a high specificity for the diagnosis.
This study has several limitations. First, there is evidently a bias because not all centers that received an invitation replied and we do not exactly know how many centers ultimately received an invitation because of our snowball approach. However, one can assume that it was probably the better organized centers that submitted their data. Second, 38 centers is a relatively small number. However, several reminders were sent to various centers all over the world.
In conclusion, this worldwide survey on vestibular testing demonstrates a large variability on what are assumed to be “normative values” for vHIT, caloric irrigation, and VEMP. Substantial improvement can be achieved by elaborating these values for healthy individuals for each decade of life in each center, combined with continuing training of doctors and technicians on how to perform the recordings and interpret the results. This will have a major effect on clinical practice and research. Finally, we should always keep in mind that in clinical practice, we should not treat single laboratory values but patients with their signs and symptoms.
Acknowledgments
The authors thank Stefan Hübinger for programming the web site for the worldwide survey and Katie Göttlinger for copyediting the manuscript.
Appendix. Authors
Study funding
This work was supported by the German Ministry of Education and Research (BMBF), Grant No. 01EO0901 to the German Center for Vertigo and Balance Disorders (IFBLMU).
Disclosure
M. Strupp is Joint Chief Editor of the Journal of Neurology, Editor-in-Chief of Frontiers of Neuro-otology, and Section Editor of F1000; has received speaker honoraria from Abbott, Actelion, Auris Medical, Biogen, Eisai, Grünenthal, GSK, Henning Pharma, Interacoustics, Merck, MSD, Otometrics, Pierre-Fabre, Teva, and UCB; is a shareholder of IntraBio; and acts as a consultant for Abbott, Actelion, AurisMedical, Heel, IntraBio, and Sensorion. J. Grimberg and J. Teufel report no disclosures relevant to the manuscript. G. Laurell is President of the Bárány Society and is a board member of the company Acta Oto-Laryngologica. H. Kingma has received sponsoring for organizing, attending, and contributing to various conferences and teaching activities from numerous scientific, educational, governmental, and private institutions and industrial companies (Abbott and Otometrics). E. Grill is Section Editor of Experimental Gerontology. Full disclosure form information provided by the authors is available with the full text of this article at Neurology.org/cp.
TAKE-HOME POINTS
→ This worldwide survey with 38 centers from 4 continents on laboratory testing of semicircular and otolith function showed a high variability of reference values and pathologic cutoff values.
→ This implies that the same patient would be classified as having a “normal” vestibular function in one center and “impaired” vestibular function in another center.
→ Ideally specialist centers with high numbers of patients should therefore generate their own reference values for each test.
→ Other centers and doctors in clinical practice could use the reference values for the device used either based on the literature or given by the company if based on solid studies.
References
- 1.Curthoys IS. The interpretation of clinical tests of peripheral vestibular function. Laryngoscope 2012;122:1342–1352. [DOI] [PubMed] [Google Scholar]
- 2.Fife TD, Colebatch JG, Kerber KA, et al. Practice guideline: cervical and ocular vestibular evoked myogenic potential testing: Report of the Guideline Development, Dissemination, and Implementation Subcommittee of the American Academy of Neurology. Neurology 2017;89:2288–2296. [DOI] [PMC free article] [PubMed] [Google Scholar]
- 3.Halmagyi GM, Chen L, MacDougall HG, Weber KP, McGarvie LA, Curthoys IS. The video head impulse test. Front Neurol 2017;8:258. [DOI] [PMC free article] [PubMed] [Google Scholar]
- 4.Strupp M, Kim JS, Murofushi T, et al. Bilateral vestibulopathy: diagnostic criteria consensus document of the Classification Committee of the Bárány Society. J Vestib Res 2017;27:177–189. [DOI] [PMC free article] [PubMed] [Google Scholar]
- 5.McGarvie LA, MacDougall HG, Halmagyi GM, Burgess AM, Weber KP, Curthoys IS. The video head impulse test (vHIT) of semicircular canal function—age-dependent normative values of VOR gain in healthy subjects. Front Neurol 2015;6:154. [DOI] [PMC free article] [PubMed] [Google Scholar]
- 6.Matino-Soler E, Esteller-More E, Martin-Sanchez JC, Martinez-Sanchez JM, Perez-Fernandez N. Normative data on angular vestibulo-ocular responses in the yaw axis measured using the video head impulse test. Otol Neurotol 2015;36:466–471. [DOI] [PubMed] [Google Scholar]
- 7.Lee SH, Yoo MH, Park JW, et al. Comparison of video head impulse test (vHIT) gains between two commercially available devices and by different gain analytical methods. Otol Neurotol 2018;39:e297–e300. [DOI] [PubMed] [Google Scholar]
- 8.Murnane O, Mabrey H, Pearson A, Byrd S, Akin F. Normative data and test-retest reliability of the SYNAPSYS video head impulse test. J Am Acad Audiol 2014;25:244–252. [DOI] [PubMed] [Google Scholar]
- 9.Bachmann K, Sipos K, Lavender V, Hunter LL. Video head impulse testing in a pediatric population: normative findings. J Am Acad Audiol 2018;29:417–426. [DOI] [PubMed] [Google Scholar]
- 10.Yang CJ, Lee JY, Kang BC, Lee HS, Yoo MH, Park HJ. Quantitative analysis of gains and catch-up saccades of video-head-impulse testing by age in normal subjects. Clin Otolaryngol 2016;41:532–538. [DOI] [PubMed] [Google Scholar]
- 11.Strupp M, Kichler A, McGarvie L, Kremmyda O. The video head impulse test: a right-left imbalance. J Neurol 2018;265:40–43. [DOI] [PubMed] [Google Scholar]
- 12.Bárány R. Physiologie und Pathologie des Bogengangsapparates beim Menschen. Vienna: Franz Deuticke; 1907. [Google Scholar]
- 13.Bruner A, Norris TW. Age-related changes in caloric nystagmus. Acta Otolaryngol Suppl 1971;282:1–24. [PubMed] [Google Scholar]
- 14.Peterka RJ, Black FO, Schoenhoff MB. Age-related changes in human vestibulo-ocular reflexes: sinusoidal rotation and caloric tests. J Vestib Res 1990;1:49–59. [PubMed] [Google Scholar]
- 15.Mallinson AI, Longridge NS. Caloric response does not decline with age. J Vestib Res 2004;14:393–396. [PubMed] [Google Scholar]
- 16.Shepard NT, Jacobson GP. The caloric irrigation test. Handb Clin Neurol 2016;137:119–131. [DOI] [PubMed] [Google Scholar]
- 17.Van Der Stappen A, Wuyts FL, Van De Heyning PH. Computerized electronystagmography: normative data revisited. Acta Otolaryngol 2000;120:724–730. [DOI] [PubMed] [Google Scholar]
- 18.Sills AW, Baloh RW, Honrubia V. Caloric testing 2: results in normal subjects. Ann Otol Rhinol Laryngol Suppl 1977;86:7–23. [DOI] [PubMed] [Google Scholar]
- 19.Jongkees LB, Maas J, Philipszoon A. Clinical electronystagmography: a detailed study of electronystagmography in 341 patients with vertigo. Pract Otorhinolaryngol Basel 1962;24:65–93. [PubMed] [Google Scholar]
- 20.Colebatch JG, Rosengren SM, Welgampola MS. Vestibular-evoked myogenic potentials. Handb Clin Neurol 2016;137:133–155. [DOI] [PubMed] [Google Scholar]
- 21.Rosengren SM, Colebatch JG, Young AS, Govender S, Welgampola MS. Vestibular evoked myogenic potentials in practice: methods, pitfalls and clinical applications. Clin Neurophysiol Pract 2019;4:47–68. [DOI] [PMC free article] [PubMed] [Google Scholar]
- 22.Ertl M, Boegle R, Kirsch V, Dieterich M. On the impact of examiners on latencies and amplitudes in cervical and ocular vestibular-evoked myogenic potentials evaluated over a large sample (N = 1,038). Eur Arch Otorhinolaryngol 2016;273:317–323. [DOI] [PubMed] [Google Scholar]
- 23.Maheu M, Houde MS, Landry SP, Champoux F. The effects of aging on clinical vestibular evaluations. Front Neurol 2015;6:205. [DOI] [PMC free article] [PubMed] [Google Scholar]
- 24.Ji L, Zhai S. Aging and the peripheral vestibular system. J Otol 2018;13:138–140. [DOI] [PMC free article] [PubMed] [Google Scholar]
- 25.Mossman B, Mossman S, Purdie G, Schneider E. Age dependent normal horizontal VOR gain of head impulse test as measured with video-oculography. J Otolaryngol Head Neck Surg 2015;44:29. [DOI] [PMC free article] [PubMed] [Google Scholar]
- 26.Grill E, Bronstein A, Furman J, Zee DS, Müller M. International Classification of Functioning, Disability and Health (ICF) core set for patients with vertigo, dizziness and balance disorders. J Vestib Res 2012;22:261–271. [DOI] [PubMed] [Google Scholar]
- 27.Yip CW, Strupp M. The Dizziness Handicap Inventory does not correlate with vestibular function tests: a prospective study. J Neurol 2018;265:1210–1218. [DOI] [PubMed] [Google Scholar]
Associated Data
This section collects any data citations, data availability statements, or supplementary materials included in this article.
Data Availability Statement
Anonymized data will be shared on request by any qualified investigator.


