Abstract
Background:
The role of T cells in the pathogenesis of oral squamous cell carcinoma (OSCC) was clarified by examining the levels of differentiated CD4+CD25+FOXP3+ T-regulatory cells (Treg cells) and CD4+IL17+ T helper 17 (Th17) cells in OSCC patients.
Methods:
Flow cytometry was conducted to measure the proportions of Treg/Th17 cells in different sample groups to identify a proper maker indicative of the progression and prognosis of OSCC.
Results:
The results showed that a higher Treg/Th17 ratio led to poorer prognosis. Also, the proportions of both Treg cells and Th17 cells were significantly elevated in OSCC patients compared with those in the control groups, suggesting a correlation between Treg/Th17 imbalance and the prognosis of OSCC. Furthermore, the ratios of Treg/Th17 cells in OSCC patients differed at different time points of cancer progression. For example, stage III-IV patients showed the most evident increase in the Treg/Th17 ratio, while the Treg/Th17 ratio in control subjects was the lowest.
Conclusions:
Therefore, a higher ratio of Treg/Th17 indicated the progression of OSCC and a larger tumor size. Therefore, Treg and Th17 imbalance was implicated in OSCC progression.
Keywords: immune mechanism, oral squamous cell carcinoma, T-regulatory cells/T helper 17
1. Introduction
Based on the statistics from the World Health Organization, oral squamous cell carcinoma (OSCC) is the 8th most frequent malignant tumor globally, with an incidence of 1/10,0000 to 10/10,0000 that is still gradually increasing.[1] It is worth mentioning that the mortality of OSCC in third-world countries is much higher than that in developed countries.[2,3] Moreover, 128,000 deaths were reported in the report of GLOBOCAN 2008, highlighting the urgency of developing an accurate method to evaluate the prognosis of OSCC patient.[4]
Immune system plays a critical function in the tumor micro-environment. For example, 18 dendritic cell (DC) are critical antigen-presenting cells (APCs) involved in T cell recruitment, thus initiating the immune responses.[5] Grulich et al demonstrated that immune-compromised individuals were more likely to have malignant tumors because of impaired immune responses.[6] Also, adequate responses generated from the immune system in mucosa is important to prevent the invasion of malignantly transformed cells.[7] In a previous study, the authors compared the immune-surveillance status according to the expression of mature and immature plasmacytoid dendritic cell, T cell, and dendritic Langerhans cell in oral epithelial dysplasia and OSCC. Their results displayed a significant difference in the distribution of mature CD8 lymphocyte, plasmacytoid dendritic cell and dendritic Langerhans cell between the 2 groups. Furthermore, a disrupted balance in immune responses can trigger oral cancer. For example, 13DC are APCs located in the epithelium that can recognize tumor antigens, thus inducing immune responses.[8]
Oral tumor cells can escape immune responses by interacting with immune-suppressive factors Fas ligand, interleukin 10, transforming growth factor-beta (TGF-β), and prostaglandin E2 to reduce the total count of immuno-competent cells. This damaging capacity of immune tolerance can also be induced by T-regulatory cells (Tregs) that are positive for CD4, CD25, and FOXP3.[9] Several previous articles have observed an elevated amount of circulating Tregs in hepatocellular carcinoma and lung, breast, pancreas and prostate cancer. Besides, the elevated incidence of above cancers may lead to poorer prognosis and reduced effectiveness of immunotherapy treatments.[10–14] Furthermore, the depletion of suppressor T cells increased the anti-tumor capability in mice.[15] Therefore, the authors postulated that Tregs could suppress antitumor immunity by decreasing the amount of CD8+/CD4+T cells, thus facilitating tumor metastasis and growth.
While T-cells play important roles, the changes in other biomarkers including Tregs can also affect cancer progression. For example, the equilibrium between T helper 17 (Th17) and Treg cells controls the balance of immune-regulation.[16–18] While there has been considerable controversy regarding the actual number of Tregs in multiple myeloma patients, such discrepancy may be explained by differences in patient selection and assay methodology.[19,20]
The effect of Treg/Th17 on the prognosis of OSCC in recruited OSCC patients and control subjects was investigated in this research.
2. Materials and methods
2.1. Human sample collection
A total of 196 OSCC patients and 138 health controls were recruited. Based on the ratio of their Treg/Th17, the 196 OSCC patients were divided into a high Treg/Th17 group (N = 98) and a low Treg/Th17 group (N = 98). Whole blood specimens were collected from all participants using heparin-treated blood collection tubes, while serum specimens were collected to analyze the expression of various cytokines. In addition, the survival rate of all subjects was calculated according to conventional procedures. This study was carried out in strict compliance with the last vision of the Declaration of Helsinki and the study protocols were approved by the Ethics Review Board of Lanzhou University Second Hospital. All participants have signed the form of informed consent.
2.2. Assay for Treg/Th17 cells
Peripheral blood mononuclear cells (PBMCs) were harvested from each whole blood sample and stained with an eZFluor anti-human APC-CD25 and fluorescein isothiocyanate (FITC)-CD4 reagent (Affymetrix, eBiosciences, San Diego, CA). Subsequently, the PBMCs were placed in a permeabilization buffer containing rat serum, and fixed using a fixation solution. Intracellular staining of PBMCs was carried out using PE labeled rat IgG2a control and anti-Foxp3 antibodies (Affymetrix, eBiosciences) following manufacturer's instructions. In terms of the measurement of Th17 cells, PBMCs were activated using Roswell Park Memorial Institute Medium supplemented with 10% fetal bovine serum, 200 mM L-Glutamine, and a Cell Stimulation Cocktail (Affymetrix, eBiosciences). The activation of PBMCs was carried out at 5% CO2 and 37°C for 4 hours. Then, the activated PBMCs were incubated with mouse IgG1K isotype control-FITC or anti-human CD4-FITC reagents (Affymetrix, eBiosciences) before they were permeabilized and fixed. The intracellular staining of Th17 cells was carried out using PE labeled mouse IgG1K control and anti-IL-17A antibodies (Affymetrix, San Diego, CA) following kit instruction. Flow cytometry analyses were carried out for all samples within 3 hours. All flow cytometry measurements were performed using a FACS Calibur flow cytometer (BD, Franklin Lakes, NJ).
2.3. Real-time polymerase chain reaction
Total RNA was isolated from tissues using Trizol (Invitrogen, Carlsbad, CA). Then, reverse transcription was carried out using a PrimeScript RT Kit (Fermentas, Maryland, NY) following product manual. In the next step, fluorescent quantitative polymerase chain reaction was carried out on a 7500 system (ABI, Oyster Bay, NY) using a SYBR Master Mix (Invitrogen) per product instruction to evaluate the expression of CD4, CD25, FOXP3, CD4, and IL-17 in each sample.
2.4. Enzyme-linked immunosorbent assay
The expression of CD4, CD25, FOXP3, CD4, and IL-17 in sample cells was detected by commercial enzyme-linked immunosorbent assay kits (Thermo Fisher Scientific, Waltham, MA) per kit instructions.
2.5. Statistical analysis
Statistical analysis was done using Prism 7.0 (GraphPad, La Jolla, CA). All data was expressed in mean ± standard deviation. Student t tests were utilized for statistical comparison. Spearman correlation was used to describe the Th17-Treg relationship. The survival analysis was carried out using NCSS Statistical Analysis Software in conjunction with a Kaplan–Meier Method (NCSS, Kaysville, UT). The level of significance was set to 0.05.
3. Results
3.1. Patients with high Treg/Th17 ratios suffered from poor survival
The Treg/Th17 ratio of each patient was calculated for the 196 OSCC patients recruited to the study. The demographic data of the study subjects (OSCC subjects = 196, control subjects = 138) recruited was presented in Table 1, indicating no significant differences between OSCC subjects and control subjects. Accordingly, the median of Treg/Th17 ratio was used as an indicator to group the patients into a High Treg/Th17 Group (N = 98) and a Low Treg/Th17 Group (N = 98). Survival rates in these 2 groups were then calculated using the Kaplan–Meier method. As shown in Figure 1, the low Treg/Th17 group showed better survival compared to that shown in the high Treg/Th17 group.
Table 1.
Demographic data of the participants of this study.
| Variables | OSCC (N = 196) | Control (N = 138) | P-values |
| Age | .838 | ||
| <60 | 113 (57.6) | 78 (56.5) | |
| ≥60 | 83 (42.4) | 60 (43.5) | |
| Gender | .691 | ||
| Females | 108 (55.1) | 73 (52.3) | |
| Males | 88 (44.9) | 65 (47.7) | |
| Smoking | .944 | ||
| Ever | 110 (56.1) | 78 (56.5) | |
| Never | 86 (43.9) | 60 (43.5) | |
| Drinking | <.01 | ||
| Ever | 61 (31.1) | 22 (15.9) | |
| Never | 135 (68.9) | 116 (84.1) |
OSCC = oral squamous cell carcinoma.
Figure 1.
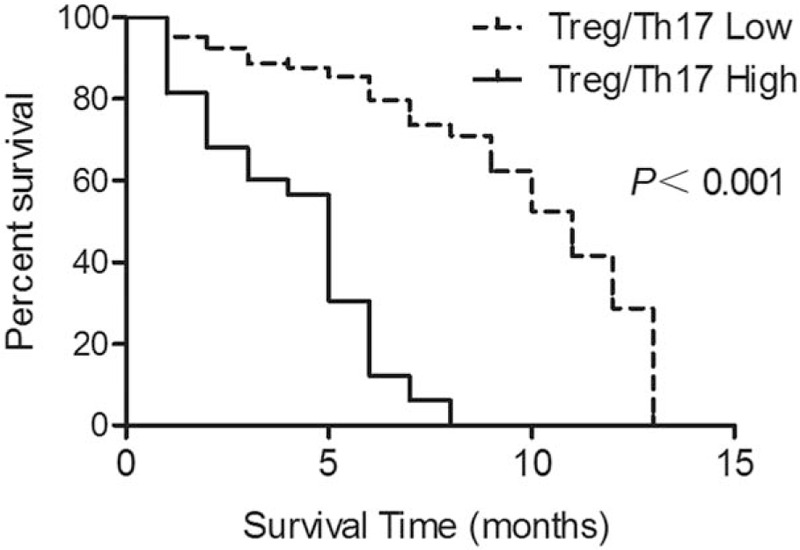
Survival rates in the low Treg/Th17 ratio group and the high Treg/Th17 ratio group. Th17 = T helper 17, Tregs = T-regulatory cells.
3.2. Treg/Th17 imbalance was correlated with the pathogenesis of OSCC
Whole blood samples were collected from OSCC patients (N = 196) and control subjects (N = 138). Flow cytometry analysis was then conducted to measure the levels of Treg and Th17 in the OSCC and control groups. As shown in Figure 2A, the proportion of CD4+CD25+FOXP3+Treg cells was significantly higher in the OSCC group as compared with that in the control group. Similarly, the proportion of CD4+IL17+Th17 cells was also evidently increased in the OSCC group compared with that in the control group (Fig. 2B). Meanwhile, we also calculated the Treg/Th17 ratios in both OSCC and control groups. The percentage of CD4+CD25+FOXP3+Treg cells in all CD4 + T cells (Fig. 3A), as well as the percentage of CD4+IL17+Th17 cells in all CD4 + T cells (Fig. 3B), was significantly higher in the OSCC group compared with that in the control group. Similarly, the Treg/Th17 ratio in the OSCC group was also higher than that in the control group (Fig. 3C). The above results collectively indicated the presence of Treg/Th17 imbalance in OSCC patients, and such imbalance might be correlated with the pathogenesis of OSCC.
Figure 2.
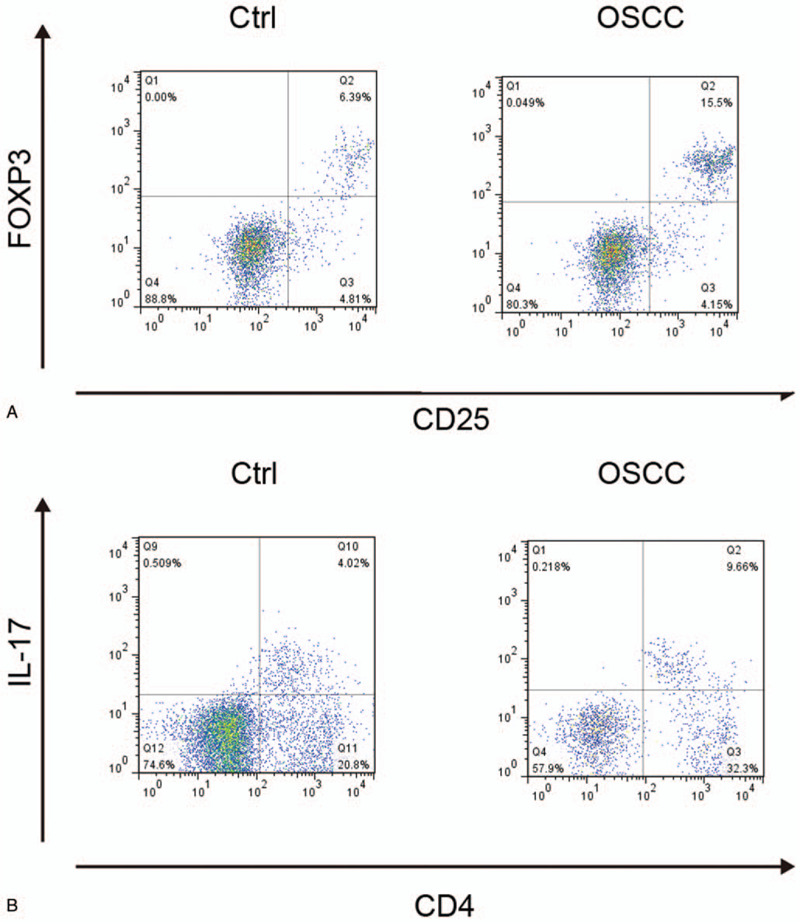
Proportions of CD4+CD25+FOXP3+Treg cells and CD4+IL17+Th17 cells in OSCC and control groups. (A) Proportions of CD4+CD25+FOXP3+Treg cells in OSCC and control groups; (B) Proportions of CD4+IL17+Th17 cells in OSCC and control groups. OSCC = oral squamous cell carcinoma, Th17 = T helper 17, Tregs = T-regulatory cells.
Figure 3.

Treg/Th17 ratio in OSCC and control groups (∗P-value < .0001 compared with Control group). (A) Ratios of CD4+CD25+FOXP3+Treg cells in all CD4 + T cells in OSCC and control groups; (B) Ratios of CD4+IL17+Th17 cells in all CD4 + T cells in OSCC and control groups; (C) Treg/Th17 ratios in OSCC and control groups. OSCC = oral squamous cell carcinoma. Th17 = T helper 17, Tregs = T-regulatory cells.
3.3. Ratios of Treg/Th17 cells among patients at different stages of cancer
To further explore the role of Treg/Th17 ratio in the pathogenesis of OSCC, we measured the ratios of Treg/Th17 cells among patients at different tumor stages. We divided the 196 patients into a stage I-II group (N = 126) and a stage III-IV group (N = 70), while the control group still contained 138 subjects. As shown in Figure 4A, the proportion of CD4+CD25+FOXP3+Treg cells in the stage III-IV group was the highest, while the proportion of CD4+CD25+FOXP3+Treg cells in the control group was the lowest. Similarly, the proportion of CD4+IL17+Th17 cells in the stage III-IV group was the highest, while the proportion of CD4+IL17+Th17 cells in the control group was the lowest (Fig. 4B). Overall, the Treg/Th17 ratio increased from the control group to the stage III-IV group. Similarly (Fig. 4C), the Treg/Th17 ratio was higher in advanced tumors compared with that in early stage tumors.
Figure 4.
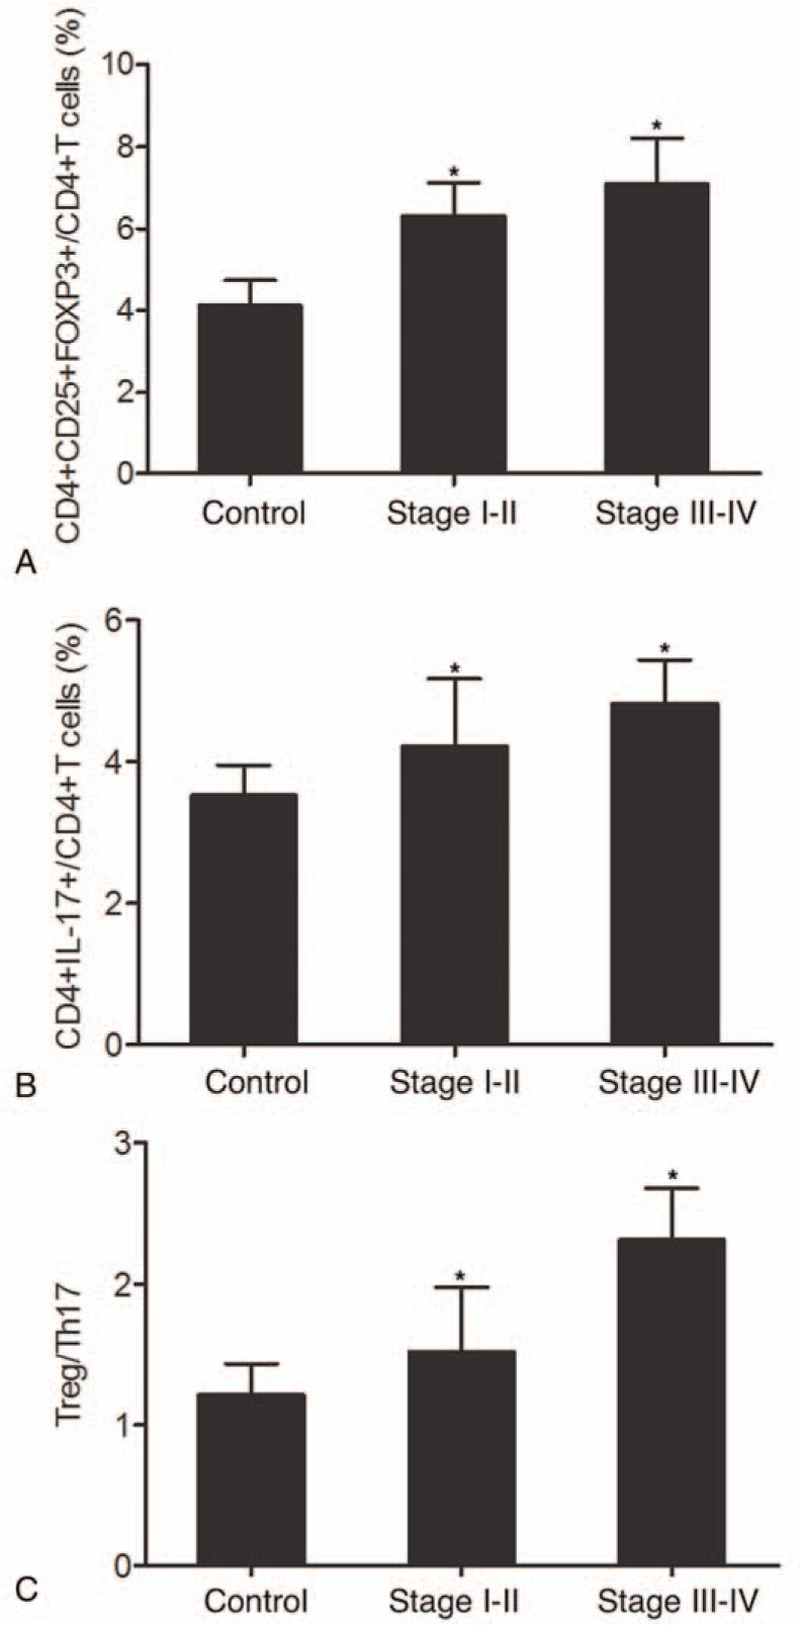
Proportions of Treg/Th17 cells and Treg/Th17 ratio among patients at different tumor stages (∗P-value < .0001 compared with Control group). (A) Proportions of CD4+CD25+FOXP3+Treg cells in stage I-II, stage III-IV and control groups; (B) Proportions of CD4+IL17+Th17 cells in stage I-II, stage III-IV and control groups; (C) Treg/Th17 ratios in stage I-II, stage III-IV and control groups. OSCC = oral squamous cell carcinoma. Th17 = T helper 17, Tregs = T-regulatory cells.
3.4. Treg/Th17 ratio changed among patients with varying tumor sizes
Meanwhile, we also used tumor size as a criterion to divide the 196 patients into a group of tumor size <2 cm (N = 115) and a group of tumor size ≥2 cm (N = 81), while the control group still contained 138 subjects. As shown in Figure 5, we measured the proportions of Treg/Th17 cells as well as the Treg/Th17 ratio in patients with early stage tumors (stage I-II). The proportion of CD4+CD25+FOXP3+Treg cells (Fig. 5A) obviously increased in stage I-II tumors compared with that in the controls. Moreover, early stage tumors with a size of ≥2 cm exhibited an even higher proportion of CD4+CD25+FOXP3+Treg cells compared with early stage tumors with a tumor size of <2 cm. In addition, a similar trend was observed for CD4+IL17+Th17 cells (Fig. 5B). Overall, the Treg/Th17 ratio (Fig. 5C) changed in early stage tumors with various tumor sizes. As shown in Figure 6, we also measured the proportions of Treg/Th17 cells as well as the Treg/Th17 ratio in patients with advanced tumors (stage III-IV). The proportion of CD4+CD25+FOXP3+Treg cells (Fig. 6A) was significantly increased in stage III-IV tumors compared with that in the controls. Furthermore, the proportion of CD4+CD25+FOXP3+Treg cells in advanced tumors with a size of <2 cm was slightly lower than that in advanced tumors with a size of ≥2 cm. A similar trend was also observed for CD4+IL17+Th17 cells (Fig. 6B) and the Treg/Th17 ratio (Fig. 6C). Subsequently, we compared the proportion of Treg/Th17 cells in patients with a tumor size of <2 cm and patients with a tumor size of ≥2 cm. As shown in Figure 7, the proportions of CD4+CD25+FOXP3+Treg cells (Fig. 7A) and CD4+IL17+Th17 cells (Fig. 7B) were both increased in tumors with a larger size. In addition, a similar result was obtained in terms of the Treg/Th17 ratio. In summary, these results demonstrated the different ratios of Treg/Th17 cells among patients at different clinical stages, with a higher Treg/Th17 ratio correlating with a more advanced tumor stage and a larger tumor size.
Figure 5.
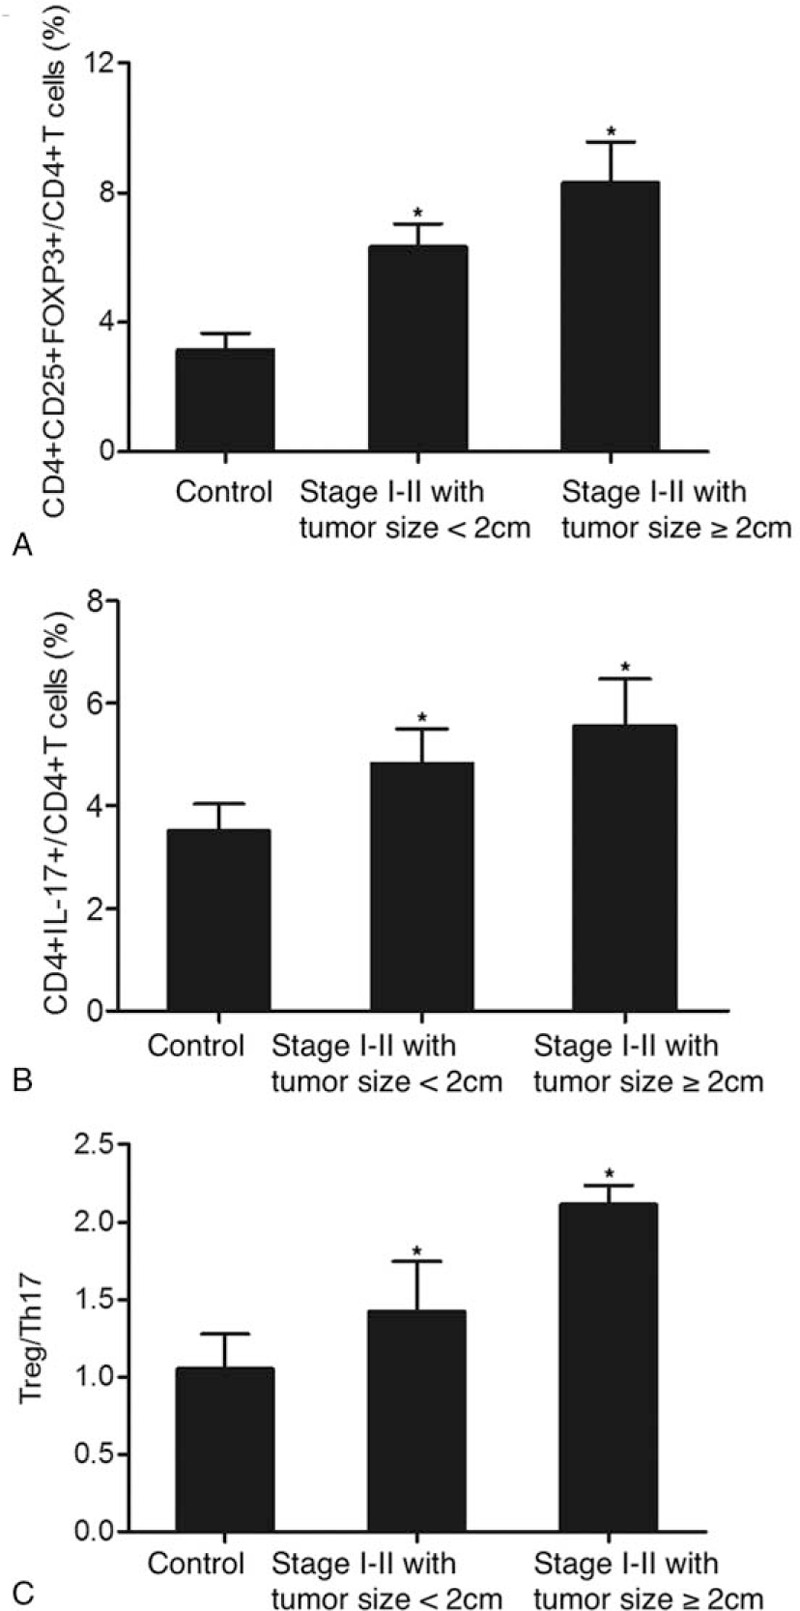
Proportions of Treg/Th17 cells and Treg/Th17 ratio in early stage (stage I-II) patients with different tumor sizes (∗P-value < .0001 compared with Control group). (A) Proportion of CD4+CD25+FOXP3+Treg cells in early stage patients with a tumor size of ≥2 cm and a tumor size of <2 cm; (B) Proportion of CD4+IL17+Th17 cells in early stage patients with a tumor size of ≥2 cm and a tumor size of <2 cm; (C) Treg/Th17 ratio in early stage patients with a tumor size of ≥2 cm and a tumor size of <2 cm. Th17 = T helper 17, Tregs = T-regulatory cells.
Figure 6.
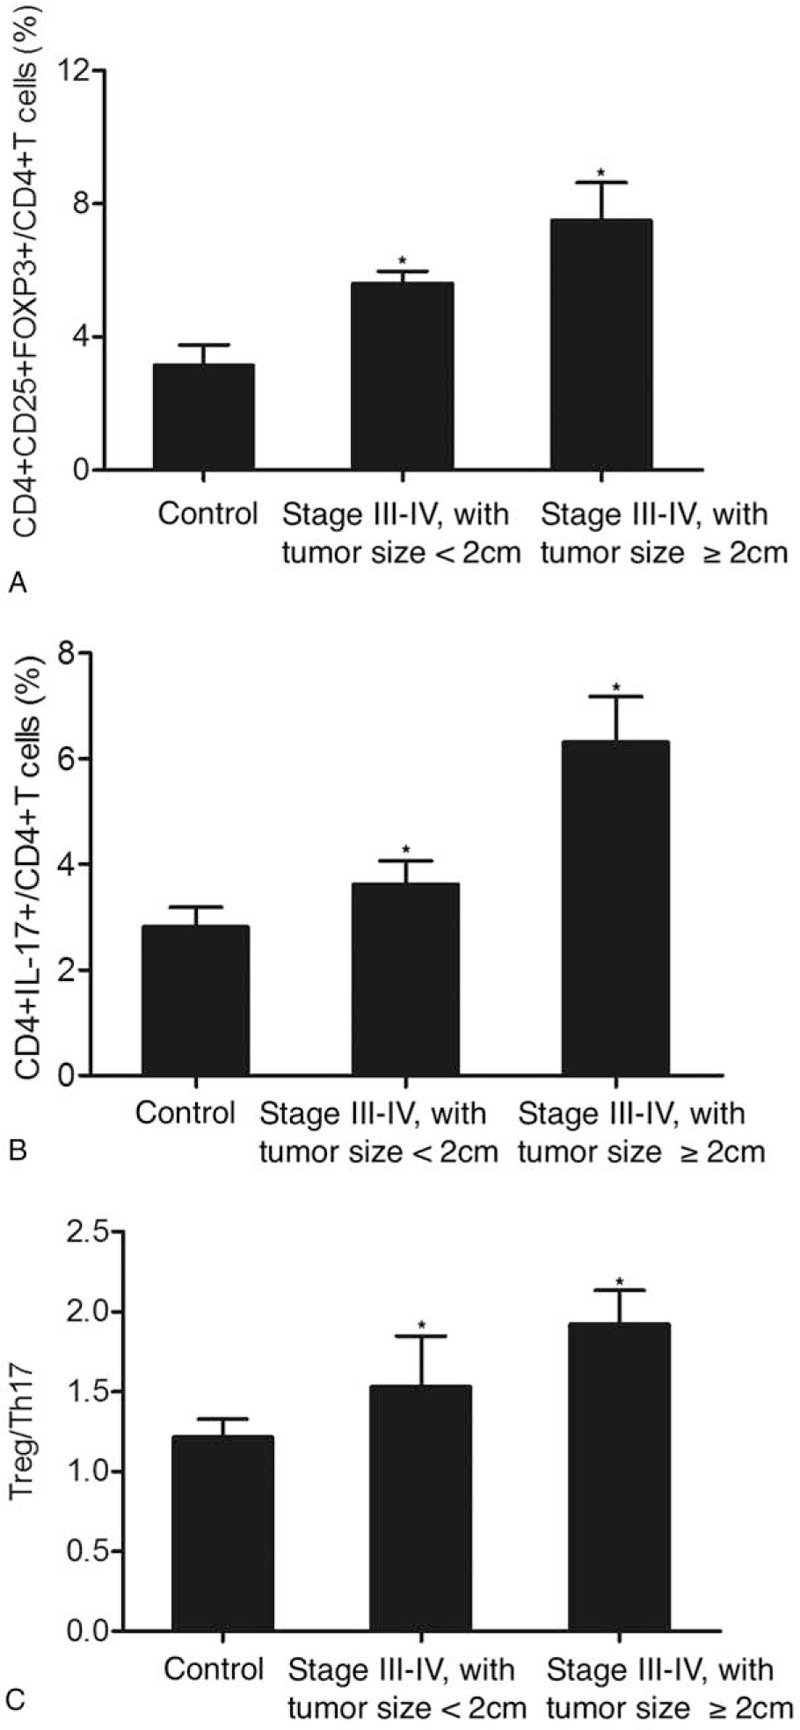
Proportions of Treg/Th17 cells and Treg/Th17 ratio in advanced stage (stage III-IV) patients with different tumor sizes (∗P-value < .0001 compared with Control group). (A) Proportion of CD4+CD25+FOXP3+Treg cells in advance stage patients with a tumor size of ≥2 cm and a tumor size of <2 cm; (B) Proportion of CD4+IL17+Th17 cells in advance stage patients with a tumor size of ≥2 cm and a tumor size of <2 cm; C. Treg/Th17 ratio in advance stage patients with a tumor size of ≥2 cm and a tumor size of <2 cm. Th17 = T helper 17, Tregs = T-regulatory cells.
Figure 7.
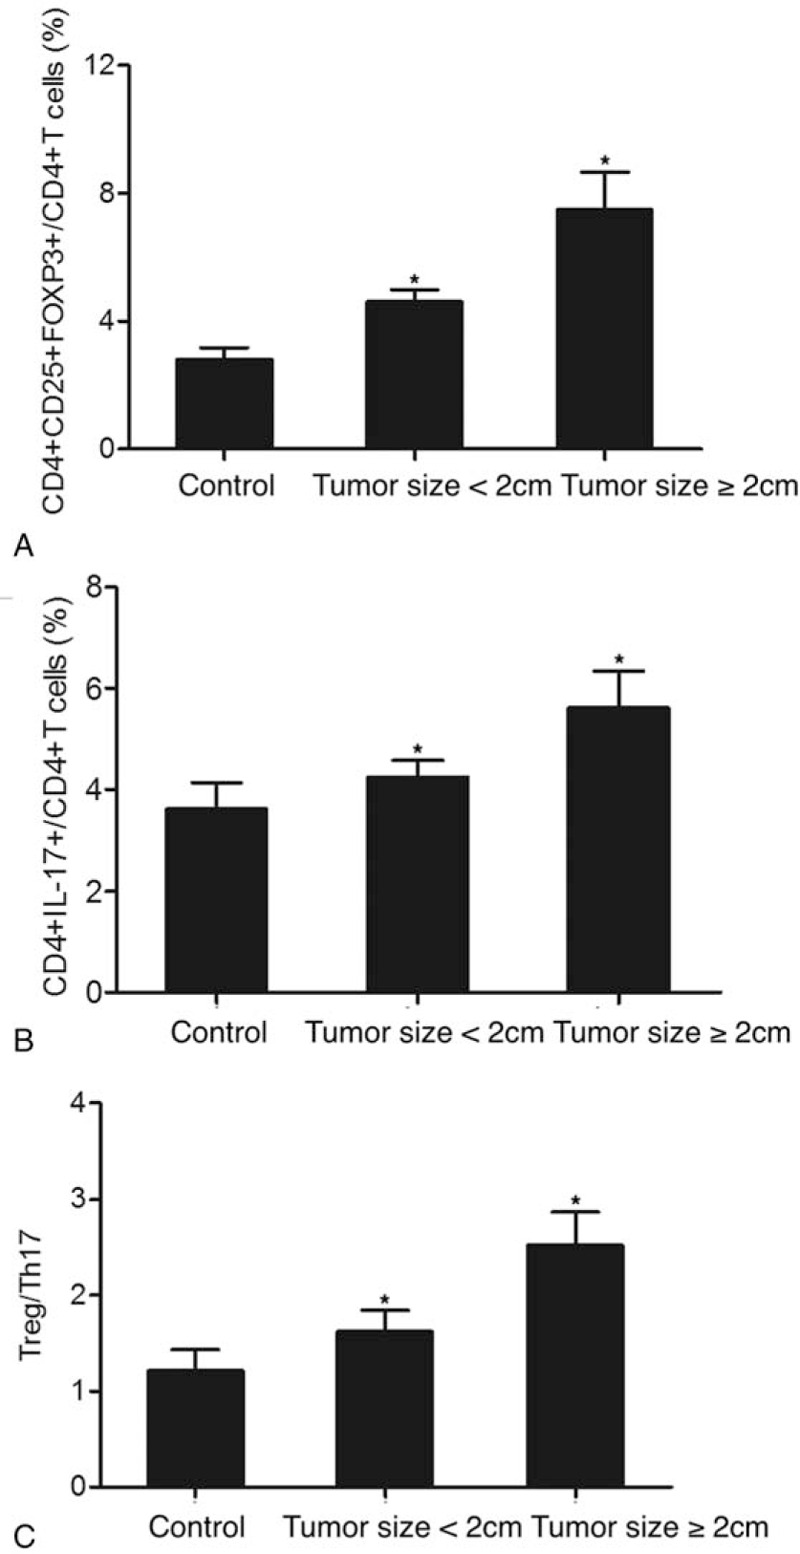
Proportions of Treg/Th17 cells and Treg/Th17 ratio in patients with different tumor sizes (∗P-value < .0001 compared with Control group). (A) Proportion of CD4+CD25+FOXP3+Treg cells in patients with a tumor size of ≥2 cm and a tumor size of <2 cm; (B) Proportion of CD4+IL17+Th17 cells in patients with a tumor size of ≥2 cm and a tumor size of <2 cm; (C) Treg/Th17 ratio in patients with a tumor size of ≥2 cm and a tumor size of <2 cm. Th17 = T helper 17, Tregs = T-regulatory cells.
4. Discussion
Elevated expression of specific chemokines and/or cytokines was detected in cancer tissues or serum from patients suffering from head and neck cancers, suggesting the role of cytokines in OSCC patients.
As a type of CD4+T cells expressing RORγT transcription factors and IL17A cytokines, Th17 cells characterized are a minor population among peripheral blood cells. However, they appear in significantly higher numbers at cancer sites and in the circulation of tumor patients. One previous study has demonstrated the correlation between an elevated number of Th17 cells and the angiogenesis of hepatocellular carcinoma.[21] Past literature has shown altered pattern in the conventional classification of Th1/Th2 cytokines to contain 2 new types of CD4+ T cells based on the profiles of their unique cytokine. These 2 types of CD4+ T cells are called Tregs and Th17 cells, which primarily synthesis TGF-β cytokines and IL17, respectively.[22] These cytokines then work with other molecules to form a tightly controlled and complex network of immune responses. The disturbance of this network can cause chronic inflammations, uncontrolled cell growth and immune dysfunctions, which ultimately lead to carcinogenesis. In addition, in terms of the equilibrium between 4 types of cytokines in oral cancer patients, increased serum expression of TGF-β1 and IL17A was detected in oral cancer patients. However, the concentration of TGF-β1 was still much higher than that of IL17A in both groups. In this research, we measured the Treg/Th17 ratio and survival rate in each recruited patient to show that the low Treg/Th17 group was associated with a better survival.
Different subsets of CD4+ T cells could not remain their homeostasis during their maintenance and differentiation.[23] Th17 and Tregs are closely related since they are originated from the same precursor in mice, whereas their differentiation relies on the activation of DC by microorganisms.[24] Also, these progenitor cells can differentiate into intermediate Treg/Th17 cells, which in turn express both Foxp3 and retinoid acid related orphan receptor.[25] Furthermore, Th17 cells and Tregs share common homing properties (CCL20) and receptors for chemokines, that is, CCR4 and CCR6.[26] Besides, the link of differentiation between Tregs and Th17 cells in human has been shown to involve TGF-β a factor critical for the production of both Tregs and Th17 cells.[24] In this research, the proportions of both CD4+CD25+FOXP3+Treg cells and CD4+IL17+Th17 cells were significantly higher in the OSCC group. Similarly, the percentage of CD4+CD25+FOXP3+Treg cells in all CD4+ T cells, as well as the percentage of CD4+IL17+Th17 cells in all CD4+ T cells, was significantly higher in the OSCC group. In addition, the Treg/Th17 ratio in the OSCC group was also higher. Furthermore, the proportions of Treg/Th17 cells increased in a stepwise fashion from the control group to the stage III-IV group, while the Treg/Th17 ratio also increased with increasing proportions of Treg/Th17 cells.
Additionally, CD4+ T cells play a central function in immune responses by promoting the function and expansion of CD8+T cells as along with the induction of B cells to synthesis antibodies.[27–29] Based on the synthesis of different types of effector cytokines, Th cells can be divided into Th22, Th9, Th17, Th2, Th1, and Tregs, which are derived from naive CD4+ T cells upon interaction with APCs. In particular, Th1 cells can secrete effector cytokines including IFN-c, while Th2 cells can secrete IL-13, IL-5, and IL-4. On the other hand, Th1 cytokines can activate cellular immune responses, whereas Th2 cytokines can activate humoral immune responses. Furthermore, IL-12 and IFN-c can activate T-bet (Tbx21) expression through STAT4 and STAT1 signaling, respectively, and, a lineage specific transcription subsequently drive the polarization of Th1.[30,31] Similarly, IL-4 can induce the synthesis of Th2 specific transcription factor GATA3 by activating STAT6 and thus inducing Th2 polarization. In this research, the proportions of Treg/Th17 cells were compared among patients with different tumor stages and different tumor sizes. Therefore, the proportions of Treg cells and Th17 cells significantly increased from tumors of early stages to tumors of advanced stages, while larger tumors (≥2 cm) showed higher proportions of Treg cells and Th17 cells compared with smaller tumors (<2 cm) at the same clinical stage. Moreover, a similar trend in the Treg/Th17 ratio was observed.
After the discovery of Th17 cells in 2005, they have been implicated in cancer immunity.[32] However, controversial results have been obtained so far. For example, the pro-tumor ability of IL-17 and Th17 was verified in both animal models and patients.[33,34] Th17 cells can uniquely synthesis IL-17 to accelerate cancer metastasis and growth via neo-vascularization.[35] At the same time, Th17 cells can trigger the synthesis of TNF-α and IL-8 to attract the recruitment of neutrophils.[36,37] However, the functions of Th17 in cancer remain elusive. A large amount of evidence has implicated Th17 in protective immunity against cancer by stimulating the synthesis of Th1 chemokines, including CXCL10 and CXCL9, and by recruiting effector cells to cancer tissues.[38] Moreover, Th17 cells can activate tumor-specific CD8+ T cells and promote DC accumulation, thus exerting an anticancer effect.[39]
5. Conclusion
In conclusion, the levels of Treg/Th17 cells, as well as the Treg/Th17 ratio, were higher in the peripheral blood of OSCC patients. While it is known that Th17 and Treg cells are important for immune-regulatory functions, the results of this study showed that Treg/Th17 cells were also implicated in the progression and prognosis of OSCC. Therefore, we can use the Treg/Th17 ratio as a prognostic index in OSCC patients. Furthermore, given the close relationship between Treg/Th17 cells and the pathogenesis of OSCC, the reduction in the levels of Treg/Th17 cells may increase the efficacy of tumor immunotherapy and improve the outcome of OSCC patients. Nevertheless, the mechanisms underlying the roles of Treg/Th17 cells in OSCC need to be further clarified.
Author contributions
Conceptualization: Lin Wang, Fuqiang Xie.
Formal analysis: Lin Wang.
Investigation: Lin Wang, Yingjie Zhang.
Methodology: Yingjie Zhang.
Resources: Yingjie Zhang.
Software: Lin Wang, Yingjie Zhang.
Supervision: Fuqiang Xie.
Writing – original draft: Lin Wang, Fuqiang Xie.
Writing – review & editing: Fuqiang Xie.
Footnotes
Abbreviations: APCs = antigen-presenting cells, DCs = dendritic cells, OSCC = oral squamous cell carcinoma, PBMCs = peripheral blood mononuclear cells, Th17 = T helper 17, Tregs = T-regulatory cells.
How to cite this article: Wang L, Zhang Y, Xie F. T-regulatory cell/T helper 17 cell imbalance functions as prognostic biomarker of oral squamous cell carcinoma – CONSORT. Medicine. 2020;99:49(e23145).
The authors have no conflicts of interest to disclose.
The datasets generated during and/or analyzed during the current study are not publicly available, but are available from the corresponding author on reasonable request.
References
- [1].Loomis D, Huang W, Chen G. The International Agency for Research on Cancer (IARC) evaluation of the carcinogenicity of outdoor air pollution: focus on China. Chin J Cancer 2014;33:189–96. [DOI] [PMC free article] [PubMed] [Google Scholar]
- [2].Muller-Hubenthal B, Azemar M, Lorenzen D, et al. Tumour biology: tumour-associated inflammation versus antitumor immunity. Anticancer Res 2009;29:4795–805. [PubMed] [Google Scholar]
- [3].Song BC, Chung YH, Kim JA, et al. Transforming growth factor-beta1 as a useful serologic marker of small hepatocellular carcinoma. Cancer 2002;94:175–80. [DOI] [PubMed] [Google Scholar]
- [4].Ebrahimi B, Tucker SL, Li D, et al. Cytokines in pancreatic carcinoma: correlation with phenotypic characteristics and prognosis. Cancer 2004;101:2727–36. [DOI] [PubMed] [Google Scholar]
- [5].Tran Janco JM, Lamichhane P, Karyampudi L, et al. Tumor-infiltrating dendritic cells in cancer pathogenesis. J Immunol 2015;194:2985–91. [DOI] [PMC free article] [PubMed] [Google Scholar]
- [6].Grulich AE, van Leeuwen MT, Falster MO, et al. Incidence of cancers in people with HIV/AIDS compared with immunosuppressed transplant recipients: a meta-analysis. Lancet 2007;370:59–67. [DOI] [PubMed] [Google Scholar]
- [7].Rani SV, Aravindha B, Leena S, et al. Role of abnormal Langerhans cells in oral epithelial dysplasia and oral squamous cell carcinoma: a pilot study. J Nat Sci Biol Med 2015;6: Suppl 1: S128–33. [DOI] [PMC free article] [PubMed] [Google Scholar]
- [8].Esteban F, Cabello FR, Gonzalez-Moles MA, et al. Clinical significance of langerhans cells in squamous cell carcinoma of the larynx. J Oncol 2012;2012:753296. [DOI] [PMC free article] [PubMed] [Google Scholar]
- [9].Chang MC, Chiang CP, Lin CL, et al. Cell-mediated immunity and head and neck cancer: with special emphasis on betel quid chewing habit. Oral Oncol 2005;41:757–75. [DOI] [PubMed] [Google Scholar]
- [10].Woo EY, Yeh H, Chu CS, et al. Cutting edge: regulatory T cells from lung cancer patients directly inhibit autologous T cell proliferation. J Immunol 2002;168:4272–6. [DOI] [PubMed] [Google Scholar]
- [11].Liyanage UK, Moore TT, Joo HG, et al. Prevalence of regulatory T cells is increased in peripheral blood and tumor microenvironment of patients with pancreas or breast adenocarcinoma. J Immunol 2002;169:2756–61. [DOI] [PubMed] [Google Scholar]
- [12].Miller AM, Lundberg K, Ozenci V, et al. CD4+CD25high T cells are enriched in the tumor and peripheral blood of prostate cancer patients. J Immunol 2006;177:7398–405. [DOI] [PubMed] [Google Scholar]
- [13].Ormandy LA, Hillemann T, Wedemeyer H, et al. Increased populations of regulatory T cells in peripheral blood of patients with hepatocellular carcinoma. Cancer Res 2005;65:2457–64. [DOI] [PubMed] [Google Scholar]
- [14].Curiel TJ, Coukos G, Zou L, et al. Specific recruitment of regulatory T cells in ovarian carcinoma fosters immune privilege and predicts reduced survival. Nat Med 2004;10:942–9. [DOI] [PubMed] [Google Scholar]
- [15].Shimizu J, Yamazaki S, Sakaguchi S. Induction of tumor immunity by removing CD25+CD4+ T cells: a common basis between tumor immunity and autoimmunity. J Immunol 1999;163:5211–8. [PubMed] [Google Scholar]
- [16].Curiel TJ. Tregs and rethinking cancer immunotherapy. J Clin Invest 2007;117:1167–74. [DOI] [PMC free article] [PubMed] [Google Scholar]
- [17].Swann JB, Smyth MJ. Immune surveillance of tumors. J Clin Invest 2007;117:1137–46. [DOI] [PMC free article] [PubMed] [Google Scholar]
- [18].Joshua DE, Brown RD, Ho PJ, et al. Regulatory T cells and multiple myeloma. Clin Lymphoma Myeloma 2008;8:283–6. [DOI] [PubMed] [Google Scholar]
- [19].Law JP, Hirschkorn DF, Owen RE, et al. The importance of Foxp3 antibody and fixation/permeabilization buffer combinations in identifying CD4+CD25+Foxp3+ regulatory T cells. Cytometry A 2009;75:1040–50. [DOI] [PMC free article] [PubMed] [Google Scholar]
- [20].Minnema MC, van der Veer MS, Aarts T, et al. Lenalidomide alone or in combination with dexamethasone is highly effective in patients with relapsed multiple myeloma following allogeneic stem cell transplantation and increases the frequency of CD4+Foxp3+ T cells. Leukemia 2009;23:605–7. [DOI] [PubMed] [Google Scholar]
- [21].Wrzesinski SH, Wan YY, Flavell RA. Transforming growth factor-beta and the immune response: implications for anticancer therapy. Clin Cancer Res 2007;13(18 Pt 1):5262–70. [DOI] [PubMed] [Google Scholar]
- [22].Koyama K, Kagamu H, Miura S, et al. Reciprocal CD4+ T-cell balance of effector CD62Llow CD4+ and CD62LhighCD25+ CD4+ regulatory T cells in small cell lung cancer reflects disease stage. Clin Cancer Res 2008;14:6770–9. [DOI] [PubMed] [Google Scholar]
- [23].Zhou L, Chong MM, Littman DR. Plasticity of CD4+ T cell lineage differentiation. Immunity 2009;30:646–55. [DOI] [PubMed] [Google Scholar]
- [24].Peck A, Mellins ED. Plasticity of T-cell phenotype and function: the T helper type 17 example. Immunology 2010;129:147–53. [DOI] [PMC free article] [PubMed] [Google Scholar]
- [25].Crome SQ, Wang AY, Levings MK. Translational mini-review series on Th17 cells: function and regulation of human T helper 17 cells in health and disease. Clin Exp Immunol 2010;159:109–19. [DOI] [PMC free article] [PubMed] [Google Scholar]
- [26].Acosta-Rodriguez EV, Rivino L, Geginat J, et al. Surface phenotype and antigenic specificity of human interleukin 17-producing T helper memory cells. Nat Immunol 2007;8:639–46. [DOI] [PubMed] [Google Scholar]
- [27].Zhu J, Paul WE. CD4 T cells: fates, functions, and faults. Blood 2008;112:1557–69. [DOI] [PMC free article] [PubMed] [Google Scholar]
- [28].Bevan MJ. Helping the CD8(+) T-cell response. Nat Rev Immunol 2004;4:595–602. [DOI] [PubMed] [Google Scholar]
- [29].Swain SL, McKinstry KK, Strutt TM. Expanding roles for CD4(+) T cells in immunity to viruses. Nat Rev Immunol 2012;12:136–48. [DOI] [PMC free article] [PubMed] [Google Scholar]
- [30].Afkarian M, Sedy JR, Yang J, et al. T-bet is a STAT1-induced regulator of IL-12R expression in naive CD4+ T cells. Nat Immunol 2002;3:549–57. [DOI] [PubMed] [Google Scholar]
- [31].Szabo SJ, Kim ST, Costa GL, et al. A novel transcription factor, T-bet, directs Th1 lineage commitment. Cell 2000;100:655–69. [DOI] [PubMed] [Google Scholar]
- [32].Harrington LE, Hatton RD, Mangan PR, et al. Interleukin 17-producing CD4+ effector T cells develop via a lineage distinct from the T helper type 1 and 2 lineages. Nat Immunol 2005;6:1123–32. [DOI] [PubMed] [Google Scholar]
- [33].Prabhala RH, Pelluru D, Fulciniti M, et al. Elevated IL-17 produced by TH17 cells promotes myeloma cell growth and inhibits immune function in multiple myeloma. Blood 2010;115:5385–92. [DOI] [PMC free article] [PubMed] [Google Scholar]
- [34].Tosolini M, Kirilovsky A, Mlecnik B, et al. Clinical impact of different classes of infiltrating T cytotoxic and helper cells (Th1, th2, treg, th17) in patients with colorectal cancer. Cancer Res 2011;71:1263–71. [DOI] [PubMed] [Google Scholar]
- [35].Qi W, Huang X, Wang J. Correlation between Th17 cells and tumor microenvironment. Cell Immunol 2013;285:18–22. [DOI] [PubMed] [Google Scholar]
- [36].Iida T, Iwahashi M, Katsuda M, et al. Tumor-infiltrating CD4+ Th17 cells produce IL-17 in tumor microenvironment and promote tumor progression in human gastric cancer. Oncol Rep 2011;25:1271–7. [DOI] [PubMed] [Google Scholar]
- [37].Gu FM, Li QL, Gao Q, et al. IL-17 induces AKT-dependent IL-6/JAK2/STAT3 activation and tumor progression in hepatocellular carcinoma. Mol Cancer 2011;10:150. [DOI] [PMC free article] [PubMed] [Google Scholar]
- [38].Kryczek I, Banerjee M, Cheng P, et al. Phenotype, distribution, generation, and functional and clinical relevance of Th17 cells in the human tumor environments. Blood 2009;114:1141–9. [DOI] [PMC free article] [PubMed] [Google Scholar]
- [39].Martin-Orozco N, Muranski P, Chung Y, et al. T helper 17 cells promote cytotoxic T cell activation in tumor immunity. Immunity 2009;31:787–98. [DOI] [PMC free article] [PubMed] [Google Scholar]


