. 2020 Nov 16;9:e61265. doi: 10.7554/eLife.61265

Figure 4. Hsf1 is upregulated in 6-month-old APP mice.

(A) Boxplot depicts distribution of expression levels of Hsf1 gene among different age groups of mice between wild type and APP. Values are based on TPM counts of long-RNA-seq data. Statistical significance (p value threshold 0.05) for the comparison between 6-month-old APP and 6-month-old WT (p=0.03) (n = 3/group, unpaired non-directional t-test). All the other comparisons between groups and different ages are non-significant. (B) Expression levels of Hsf1 in 6-month-old mice as defined by RT-qPCR. Statistical significance (p value threshold 0.05) for 6-month-old APP greater than 6-month-old WT (depicted as asterisk, unpaired directional t-test, n = 3/group, error bars represent standard deviation from the mean).

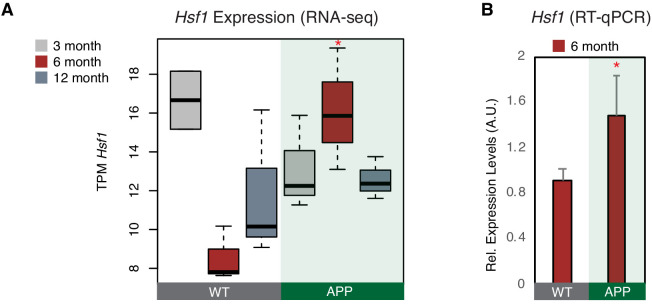
Figure 4.

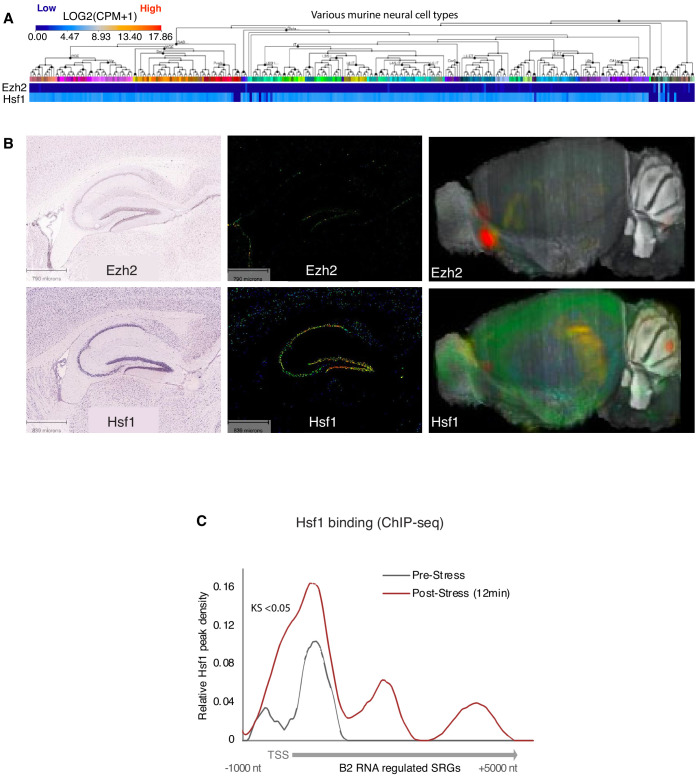
Figure 4—figure supplement 1. Expression of Hsf1 in neural tissues.

Figure 4—figure supplement 1.

(A) Mouse cortex and hippocampus gene expression levels for Ezh2 and Hsf1 depicted in the Allen Brain Atlas Transcriptomics explorer showing limited expression of Ezh2 across multiple neural tissues compared to Hsf1. Levels are per cell type based on RNA-seq data. (B) In situ hybridization brain image data with cellular-level resolution for Ezh2 (upper panel) and Hsf1 (lower panel) depicting low expression levels for Ezh2. Left panel, ISH images, middle panel, gene expression images, right panel, expression in 3D reconstructed whole mouse brain. (C) Metagene analysis of increase in Hsf1 binding (ChIP-seq data) across the start of B2 RNA regulated genes (Supplementary file 1) between pre-stress and 12 min post-stress (KS <0.05). ChIP-deq data are from Mahat et al., 2016. TSS represents the Transcription Start Site of these genes. This figure provides the rational why we started investigating Hsf1 as a candidate with a potential relation to B2 Biology and a potential effect on B2 RNA processing.
© 2015, Allen Institute for Brain Science
Image credit: The image in panel A was taken from the Allen Mouse Brain Atlas, available at: https://portal.brain-map.org/atlases-and-data/rnaseq#Mouse_Cortex_and_Hip. The images for panel B were taken from the Allen Mouse Brain Atlas, available at https://mouse.brain-map.org/experiment/show/100142521 for Eh2 and https://mouse.brain-map.org/experiment/show/68196972 for Hsf1. These panels are not covered by the CC-BY 4.0 licence and further reproduction of this panel would need permission from the copyright holder.