Abstract
De novo formation of the double-membrane compartment autophagosome is seeded by small vesicles carrying membrane protein autophagy-related 9 (ATG9), whose function remains unknown. Here we find that ATG9A scrambles phospholipids of membranes in vitro. Cryo-EM structures of human ATG9A reveal a trimer with a solvated central pore, which is connected laterally to the cytosol through the cavity within each protomer. Similarities to ABC exporters suggest that ATG9A could be a transporter that uses the central pore to function. Moreover, molecular dynamics simulation suggests that the central pore opens laterally to accommodate lipid headgroups, thereby enabling lipids to flip. Mutations in the pore reduce scrambling activity and yield markedly small autophagosomes, indicating that lipid scrambling by ATG9A is essential for membrane expansion. We propose ATG9A acts as a membrane-embedded funnel to facilitate lipid flipping and to redistribute lipids added to the outer leaflet of ATG9 vesicles, thereby enabling growth into autophagosomes.
Introduction
The catabolic process autophagy plays crucial roles in the maintenance of cellular health, and its defects are associated with human diseases, such as infection, neurodegeneration, and cancer1,2. In autophagy, a portion of the cytoplasm is sequestered within the autophagosome as a result of de novo formation of this double-membrane compartment in the cytoplasm3. Upon maturation, the outer membrane of the autophagosome fuses with lysosomes, leading to the degradation of the inner membrane and the sequestered materials. Autophagosome formation begins when Golgi-derived small vesicles loaded with the membrane protein ATG9 (termed ATG9 vesicles) translocate to a site adjacent to the ER4–17 (Fig. 1a). Subsequently, the sheet-shaped double-membrane precursor (termed phagophore or isolation membrane) emerges and grows into a cup-like shape so as to enwrap a cytoplasmic portion with a diameter of ~0.5–1 μm18. Finally, the rim closes, yielding the matured autophagosome.
Fig. 1. The structure of ATG9A.
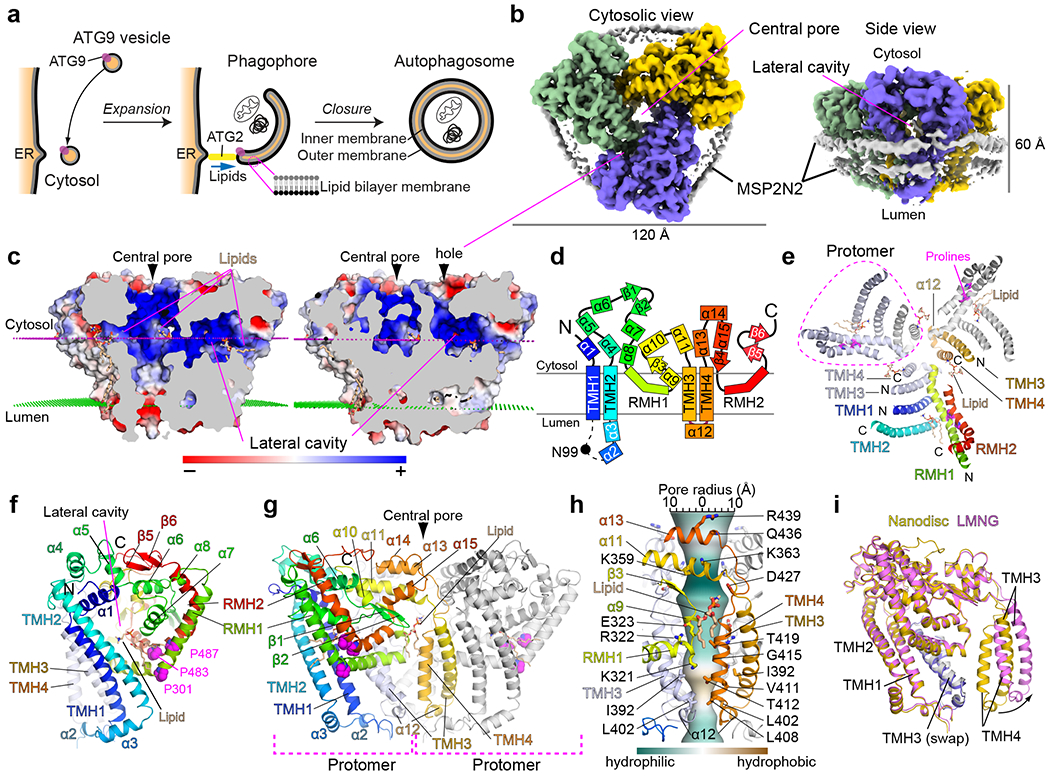
a, Model of autophagosome formation. Black and gray lines indicate monolayers of a lipid bilayer (membrane). b, Cytosolic (left) and side (right) views of the unsharpened cryo-EM map of ATG9A embedded in the MSP2N2 nanodiscs. c, Side cut-away views of ATG9A colored with electrostatic potential. Magenta and green dotted lines are cytosolic and luminal membrane surfaces determined by the PPM server. Positively and negatively charged surfaces are indicated by blue and red colors, respectively. d, The transmembrane topology of ATG9A. e, A cytosolic view of the structure. Cytosolic parts are not shown to visualize the membrane-domain clearly. A monomer is colored in rainbow and the other two monomers are shown in blue, white and gray. f, The structure of the protomer. g, A side view of the ATG9A trimer. h, Central pore-forming residues. The pore surface was calculated by CHAP and is colored to show hydrophobicity of the pore as indicated. i, Superposition of the protomers of the nanodisc and LMNG structures.
Although ATG9 vesicles may be the seeds of the phagophore4,8,19, it remains unclear as to how and why these specific vesicles might grow into the autophagosome. A clue comes from studies of the lipid transfer protein ATG2, which transports lipids from the ER to the phagophore to expand the phagophore20–22. Because ATG2 inserts lipids only into the outer leaflet of the phagophore membrane, a mechanism must exist to transport half of the absorbed lipids into the inner leaflet for the expansion of the bilayer. Such transport could be mediated by a membrane protein on the phagophore, designating ATG9 a prime candidate for playing a role.
ATG9 proteins vary in their chain lengths, ranging from ~700–1000 residues, with both N- and C-termini significantly different among species. Common to all species is the central ~500-residue region containing six predicted transmembrane helices (TMHs)23–25. This region has been shown to self-oligomerize26, likely to form a homotrimer25. However, the function of ATG9 and the role of self-oligomerization are unknown. We postulated that the core membrane-spanning domain is responsible for the lipid transport and performed structural, bioinformatics, computational, biochemical, and cellular studies on this domain of human ATG9A.
Our results reveal that ATG9A forms a stable trimer with a dynamic central pore that can open and close. ATG9A exhibits lipid scrambling activity in vitro, which is suggested to be mediated by the open conformation. Compromising lipid scrambling activity of ATG9A by mutations reduces autophagosome size. We propose that ATG9A-mediated lipid scrambling plays a crucial role in the lipid transport system that enables phagophore expansion.
RESULTS
Structure of ATG9A
We determined ~3.4 Å resolution structures by cryo-electron microscopy (cryo-EM) using ATG9A stabilized by amphipols or embedded in MSP2N2 nanodiscs and also obtained a low-resolution reconstruction in lauryl maltose neopentyl glycol (LMNG) detergent micelles (Supplementary Fig. 1–5, Table 1). The nanodisc and amphipol EM maps resolved most sidechains, allowing us to unambiguously build atomic models of the residues 36–532 of ATG9A (except 96–107). The two structures are nearly identical (the pairwise root mean square distances of all Cα atoms is 0.68 Å; Extended Data Fig. 1a). Thus, the amphipol structure will not be discussed hereafter. ATG9A forms a tri-lobed trimer with a diameter of ~120 Å and a thickness of ~60 Å and the trimeric assembly creates the wide central pore (Fig. 1b). Lobes themselves are hollow—each contains an extended cavity that laterally connects the central pore to openings exposed to the cytosol and cytosolic half of the bilayer (Fig. 1c). A lipid molecule is bound in the lateral cavity at the bottom of its entrance from the membrane. It is positioned just below the membrane surface and oriented laterally with its headgroup and tail pointing to the central pore and the membrane, respectively. Otherwise, the central pore and lateral cavities are mostly hydrophilic and overall positively charged, suggesting that both are solvated.
Table 1.
Cryo-EM data collection, refinement and validation statistics for human ATG9A (1–578)
| ATG9A in amphipols (EMD-22375, PDB 7JLO) | ATG9A in nanodiscs (EMD-22376, PDB 7JLP) | ATG9A in LMNG micelles (EMD-22377, PDB 7JLQ) | |
|---|---|---|---|
| Data collection and processing | |||
| Magnification | ×73,000 | ×73,000 | ×73,000 |
| Voltage (kV) | 200 | 200 | 200 |
| Electron exposure (e−/Å2) | 66.2 | 66.6 | 66.6 |
| Defocus range (μm) | −0.5 to −1.8 | −0.5 to −1.8 | −0.5 to −1.8 |
| Pixel size (Å) | 0.567 | 0.567 | 0.567 |
| Symmetry imposed | C3 | C3 | C3 |
| Initial particle images (no.) | 497,665 | 766,965 | 256,059 |
| Final particle images (no.) | 21,710 | 18,276 | 40,116 |
| Map resolution (Å) | 3.4 | 3.4 | 4.0 |
| FSC threshold | 0.143 | 0.143 | 0.143 |
| Map resolution range (Å) | 3.0–10 | 3.0–11 | 3.6–31 |
| Refinement | |||
| Initial model used | De novo | PDB 7JLO | PDB 7JLP |
| Model resolution (Å) | 3.4 | 3.4 | 4.3 |
| FSC threshold | 0.5 | 0.5 | 0.5 |
| Map sharpening B factor (Å2) | −71.4 | −69.9 | −119.9 |
| Model composition | |||
| Non-hydrogen atoms | 11964 | 12891 | 11700 |
| Protein residues | 1455 | 1455 | 1422 |
| Ligands | − | POV: 45 | − |
| B factors (Å2) | |||
| Protein | 34.54 | 25.96 | 126.57 |
| Ligand | – | 28.42 | – |
| R.m.s. deviations | |||
| Bond lengths (Å) | 0.004 | 0.003 | 0.007 |
| Bond angles (°) | 0.589 | 0.499 | 0.980 |
| Validation | |||
| MolProbity score | 1.67 | 1.49 | 1.85 |
| Clashscore | 5.66 | 3.79 | 12.41 |
| Poor rotamers (%) | 0.46 | 0.70 | 0.71 |
| Ramachandran plot | |||
| Favored (%) | 94.80 | 95.43 | 96.38 |
| Allowed (%) | 5.20 | 4.57 | 3.62 |
| Disallowed (%) | 0.00 | 0.00 | 0.00 |
Consistent with previous reports23,24, the N- and C-termini are in the cytosol, and the glycosylation site Asn99 is in the lumen (Fig. 1d). However, only four of the six predicted TMH regions fully transverse the membrane, and the remaining two are reentrant membrane helices (RMHs) that enter and exit the membrane from the cytosolic side. Accordingly, the membrane topology differs from proposed23–25, with only two loops in the lumen. The N- and C-terminal halves are topologically repeated: each half starts with a TMH hairpin, followed by an RMH (TMH1–TMH2–RMH1 in the N-terminus and TMH3–TMH4–RMH2 in the C-terminus). The TMH1–2 and TMH3–4 hairpins align parallelly in the order of TMH4-3-1-2 from the central pore to the outside of the trimer (Fig. 1e). TMH1/2/3 are longer (>27 residues) and tilted by ~45° with respect to the membrane, whereas the pore-lining TMH4 is shorter (14 residues) and tilted only by ~10° (Fig. 1f). Both RMHs are kinked by proline residues at the middle of each helix, forming elbow-like shapes (Fig. 1g). Notably, the TMH3–4 hairpins are circularly swapped among the three lobes, defining the protomer consisting of two polypeptide chains (Fig. 1e–g). TMH1 and TMH3 make substantial contacts with each other, and TMH1/2/3 are all bound by laterally oriented C-terminal half of RMH1, indicating that ATG9A is a stable trimer locked by the circular interdigitation of the monomers. RMH1 appears to be further stabilized by antiparallelly aligned RMH2 on the opposite side from TMHs. The cytosolic elements assemble into a flat structure to bridge TMH1/2/3 and RMH1/2. Conserved residues are mostly concentrated in the cytosolic region and make substantial contacts within (Extended Data Fig. 1b), suggesting that their roles are to build the cytosolic domain. Altogether, TMH1/2/3, RMH1/2, and cytosolic elements appear to cooperate to create the protomer with a large cavity embedded in the membrane.
The central pore spans ~60 Å overall, with α11 and α13 forming the entrance at the cytosolic side (Fig. 1h). However, the pore is open to the cytosol underneath α11, where a lipid molecule inserts its headgroup. The membrane-embedded region of the pore is constructed of TMH4, the C-terminal end of TMH3, and the turn between RMH1 and the succeeding α9. Charged residues in the RMH1–α9 turn (Lys321/Arg322/Glu323) and small amino acids on TMH4 (Thr412/Gly415/Thr419) together make the middle region of the pore wide and hydrophilic. The pore is slightly hydrophobic in the bottom region and comes to its narrowest point at the luminal exit, which is limited by Leu402 on α12 and Leu408 on TMH4. Thus, overall, the pore resembles those of ion channels with a hydrophobic gate27. However, with a diameter of 6Å and a moderate hydrophobicity at the exit, the pore is likely permeable (see below).
3D reconstruction of the LMNG samples suffered from preferred specimen orientation of particles and poor alignments of lateral views (Supplementary Fig. 3,4). Nonetheless, the map was clear enough to perform rigid-body docking of the nanodisc structure, which revealed that individual protomers, but not the intact trimer, fit well into the map. A hinge-like movement of the loops connecting the TMH3–4 hairpin to the rest of the monomer separate protomers away from each other, creating a ~7Å gap between them (Fig. 1i and Extended Data Fig. 1c–h). Thus, it appears that ATG9A can adopt two conformations in which the central pore is closed or laterally opened.
Duplicated topology and similarities to type I ABC exporters
The N- and C-terminal halves share not only the membrane topology but also the tertiary topology: both TMH hairpins are flanked at the cytosolic side by perpendicularly oriented α-helices that adopt similar antiparallel interactions (α1 and α4 flanking TMH1–2; α11 and α13 flanking TMH3–TMH4), with the C-terminal helix from each half (α4 and α13) facing the cytosolic surface (Fig. 2a and Extended Data Fig. 2a–c). RMH1/2 are both positioned roughly on the same side with respect to their preceding TMH hairpin. Their superposition-derived structure alignment reveals amino acid similarities, particularly around the conserved proline residues that kink each RMH and potentially dictate their reemergence on the same side of the membrane28 (Fig. 2b). Despite these local similarities, it is not possible to superpose all corresponding TMHs/RMHs simultaneously (Extended Data Fig. 2d). However, a flexible structure alignment server FATCAT could superimpose the two halves with four twists, assigning significance (p-value of 1.36e-02) to their similarity (Extended Data Fig. 2e). These structural similarities at the primary, secondary, and ternary levels, collectively suggest that the N- and C-terminal halves are duplicates (Extended Data Fig. 2f).
Figure 2. Dissection of the ATG9A architecture.
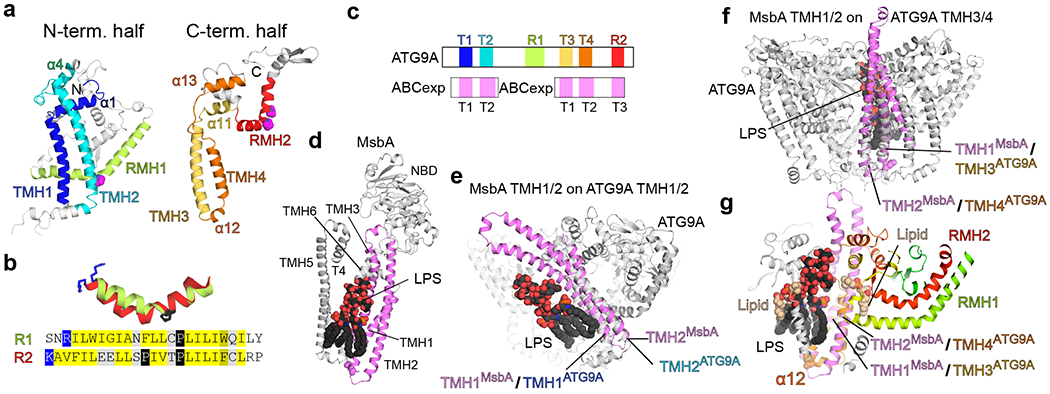
a, The N- and C-terminal fragment structures of ATG9A. The fragments are shown in similar orientations. b, Superposition of RMH1 and RMH2 helices and their aligned sequences. c, Diagram of the primary structure of ATG9A with matches to ABC transporters. d, MsbA structure bound to LPS (PDB 6BPP). Only the monomer is shown for clarity. e–g, Superpositions of MsbA TMH1/2 onto TMH1/2 (e) and TMH3/4 (f, g) of ATG9A. For MsbA, only TMH1–3 and the bound LPS are shown for clarity. Shown in g is a cut-away view of the central pore of ATG9A with the superposed MsbA and LPS.
While the overall structure of ATG9A adopts a novel topology, we wondered if the two halves are commonly related to other proteins and performed sequence similarity searches with the N- and C-terminal fragments against known structures. Both halves identified overlapping sets of ABC transporters (Fig. 2c, and Supplementary Data 1). These structures belong to the type I ABC exporter fold (ABCexp), whose transmembrane domain (TMD) consists of six TMHs29. The similarities are limited to the N-terminal halves of ABCexps’ TMDs. The N-terminal TMH1–2 hairpins of ABCexps are aligned with the both TMH hairpins of ATG9A. Additionally, TMH3 of ABCexps are aligned with RMH2 in the C-terminal half of ATG9A but not with RMH1 in the N-terminal half. This discrepancy could result from either an incorrect extension of the C-terminal alignment or an inability to extend the N-terminal alignment due to a long insertion. In this case, ABCexps’ TMH3 could be related to the RMHs by acquiring a central proline that flips the C-terminus to reemerge28. Searches with longer ATG9 sequences, including those from other species, yielded consistent results: The N-terminus of ABCexps were aligned with both halves of ATG9 with the majority of the alignment matching its C-terminal half (Supplementary Data 1). While the sequence similarity is remote, the common and consistent identification of ABCexp using both halves supports the observed duplication in ATG9A and our original hypothesis that ATG9A could be a transporter.
Type I ABC transporters are dimers and generally bind their substrates between the two monomers, with substrate binding residues contributed from TMH230–33. Using the lipid flippase MsbA bound to lipopolysaccharide (LPS) as a representative of ABCexps (Fig. 2d), we superimposed its TMH1/2 with both sequence-related halves of ATG9A. Superposition with the N-terminal half locates the LPS at the outside of the ATG9A trimer (Fig. 2e), whereas superposition with the C-terminal half places the substrate in the central pore (Fig. 2f), with the hydrophilic headgroup near the lateral cavity and the hydrophobic tail extending towards the luminal opening (Fig. 2g). Notably, the placed LPS partially overlaps with a lipid molecule bound to the outer surface of the protomer-protomer interface in the nanodisc structure. Superpositions with other ABCexps, such as YbtQ32 and MRP133, also place their substrates in the central pore of ATG9A (Extended Data Fig. 3). Altogether, these results suggest that the central pore of ATG9A may accommodate substrates, such as lipids.
Lateral opening of the central pore
We performed an atomistic molecular dynamics (MD) simulation of the nanodisc structure in explicit solvent to gain insights into protein dynamics in the membrane and interactions with lipid and solvent molecules. During a 1μs-long simulation, the protomers remained stable, holding the trimer intact (Fig. 3a and Supplementary Video 1). The lipid-binding sites in all three lateral cavities were eventually occupied by lipid molecules, and all of them adopted a conformation similar to the one observed in the nanodisc structure (Fig. 3a and Extended Data Fig. 4). As indicated by the cryo-EM structure, the central pore is highly solvated and permeable (Fig. 3b). The lateral cavity is also solvated, which, together with the connected central pore, creates a funnel-shaped solvent pool below the membrane surface. Notably, the integrity of the central pore was disrupted (Fig. 3a, 3c, 3d and Extended Data Fig. 4): the protomer-protomer interface gradually opened from underneath Lys321 on the RMH1–α9 turn at the luminal side. Consequently, neighboring lipids on the luminal leaflet inserted their headgroups into the pore through the opened interface, reorienting themselves laterally with their tails remaining in the hydrocarbon core of the bulk membrane. Later, the cytosolic side of this interface was disrupted as observed in the LMNG structure, allowing a lipid on the cytosolic side (#258 in the simulation), which had been bound to the protomer interface similarly as to the lipid observed in the nanodisc structure (Fig. 3a), to insert its headgroup into the pore (Fig. 3a, 3c, 3d). These behaviors of the lipids resemble the incipient event of flipping of lipids between the leaflets of membranes, and those laterally oriented lipids could represent intermediate states during flipping. These data, together with the fact that ATG9A lacks an ATPase domain, led us to hypothesize that ATG9A could act as an energy-independent lipid scramblase.
Figure 3. Conformational stability of ATG9A.
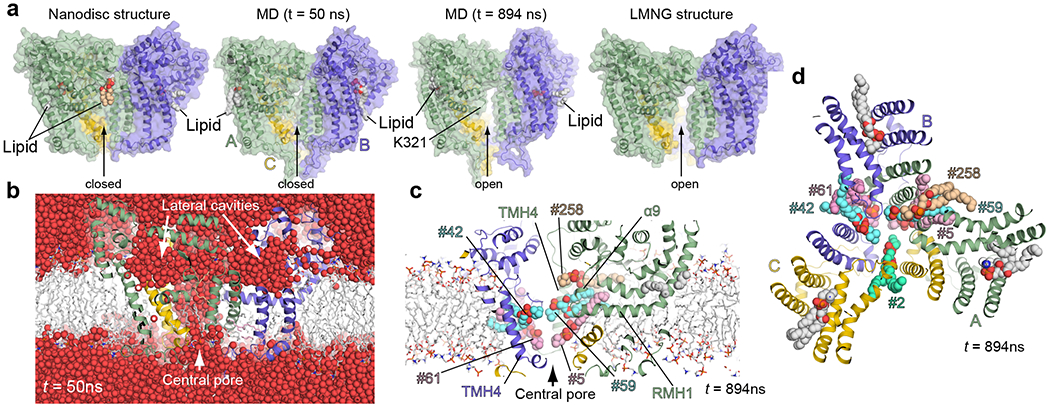
a, Comparisons of the cryo-EM structures (nanodisc on the left and LMNG on the right) with snapshots (t = 50 and 894 ns) of the MD simulation of the nanodisc structure. For the nanodisc structure, modeled lipids of interest are shown. MD snapshots are shown with the lipids that enter the lateral cavities. Lipids that enter the central pore are not shown for clarity. The snapshots t = 50 and 894 ns are representative of closed and open conformations, respectively. b, Solvation of the central pore and the lateral cavities. The snapshot of the MD simulation at t =50 ns (still closed) is shown with water molecules as red spheres. c,d, Lipid molecules (spheres) penetrate into the central pore through the protomer-protomer interface. Side (c) and top (d) views at t = 894 ns are shown with penetrating lipids (numbered). Analyses of the trajectories of these lipids are presented in Extended Data Fig. 4. The lipids bound in the lateral cavities at t = 894 ns are in orientations similar to the one observed in the cryo-EM nanodisc structure.
Phospholipid scrambling activity of ATG9A
To test the hypothesis above, we adopted a widely performed fluorescence-based lipid scramblase assay34. In this assay, a trance amount of nitrobenzoxadiazole (NBD)-conjugated lipids is doped in liposomes, where NBD probes in the outer leaflet are quenched irreversibly by dithionite (Fig. 4a). As shown, control liposomes with no proteins lost ~50% fluorescence upon addition of dithionite, confirming that the NBD probes are distributed evenly between the two leaflets and spontaneous lipid flipping is negligible in this experimental time window. In contrast, NBD fluorescence of ATG9A-reconstituted proteoliposomes decreased to ~30%, indicating that NBD-lipids in the inner leaflet were exposed to dithionite. Assays with phosphatidylcholine (PC), phosphatidylethanolamine (PE), phosphatidylserine (PS) conjugated with NBD at their tails and PE with NBD at its headgroup yielded similar results. We confirmed the integrity of ATG9A proteoliposomes by liposome flotation and dynamic light scattering (Supplementary Fig. 6) and observed that dithionite does not permeate through ATG9A proteoliposomes (Extended Data Fig. 5). Thus, the over 50% loss of fluorescence observed in the lipid scramblase assay suggests that the NBD-lipids in the inner leaflet flipped to the outer leaflet of the proteoliposome membranes. To further strengthen this conclusion, we conducted an alternative “back extraction” lipid scramblase assay34–36, in which membrane-impermeable lipid-free BSA preferentially extracts NBD probes and quenches fluorescence by ~50% (Extended Data Fig. 6). We observed that BSA extracts more NBD lipids from ATG9A proteoliposomes than control liposomes, also suggesting that the inner NBD-lipids flipped to the outer leaflet. Altogether, these data indicate that ATG9A scrambles phospholipids in vitro.
Figure 4. Functional studies of ATG9A.
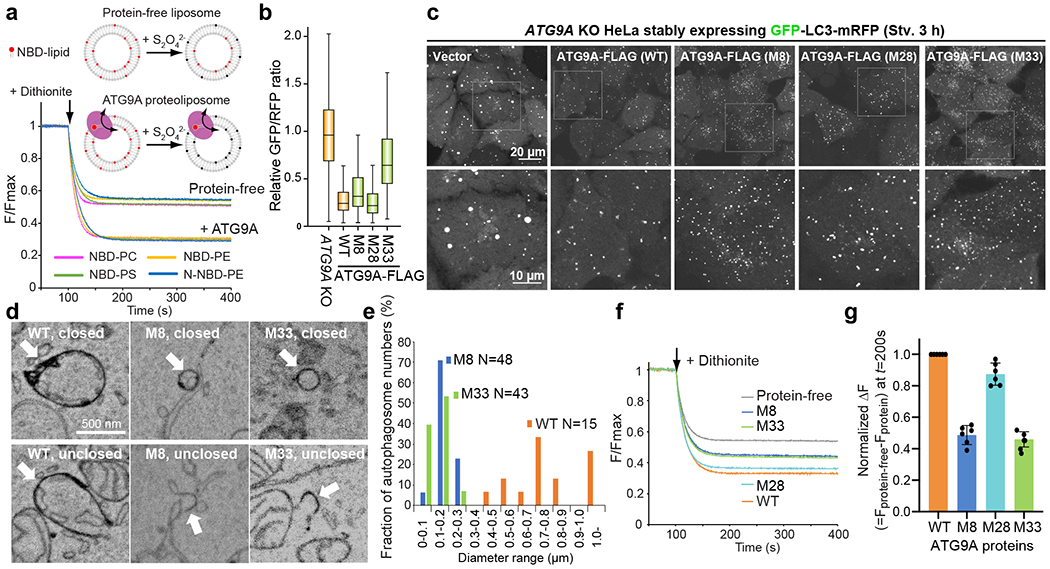
a, Schematic of in vitro lipid scramblase assay with ATG9A. Results of experiments using various NBD-lipid probes are shown. Each trace is the average of three experiments with proteoliposomes reconstituted independently using the same batch of liposomes. b, Quantitative autophagic flux assays. ATG9A KO HeLa cells stably expressing the GFP-LC3-mRFP probe and ATG9A mutants were stimulated by Torin 1, an inhibitor of mTOR. Autophagic activity of each cell was quantified as the ratio between GFP and mRFP fluorescence37. Data of cell populations (N=2500 for each cell line) are presented as box plots. The box limit, the horizontal line, and the whisker show the first and third quartiles, the median, and the minimum and maximum values, respectively. No outliers are shown. Data shown are a subset of the second-round screening presented in Extended Data Fig. 7 and were reproducible in at least another independent experiment. M8: K321L/R322L/E323L, M28: T419W, M33: M8+M28. c, GFP fluorescence images of starved (3 h) ATG9A KO HeLa cells stably expressing the GFP-LC3-mRFP probe and ATG9A-FLAG mutants. The bottom panels are expanded images of the boxed area in the top images. Data shown are representative of at least two independent experiments with similar results. d, 3D CLEM analyses of WT/M8/M33-expressing cells. e, Size distributions of autophagosomes in WT/M8/M33-expressing cells. N is the total number of closed membranes identified in each whole-cell and was used to calculate the fraction of the membranes that belong to each bin. Data are representative of at least two experiments for mutants. f, Lipid scrambling activities of ATG9A mutant proteins. Traces show the average of four experiments with independently reconstituted proteoliposomes using one batch of NBD-PE-containing liposomes. g, Relative lipid scrambling activity of ATG9A. Differences in the fluorescence values at t = 200 from that of the protein-free trace were normalized against WT. Individual data points are shown along with mean and s.d. from 6 independent experiments, each using a separate batch of liposomes. Source data for graphs are available online.
Mutations in the central pore reduce autophagosome size
To assess the relevance of the scramblase activity to autophagosome formation, we first screened ATG9A mutants for autophagic activity in a quantitative autophagy flux assay using the GFP-LC3-RFP probe37. LC3 is a ubiquitin-like protein whose C-terminus is cleaved by ATG4 protease upon biosynthesis and covalently attached to autophagosomal membranes. Because LC3 is degraded by autophagy, GFP fluorescence decreases under autophagy-inducing conditions, whereas the level of RFP, which remains in the cytosol, is not affected by autophagy. Thus, the GFP/RFP ratio reports autophagic flux quantitatively. We focused on mutating residues in the central pore and lateral cavity as these are the prominent features of the ATG9A structure. Because both pore and cavity are massive, and many residues within are not strictly conserved, we introduced multiple mutations into each mutant construct. The initial round of screening identified five mutants with reduced autophagic activity (Extended Data Fig. 7 and Supplementary Fig. 7); however, only one mutant was confirmed to express in cells. This mutant, which contained a triple leucine mutation (M8: K321L/R322L/E323L) designed to alter the hydrophobic character of the central pore, moderately (~20%) reduced autophagic activity (Fig. 4b and Extended Data Fig. 7). The second-round screening based on these results yielded consistent results: combining M8 with an additional pore mutation [M32: M8+M26(T412W); M33: M8+M28(T419W)] compromised autophagic activity more severely (~50%), while both M26 and M28 point mutants alone had no apparent effects. All of the lateral cavity mutants, except M3 and M6 that did not express at all, exhibited normal autophagic activity. The expression levels of many lateral cavity mutants, particularly those aimed at disrupting the lipid binding in the cavity, were appreciably less than those of the wild-type (WT) and central pore mutants (Extended Data Fig. 7), suggesting the integrity of the lateral cavity is critical for proper protein folding.
We examined cellular autophagosome formation mediated by the three autophagy-defective mutants (M8/M32/M33) and M26/M28 point mutants by fluorescence microscopy. In ATG9A KO HeLa cells and MEFs, GFP-LC3 formed large puncta, likely p62-ubiquitin-LC3 condensates38 (Fig. 4c and Extended Data Fig. 8). Expression of WT ATG9A, as well as M26/M28 mutants, yielded typical GFP-LC3 puncta for autophagosomes. In contrast, the autophagy-defective mutants produced smaller GFP-LC3 puncta, revealing a qualitative correlation between autophagic activity and GFP-LC3 puncta size. To resolve these small puncta structure further, we observed them by 3-dimensional correlative light electron microscopy (3D CLEM). 3D CLEM confirms that the GFP puncta observed in ATG9A KO HeLa cells are not autophagosomes and those in WT ATG9A-expressing cells are typical autophagosomes and balloon-shaped phagophores with sizes ranging from 0.5 to 1 μm (Fig. 4d,e and Supplementary Fig. 8–10). In contrast, the GFP puncta in M8/M33-expressing cells were identified exclusively as small closed vesicles or cup/sheet-shaped membranes with sizes ranging from ~100 to ~300 nm. 3D reconstruction of one of these small unclosed membranes generated a cup-shaped structure that resembles growing phagophores (Supplementary Video 2). Given the retained autophagic activity of these cells, we conclude the small LC3-positive structures are mini-autophagosomes and their precursors. Because the number of lipid molecules constituting an autophagosome determines the size of the autophagosome, the observation of mini-autophagosome formation suggests that the mutations in the central pore limited the lipid supply for building autophagosomal membranes.
Central pore mutations reduce lipid scrambling activity
Finally, we examined lipid scrambling activity of the M8/M28/M33 mutant proteins. We found that the mutants raise the plateau of the reaction curve, indicating that the fractions of active proteins decrease with these mutations compared with the WT (Fig. 4f). We confirmed that these mutant proteins retained the trimeric state and were reconstituted into proteoliposomes in a similar efficiency as WT (Supplementary Fig. 11), allowing us to conclude that the mutations indeed reduced lipid scrambling.
Overall, these data indicate that the central pore is essential for lipid scrambling, aligning well with the results from the structural analyses and MD simulation described above. As measured by the increases of the plateaus from that of WT, the M8/M33 mutants exhibited ~50–55% reduced scrambling activities (Fig. 4g), whereas the M28 mutation reduced the scrambling activity only marginally. Thus, there is a qualitative correlation between autophagosome size and lipid scrambling activity. While our data are insufficient to establish a causal relationship between the two, this correlation is parallel with our original hypothesis that ATG9A could be the lipid transporter required for phagophore expansion, as lipid transport into the inner leaflet of the membrane can be achieved by lipid scrambling.
Discussion
Our structural investigations suggest that ATG9A is a dynamic protein existing in multiple conformations. We propose that closed and open structures represent inactive and active conformations (Fig. 5a). The lateral opening of the solvated central pore would allow lipids to penetrate the pore where their hydrophilic headgroups could diffuse. At the same time, their hydrophobic tails would remain embedded in the interior of the membrane, facilitating lipids to flip across the bilayer. This model is similar to the “credit card” mechanism proposed for fungal TMEM16 scramblases39,40; these scramblases employ a narrow hydrophilic groove to enable vertical diffusion of lipid headgroups. In contrast, the pore of ATG9A acts as a wide membrane-penetrating solvent column, accommodating multiple lipid headgroups simultaneously without making specific protein-lipid interactions. Such a solvent column in the membrane may be unstable; the ATG9A trimeric architecture could stabilize the solvent column by turning it to a funnel-like shape through connecting the central pore to the three lateral cavities (Fig. 3b and 5b). In conclusion, we propose ATG9A creates a funnel-shaped solvent pool in the membrane to catalyze non-directional lipid flipping, thereby scrambling lipids between leaflets of the bilayer. According to this model, the protein activity could be regulated through conformational exchange between the open and closed states. The mutants exhibiting reduced scrambling activities seem to prefer to remain inactive, as indicated by the increased plateaus (Fig. 4f). Thus, understanding the conformational stability of these mutants would help elucidate the mechanism of lipid scrambling.
Figure 5.
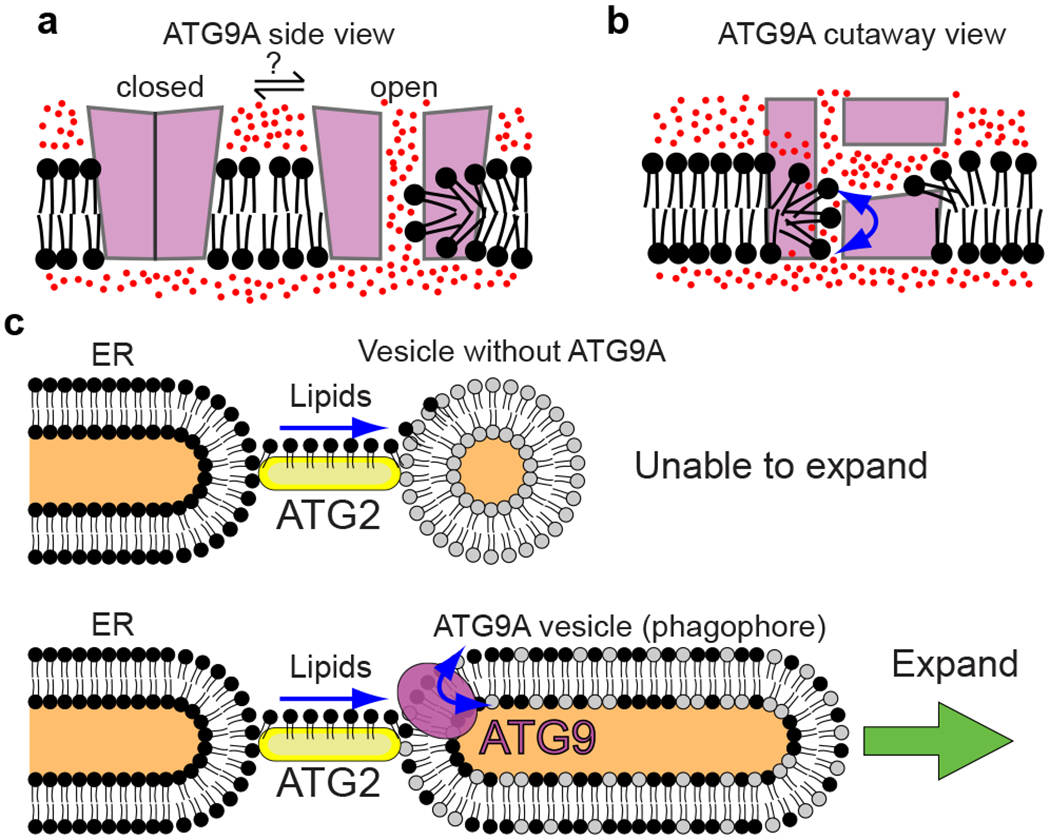
Models. a,b, Model of the scramblase activity of ATG9A. The side view of the closed and open conformations of ATG9A (a). A cutaway view (b) of the open conformation. Water molecules were depicted as red dots. c, Model of phagophore expansion. ATG2 transports lipids (black) from the ER. Vesicle lacking ATG9A is unable to expand (top). A phagophore with ATG9A is able to expand upon re-distribution of transported lipids (black) between leaflets of the bilayer by ATG9A.
While lipid scrambling activity of ATG9A in cells has not been confirmed, the presented results allow us to propose a provisional yet rational model of phagophore formation (Fig. 5c): an ATG9 vesicle is recruited to the ER and then tethered to the ER by ATG2, inducing lipid transfer from the ER to the vesicle; the lipids absorbed onto the outer leaflet of the vesicle are redistributed between leaflets of the bilayer by ATG9, leading to the expansion of the membrane into the phagophore. Note that similar to ATG2-mediated lipid transfer, ATG9-mediated lipid scrambling is a bi-directional diffusion reaction that operates without extra energy inputs. Thus, our model assumes that the lipid delivery from the ER is rectified, but the underlying mechanism is unknown. According to this model, inefficient lipid scrambling would slow down phagophore expansion. As long as the ER can continue supplying lipids to the phagophore for a prolonged period, slow growth would only delay the completion of autophagosome formation and should not affect the final autophagosome size. However, our data show otherwise, as the M8/M33-expressing cells produced strikingly small autophagosomes. Thus, it appears that small phagophores can proceed to the final membrane closure step without significant delay, resulting in the formation of small autophagosomes. Kinetic analysis of the formation of mini-autophagosomes observed in those mutant cells could clarify how phagophore expansion is related to the formation of the cup-like shape and the closure step.
Recently, Guardia et al. reported closed and open structures of ATG9A in LMNG micelles41, which are similar to our nanodisc and LMNG structures, respectively. Through coarse-grained large-scale MD simulations, they suggested ATG9A’s wedge-like shape could induce membrane bending and such property may allow ATG9A to localize to the highly curved tip of the growing phagophore. The wedge-like shape of the trimer is created in part by the tilted TMH1/2/3 (Fig. 1f). As shown above (Fig. 2e), the superposition of MsbA’s TMH1/2 on ATG9A’s TMH1/2 places the substrate LPS on the bulk membrane-facing residues of these TMHs. Thus, such a membrane-bending function of ATG9A could also be related to its similarity with ABCexps. The observation of central pore openings in our μs-long atomistic MD simulation led us to focus on ATG9A’s internal residues, and we reached a non-overlapping yet complementary conclusion that ATG9A is a lipid scramblase. Intriguingly, some TMEM16 family proteins have been shown to induce membrane distortion to facilitate lipid scrambling42,43; therefore, the membrane bending and lipid scrambling activities of ATG9A could be mutually related. Such a relationship might explain why ATG9A is concentrated at the phagophore tip as well as provide insights into the regulation of ATG9A’s activity.
Online Methods
Plasmids and protein preparation
Plasmids and protein expression, purification and reconstitution in amphipols and nanodiscs are described in Supplementary Note 1.
Cryo-EM grid preparation and screening
UltraAuFoil R1.2/1.3 300-mesh grids (Quantifoil) were cleaned with a 75% argon/25% oxygen gas at 15 Watts for 7s in a Solarus plasma cleaner (Gatan, Inc.). Cryo-EM grids were prepared in a cold room with a relative humidity of ~88%. A 3 μl aliquot of a protein sample (12 mg/ml amphipol-stabilized ATG9A, 9 mg/ml nanodisc-embedded ATG9A, or 3 mg/ml LMNG-solubilized ATG9A) was dispensed on a cleaned grid and incubated for ~10s. Then, the grid was blotted for ~3–4 s with a Whatman No. 1 filter paper manually and immediately dropped into liquid nitrogen-cooled liquid ethane using a custom-made plunger. Grids were transferred to a storage box and stored in liquid nitrogen until use.
Cryo-EM grids were screening on 200 keV transmission electron microscopes with side-entry cryo-holders. Visual inspection of micrographs suggested that the amphipols and nanodisc samples exhibited moderately preferred orientations (near top views), but the LMNG sample showed mostly top views. To alleviate the heavily preferred orientation and improve the overall quality of the LMNG grids, CHAPS was added to the LMNG sample immediately prior to grid preparation.
Cryo-EM data collection and processing
Cryo-EM data were collected on a Thermo Fisher Scientific Talos Arctica 200keV TEM equipped with Gatan K2 Summit direct detection camera. Microscope was aligned according to the previously published protocol44. Data collections were performed in an automated manner using the Leginon software45. Movies were acquired in the counting mode with the acquisition parameters described in Table 1. Motion correction and dose-weighting were applied on the fly using the MotionCor2 frame alignment program46 installed in the Appion data preprocessing pipeline47. CTF estimation was performed in real-time using CTFFIND448 or gCTF49 installed in the Appion pipeline. After data were collected, CTF estimation was reperformed on unweighted summed images using gCTF in Relion3.050, which was used for all the downstream processing except ab initio reconstruction. For the amphipol data, a total of 497,665 particles was picked from 2294 frame-aligned micrographs in an automated matter using a Laplacian-of-Gaussian (LoG) filter. Picked particle images were extracted (2.268 Å/pixel, 96-pixel box size) and subjected to two rounds of reference-free 2D classification. Well-resolved classes containing 203,820 particles were selected and subjected to ab initio reconstruction in cryoSPARC51. The resulting model was auto-refined in Relion3.0 with no mask and C3 imposed, yielding a 4.6 Å reconstruction. Particles were re-centered, re-extracted (1.134 Å/pixel, 192-pixel box size), and subjected to 3D auto-refinement, yielding a 3.7 Å reconstruction. This reconstruction was subjected to 3D classification with no alignment (4 classes, tau_fudge=4, C3 imposed, no mask). Well-resolved 3 classes containing a total of 203380 particles were 3D auto-refined with a mask, yielding a 3.6 Å reconstruction. After one round of 2D classification, 203,317 particles were selected and 3D auto-refined again to yield a 3.6 Å reconstruction, followed by 3D classification with no alignment (2 classes, tau_fudge=12). The better-resolved class containing 21,710 particles was further 3D auto-refined with a mask, yielding a 3.4 Å resolution reconstruction as estimated by gold-standard FSC52. Local resolution variations were calculated in Relion. 3D FSC analyses were done on the remote 3DFSC processing server53.
For the nanodisc data, 766,965 particles were auto-picked from frame-aligned micrographs using the amphipol structure as a 3D reference and extracted (2.268 Å/pixel, 96-pixel box size). After two rounds of 2D classification, 213,557 particles from well-resolved 2D classes were selected and subjected to 3D classification using the amphipol structure as the initial model (3 classes, tau_fudge=4, C3 imposed, no mask). A 3D class showing the intact ATG9A structure was obtained. A total of 60983 particles belonging to this class was re-extracted (1.134 Å/pixel, 192-pixel box size) and subjected to 3D auto-refinement with a mask, yielding a 3.8Å map. Subsequently, the particles of this class were subjected 3D classification (2 classes, tau_fudge=12) with no alignment. The 18,276 particles belonging to the better resolved class was subjected to CTF refinement, followed by 3D auto-refinement to yield a 3.4 Å resolution reconstruction as estimated by gold-standard FSC.
For the LMNG detergent data, a total of 256,059 particles was auto-picked from 866 aligned micrographs using the nanodisc structure as a 3D reference, extracted (2.268 Å/pixel, 96-pixel box size), and subjected to 2D classification. Although 2D class average images showing near top views aligned well and exhibited high-resolution features, those showing likely lateral views were of poor quality. To keep as many lateral views as possible, class averages were generously selected, yielding a stack of 159,976 particles. These images were aligned by 3D classification using the nanodisc structure as the initial model (3 classes, tau_fudge=4, no mask). A reconstruction consisting of 54,505 particles was recognized to be ATG9A and subsequently, auto-refined, yielding a 4.6 Å reconstruction. The particles belonging this reconstruction was re-centered and re-extracted (1.134 Å/pixel, 192-pixel box size) and subjected to 3D auto-refinement with a mask, yielding a 4.3 Å map. The refined map was subjected to 3D classification with no alignments (3 classes, tau_fudge=4, with mask). Two of the three resulting reconstructions were selected and (40,116 particles combined) and auto-refined with a mask, yielding a 4.0 Å reconstruction as estimated by gold-standard FSC. Consistent with the insufficient number of lateral views and the apparent difficulty in aligning them, the final reconstruction shows a poor vertical resolution. 3D FSC analysis reported the sphericity of 0.77. Although this map shows poor or no sidechain densities, the backbone density is resolved clearly enough to rigid-body fit the high-resolution structure.
Model building, refinement and structural analyses
An atomic model of ATG9A was manually built de novo into the sharpened cryo-EM map of the amphipol-stabilized sample with COOT54 and refined against the map using the real-space refinement module of PHENIX55 with secondary structure and Ramachandran restraints. The amphipol structure was docked into the cryo-EM map of the nanodisc-embedded ATG9A and refined similarly. POPC molecules were placed manually and refined again. The protomer of the nanodisc structure was manually docked into the map of the LMNG-solubilized ATG9A. The loops connecting protomers were adjusted manually, and the model was refined similarly but with additional reference model restraints. The atomic models were validated with Molprobity56 implemented in the PHENIX package. The map-to-model FSC was calculated in PHENIX. The membrane surfaces determined by the PPM server57. Electrostatic potential was calculated with APBS software58. The dimension and hydrophobicity of the pore were analyzed with CHAP59. Conservation scores were generated by the Consurf server60. Figures of molecular structures were prepared with PyMOL (https://pymol.org) and ChimeraX61.
Sequence/structure evaluation of ATG9A duplication
Sequence alignments of the ATG9A duplication were generated manually, using alignments from the structural superposition program DaliLite62 as well as the flexible protein structure FATCAT63 as guides. FATCAT superimposed the N-terminal (residue range 36–357) and C-terminal (residue range 358–532) halves of the ATG9A reporting significant similarity (p-value 1.36e-02, raw score 219). The superposition over 139 equivalent positions (RMSD 2.88A) required 4 twists, which moved the C-terminal TMHs towards RMH2 and correctly aligned conserved Pro residues from RMH1 with RMH3. The TMH from this alignment were out of register, so we limited the ATG9A duplication to the RMH alignment. Dalilite superimposed the N-terminal (residue range 36–357) and C-terminal (residue range 358–532) halves of ATG9A with a relatively low Z-score (3.9) due to the RMH twists revealed in FATCAT. Thus, we limited DaliLite superpositions to 60–147 for TMH1/TMH2 (sequence range 60–147) and residues for TMH3/TMH4 (sequence range 371–424), which aligned conserved Asp residues from the intervening loops and maintained the TMH hydrophobicity profiles for the ATG9A duplication. Finally, we generated an additional manual superposition to guide alignment of the helical bundle that includes α1, α4 and α5 from the N-terminal half with α11, α13 and α15 from the C-terminal half. As the angles of the helices in the superposition diverged, priority was placed on those residues that contribute to the hydrophobic core of the bundle.
ATG9A sequence searches were performed with HHPRED64 using various ATG9A sequences as queries and adjusting the parameters of search to include more sequences in the query multiple sequence alignments (MSA) (Supplementary Data 1). The human ATG9A sequence (default parameters) identifies ABCexp structures exclusively, with the top hit (6p6j, 74.5% probability) aligning to the hATG9A C-terminal TMH3, TMH4 and RMH2 (aligned with TMH1, TMH2 and TMH3 of ABCexp). Two of the ACBexp hits (6lr0U, 51.2% and 4pl0B 37.8%) align to the N-terminal half of hATG9A. Using local realign to increase the alignment accuracy, hits to the N-terminal hATG9A TMH1/TMH2 shortened to the corresponding TMH1/TMH2 of ABCexp (4pl0B, 48.7%). The HHPRED probabilities were increased by including more sequences in the query MSA: the hATG9A sequence query (limited to residues 1–620 to remove low complexity sequence) using PSI-BLAST search against the nr70 database aligned the ABCexp TMH1/2 (4pl0B, 74.7%) to the N-terminal TMH1/2; and a MAFFT generated MSA of the top 200 sequences (from the PSI-BLAST search) aligned the ABCexp TMH1/2 (6p6j, 88.5%) to the C-terminal TMH3/TMH4. Notably, the HHPRED alignments position the conserved Asp residues that follow TMH1 and TMH3 (used in the alignment of the duplication) with a relatively conserved Asp from the ABCexp.
Atomistic MD simulation
The nanodisc conformation of ATG9A was prepared for simulation by first manually reconstructing missing residues 96 to 107 and defining histidine protonations through a combination of the PROPKA65 algorithm and visual inspection (Supplementary Table 1). The full system was then built using CHARMM-GUI’s membrane builder66,67. The protein was embedded in a 140 × 140 Å square POPC membrane and solvated with 20 Å of water above and below the protein with a salt concentration of 0.15M NaCl plus neutralizing ions. Simulation was run with NAMD2.1368 using CHARMM36m69 parameters for the protein, CHARMM3670 parameters for lipids, and TIP3P71 for water. 10,000 steps minimization was followed by a series of equilibration runs (Supplementary Table 2) starting with fixed protein and lipids and followed by decreasing harmonic restraints on protein and lipids and finally with no restraints for a total of 17.7 ns simulation time. A single production run of 1 μs followed. Simulation was run with an NPT ensemble at a temperature of 300K enforced by a Langevin72 thermostat and a pressure of 1.01325 bar enforced by a Langevin piston. SHAKE was applied for TIP3P waters and Particle Mesh Ewald73 was used with a cutoff distance of 12 Å. The timestep was 2 fs/step for all but the minimization. Analysis was performed with VMD 1.9.474. Pore diameter measurements were calculated using VMD’s volmap tool as a single row of 0.2 Å cubes spanning between the alpha carbons of three pairs of residues. The output of this tool is the radius of the largest sphere that can be placed at every grid point without entering the VDW sphere of any atoms. Thus, the largest value found for each frame was simply doubled to find the length of uninterrupted space between the given residues. Videos were made in ChimeraX61.
Lipid scramblase assay
Liposomes with a composition of 94.5% POPC/5%POPS/0.5% NBD-conjugated lipids [16:0–6:0 NBD-PC (tail-labeled); 810130C, 16:0–6:0 NBD-PS; 810192C, 16;0–6:0 NBD-PE, 810153C, N-NBD-PE 16:0 (head-labeled); 810144C, (Avanti Polar Lipids)] were prepared as follows. Chloroform-dissolved lipids were mixed in a glass tube and dried under nitrogen gas stream. Lipids were dissolved in n-pentane, then dried similarly and finally vacuumed for 1hr. The resulting lipid film was hydrated in buffer composed of 80 mM Hepes pH7.5 and 150 mM NaCl to yield a 26.5mM lipid solution. The lipid solution was vortexed for 30 min at room temperature, then bath-sonicated for ~5 min, and finally subjected to 3 times of freeze and thaw cycles. After extrusion through a 400 nm filter >20 times, liposomes were used immediately or stored at −80°C until use. Proteoliposome reconstitution and lipid scramblase assays were performed as described previously75,76 with modifications. 10×His-BRIL-ATG9AΔC proteins purified in DMNG (0.006%) were mixed with 5.3 mM liposomes (protein:lipid ratio=1:6000) and 3 mM TritonX100 (Promega) in buffer consisting of 80 mM Hepes pH7.5, 150 mM NaCl, and 0.3 mM TCEP, and the mixture was incubated for 1 h at 4°C. Then, ~20 mg biobeads SM-2 (Biorad) per 0.3 μmol detergents were added to the protein-liposome mixture, followed by overnight incubation with gentle nutation at 4°C. The proteoliposomes were then frozen and stored in liquid nitrogen until use. For assay, samples were diluted 85-fold with the same buffer (80 mM Hepes pH7.5, 150 mM NaCl, and 0.3 mM TCEP) in a fluorescence cuvette. Fluorescence was measured with stirring at a rate of 2–3Hz. The excitation and emission wavelengths were set to 460 and 535 nm, respectively. 30 mM dithionite was added at t = 100s and 0.1% TritonX100 was added in the end of recording. Each time trace was normalized with the initial fluorescence (before dithionite addition) as 100 % and the final one as 0 %. Because the fluorescence traces of mutants showed changes in plateau values but not decay rates, we determined relative activity using the fixed time point method as reported previously75: differences of the fluorescence values at t = 200 s from that of the protein-free trace was normalized against that of WT. Proteoliposomes reconstituted using the same batch of liposomes exhibited nearly identical fluorescence traces. Therefore, those data were averaged and counted as n=1. Reconstitutions using separately prepared liposome batches yielded slightly different plateaus and therefore are defined as independent experiments. The lipid scramblase assay using lipid-free BSA was performed as described previously34–36.
Mammalian cell culture
HeLa cells, mouse embryonic fibroblasts (MEFs), and HEK293T cells were cultured in Dulbecco’s modified Eagle’s medium (DMEM) (D6546, Sigma-Aldrich) supplemented with 10% heat-inactivated fetal bovine serum (FBS) (S1820-500, BioWest) and 2 mM L-glutamine (25030-081, Gibco) at 37°C with 5% CO2. For starvation, cells were washed once with PBS and cultured in DMEM without amino acids (048-33575, FUJIFILM Wako Pure Chemical Corporation) without FBS.
Stable expression in mammalian cells by retrovirus infection
For retrovirus preparation, HEK293T cells were co-transfected with pMXs-GFP-LC3-mRFP, pCG-gag-pol, and pCG-VSV-G with Lipofectamine 2000 (11668-019, Thermo Fisher Scientific) in Opti-MEM (31985-070, Gibco). After 6 h, the culture medium was exchanged with DMEM and the cells were cultured for 2 days. The culture medium containing retrovirus was filtered through a 0.45 μm centrifugal filter (UFC30HV00, Millipore). ATG9A KO HeLa cells77 and Atg9a KO MEFs78 were incubated with the retrovirus in DMEM with 8 μg/ml polybrene (H9268, Sigma-Aldrich) for 24 h. The cells were cultured in DMEM for 1 week and then GFP(+) and mRFP(+) double-positive transformants were selected by a fluorescence-activated cell sorter (MoFlo Astrios EQ, Beckman Coulter). For stable expression of ATG9A-FLAG, pMXs-IP-ATG9A-FLAG (WT or mutant) was used instead of pMXs-GFP-LC3-mRFP and transformants were selected by treatment with 1 μg/ml puromycin (ant-pr-1, InvivoGen) for 3 days.
Preparation of mammalian whole cell lysate
Cells were harvested by scraping in ice-cold PBS and precipitated by centrifugation at 3,000 × g for 1 min. The cells were solubilized with 0.2% DDM (14239-54, Nacalai Tesque) in 25 mM HEPES-KOH pH 7.2, 150 mM NaCl, 2 mM EDTA, 1% protease inhibitor cocktail (P8340, Sigma-Aldrich) for 20 min on ice. Protein concentrations were determined by a microvolume spectrophotometer (NanoDrop One, Thermo Fisher Scientific) and equalized with SDS-PAGE sample buffer. The resultant samples were heated at 45°C for 15 min.
Immunoblotting
Immunoblotting was performed with anti-ATG9A11 and anti-β-actin (A5441, clone AC-15, Sigma-Aldrich) as primary antibodies and HRP-conjugated anti-rabbit IgG (111-035-144, Jackson ImmunoResearch) and HRP-conjugated anti-mouse IgG (315-035-003, Jackson ImmunoResearch) as secondary antibodies, visualized with Immobilon western chemiluminescent HRP substrate (WBKLS0500, Millipore), and detected by the FUSION image analyzer (SOLO.7S.EDGE, Vilber-Lourmat). Data were processed using ImageJ software.
Flow cytometry
Cells stably expressing GFP-LC3-mRFP were treated with 250 nM Torin 1 (4247, Tocris Bioscience) in DMEM for 24 h. The cells were harvested by trypsinization followed by centrifugation at 2,000 × g for 2 min, resuspended in ice-cold PBS, treated with 1% 7-amino-actinomycin D (51-68981E, BD Pharmingen) for 10 min on ice, and then diluted with ice-cold PBS. The cells were analyzed by the cell analyzer (EC800, SONY) equipped with 488-nm and 561-nm lasers. Data were processed using a Kaluza Analysis 2.1 software (Beckman Coulter) and box plots were made using Excel software (Microsoft).
3D CLEM
A glass base dish with 150 μm grids (TCI-3922-035R-1CS, IWAKI) was pretreated as follows; a glass coverslip was inverted, coated with carbon by a vacuum evaporator (IB-29510VET, JEOL), and treated with 0.1% gelatin for 15 min under UV irradiation. Then, HeLa cells were cultured in the pretreated glass base dish for 2 days and starved for 2 h. The cells were washed twice with 0.1 M phosphate buffer pH 7.4 and fixed with 4% paraformaldehyde (26126-54, Nacalai Tesque) and 0.5% glutaraldehyde (G018/1, TAAB) in 0.1 M phosphate butter pH 7.4 for 1 h at 4°C. The cells were washed three times with 0.1 M phosphate buffer pH 7.4 and Z-section images (350 nm each) were acquired by the FV3000 confocal microscope system (Olympus).
After the fluorescence microscopy, the cells were fixed with 2.5% glutaraldehyde (G018/1, TAAB) in 0.2 M cacodylate buffer pH 7.4 (37237-35, Nacalai Tesque) for overnight, then fixed with 1% osmium tetroxide (3020-4, Nisshin EM) and 1.5% potassium ferrocyanide (161-03742, Wako) in 0.2 M cacodylate buffer for 2 h at 4°C, washed five times with Milli-Q water, treated with 3% uranium acetate for 1 h, and dehydrated in an ascending series of ethanol. After 1h dehydration in 100% ethanol, the cells were embedded in Epon (EPON 812, TAAB), polymerized at 40°C for 12 h, and then polymerized at 60°C for 48 h. The blocks were trimmed to ~100×100 μm cuboids using razor blades. To create ultra-thin serial sections, we used a diamond knife with an ultra-jumbo boat (Ultrajumbo 35 degree, Diatome) mounted on an ultramicrotome (UC7, Leica). Sections were cut with 25 nm thickness to create a ribbon of 50-200 serial sections and transferred to a silicon wafer that is held and manipulated by a micromanipulator (Märzhäuser Wetzlar). Samples were stained with 3% uranium acetate and Reynolds’ lead citrate.
Scanning electron microscopic (SEM) images were acquired using an electron microscope (JSM7900F, JEOL) following three steps. First, based on the photograph of wafer with serial section, SEM images with magnification ×100 for all serial sections (each image size is 750×1000 μm) were acquired. Second, based on the SEM images from first step, SEM images with magnification ×300 were acquired for more precise information of all serial sections (each image size is 250×333 μm). Finally, based on the SEM images from second step, SEM images with magnification ×5000 for targeted cells (each image size is 15×20 μm) were acquired. All steps were performed semi-automatically using an Array Tomography Supporter 1.0.0.0 software (System In Frontier). SEM images are automatically tiled in order by a Measurement Advisor 4.1.14.0 software (System In Frontier). Images were stacked in order using a Stacker NEO TEMography.com 3.3.4.0 software (System In Frontier) and a Fiji software.
Extended Data
Extended Data Fig. 1.
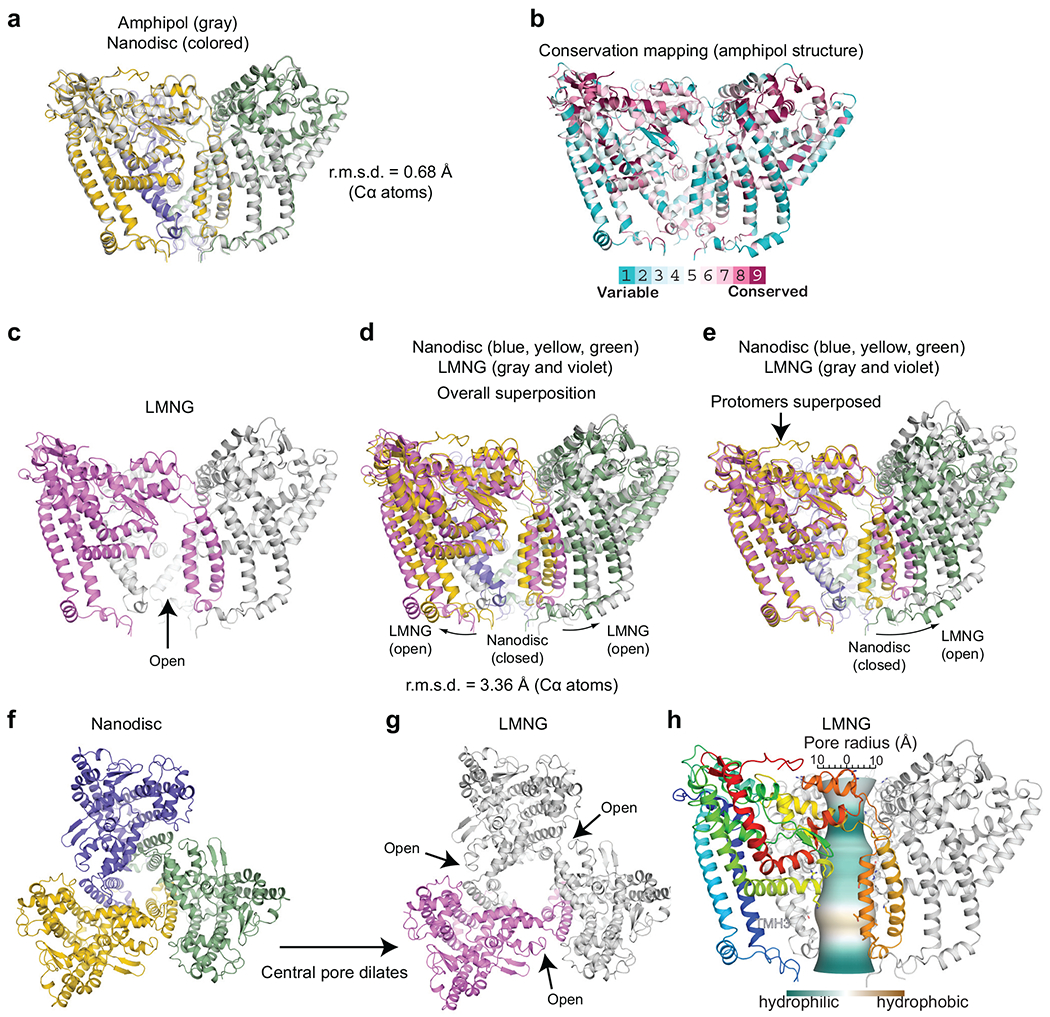
Conformational variability of ATG9A. a, Superposition of ATG9A structures in amphipols (gray) and nanodiscs (colored). b, Conservation mapping of ATG9A. c, The structure of ATG9A in LMNG micelles. d,e, Superpositions of ATG9A structures in nanodiscs (colored) and LMNG (gray and violet): overall superposition (d) and focused on a protomer (e). f,g, Top views of the nanodisc (f) and LMNG (g) structures visualizing the dilation of the central pore. h, CHAP analysis of the LMNG structure.
Extended Data Fig. 2.
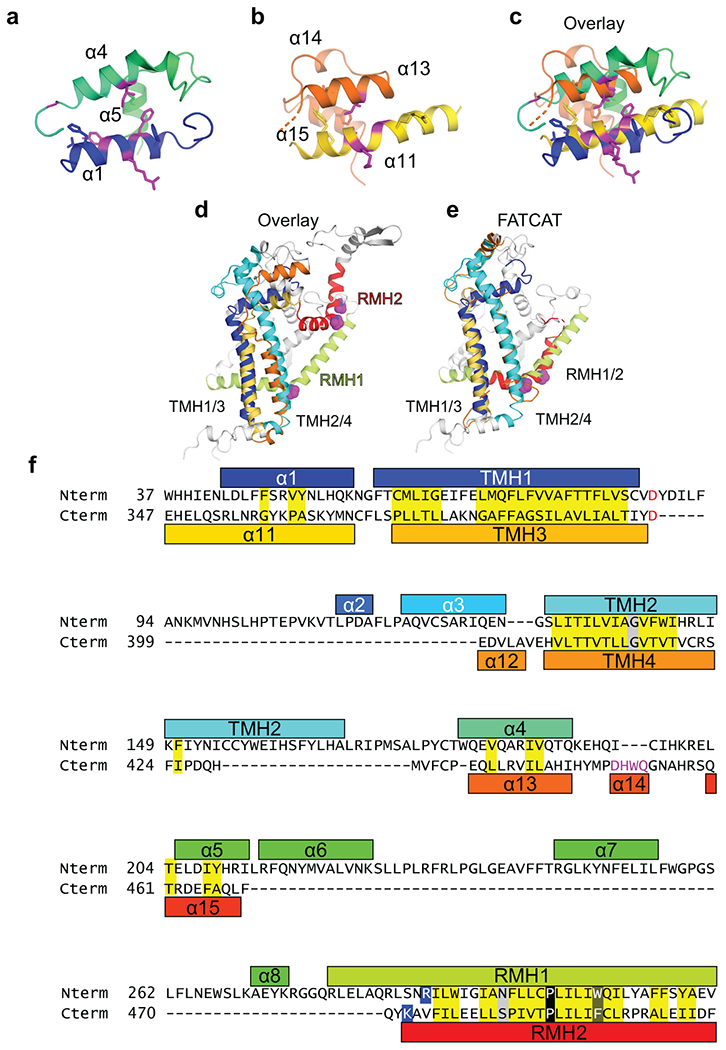
Similarities between the N- and C-terminal halves of ATG9A. a,b, The bundles of α-helices flanking the TMH1–2 (a) and TMH3–4 (b) hairpins. c, Superposition of the bundles. d, Structural overlay of the N- and C-terminal halves generated by superposing TMH1/2 and TMH3/4. e, FATCAT flexible structural alignment of the N- and C-terminal halves. f, Sequence alignment between the N- and C-terminal halves of ATG9A.
Extended Data Fig. 3.
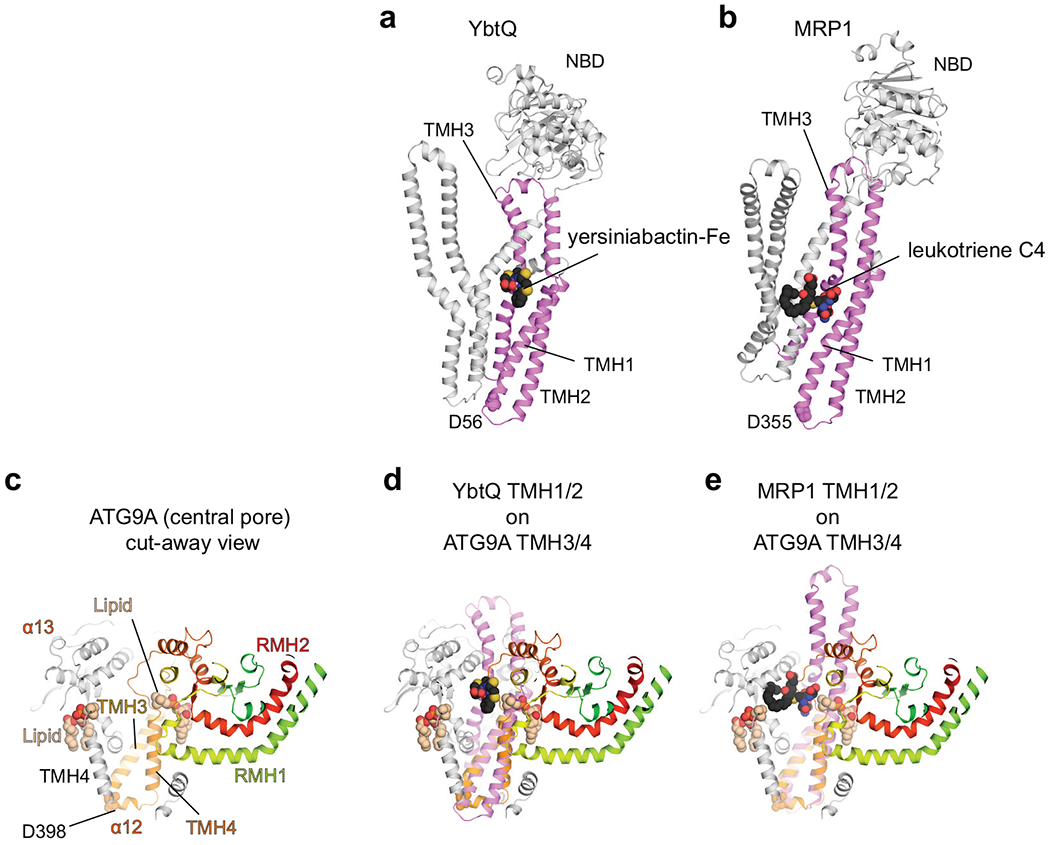
Structural alignments of ATG9A with ABCexps. a,b, Structures of YbtQ (a, PDB 6P6J) and MRP1 (b, PDB 5UJA) bound to their substrates. The TMH1–3s are colored violet. c, A cut-away view of the central pore of ATG9A. d,e, Superpositions of ATG9A with YbtQ (d) and MRP1 (e). ATG9A’s TMH3/TMH4 can be superimposed with TMH1/TMH2 from the identified ABCexp structures using as a guide for the helix register the conserved Asp (D398 in ATG9 with D53 in MsbA, D56 in YbtQ, D355 in MRP1). In all cases, ABCexps’ substrates locate to the central pore of ATG9A.
Extended Data Fig. 4.
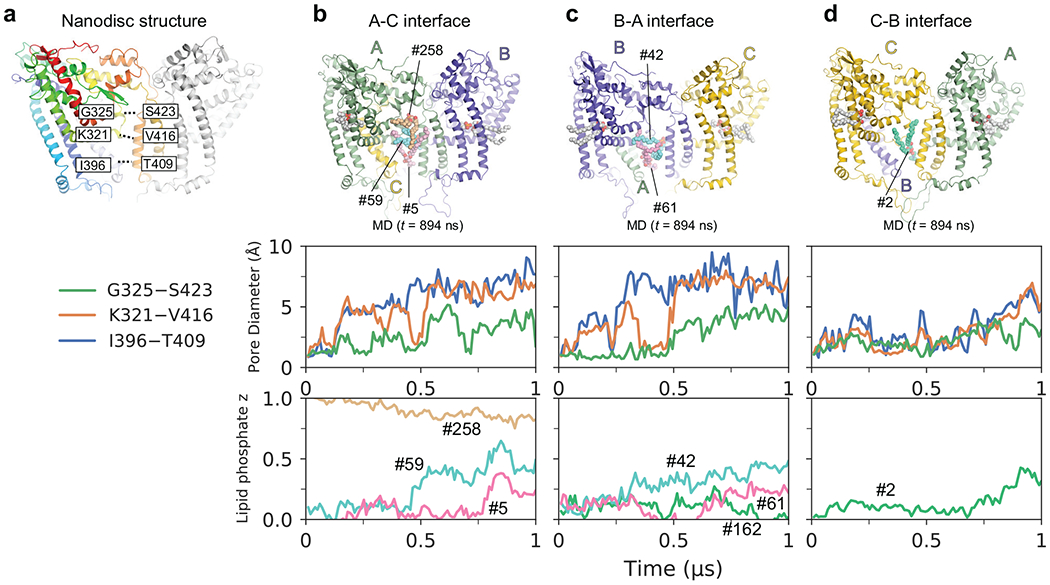
MD simulation of the nanodisc structure. a, The inter-residue distances measured are indicated on the nanodisc structure. b–d, Analyses of the simulation. The top panels are structure snapshots at t = 894 ns. The middle panels show time-dependent changes of the three pore openings between three selected pairs of residues at the A-C (b), B-A (c), and C-B (d) chain interfaces. The bottom panels show the trajectory of individual lipids that penetrate through the interface during the simulation. Each trace shows the Z position of the phosphate head of a lipid of interest, normalized by the average z coordinate of the luminal (0) and cytosolic (1) leaflets. The simulation shows lipid movements induced by the dynamic behavior of the protein. The luminal sides of the A-C and B-A interfaces (blue and orange lines in b and c) open early (t = ~100–200 ns), followed by insertions of the headgroups of the lipids #59 and #42 from the luminal leaflet through the A-C and B-A interfaces, respectively (b, c, cyan lines, t = ~300–450 ns). As these headgroups move toward the cytosolic side, the lipids #5 and #61 in the luminal leaflet insert their headgroups into the pore through the A-C and B-A interfaces, respectively (b, c). Subsequently, the cytosolic side of the A-C and B-A interfaces open (b, c, green lines), and at the A-C interface, the lipid #258 in the cytosolic leaflet entered the pore. Conversely, the C-B interface remained closed longer with respect to the A-C and B-A interfaces, but it eventually started to open after t = ~700 ns, allowing lipid #2 in the luminal leaflet to insert its headgroup into the luminal side of the pore (d). All the lipids mentioned here become laterally orientated following the placement of their headgroups into the pore. Source data for plots are available online.
Extended Data Fig. 5.
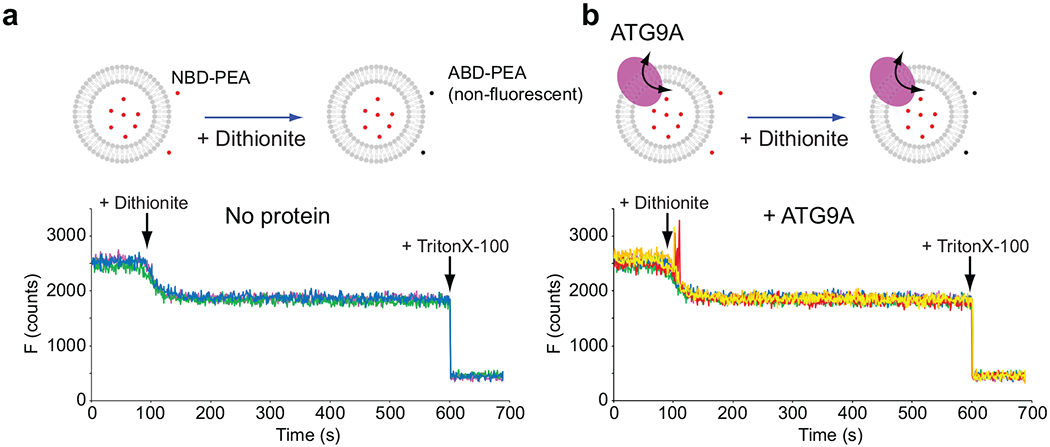
Dithionite permeation assays. a,b, Top panels show the schemes of the experiments with no protein (a) and ATG9A (b). 26μM NBD-phosphoethanolamine (PEA), which was synthesized by conjugating NBD-chloride and PEA and purified by agarose gel electrophoresis, was included in the (proteo)liposome reconstitution mixtures. After reconstitutions, NBD-PEA was removed by dialysis. Fluorescence was recorded as described for the dithionite lipid scramblase assays. 30 mM dithionite was added to the reaction mixtures at t = 100s. The initial drops of fluorescence indicate that the residual amounts of NBD-PEA at the outside of the (proteo)liposomes were quenched. Between the two experiments, the addition of dithionite quenched the same amount of fluorescence and left the same amount of fluorescence, indicating that the same amount of NBD-PEA was included in the (proteo)liposomes. Fluorescence remained almost unchanged after reaching plateaus quickly. At 600s, 0.1 % TritonX-100 was added to the reaction mixtures to dissolve the membranes for full quenching. The same amount of fluorescence was lost between the two experiments, confirming that the same amounts of NBD-PEA were included in liposomes and proteoliposomes. Thus, the ATG9A proteoliposomes were impermeable to dithionite. The experiments were repeated three times. All results are shown in different colors. Source data are available online.
Extended Data Fig. 6.
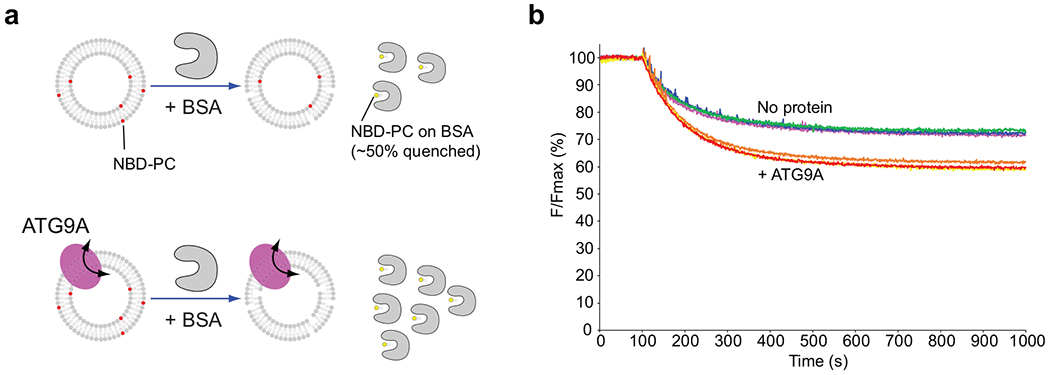
BSA back extraction lipid scrambling assays. a, Schematic for the BSA back extraction-based lipid scrambling assay. NBD-lipids are preferentially extracted by fatty acid-free BSA. Upon extraction, the fluorescence of BSA-bound NBD-lipids is reduced by ~ 50%. b, The results with reconstituted liposomes and ATG9A-containing proteoliposomes. 1.5 mg/ml BSA was added to each reaction at t = 100s. BSA extracts NBD-lipids only from the outer leaflet of the membranes. Thus, in the absence of scrambling, ~50% of NBD-lipids on the outer leaflet lose their fluorescence by ~50%, reducing the total fluorescence by ~25%. In the presence of ATG9A, an additional ~15% of fluorescence was lost upon BSA addition, which indicates that NBD-lipids that were originally in the inner leaflet were exposed to BSA upon flipping. Source data are available online.
Extended Data Fig. 7.
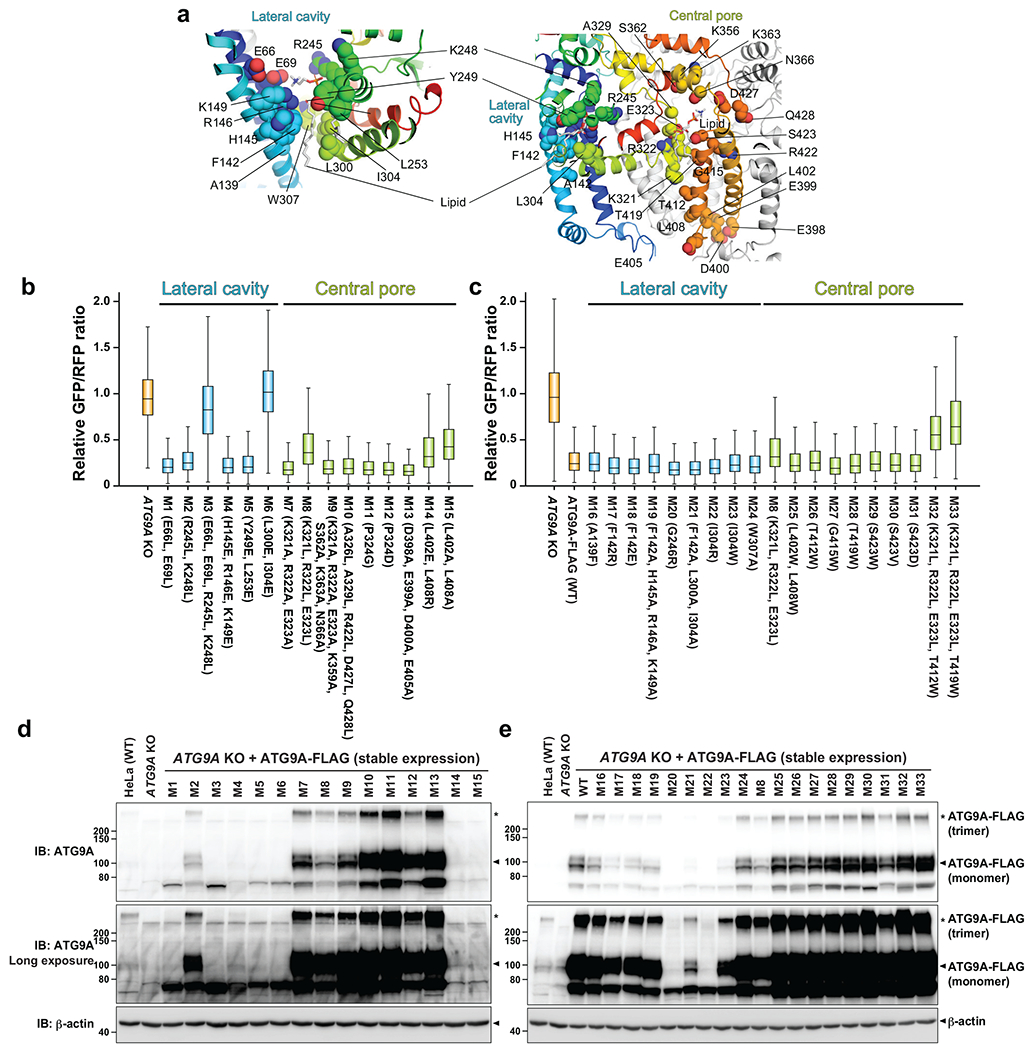
GFP-LC3-RFP autophagic flux assays with ATG9A mutants. a, Locations of the mutations on the ATG9A nanodisc structure. Hydrophilic and hydrophobic amino acids were replaced with hydrophobic and hydrophilic ones, respectively. b,c, Flow cytometry autophagy flux assays. GFP/RFP fluorescence ratios of Torin 1-streated ATG9A KO HeLa cells stably expressing GFP-LC3-mRFP and ATG9A-FLAG mutants are plotted. Data shown in (b) and (c) are the results of the first and second rounds of mutant screenings, respectively. Data of cell populations (N=4800 for b and N=2500 for c) are presented as box plots. The box limit, the horizontal line, and the whisker show the first and third quartiles, the median, and the minimum and maximum values, respectively. No outliers are shown. The assay was repeated for the mutants shown in Figure 4, and they were reproducible. The data shown in blue and green are of mutations in the lateral cavity and central pore, respectively. d,e, Western blotting of ATG9A KO HeLa cells stably expressing ATG9A-FLAG mutants. Source data for the box plots are available online.
Extended Data Fig. 8.
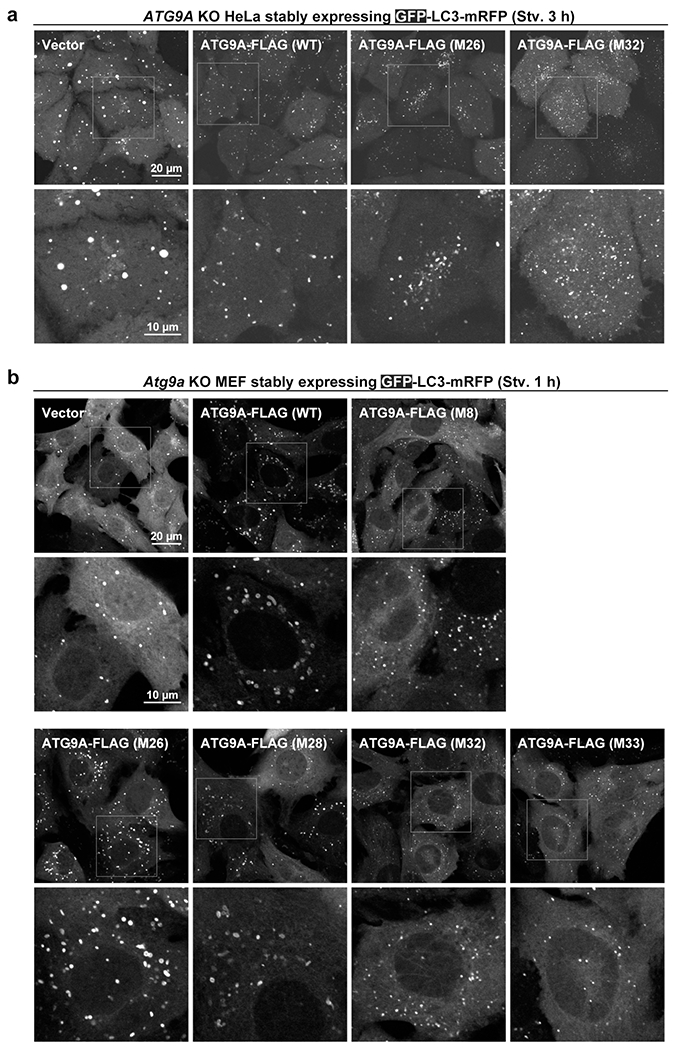
Autophagosome formation in ATG9A mutant-expressing cells. a,b, ATG9A KO HeLa cells (a) and MEFs (b) stably expressing GFP-LC3-mRFP and ATG9A-FLAG mutants were observed by fluorescence microscopy. GFP fluorescence was monitored. In (a) additional mutants M26 (T412W) and M32 (M8+M26) are shown. ATG9A KO HeLa ells and WT ATG9A-FLAG-expressing cells are the same image as shown in Figure 4. Images were acquired after 3h starvation. M26 yielded typical GFP-LC3 puncta while M32 generated smaller autophagosomes. The results are similar to those of M28 (T419W) and M33 (M8+M28), which were selected for followed-up 3D CLEM and biochemical studies, as shown in Figure 4. (b) MEFs were starved for 1 h, and GFP fluorescence was monitored. In ATG9A KO MEFs, GFP-LC3 forms larger puncta than typical autophagosomes. Expression of WT ATG9A-FLAG, as well as M26 and M28, generated ring-shaped autophagosomes, while M8/M32/M33-expressing cells yielded markedly smaller GFP-puncta. These observations are consistent with the results with HeLa cells, leading to the conclusion that the observed effects of the mutations in ATG9A are cell type-independent.
Supplementary Material
Supplementary Data 1. HHpred hits with various ATG9 sequences and sequence alignments.
Supplementary Video 1. Movie of the MD simulation in a top cutaway view and three side views.
Supplementary Video 2. 3D reconstruction of a cup-shaped phagophore observed in M33-expressing cells. A cup-shaped phagophore, a closed autophagosome, and the ER are colored green, light green, and red, respectively.
Acknowledgments
We thank K. Ohashi, S. Chowdhury and G. C. Lander for their contributions to preliminary studies of this project; S. C. and G. C. L. also for providing cryo-EM training; M. Shirakawa, K. Igarashi, Y. Ishida, C. Saito, and I. Koyama-Honda for technical assistance with cellular studies; B. Anderson for technical assistance with cryo-EM operation; J-C. Ducom and the Scripps HPC Facility for computational support for cryo-EM data processing and MD simulations; I. J. Macrae for critical reading of the manuscript. The MultiBac expression system, cDNA of BRIL, and pMSP2N2 (Addgene plasmid # 29520), pMXs-puro, Atg9a KO MEFs, pCG-gag-pol and pCG-VSV-G retrovirus plasmids, were gifts from Drs. Imre Berger, Raymond Stevens, Stephen Sligar, Toshio Kitamura, Tatsuya Saitoh, and Teruhito Yasui, respectively. This work was supported by grants from the National Institute of Health (GM092740 to T.O., GM069832 to S.F., GM127390 to N.V.G.), the Welch Foundation (I-1505 to N.V.G.), a Grant-in-Aid for Exploratory Research for Advanced Technology (ERATO) (JPMJER1702 to N.M.) from the Japan Science and Technology Agency (JST). Computational analyses of EM data were performed using shared instrumentation at The Scripps Research Institute funded by NIH S10OD021634.
Footnotes
Competing interests
The authors declare no competing interests.
Further information on experimental design is available in the Nature Research Reporting Summary linked to this article.
Data availability
Cryo-EM density maps and atomic coordinates for human ATG9 have been deposited in the Electron Microscopy Data Bank and wwPDB, respectively, under accession codes EMD-22375 and PDB 7JLO (amphipol); EMD-22376 and PDB 7JLP (nanodisc); EMD-22377 and PDB 7JLQ (LMNG).
References
- 1.Levine B & Kroemer G Biological Functions of Autophagy Genes: A Disease Perspective. Cell 176, 11–42 (2019). [DOI] [PMC free article] [PubMed] [Google Scholar]
- 2.Jiang P & Mizushima N Autophagy and human diseases. Cell Res 24, 69–79 (2014). [DOI] [PMC free article] [PubMed] [Google Scholar]
- 3.Lamb CA, Yoshimori T & Tooze SA The autophagosome: origins unknown, biogenesis complex. Nat Rev Mol Cell Biol 14, 759–774 (2013). [DOI] [PubMed] [Google Scholar]
- 4.Yamamoto H et al. Atg9 vesicles are an important membrane source during early steps of autophagosome formation. J Cell Biol 198, 219–233 (2012). [DOI] [PMC free article] [PubMed] [Google Scholar]
- 5.De Tito S, Hervas JH, van Vliet AR & Tooze SA The Golgi as an Assembly Line to the Autophagosome. Trends Biochem Sci 45, 484–496 (2020). [DOI] [PubMed] [Google Scholar]
- 6.Orsi A et al. Dynamic and transient interactions of Atg9 with autophagosomes, but not membrane integration, are required for autophagy. Mol Biol Cell 23, 1860–1873 (2012). [DOI] [PMC free article] [PubMed] [Google Scholar]
- 7.Ohashi Y & Munro S Membrane delivery to the yeast autophagosome from the Golgi-endosomal system. Mol Biol Cell 21, 3998–4008 (2010). [DOI] [PMC free article] [PubMed] [Google Scholar]
- 8.Mari M et al. An Atg9-containing compartment that functions in the early steps of autophagosome biogenesis. J Cell Biol 190, 1005–1022 (2010). [DOI] [PMC free article] [PubMed] [Google Scholar]
- 9.Zhuang X et al. ATG9 regulates autophagosome progression from the endoplasmic reticulum in Arabidopsis. Proc Natl Acad Sci U S A 114, E426–E435 (2017). [DOI] [PMC free article] [PubMed] [Google Scholar]
- 10.Karanasios E et al. Autophagy initiation by ULK complex assembly on ER tubulovesicular regions marked by ATG9 vesicles. Nat Commun 7, 12420 (2016). [DOI] [PMC free article] [PubMed] [Google Scholar]
- 11.Itakura E, Kishi-Itakura C, Koyama-Honda I & Mizushima N Structures containing Atg9A and the ULK1 complex independently target depolarized mitochondria at initial stages of Parkin-mediated mitophagy. J Cell Sci 125, 1488–1499 (2012). [DOI] [PubMed] [Google Scholar]
- 12.Koyama-Honda I, Itakura E, Fujiwara TK & Mizushima N Temporal analysis of recruitment of mammalian ATG proteins to the autophagosome formation site. Autophagy 9, 1491–1499 (2013). [DOI] [PubMed] [Google Scholar]
- 13.Kakuta S et al. Small GTPase Rab1B is associated with ATG9A vesicles and regulates autophagosome formation. FASEB J 31, 3757–3773 (2017). [DOI] [PubMed] [Google Scholar]
- 14.Imai K et al. Atg9A trafficking through the recycling endosomes is required for autophagosome formation. J Cell Sci 129, 3781–3791 (2016). [DOI] [PubMed] [Google Scholar]
- 15.Suzuki K, Akioka M, Kondo-Kakuta C, Yamamoto H & Ohsumi Y Fine mapping of autophagy-related proteins during autophagosome formation in Saccharomyces cerevisiae. J Cell Sci 126, 2534–2544 (2013). [DOI] [PubMed] [Google Scholar]
- 16.Graef M, Friedman JR, Graham C, Babu M & Nunnari J ER exit sites are physical and functional core autophagosome biogenesis components. Mol Biol Cell 24, 2918–2931 (2013). [DOI] [PMC free article] [PubMed] [Google Scholar]
- 17.Gomez-Sanchez R et al. Atg9 establishes Atg2-dependent contact sites between the endoplasmic reticulum and phagophores. J Cell Biol 217, 2743–2763 (2018). [DOI] [PMC free article] [PubMed] [Google Scholar]
- 18.Mizushima N et al. Dissection of autophagosome formation using Apg5-deficient mouse embryonic stem cells. J Cell Biol 152, 657–668 (2001). [DOI] [PMC free article] [PubMed] [Google Scholar]
- 19.Nishimura T et al. Autophagosome formation is initiated at phosphatidylinositol synthase-enriched ER subdomains. EMBO J 36, 1719–1735 (2017). [DOI] [PMC free article] [PubMed] [Google Scholar]
- 20.Maeda S, Otomo C & Otomo T The autophagic membrane tether ATG2A transfers lipids between membranes. Elife 8, e45777 (2019). [DOI] [PMC free article] [PubMed] [Google Scholar]
- 21.Valverde DP et al. ATG2 transports lipids to promote autophagosome biogenesis. J Cell Biol 218, 1787–1798 (2019). [DOI] [PMC free article] [PubMed] [Google Scholar]
- 22.Osawa T et al. Atg2 mediates direct lipid transfer between membranes for autophagosome formation. Nat Struct Mol Biol 26, 281–288 (2019). [DOI] [PubMed] [Google Scholar]
- 23.Young AR et al. Starvation and ULK1-dependent cycling of mammalian Atg9 between the TGN and endosomes. J Cell Sci 119, 3888–3900 (2006). [DOI] [PubMed] [Google Scholar]
- 24.He C et al. Recruitment of Atg9 to the preautophagosomal structure by Atg11 is essential for selective autophagy in budding yeast. J Cell Biol 175, 925–935 (2006). [DOI] [PMC free article] [PubMed] [Google Scholar]
- 25.Lai LTF et al. Subnanometer resolution cryo-EM structure of Arabidopsis thaliana ATG9. Autophagy 16, 575–583 (2020). [DOI] [PMC free article] [PubMed] [Google Scholar]
- 26.He C, Baba M, Cao Y & Klionsky DJ Self-interaction is critical for Atg9 transport and function at the phagophore assembly site during autophagy. Mol Biol Cell 19, 5506–5516 (2008). [DOI] [PMC free article] [PubMed] [Google Scholar]
- 27.Aryal P, Sansom MS & Tucker SJ Hydrophobic gating in ion channels. J Mol Biol 427, 121–130 (2015). [DOI] [PMC free article] [PubMed] [Google Scholar]
- 28.Entova S, Billod JM, Swiecicki JM, Martin-Santamaria S & Imperiali B Insights into the key determinants of membrane protein topology enable the identification of new monotopic folds. Elife 7, e40889 (2018). [DOI] [PMC free article] [PubMed] [Google Scholar]
- 29.Schaeffer RD et al. ECOD: identification of distant homology among multidomain and transmembrane domain proteins. BMC Mol Cell Biol 20, 18 (2019). [DOI] [PMC free article] [PubMed] [Google Scholar]
- 30.Ho H et al. Structural basis for dual-mode inhibition of the ABC transporter MsbA. Nature 557, 196–201 (2018). [DOI] [PubMed] [Google Scholar]
- 31.Choudhury HG et al. Structure of an antibacterial peptide ATP-binding cassette transporter in a novel outward occluded state. Proc Natl Acad Sci U S A 111, 9145–9150 (2014). [DOI] [PMC free article] [PubMed] [Google Scholar]
- 32.Wang Z, Hu W & Zheng H Pathogenic siderophore ABC importer YbtPQ adopts a surprising fold of exporter. Sci Adv 6, eaay7997 (2020). [DOI] [PMC free article] [PubMed] [Google Scholar]
- 33.Johnson ZL & Chen J Structural Basis of Substrate Recognition by the Multidrug Resistance Protein MRP1. Cell 168, 1075–1085 e1079 (2017). [DOI] [PubMed] [Google Scholar]
- 34.Malvezzi M et al. Ca2+-dependent phospholipid scrambling by a reconstituted TMEM16 ion channel. Nat Commun 4, 2367 (2013). [DOI] [PMC free article] [PubMed] [Google Scholar]
- 35.Menon I et al. Opsin is a phospholipid flippase. Curr Biol 21, 149–153 (2011). [DOI] [PMC free article] [PubMed] [Google Scholar]
- 36.Chang QL, Gummadi SN & Menon AK Chemical modification identifies two populations of glycerophospholipid flippase in rat liver ER. Biochemistry 43, 10710–10718 (2004). [DOI] [PubMed] [Google Scholar]
- 37.Kaizuka T et al. An Autophagic Flux Probe that Releases an Internal Control. Mol Cell 64, 835–849 (2016). [DOI] [PubMed] [Google Scholar]
- 38.Sun D, Wu R, Zheng J, Li P & Yu L Polyubiquitin chain-induced p62 phase separation drives autophagic cargo segregation. Cell Res 28, 405–415 (2018). [DOI] [PMC free article] [PubMed] [Google Scholar]
- 39.Brunner JD, Lim NK, Schenck S, Duerst A & Dutzler R X-ray structure of a calcium-activated TMEM16 lipid scramblase. Nature 516, 207–212 (2014). [DOI] [PubMed] [Google Scholar]
- 40.Lee BC et al. Gating mechanism of the extracellular entry to the lipid pathway in a TMEM16 scramblase. Nat Commun 9, 3251 (2018). [DOI] [PMC free article] [PubMed] [Google Scholar]
- 41.Guardia CM et al. Structure of Human ATG9A, the Only Transmembrane Protein of the Core Autophagy Machinery. Cell Rep 31, 107837 (2020). [DOI] [PMC free article] [PubMed] [Google Scholar]
- 42.Feng S et al. Cryo-EM Studies of TMEM16F Calcium-Activated Ion Channel Suggest Features Important for Lipid Scrambling. Cell Rep 28, 1385 (2019). [DOI] [PMC free article] [PubMed] [Google Scholar]
- 43.Falzone ME et al. Structural basis of Ca(2+)-dependent activation and lipid transport by a TMEM16 scramblase. Elife 8, e43229 (2019). [DOI] [PMC free article] [PubMed] [Google Scholar]
Methods-only References
- 44.Herzik MA Jr., Wu M & Lander GC Achieving better-than-3-Å resolution by single-particle cryo-EM at 200 keV. Nat Methods 14, 1075–1078 (2017). [DOI] [PMC free article] [PubMed] [Google Scholar]
- 45.Suloway C et al. Automated molecular microscopy: the new Leginon system. J Struct Biol 151, 41–60 (2005). [DOI] [PubMed] [Google Scholar]
- 46.Zheng SQ et al. MotionCor2: anisotropic correction of beam-induced motion for improved cryo-electron microscopy. Nat Methods 14, 331–332 (2017). [DOI] [PMC free article] [PubMed] [Google Scholar]
- 47.Lander GC et al. Appion: an integrated, database-driven pipeline to facilitate EM image processing. J Struct Biol 166, 95–102 (2009). [DOI] [PMC free article] [PubMed] [Google Scholar]
- 48.Rohou A & Grigorieff N CTFFIND4: Fast and accurate defocus estimation from electron micrographs. J Struct Biol 192, 216–221 (2015). [DOI] [PMC free article] [PubMed] [Google Scholar]
- 49.Zhang K Gctf: Real-time CTF determination and correction. J Struct Biol 193, 1–12 (2016). [DOI] [PMC free article] [PubMed] [Google Scholar]
- 50.Zivanov J et al. New tools for automated high-resolution cryo-EM structure determination in RELION-3. Elife 7, e42166 (2018). [DOI] [PMC free article] [PubMed] [Google Scholar]
- 51.Punjani A, Rubinstein JL, Fleet DJ & Brubaker MA cryoSPARC: algorithms for rapid unsupervised cryo-EM structure determination. Nat Methods 14, 290–296 (2017). [DOI] [PubMed] [Google Scholar]
- 52.Scheres SH & Chen S Prevention of overfitting in cryo-EM structure determination. Nat Methods 9, 853–854 (2012). [DOI] [PMC free article] [PubMed] [Google Scholar]
- 53.Tan YZ et al. Addressing preferred specimen orientation in single-particle cryo-EM through tilting. Nat Methods 14, 793–796 (2017). [DOI] [PMC free article] [PubMed] [Google Scholar]
- 54.Emsley P, Lohkamp B, Scott WG & Cowtan K Features and development of Coot. Acta Crystallogr D Biol Crystallogr 66, 486–501 (2010). [DOI] [PMC free article] [PubMed] [Google Scholar]
- 55.Liebschner D et al. Macromolecular structure determination using X-rays, neutrons and electrons: recent developments in Phenix. Acta Crystallogr D Struct Biol 75, 861–877 (2019). [DOI] [PMC free article] [PubMed] [Google Scholar]
- 56.Chen VB et al. MolProbity: all-atom structure validation for macromolecular crystallography. Acta Crystallogr D Biol Crystallogr 66, 12–21 (2010). [DOI] [PMC free article] [PubMed] [Google Scholar]
- 57.Lomize MA, Pogozheva ID, Joo H, Mosberg HI & Lomize AL OPM database and PPM web server: resources for positioning of proteins in membranes. Nucleic Acids Res 40, D370–376 (2012). [DOI] [PMC free article] [PubMed] [Google Scholar]
- 58.Baker NA, Sept D, Joseph S, Holst MJ & McCammon JA Electrostatics of nanosystems: application to microtubules and the ribosome. Proc Natl Acad Sci U S A 98, 10037–10041 (2001). [DOI] [PMC free article] [PubMed] [Google Scholar]
- 59.Klesse G, Rao S, Sansom MSP & Tucker SJ CHAP: A Versatile Tool for the Structural and Functional Annotation of Ion Channel Pores. J Mol Biol 431, 3353–3365 (2019). [DOI] [PMC free article] [PubMed] [Google Scholar]
- 60.Ashkenazy H et al. ConSurf 2016: an improved methodology to estimate and visualize evolutionary conservation in macromolecules. Nucleic Acids Res 44, W344–350 (2016). [DOI] [PMC free article] [PubMed] [Google Scholar]
- 61.Goddard TD et al. UCSF ChimeraX: Meeting modern challenges in visualization and analysis. Protein Sci 27, 14–25 (2018). [DOI] [PMC free article] [PubMed] [Google Scholar]
- 62.Holm L DALI and the persistence of protein shape. Protein Sci 29, 128–140 (2020). [DOI] [PMC free article] [PubMed] [Google Scholar]
- 63.Li Z, Jaroszewski L, Iyer M, Sedova M & Godzik A FATCAT 2.0: towards a better understanding of the structural diversity of proteins. Nucleic Acids Res 48, W60–W64 (2020). [DOI] [PMC free article] [PubMed] [Google Scholar]
- 64.Zimmermann L et al. A Completely Reimplemented MPI Bioinformatics Toolkit with a New HHpred Server at its Core. J Mol Biol 430, 2237–2243 (2018). [DOI] [PubMed] [Google Scholar]
- 65.Dolinsky TJ, Nielsen JE, McCammon JA & Baker NA PDB2PQR: an automated pipeline for the setup of Poisson-Boltzmann electrostatics calculations. Nucleic Acids Res 32, W665–667 (2004). [DOI] [PMC free article] [PubMed] [Google Scholar]
- 66.Lee J et al. CHARMM-GUI Membrane Builder for Complex Biological Membrane Simulations with Glycolipids and Lipoglycans. J Chem Theory Comput 15, 775–786 (2019). [DOI] [PubMed] [Google Scholar]
- 67.Lee J et al. CHARMM-GUI Input Generator for NAMD, GROMACS, AMBER, OpenMM, and CHARMM/OpenMM Simulations Using the CHARMM36 Additive Force Field. J Chem Theory Comput 12, 405–413 (2016). [DOI] [PMC free article] [PubMed] [Google Scholar]
- 68.Phillips JC et al. Scalable molecular dynamics with NAMD. J Comput Chem 26, 1781–1802 (2005). [DOI] [PMC free article] [PubMed] [Google Scholar]
- 69.Huang J et al. CHARMM36m: an improved force field for folded and intrinsically disordered proteins. Nat Methods 14, 71–73 (2017). [DOI] [PMC free article] [PubMed] [Google Scholar]
- 70.Klauda JB et al. Update of the CHARMM all-atom additive force field for lipids: validation on six lipid types. J Phys Chem B 114, 7830–7843 (2010). [DOI] [PMC free article] [PubMed] [Google Scholar]
- 71.Jorgensen WL, Chandrasekhar J, Madura JD, Impey RW & Klein ML Comparison of Simple Potential Functions for Simulating Liquid Water. Journal of Chemical Physics 79, 926–935 (1983). [Google Scholar]
- 72.Adelman SA & Doll JD Generalized Langevin Equation Approach for Atom/Solid-Surface Scattering - Collinear Atom/Harmonic Chain Model. Journal of Chemical Physics 61, 4242–4245 (1974). [Google Scholar]
- 73.Darden T, York D & Pedersen L Particle Mesh Ewald - an N.Log(N) Method for Ewald Sums in Large Systems. Journal of Chemical Physics 98, 10089–10092 (1993). [Google Scholar]
- 74.Humphrey W, Dalke A & Schulten K VMD: visual molecular dynamics. J Mol Graph 14, 33–38 (1996). [DOI] [PubMed] [Google Scholar]
- 75.Falzone ME & Accardi A Reconstitution of Proteoliposomes for Phospholipid Scrambling and Nonselective Channel Assays. Methods Mol Biol 2127, 207–225 (2020). [DOI] [PMC free article] [PubMed] [Google Scholar]
- 76.Brunner JD & Schenck S Preparation of Proteoliposomes with Purified TMEM16 Protein for Accurate Measures of Lipid Scramblase Activity. Methods Mol Biol 1949, 181–199 (2019). [DOI] [PubMed] [Google Scholar]
- 77.Tsuboyama K et al. The ATG conjugation systems are important for degradation of the inner autophagosomal membrane. Science 354, 1036–1041 (2016). [DOI] [PubMed] [Google Scholar]
- 78.Saitoh T et al. Atg9a controls dsDNA-driven dynamic translocation of STING and the innate immune response. Proc Natl Acad Sci U S A 106, 20842–20846 (2009). [DOI] [PMC free article] [PubMed] [Google Scholar]
Associated Data
This section collects any data citations, data availability statements, or supplementary materials included in this article.
Supplementary Materials
Supplementary Data 1. HHpred hits with various ATG9 sequences and sequence alignments.
Supplementary Video 1. Movie of the MD simulation in a top cutaway view and three side views.
Supplementary Video 2. 3D reconstruction of a cup-shaped phagophore observed in M33-expressing cells. A cup-shaped phagophore, a closed autophagosome, and the ER are colored green, light green, and red, respectively.


