

Abstract
An essential protein of the SARS-CoV-2 virus, the envelope protein E, forms a homopentameric cation channel that is important for virus pathogenicity. Here we report a 2.1 Å structure and the drug-binding site of E’s transmembrane domain (ETM), determined using solid-state NMR spectroscopy. In lipid bilayers that mimic the endoplasmic-reticulum Golgi intermediate compartment (ERGIC) membrane, ETM forms a five-helix bundle surrounding a narrow pore. The protein deviates from the ideal α-helical geometry due to three phenylalanine residues, which stack within each helix and between helices. Together with valine and leucine interdigitation, these cause a dehydrated pore compared to viroporins of influenza and HIV viruses. Hexamethylene amiloride binds the polar N-terminal lumen whereas acidic pH affects the C-terminal conformation. Thus, the N- and C-terminal halves of this bipartite channel may interact with other viral and host proteins semi-independently. The structure sets the stage for designing E inhibitors as antiviral drugs.
Reporting Summary:
Further information on experimental design is available in the Nature Research Reporting Summary linked to this article.
Introduction
Nine months into the COVID-19 pandemic, no vaccines or antiviral drugs are available against the severe acute respiratory syndrome coronavirus 2 (SARS-CoV-2), the causative agent of the pandemic, owing to a lack of knowledge about the detailed structures and functions of the essential virus proteins. The RNA genome of SARS-CoV-2 encodes three membrane proteins (Fig. 1a): the spike protein, which binds the cell-surface receptor to mediate virus entry; the membrane protein, which contributes to virus assembly and budding1; and the envelope protein. E is a 75-residue viroporin (Fig. 1b) that forms a cation-selective channel across the ERGIC membrane2,3. In SARS-CoV-1, E mediates the budding and release of progeny viruses4 and activates the host inflammasome5. E’s channel activity is blocked by hexamethylene amiloride (HMA)6 and amantadine (AMT)7, the latter also inhibiting the viroporins of influenza A virus and HIV-18,9. E deletion gives rise to attenuated viruses in some coronaviruses10–12, while E mutations that abolish channel activity cause reduced virus pathogenicity.12 Thus E is a potential antiviral drug target and vaccine candidate against SARS-CoV-2.
Figure 1.
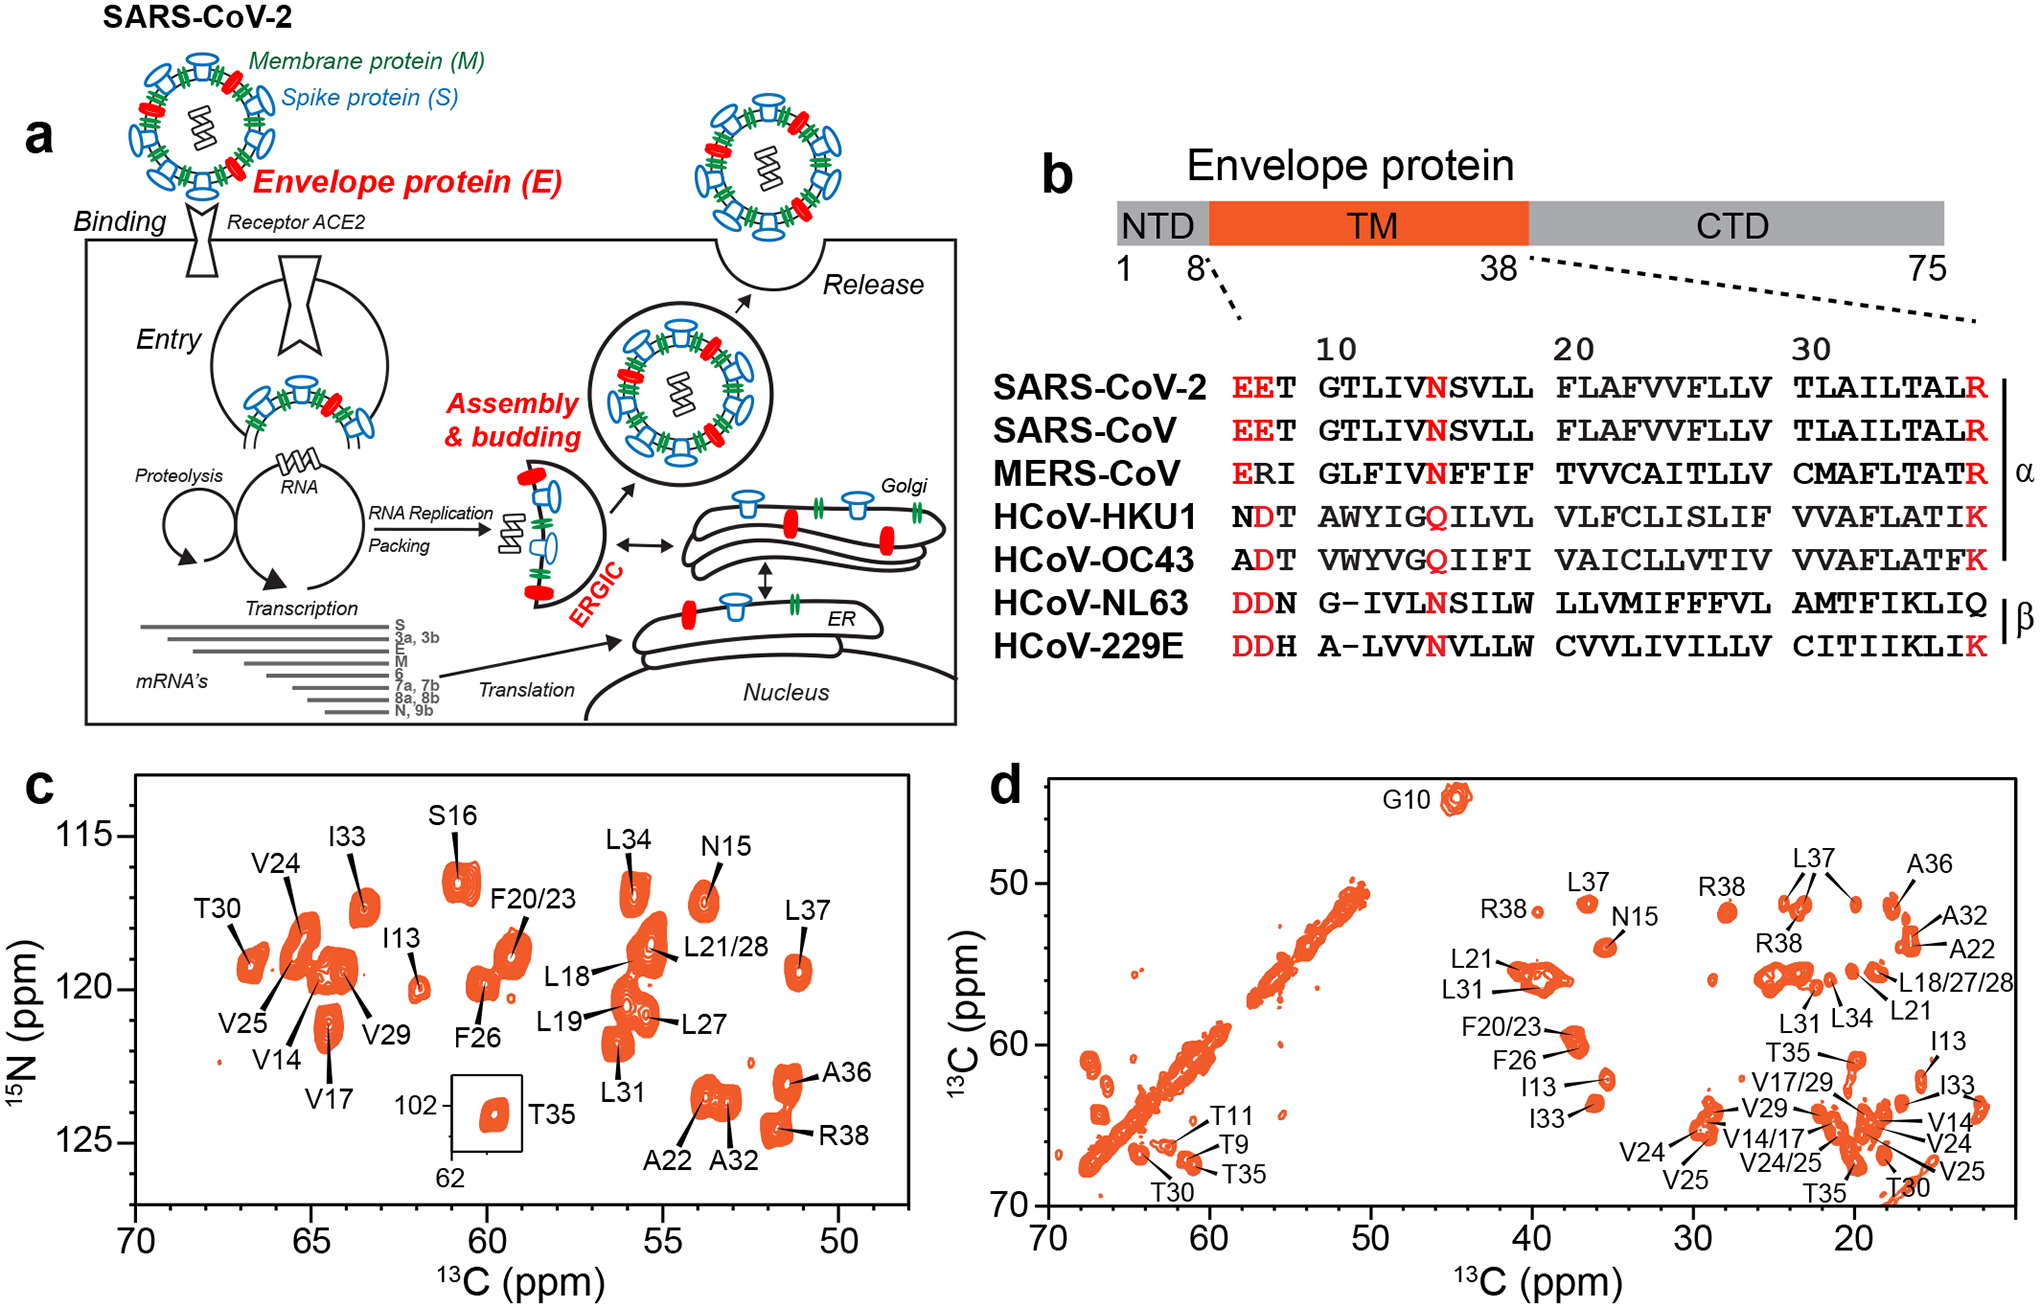
Function, amino acid sequence, and fingerprint NMR spectra of the SARS-CoV-2 E protein. (a) E forms a cation-selective ion channel and mediates SARS-CoV-2 budding and release from the host cell’s ERGIC lumen. (b) Domain architecture of E and sequence alignment of E’s transmembrane segment among several human-infecting coronaviruses. Highly conserved polar residues are shown in red. (c) 2D 15N-13Cα correlation spectrum and (d) 2D 13C-13C correlation spectrum of ERGIC-membrane bound ETM. The spectra, measured at ambient temperature, show high sensitivity and resolution, indicating that ETM is structurally homogeneous in lipid bilayers.
Despite its importance to SARS-CoV-2 pathogenesis, E’s high-resolution structure, particularly for the ion-conducting transmembrane (TM) domain (residues 8–38) (Fig. 1b)2,3, has been elusive. Sedimentation equilibrium and gel electrophoresis data of the homologous SARS-CoV-1 E indicate that the TM domain assembles into a pentamer in detergents such as SDS and perfluorooctanoic acid6,13,14. Although early X-ray scattering data suggested a helical hairpin model15, subsequent solution NMR studies of E bound to several detergent micelles, including DPC10, SDS6, and LMPG16, consistently indicate a single-span TM helix. However, the pore-facing residues and the pentameric assembly are not well established. Fourier-transform infrared dichroic data suggest that the ETM helix orientation in lipid bilayers may be sensitive to the presence or absence of charged residues at the two termini of the TM domain, and by inference, the membrane surface charge17,18.
Here we use solid-state NMR to determine the structure of SARS-CoV-2 ETM structure in phospholipid bilayers, to avoid potential structural distortion caused by detergents. The structure sets the stage for designing E inhibitors as antiviral drugs.
Results
Backbone conformation of ETM in lipid bilayers
We reconstituted ETM into an ERGIC-mimetic lipid bilayer containing phosphatidylcholine, phosphatidyl-ethanolamine, phosphatidylinositol, phosphatidylserine and cholesterol. For comparison, we also incorporated the protein into a dimyristoylphosphocholine (DMPC) : dimyristoylphosphoglycerol (DMPG) model membrane, abbreviated as DMPX below. ETM was expressed in E. coli using a His6-SUMO fusion tag and purified first by nickel affinity column chromatography and then by reverse-phase HPLC after cleavage of the solubility tag (Extended Data Fig. 1).
One-dimensional (1D) 13C and 15N NMR spectra of the protein in ERGIC and DMPX membranes show temperature-insensitive high intensities (Extended Data Fig. 2a, b), indicating that the protein is immobilized in lipid bilayers at ambient temperature. Two-dimensional (2D) 15N-13C and 13C-13C correlation spectra show well-resolved peaks (Fig. 1c, d) with 13C and 15N linewidths of 0.5 ppm and 0.9 ppm, indicating that the protein conformation is highly homogeneous. We assigned the chemical shifts using 3D correlation NMR experiments (Extended Data Fig. 3a). These chemical shifts indicate that residues 14–34 form the α-helical core of the TM domain (Extended Data Fig. 3b, c, Supplementary Table 1). Comparison of spectra between the two membranes and at different temperatures (Extended Data Fig. 2d–f) indicate that the N-terminal segment (residues E8–I13) is dynamic at high temperature but is mostly α-helical, while the C-terminal segment (residues T35–R38) is more rigid but displays temperature-dependent conformations. Acidic pH perturbed the chemical shifts of C-terminal residues L34 to R38 (Extended Data Fig. 4), supporting the conclusion that the C-terminus is conformationally plastic.
Oligomeric structure and hydration of ETM
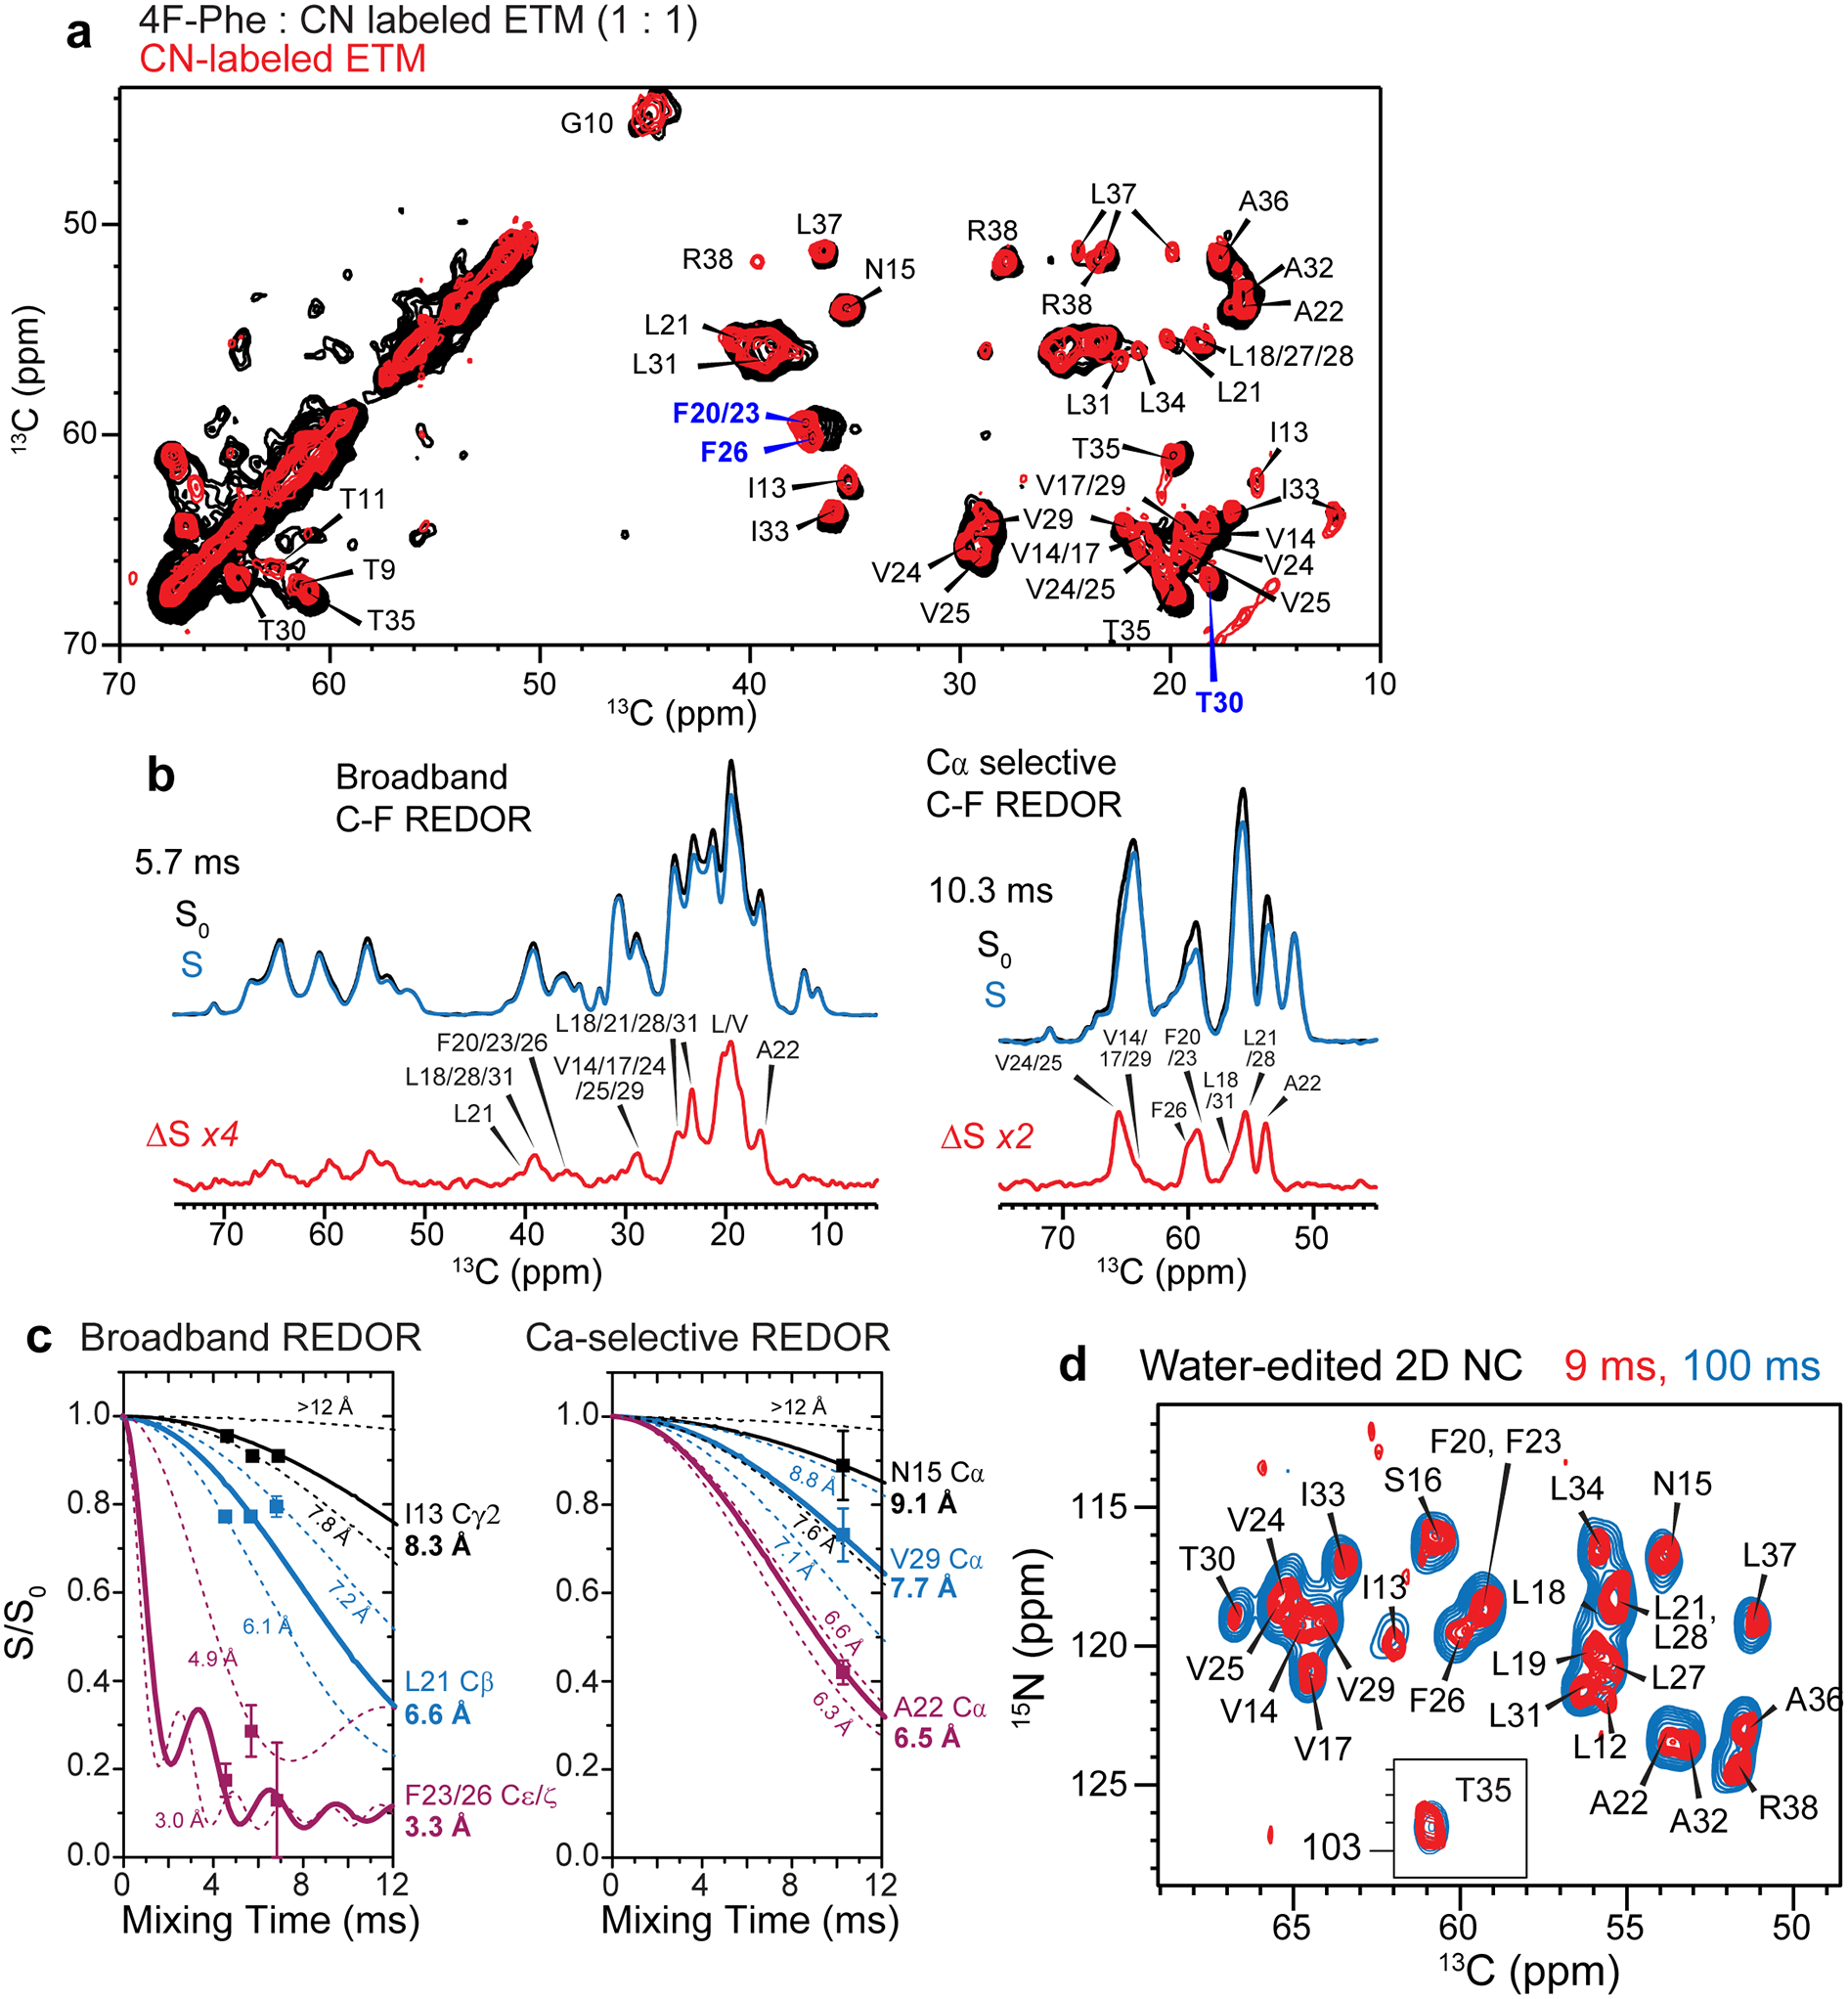
The overall temperature insensitivity of the protein spectra suggests that ETM is oligomerized in lipid bilayers. To determine the oligomeric structure, we prepared two mixed labeled samples to measure intermolecular contacts. An equimolar mixture of 13C-labeled protein and 4-19F-Phe labeled protein (Extended Data Fig. 1e) was used to measure intermolecular 13C-19F distances using the rotational-echo double-resonance (REDOR) technique19 (Fig. 2a). ETM contains three regularly spaced phenylalanine (Phe) residues, Phe20, Phe23 and Phe26, at the center of the TM segment. 1D and 2D 13C NMR spectra were measured without and with 19F pulses. The resulting difference spectra show the signals of carbons that are in close proximity to a fluorinated Phe on a neighboring helix (Fig. 2b, Extended Data Fig. 5a–c). As expected, residues V17 to L31 are affected by 4-19F-Phe, while residues I13 to S16 and A36 to R38 show no REDOR dephasing. Moreover, the three Phe’s display two resolved 19F chemical shifts with a roughly 2:1 intensity ratio, indicating that one of the residues has a distinct sidechain conformation. A 2D 13C-19F correlation spectrum (Fig. 2c) shows a cross peak between the −118 ppm 19F signal and A22 Cβ, indicating that this −118 ppm peak is due to either F20 or F23. The −113 ppm 19F peak shows strong cross peaks with aromatic and numerous aliphatic 13C chemical shifts. Since F20 and F26 are too far away from each other to form intermolecular contacts, the −118 ppm 19F peak must be assigned to F20 while the −113 ppm peak must be assigned to F23 and F26. To constrain the interhelical packing at the two termini of the TM domain, we prepared a 13C and 15N mixed labeled sample, and measured 2D NHHC correlation spectra to identify exclusively intermolecular 15N-13C correlation peaks (Fig. 2d). These experiments together yielded 35 interhelical 13C-19F distance restraints and 52 interhelical 15N-13C correlations, which are crucial for determining the oligomeric structure of ETM.
Figure 2.
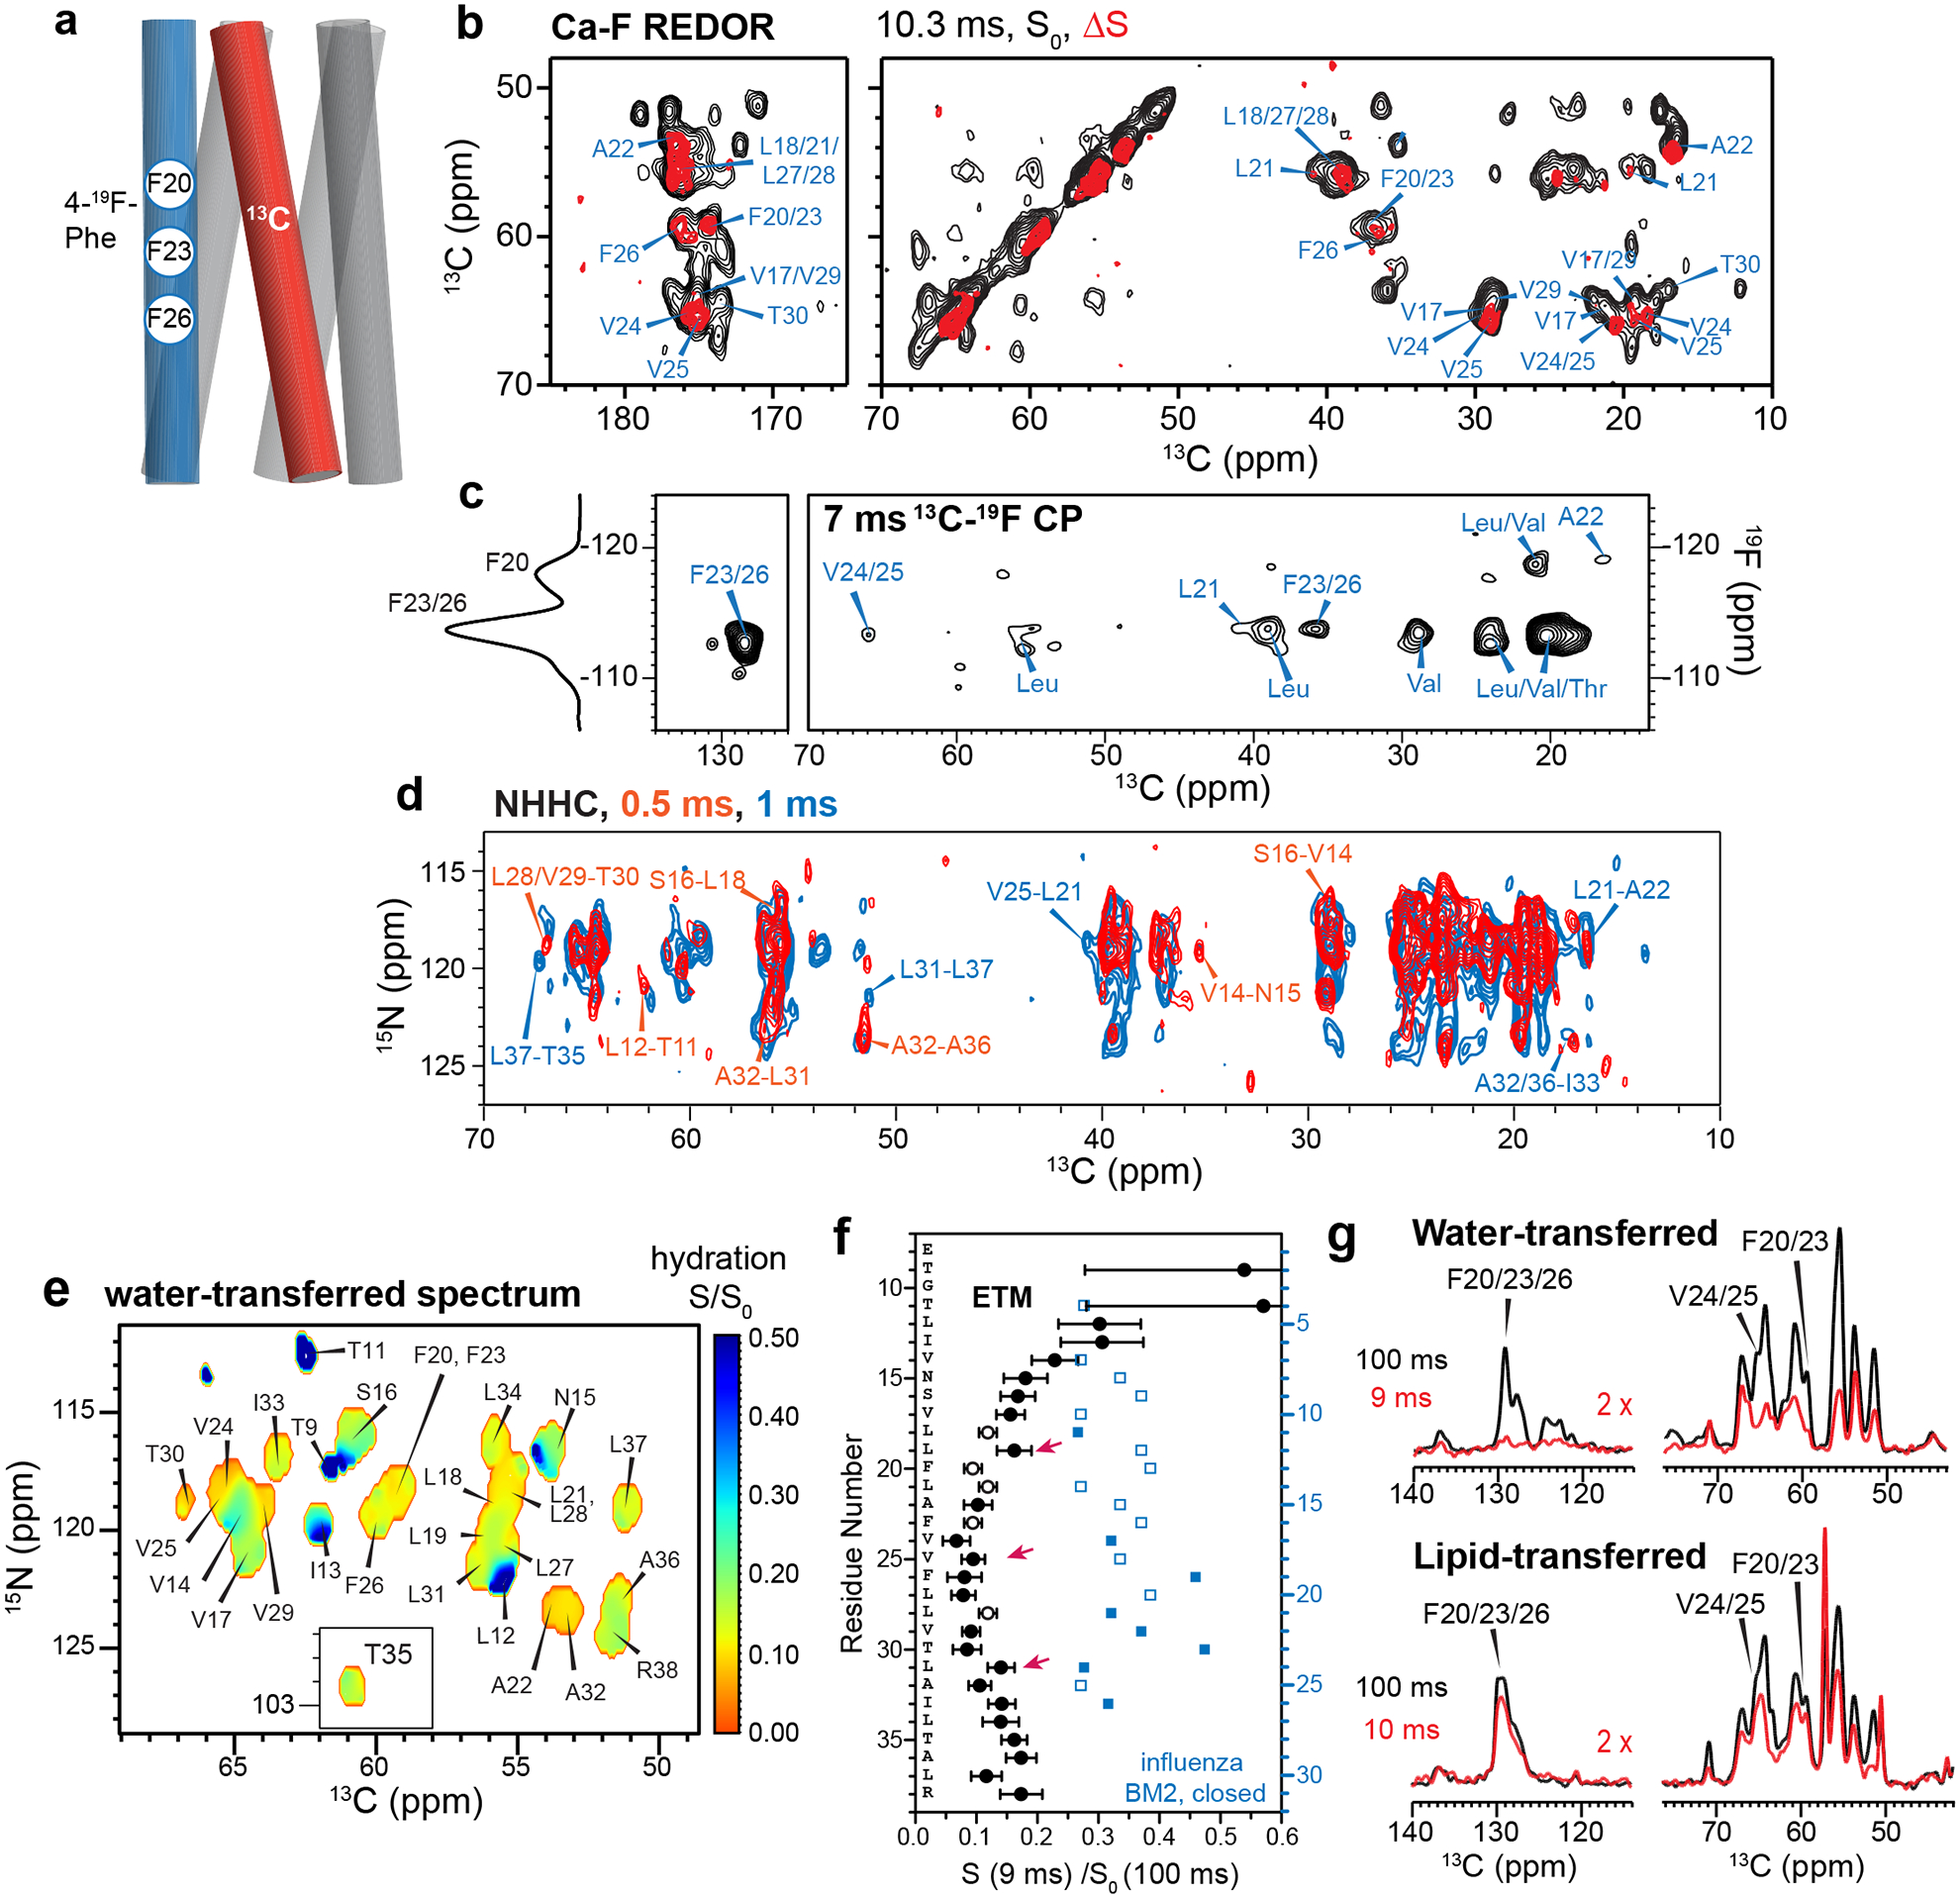
Measurement of interhelical distances and water accessibility of membrane-bound ETM. (a) Schematic of mixed 19F- and 13C-labeled ETM in a five-helix bundle. (b) 2D 13Cα-F REDOR spectra of ERGIC-membrane bound ETM. The difference spectrum (red) shows residues that are close to fluorinated Phe on a neighboring helix. (c) 2D 13C-19F correlation spectrum allows assignment of the −118 ppm peak to F20 due to a cross peak with A22, while the −113 ppm peak is assigned to F23 and F26 based on correlations with F23, F26; and V24 and V25. A 1D 1H-19F cross polarization (CP) spectrum is shown on the left. (d) 2D NHHC correlation spectrum of mixed 13C and 15N labeled ETM, measured using 0.5 ms (red) and 1 ms (black) 1H mixing. All peaks arise from interhelical contacts. Selected assignments are given. (e) Residue-specific water accessibilities of ERGIC-bound ETM obtained from the intensity ratios of water-edited spectra measured with 9 ms and 100 ms 1H mixing. Higher values (blue) indicate larger water accessibility. (f) Water-edited intensities of ETM (black) and influenza BM2 (blue), obtained as the peak intensity ratios of the 9 ms and 100 ms spectra. Closed and open symbols indicate resolved and overlapped peaks, respectively. Error bars indicate the random uncertainty, as propagated from the signal-to-noise ratios of the two spectra. ETM shows lower water-edited intensities than BM2, indicating that the ETM pore is drier than the closed BM2 pore. (g) Water- and lipid-edited 13C spectra of membrane-bound ETM. The Phe signals are high in the lipid-edited spectra but very low in the water-edited spectra, indicating that the three Phe residues are poorly hydrated and point to the lipids or the helix-helix interface.
To further constrain the architecture of ETM self-assembly, we measured residue-specific water accessibilities using water-edited 2D 15N-13C correlation experiments (Fig. 2e, Extended Data Fig. 5d)20,21. Water 1H magnetization transfer is the highest to the N-terminal residues, the least to the central residues L17 to A32, and moderate to the C terminus (Fig. 2f). Thus, the hydration gradient of the protein is primarily along the bilayer normal. The preferential hydration of the N-terminus is especially manifested by the high water-transferred intensity of L19 compared to T30, despite favorable chemical exchange to the Thr sidechain22–24. For the dehydrated center of the TM domain, L28 and V25 show higher hydration than their neighboring residues, suggesting that these residues face the pore. A complementary lipid-edited experiment (Fig. 2g) showed much higher intensities for the Phe sidechain carbons than their corresponding water-transferred intensities, indicating that the Phe residues are largely lipid-facing. The ERGIC-bound ETM shows two-fold lower water accessibility than the closed state of the influenza BM2 at the same pH25 (Fig. 2f).
Structure calculation of ETM in ERGIC membranes
We calculated the structure of ETM using the above 56 (ϕ, ψ) torsion angles, 87 interhelical distance restraints (Supplementary Tables 2, 3), and 196 intrahelical 13C-13C contacts obtained from 250 ms 2D 13C spin diffusion spectra (Extended Data Fig. 6)26. Initial calculation using directionally ambiguous interhelical contacts where the observed helix is assumed to contact either of the two neighboring helices did not converge. Since previously reported micelle-bound ETM structures show significant variations in pore residue identities and handedness of the helical bundle, we evaluated various pentamer packing models (Extended Data Fig. 7 and Supplementary Table 4) for their agreement with experimentally measured constraints, including the water- and lipid-accessibilities, interhelical Phe-Phe contact in the 13C-19F REDOR data, and 13C secondary chemical shifts. A single pentamer model, characterized by having N15 and V25 at similar pore-facing orientations and all three Phe residues facing lipids, was found to best describe the experimental data. This model was subsequently used to disambiguate the direction of interhelical contacts.
The lowest-energy structure ensemble, calculated using XPLOR-NIH (Supplementary Table 5, Table 1), shows a long and tight five-helix bundle with a vertical length of ~35 Å for residues V14–L34. The structure resolution is higher for the middle of the TM domain where 13C-19F REDOR distance restraints are available, and lower for the two termini where fewer distance restraints are available (Fig. 3a, Extended Data Fig. 8a, b). The sidechain rotamers are not precisely defined, especially for sidechains well away from the central three phenylalanine residues (Extended Data Fig. 8b).The channel diameter, represented by backbone Cα-Cα distances between helices i and i+2 for pore-facing residues, varies from 11 Å to 14 Å. The helix is tilted by a small angle of 5–10˚ from the bilayer normal (Fig. 3b), but the orientation is not uniform along the length of the peptide, because the helix is non-ideal but exhibits a rotation angle change, or twist, between residues F20 and F2310,16. Consistent with the small tilt angle, the helical bundle does not display a strong handedness. The pore of the channel is occupied by predominantly hydrophobic residues, including N15, L18, L21, V25, L28, A32 and T35 (Fig. 3b, c, Extended Data Fig. 8a, b), explaining the poor hydration of the protein. The N-terminal pore is constricted by N15, which forms interhelical sidechain hydrogen bonds (Fig. 3g)27. The pore-facing positions of N15 and V25 are consistent with single-channel conductance data that show that mutation of N15 to alanine and V25 to phenylalanine abolish cation conductance3,7. The helix-helix interface is stabilized by aromatic stacking of F23 and F26 (Fig. 3e, g) and van der Waals packing among methyl-rich residues such as the V29-L31-I33 triad (Fig. 3f). These extensive hydrophobic interactions give rise to a tighter helical bundle compared to the viroporins influenza BM2 and HIV-1 Vpu (Extended Data Fig. 8d).
Table 1.
NMR and refinement statistics.
| SARS-CoV-2 ETM (BMRB 30795, PDB 7K3G) |
|
|---|---|
| NMR distance and dihedral constraints | |
| Distance constraints | |
| Total NOE | 283 × 5 |
| Intraresidue | |
| Inter-residue | 283 × 4 |
| Sequential (|i – j| = 1) | 125 × 5 |
| Medium range (2 ≤ |i – j| ≤ 4) | 71 × 5 |
| Long range (|i – j| ≥ 5) | 0 × 5 |
| Intermolecular | 87 × 5 |
| Hydrogen bonds | 11 × 5 |
| Total dihedral-angle restraints | |
| ϕ | 28 × 5 |
| ψ | 28 × 5 |
| Structure statistics | |
| Violations (mean ± s.d.) | |
| Distance constraints (Å) | 0.17 ± 0.06 |
| Dihedral-angle constraints (°) | 0.68 ± 0.34 |
| Max. dihedral-angle violation (°) | 5.54 |
| Max. distance-constraint violation (Å) | 1.74 |
| Deviations from idealized geometry | |
| Bond lengths (Å) | 0.004 ± 0.001 |
| Bond angles (°) | 0.54 ± 0.06 |
| Impropers (°) | 0.42 ± 0.04 |
| Average pairwise r.m.s. deviation (Å)a | |
| Heavy | 2.06 ± 0.58 |
| Backbone | 1.67 ± 0.65 |
Pairwise r.m.s.d. was calculated among 10 lowest-energy refined structures.
Figure 3.
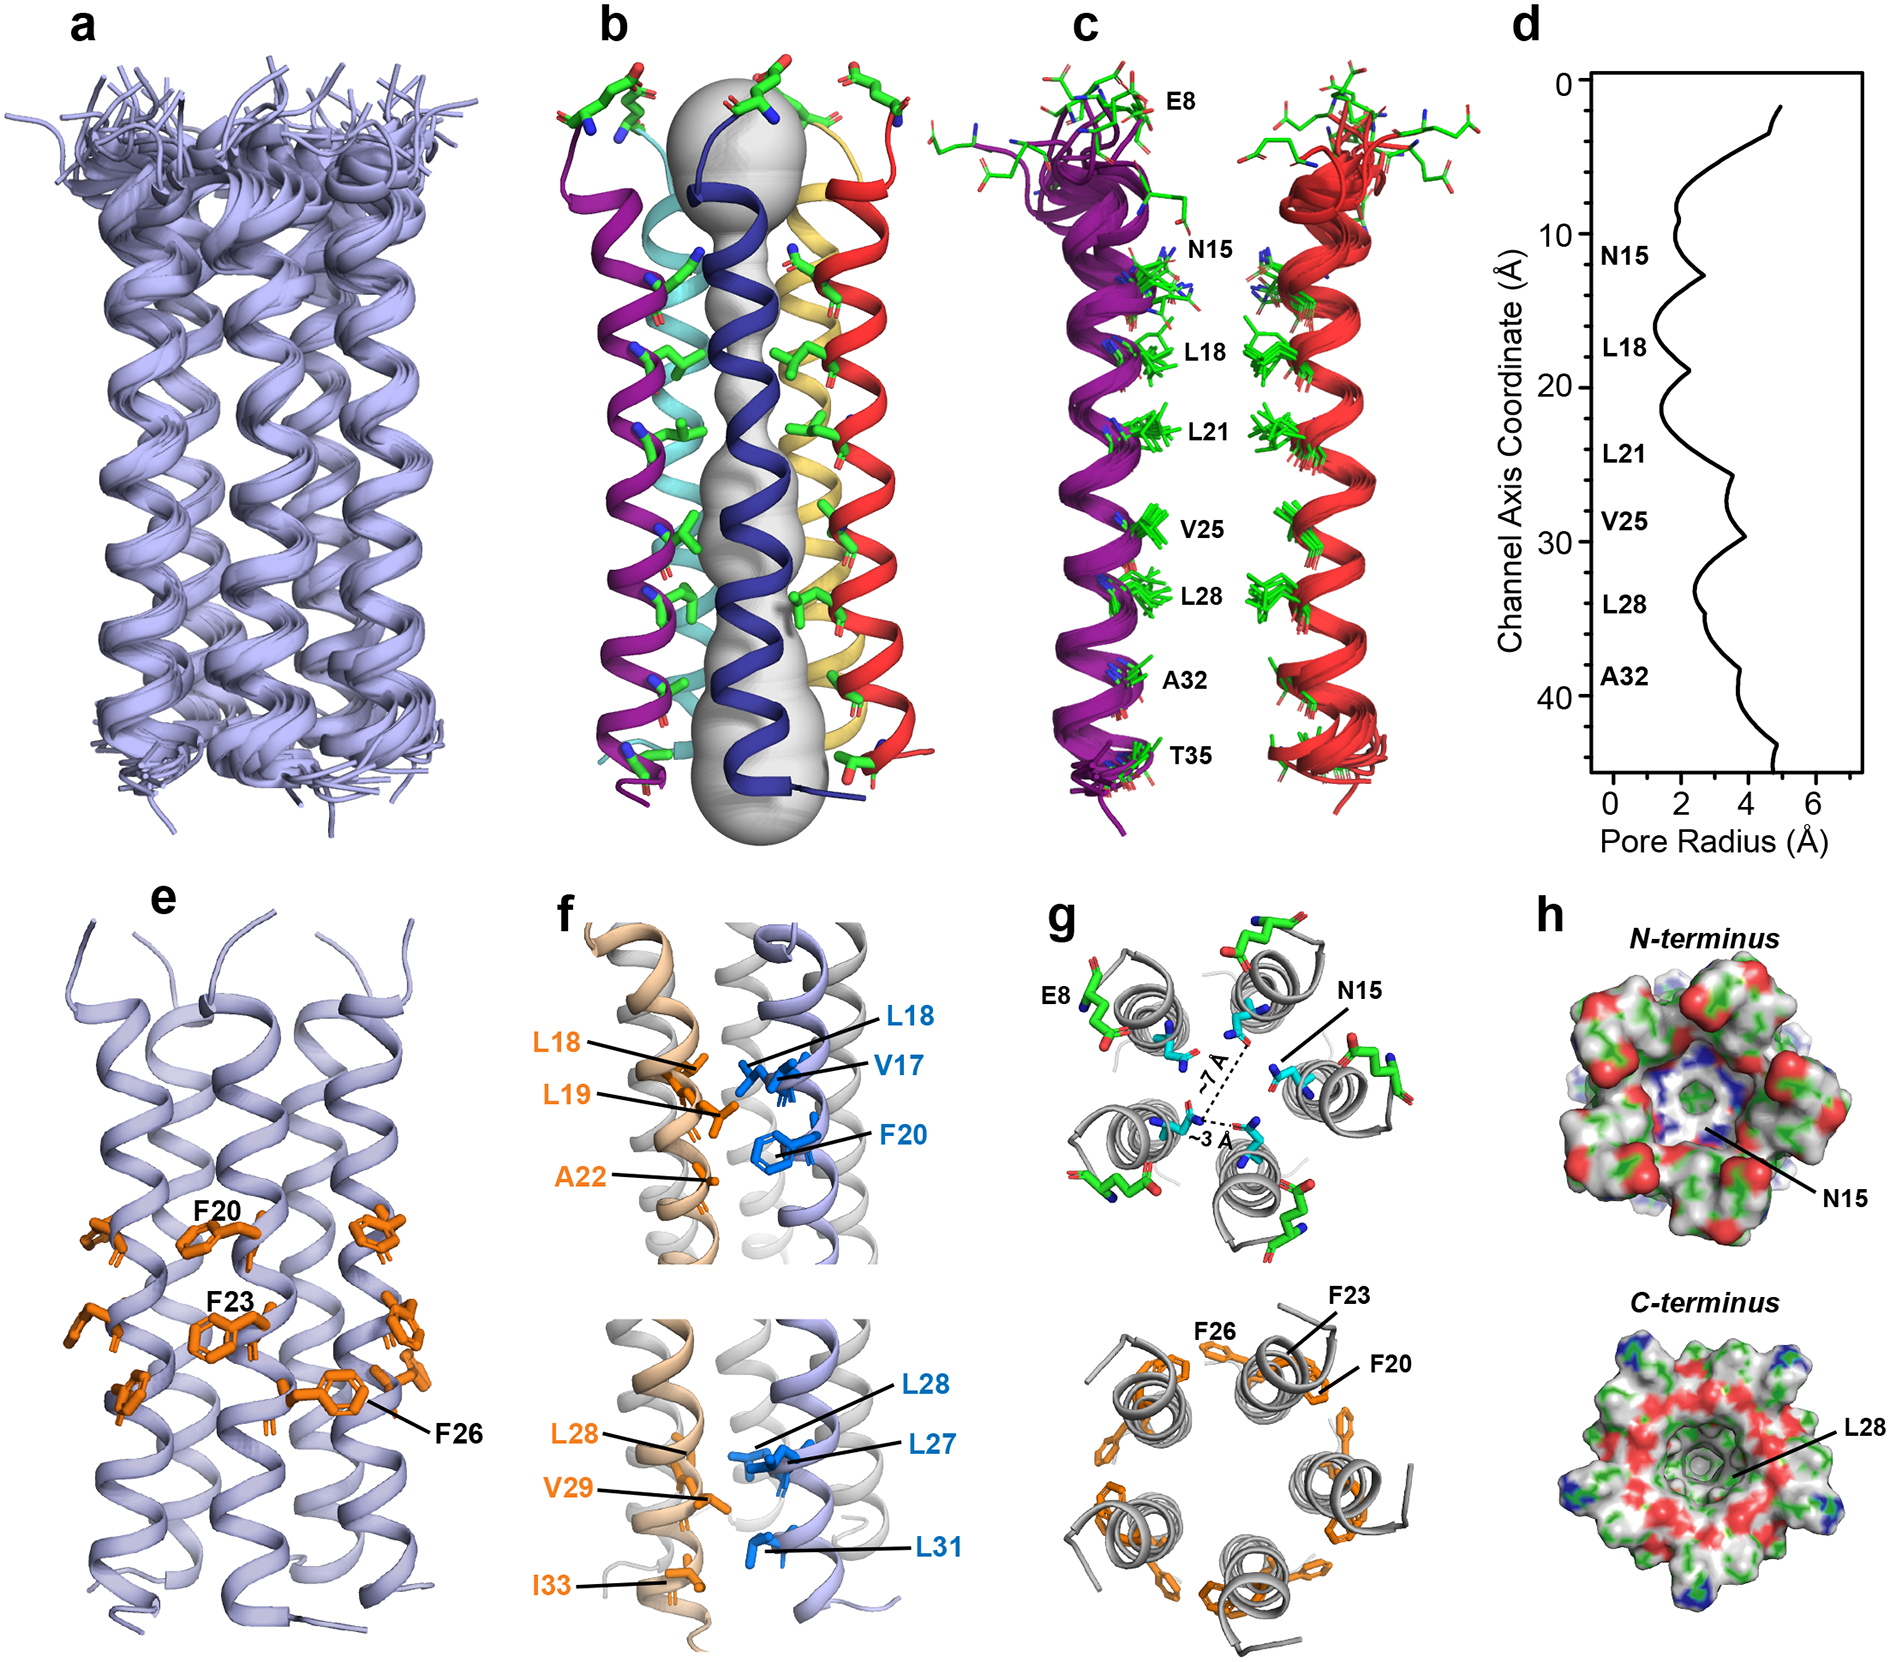
Structure of SARS-CoV-2 envelope protein’s transmembrane domain in ERGIC-mimetic lipid bilayers. (a) Ensemble of ten lowest-energy structures. (b) Sideview of the most representative structure together with the HOLE-calculated pore water (gray). Pore-lining residues are shown in sticks. (c) Simplified two-helix view with the pore-facing residues and their distributions in the lowest-energy ensemble. (d) Pore radius of ETM obtained from the HOLE program. (e-h) Additional snapshots from the most representative structure. (e) Lipid-facing and helix-interface positions of the three Phe residues. (f) Two clusters of methyl-interdigitating Leu, Ile and Val residues, stabilizing the helix-helix interface. (g) Top views of the N-terminal E8, the pore-facing N15, and the three Phe residues. (h) Surface plots of the pentamer, showing the N- and C-terminal vestibules where N15 and L28 are the first pore-facing residue.
ETM interactions with hexamethylene amiloride and amantadine
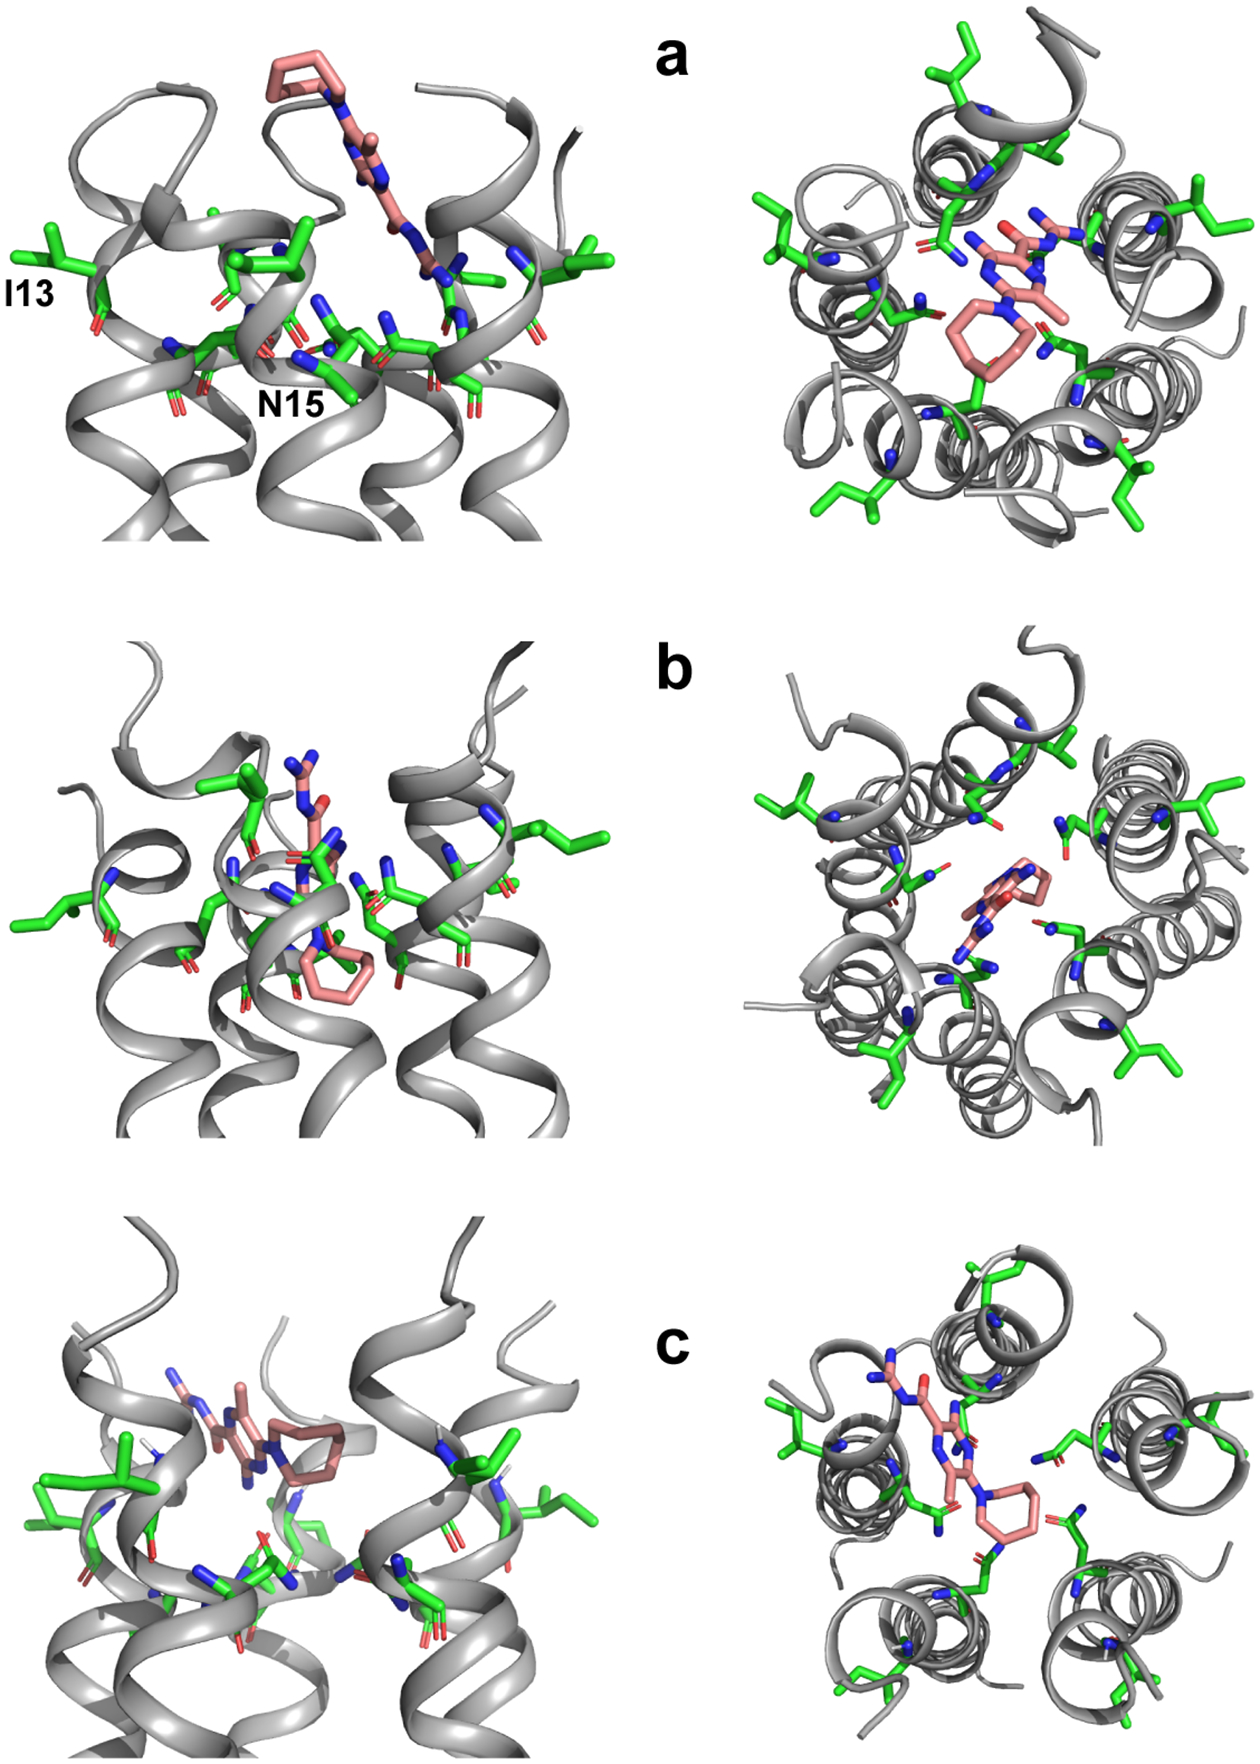
To investigate how ETM interacts with drugs, we measured the chemical shifts of the protein in the presence of HMA and 3-19F-amantadine. At a drug : protein molar ratio of 4 : 1, HMA caused significant chemical shift perturbations (CSPs) to N-terminal residues, including T9, G10, T11, I13 and S16, followed by more modest CSPs for the C-terminal A36 and L37 (Fig. 4a–c). This trend is consistent with the micelle data10,16, but the CSPs in lipid bilayers are much larger, with the N-terminal 9TGT11 triplet giving per-residue CSPs of 0.35–0.70 ppm. Moreover, the CSPs in lipid bilayers were measured under only 4-fold drug excess, while in micelles the smaller CSPs were measured under higher drug excesses of 10 to 31-fold10,16.
Figure 4.
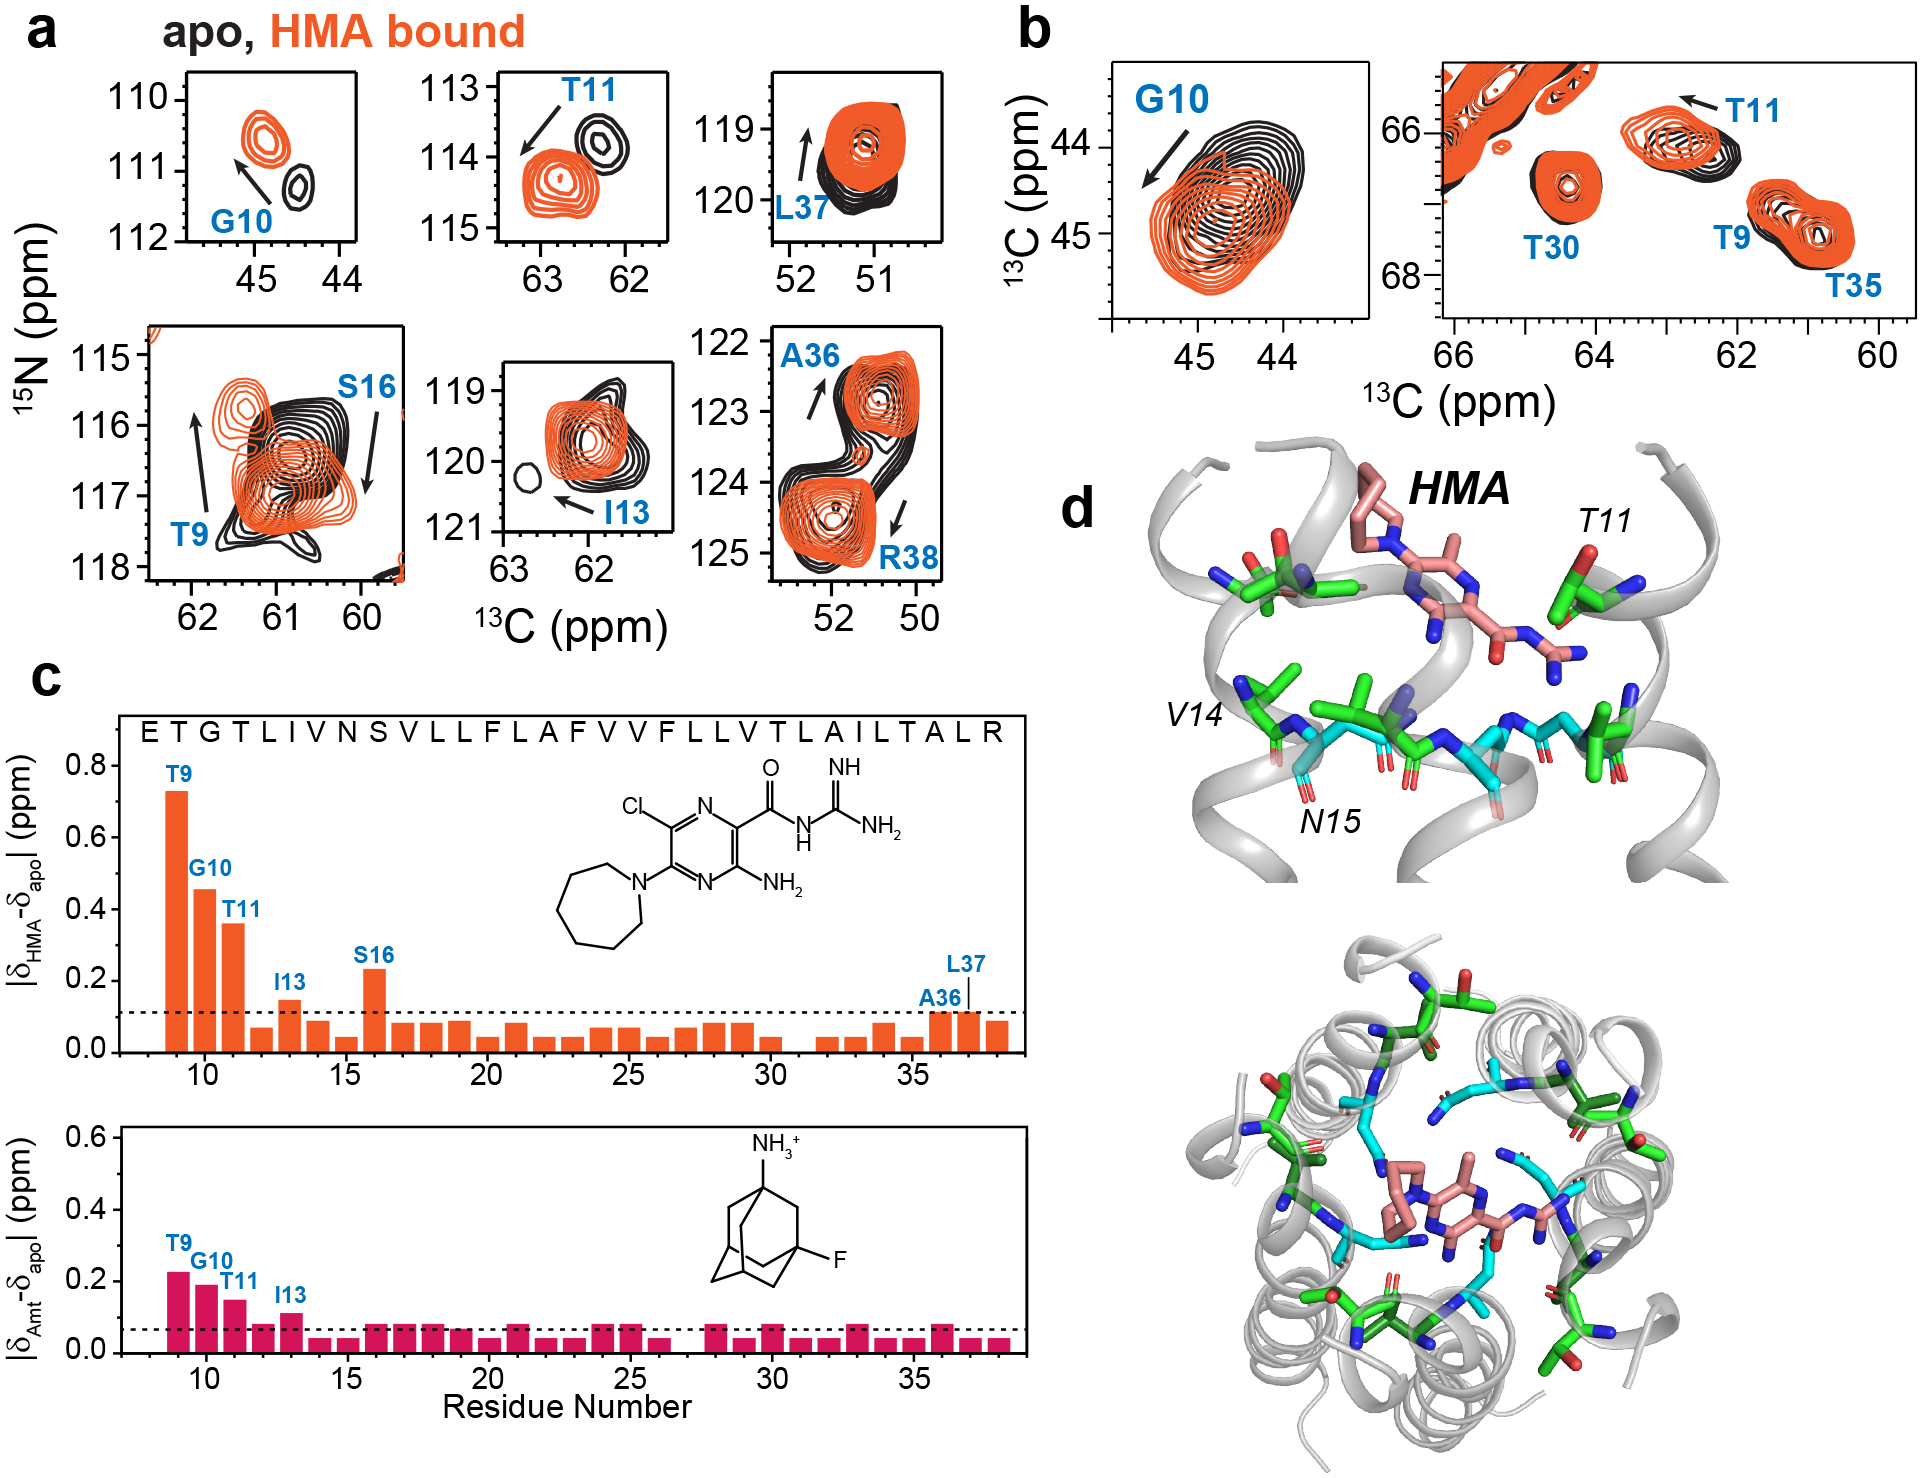
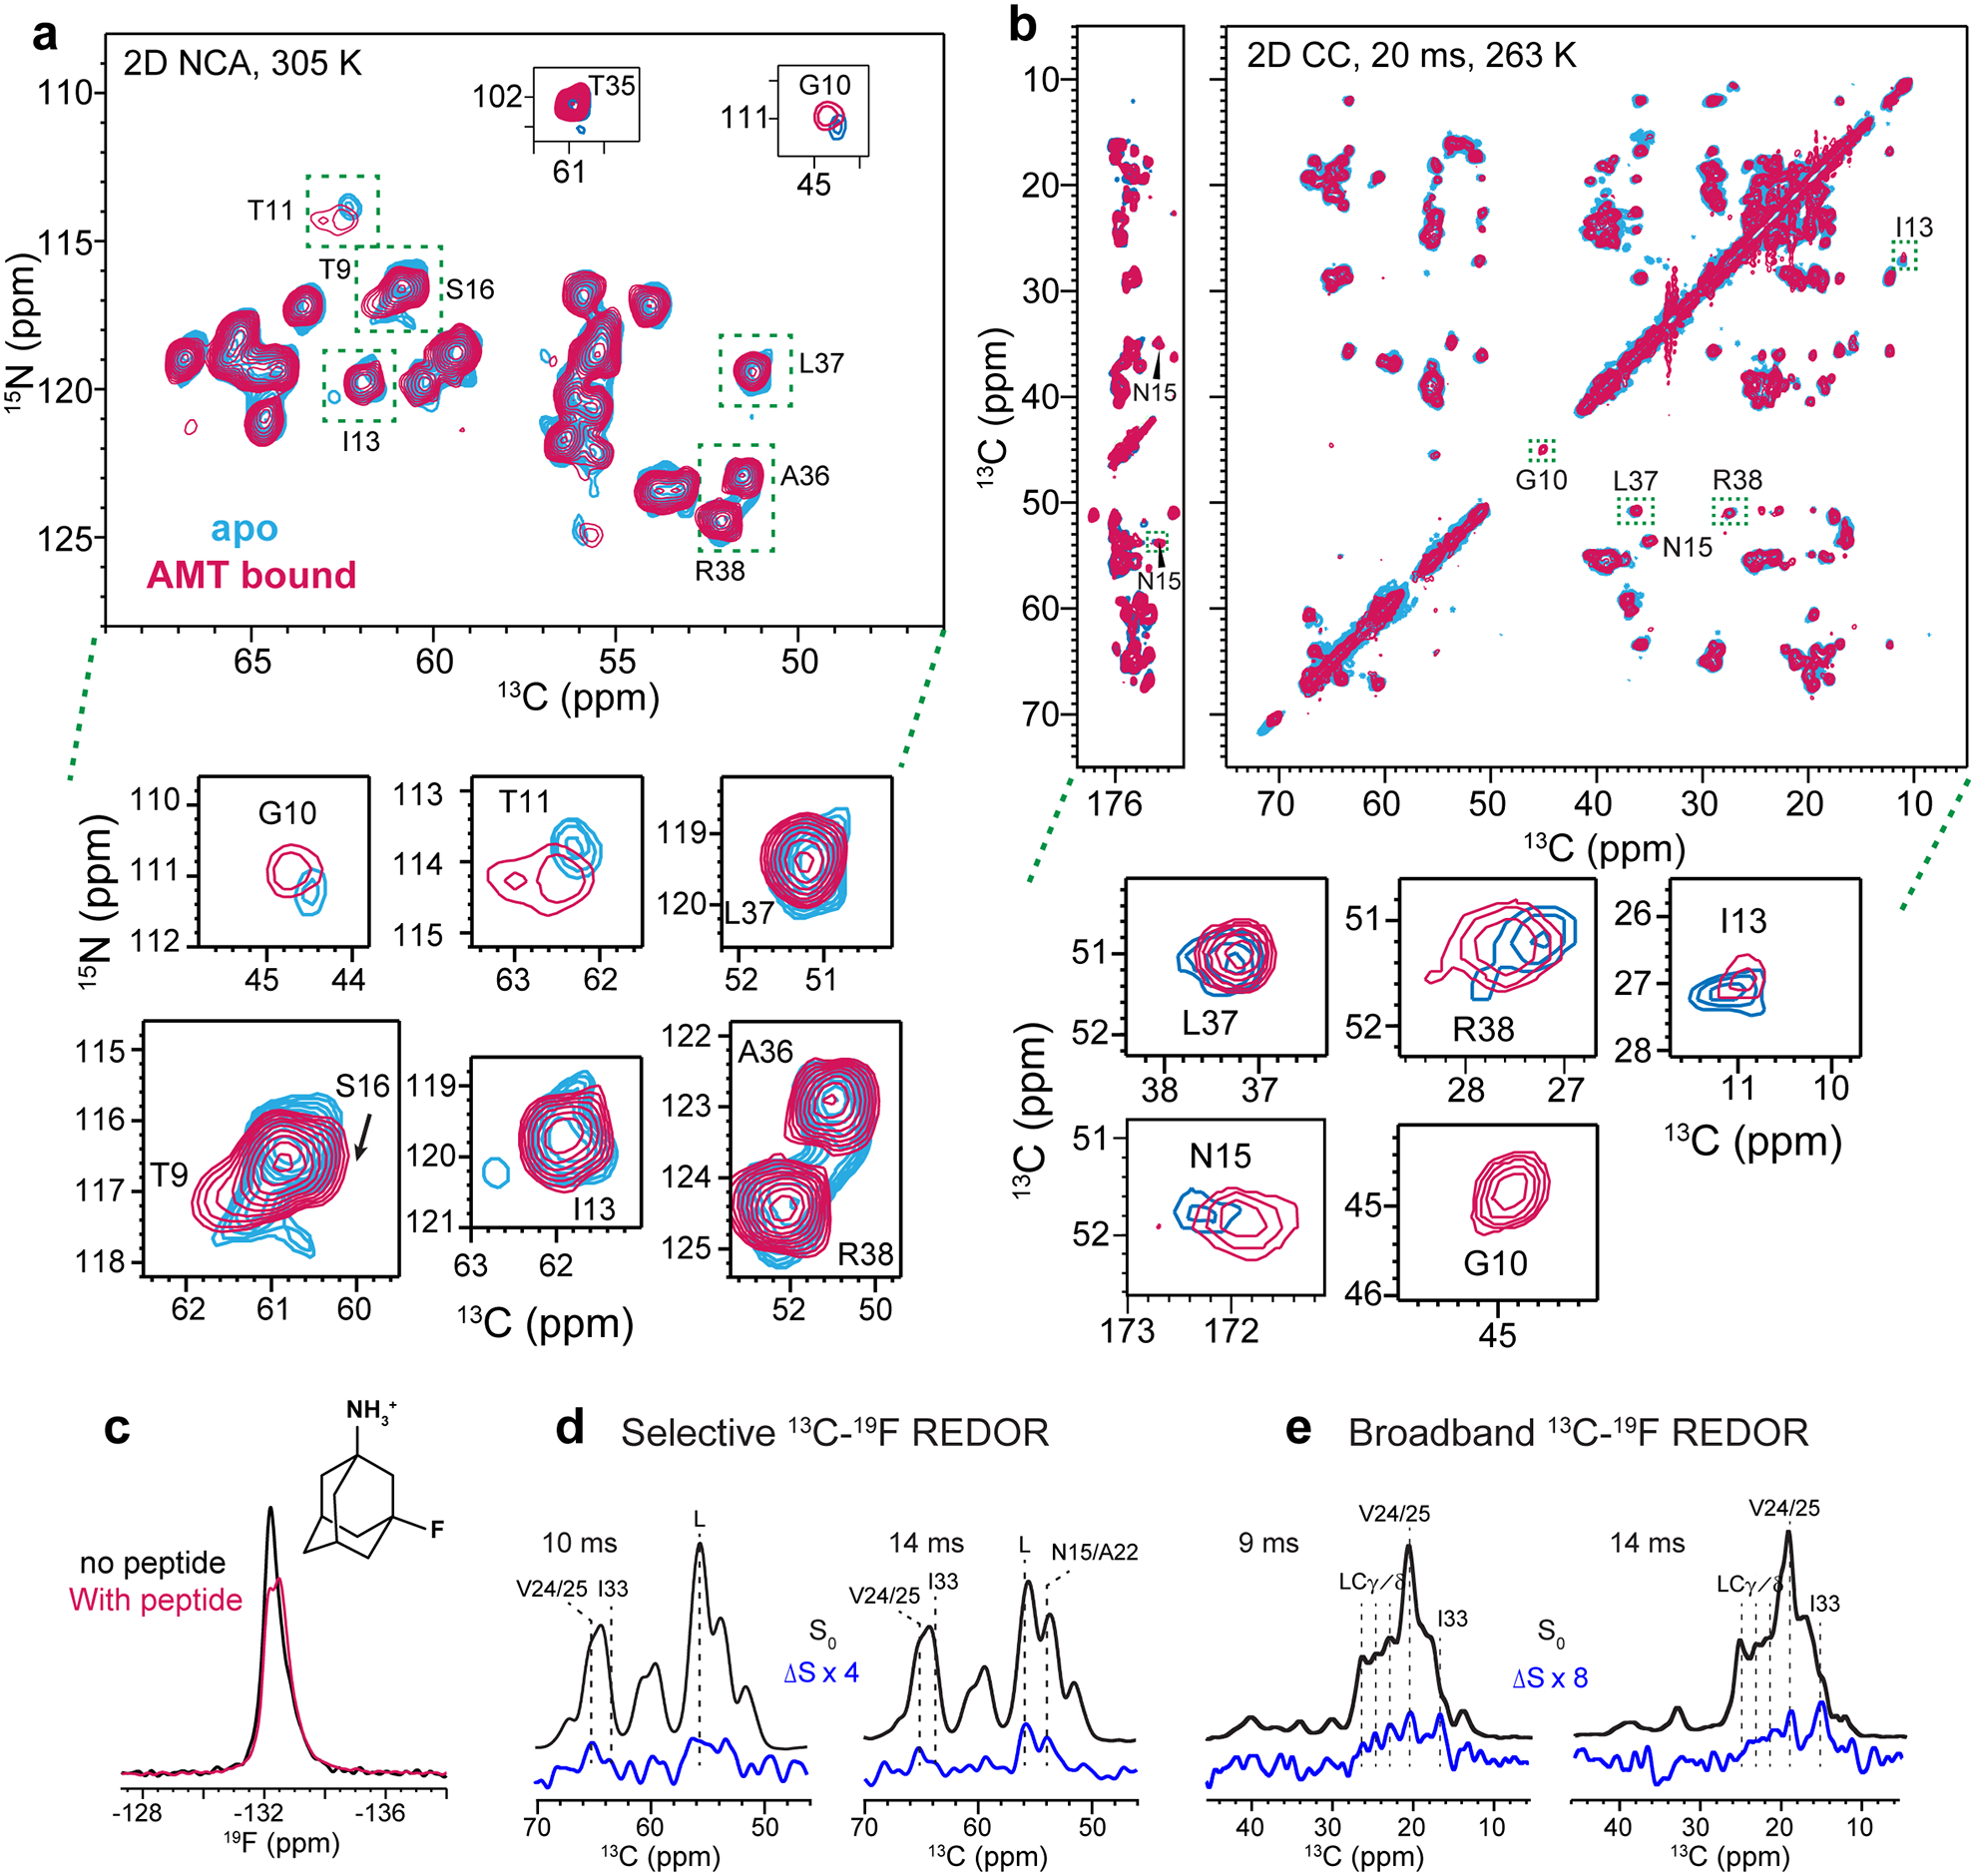
Effects of HMA and AMT binding to ETM in DMPC : DMPG membranes. (a) 2D 15N-13Cα correlation spectra of the apo (black) and HMA-bound ETM (orange), showing chemical shift perturbations (CSPs) by HMA. (b) 2D 15N-13Cα correlation spectra of the apo (black) and HMA-bound ETM (orange). (c) Residue-specific CSPs induced by HMA and AMT. N-terminal residues are the most perturbed by the drugs, and HMA causes larger perturbation than AMT. Dashed lines indicate the average CSPs. (d) A representative docking pose of HMA. The drug lies in the N-terminal vestibule, with the guanidinium group interacting with polar residues such as T11.
The higher sensitivity of ETM to HMA in lipid bilayers strongly suggests that the bilayer-bound protein conformation is more native. Docking based on these CSPs found that HMA intercalates shallowly into the N-terminal lumen with a distribution of orientations (Fig. 4d, Extended Data Fig. 9), suggesting a dynamic binding mode where HMA exchanges between multiple helices and inhibits cation conduction by steric occlusion of the pore. Within the ensemble of docked structures, more HMA molecules point the guanidinium into the pore and the hexamethylene ring towards the lipid headgroups than the reverse orientation. AMT caused smaller CSPs than HMA (Fig. 4c, Extended Data Fig. 10a, b), but the binding site remains at the N-terminus. Using the 3-19F label on adamantane, we measured protein-drug proximities using 13C-19F REDOR. The spectra showed modest dephasing for the N-terminal N15 and C-terminal I33 (Extended Data Fig. 10c–e), in qualitative agreement with the observed CSPs. The larger CSPs of HMA than AMT are consistent with the stronger affinity of HMA6 than AMT7 for SARS-COV E, as well as with the micromolar EC50 reported for HMA against other human coronavirus E proteins28.
Discussion
The current lipid-bilayer-based structural model of SARS-CoV-2 ETM has similarities but also considerable differences from micelle-derived structural models (PDB 5X29)16. In LMPG micelles, the TM domain of a longer E construct (residues 8–65) also displays a kinked helix and a disordered N-terminus, but the helical bundle is right-handed16, the helices are significantly tilted and loosely packed (Extended Data Fig. 8c). In comparison, the bilayer-based ETM structural model does not have a strong handedness, consistent with the small helical tilt angle, and both reflect the measured interhelical distance restraints (Supplementary Tables 2, 3). The heavy-atom RMSD for residues 14–34 between the two structural models is 6.1 Å, and the positions of various important residues differ. For example, in the LMPG-derived structural model, F26 is pore-facing and T30 is interhelical16, but in the bilayer-derived structure model both residues point to lipids. The lipid-facing position of T30 in the current model is supported by single-channel conductance data that show that mutation of residues such as T30 and T11 to alanine does not affect the channel activity3. Another structural model of ETM determined in DPC micelles10 showed a left-handed and coiled helical bundle that differs qualitatively from the LMPG-bound model. These structural differences likely result from a combination of insufficient experimental restraints as well as an inherent conformational plasticity of ETM. The LMPG-based structural model was obtained from 10 unambiguous interhelical distances but no orientational restraints16, whereas the DPC-based structural model was built with orientational restraints but no unambiguous interhelical distance restraints10. For comparison, the current bilayer-derived ETM structure model was calculated from 87 interhelical distance constraints (Table 1).
Apart from experimental limitations, ETM’s oligomeric structure may be intrinsically sensitive to the membrane environment29, because the highly hydrophobic nature of the long central portion of the TM segment makes interhelical interactions non-specific. Indeed, SARS-CoV viruses with a V25F mutation develop escape mutants L27S, L19A, T30I and L37R in mice, implying that E’s channel activity is restored by these compensatory double mutations12. We speculate this could result from moderate changes of the helix rotation angle to give rise to alternate packing of the helical bundle. Future studies of E mutants are required to elucidate the structural basis for the loss and restoration of ion channel activity.
How does the SARS-CoV-2 ETM structure compare with the structures of equivalent viroporins of influenza and HIV-1 viruses in lipid bilayers? The ETM helical bundle is compact and rigid, while AM2 and BM2’s TM domains, which have a higher percentage of polar residues such as His and Ser, form wider and more hydrated pores (Extended Data Fig. 8d)9,25. The HIV-1 Vpu TM domain has a similarly high percentage of hydrophobic residues as SARS-CoV-2 E, but forms a shorter (~20 Å vertical length) pentameric helical bundle with more tilted helices (~20˚)30,31. The ETM helical bundle is more immobilized than M2 and Vpu helical bundles32, and does not undergo rigid-body fast uniaxial rotation at high temperatures in DMPC : DMPG membranes (Extended Data Fig. 2). This immobilization suggests that ETM may interact extensively with lipids3. Finally, the helix distortion at residues F20–F23 may cause the two halves of the protein to respond semi-independently to environmental factors such as pH, charge, membrane composition, and other viral and host proteins.
Which structural features of this ETM helical bundle might be responsible for cation conduction? We hypothesize that the N-terminus, which contains a (E/D/R)8x(G/A/V)10 xxhh(N/Q)15 motif (Fig. 1b), where h is a hydrophobic residue, contains the cation selectivity filter. In this conserved motif, the most exposed residue, E8, belongs to a dynamic N-terminus whose residues (e.g. T9 and G10) manifest intensities only at high temperature (Extended Data Fig. 2d–f). The E8 sidechain carboxyl is deprotonated at neutral pH and protonated at acidic pH, as manifested by 13C chemical shifts (Extended Data Fig. 2c). We speculate that the protonation equilibria of this loose ring of E8 quintet, together with the anionic lipids in the ERGIC membrane, may regulate the ion selectivity of ETM at the channel entrance. Such a ring of negatively charged Glu residues has been observed as selectivity filters in the hexameric Ca2+-selective Orai channels33 and designed K+ channels34. The third residue of the motif (G/A/V) is conserved among coronaviruses to be small and flexible (Fig. 1b), which might permit N-terminus motion and/or prevent occlusion of the channel lumen. The last residue of the motif is conserved to be either Asn or Gln, whose polar sidechains can coordinate ions and participate in interhelical hydrogen bonds to stabilize the channel27. At the C-terminal end of the TM segment, the conserved small residues A32 and T35 provide an open cavity for ions. In contrast to these small polar residues, the central portion of the TM domain contains four layers of hydrophobic residues, L18, L21, V25 and L28, which narrow the pore radius to ~2 Å (Fig. 3d). This narrow pore can only permit a single file of water molecules, thus partially dehydrating any ions that move through the pore. Therefore, the structure determined here may represent the closed state of SARS-CoV-2 E, while the open state might have a larger and more hydrated pore. Narrow pores with multiple hydrophobic layers have also been observed in larger ion channels, including the tetrameric K+ channel TMEM17535 and the pentameric bestrophin channels36,37. Thus, it is possible to achieve charge stabilization and ion selectivity in such a hydrophobic environment, although the detailed mechanisms remain to be understood.
The present membrane-bound ETM structure suggests that small-molecule drugs should have high-affinity binding to both the acidic E8 and the polar N15 in order to occlude the N-terminal entrance of the protein. The membrane topology of SARS-CoV-2 E is now recognized to be Nlumen – Ccyto based on antibody-detected selective permeabilization assays38 and glycosylation data39. This orientation may prime the protein to conduct Ca2+ out of the ERGIC lumen to activate the host inflammasome5. Thus, small-molecule drugs should ideally be targeted and delivered to the Golgi and ERGIC of host cells to maximally inhibit SARS-CoV-2 E’s channel activity40.
Online Methods
Cloning of recombinant ETM(8–38)
The gene encoding full-length SARS-CoV-2/Wuhan-Hu-1 envelope (E) protein (NCBI reference sequence YP_009724392.1, residues 1–75) was purchased from Genewiz. The gene encoding the TM domain (residues 8–38, ETGTLIVNSVLLFLAFVVFLLVTLAILTALR) was isolated using PCR and cloned into a Champion pET-SUMO plasmid (Invitrogen). The plasmid was transfected into E. coli BL21 (DE3) cells (Invitrogen) to express the SUMO-ETM fusion protein containing an N-terminal His6 tag (Extended Data Fig. 1a). The construct’s DNA sequence was verified by Sanger sequencing (Genewiz).
Expression and purification of 13C, 15N-labeled ETM
A glycerol cell swab stored at −70°C was used to start a 10 mL LB culture containing 50 μg/mL kanamycin. The starter culture was used to inoculate 2 L of LB media. Cells were grown at 37°C until an OD600 of 0.6–0.8 and were harvested by centrifugation for 10 minutes at 20°C and 4,400x g. These LB cells were resuspended in 1 L of M9 media (pH 7.8, 48 mM Na2HPO4, 22 mM KH2PO4, 8.6 mM NaCl, 4 mM MgSO4, 0.2 mM CaCl2, 50 mg kanamycin) containing 1 g/L 15N-NH4Cl. The cells were incubated in M9 media for 30 min at 18°C, then 1 g/L U-13C glucose dissolved in 5 mL sterile H2O and 3 mL 100x MEM vitamins were added. The cells were grown for another 30 min, then protein expression was induced by addition of 0.4 mM isopropyl β-D-1-thiogalactopyranoside (IPTG) along with 2 g/L U-13C glucose in 10 mL sterile H2O. Additional IPTG was added after 1 hour to bring the final concentration to 0.8 mM. Protein expression proceeded overnight for 16 hours at 18°C, reaching an OD600 of 2.5.
The cells were spun down at 4°C and 5,000 rpm for 10 min and resuspended in 35 mL Lysis Buffer I (pH 8.0, 50 mM Tris-HCl, 100 mM NaCl, 1.0% Triton X-100, 0.5 mg/mL lysozyme, 10 μL benozonase nuclease, 1 mM Mg2+, 10 mM imidazole). Cells were lysed at 4°C by sonication (5 sec on and 5 sec off) for 1 hour using a probe sonicator. The soluble fraction of the cell lysate was separated from the inclusion bodies by centrifugation at 17,000x g for 20 min at 4°C. The supernatant was loaded onto a gravity-flow chromatography column containing ~6 mL nickel affinity resin (Profinity IMAC, BioRad) pre-equilibrated with Lysis Buffer I. The fractions were bound to the resin for 1 hour by gentle rocking at 4°C. The column was washed with 50 mL of Wash Buffer I (pH 8.0, 50 mM Tris-HCl, 100 mM NaCl, 0.1% n-dodecyl-B-D-maltoside (DDM), 30 mM imidazole). SUMO-ETM was eluted with 10–15 mL Elution Buffer (pH 8.0, 50 mM Tris-HCl, 100 mM NaCl, 0.1% DDM, 250 mM Imidazole) (Extended Data Fig. 1b). The eluted protein was diluted to one-third of the original concentration by adding twice the elution volume of Dilution Buffer (pH 8.0, 50 mM Tris-HCl, 100 mM NaCl, 0.1% DDM) to reduce the imidazole concentration before protease cleavage. Approximately 20% of the protein was also found in the insoluble membrane and inclusion body fraction. To purify this fraction, the pelleted mass was resuspended in Lysis Buffer II (Lysis buffer I with added 6 M urea) and rocked gently at 4°C overnight. Soluble protein was isolated by centrifugation at 17,000x g for 20 min at 4°C. Nickel affinity column chromatography proceeded as described above for the soluble fraction, except that Wash Buffer II (Wash Buffer I with added 3 M urea) was utilized in place of Wash Buffer I.
The purified SUMO-ETM from both the soluble and inclusion body fractions were cleaved by adding 1 : 10 (w/w) SUMO protease : SUMO-ETM and 5 mM tris(2-carboxyethyl)phosphine (TCEP) for 2 hours at room temperature with gentle rocking. The cleavage efficiency was assessed by analytical HPLC to be ~75%. ETM was purified using preparative RP-HPLC on a Varian ProStar 210 System using an Agilent C3 column (5 μm particle size, 21.2 mm × 150 mm). The protein was eluted using a linear gradient of 5–99% (9:1, acetonitrile : isopropanol) : water containing 0.1% trifluoroacetic acid over 35 minutes at a flow rate of 10 mL/min (Extended Data Fig. 1c). The purified protein was dried down to a film with a stream of nitrogen gas and placed under vacuum overnight. The protein film was stored at −20°C. The yield of the purified protein was 10 mg/L of M9 media. Labeling efficiency was ~94% as estimated by MALDI mass spectrometry (Extended Data Fig. 1d). U-13C-labeled ETM and U-15N-labeled ETM were expressed and purified using the same protocol but substituting 15N-NH4Cl or 13C-glucose with unlabeled reagents.
Expression of 4-19F-Phe fluorinated ETM
A glycerol cell swab was used to start a 10 mL LB culture containing 50 μg/mL kanamycin. The starter culture was then used to inoculate 2 L of M9 media (pH 7.8, 48 mM Na2HPO4, 22 mM KH2PO4, 8.6 mM NaCl, 4 mM MgSO4, 0.2 mM CaCl2, 50 mg kanamycin) containing 3 g/L unlabeled glucose and 1 g/L unlabeled NH4Cl. The cells were grown in M9 at 37°C for media for 8 hours until an OD600 of 0.5. The cells were collected by centrifugation at 4,400x g for 10 min at 20°C, then concentrated into a fresh 1 L M9 culture and incubated at 30°C for 60 min. Subsequently, 1.5 g/L glyphosate was added to halt the pentose phosphate pathway41, followed by addition of 115 mg L-Trp, 115 mg L-Tyr and 400 mg of 4-19F-L-Phe to the culture. After 30 min, IPTG was added to a final concentration of 0.4 mM, and protein expression proceeded at 30°C for 5.5 hours. The cells were collected by centrifugation at 4,400x g for 10 min at 4°C. The pellet was stored at −70°C until purification. Cell lysis and protein purification followed the same protocol except that the ETM peak during preparative HPLC was collected in two fractions of ~1 min each. Fluorine incorporation in the two fractions was measured using MALDI mass spectrometry. The first fraction had a higher incorporation level of 83% for all three Phe residues labeled with 19F, indicating a per-residue labeling efficiency of 94% (Extended Data Fig. 1e). Only this fraction was used to prepare the mixed 13C and 19F-labeled protein for distance measurement. The final yield of the Phe-fluorinated ETM expression was 1.5 mg/L of M9 media. When the protocol was originally tested using 100 mg/L 4-19F-Phe, 1.0 g/L glyphosate, 6 g/L unlabeled glucose and with expression at 18°C for 5.5 hours, a much lower per-residue labeling efficiency of ~35% was obtained.
Membrane sample preparation
Eight protein samples were prepared for this study. Five membrane samples contained 13C, 15N-labeled ETM and one contained 13C-labeled ETM. Another sample contained a 1 : 1 mixture of 13C-labeled protein : 15N-labeled protein. The last sample contained a 1 : 1 mixture of 13C-labeled protein : 4-19F-Phe-labeled protein. Six of the eight samples were prepared in a pH 7.5 Tris buffer (20 mM Tris-HCl, 5 mM NaCl, 2 mM ethylenediaminetetraacetic acid (EDTA) and 0.2 mM NaN3). One sample was prepared in a pH 5 citrate buffer with calcium (20 mM Citrate, 5 mM CaCl2 and 0.2 mM NaN3), while the final sample was prepared in the same pH 5 citrate buffer without calcium chloride. Further details about membrane sample preparation and 3-19F-amantadine synthesis are given in Supplemental Note 1.
Solid-state NMR experiments
Most solid-state NMR spectra were measured on a Bruker AVANCE NEO 900 MHz (21.1 T) spectrometer and an Avance II 800 MHz (18.8 T) spectrometer using 3.2 mm HCN probes. 13C-19F REDOR experiments were conducted on an Avance III HD 600 MHz (14.1 T) spectrometer using a 1.9 mm HFX probe. Magic-angle-spinning (MAS) frequencies were 11.8 kHz for 900 MHz experiments and 14 kHz for the 800 and 600 MHz experiments. Radiofrequency (RF) field strengths on the 3.2 mm probes were 50–91 kHz for 1H, 50–63 kHz for 13C, and 33–42 kHz for 15N. RF field strengths on the 1.9 mm MAS probe were 83–130 kHz for 1H, 62.5 kHz for 13C, and 71 kHz for 19F. Sample temperatures are direct readings from the probe thermocouple, whereas actual sample temperatures are 5–15 K higher at the MAS frequencies employed. 13C chemical shifts are reported on the tetramethylsilane scale using the adamantane CH2 chemical shift at 38.48 ppm as an external standard. 15N chemical shifts are reported on the liquid ammonia scale using the N-acetylvaline peak at 122.00 ppm as an external standard.
2D 13C-13C correlation experiments were conducted using COmbined -Driven (CORD) mixing42 for 13C spin diffusion. 2D and 3D 15N-13C correlation spectra, namely, NCACX, NCOCX, and CONCA43, were measured on the 900 MHz spectrometer. These experiments used SPECtrally Induced Filtering In Combination with Cross Polarization (SPECIFIC-CP)44 for heteronuclear polarization transfer. Water-edited 2D 15N-13Cα correlation spectra were measured under 11.8 kHz MAS20,21 using 1H mixing times of 9 ms and 100 ms. 2D 15N-13C correlation spectra were measured using an out-and-back Transferred-Echo Double Resonance (TEDOR) pulse sequence on the 800 MHz NMR45. Intermolecular 2D NHHC correlation spectra46 were measured used 0.5 ms and 1 ms 1H-1H mixing. 1D and 2D 13C-19F REDOR experiments19,47,48 were used to measure distances between 4-19F-Phe-labeled and 13C-labeled ETM, and between 13C-labeled ETM and 3-19F-AMT. Detailed parameters for the solid-state NMR experiments are given in Supplementary Table 6. Details for the 13C-19F REDOR simulations and fitting are given in Supplementary Notes.
NMR spectral analysis
NMR spectra were processed in the TopSpin software and chemical shifts were assigned in Sparky49. TALOS-N50 was used to calculate (ϕ, ψ) torsion angles after converting the 13C chemical shifts to the DSS scale. Residue-specific chemical shift differences between drug-bound and apo samples were calculated from the measured 13C and 15N chemical shifts according to:
| (1) |
2D heatmaps of normalized water-edited 2D NCA spectra were generated using an in-house Python script that removes spectral noise while calculating intensity ratios. The intensities of the 9 ms and 100 ms spin diffusion spectra of the ERGIC-bound ETM were read using the NMRglue package51. Spectral intensity was noise filtered by setting signal lower than 3.5 times the average noise level in an empty region of the 2D spectrum to zero for the S spectrum and to a large number for the S0 spectrum24,25. The intensities were divided and scaled by the number of scans to obtain a 2D contour map that reflect the peak intensity ratios between the 9 ms and 100 ms spectra.
The water accessibility data for the high-pH influenza BM2 proton channel (Fig. 2f) were originally measured in 2D 13C-13C correlation spectra with 4 ms (S) and 100 ms (S0) 1H spin diffusion25. To allow comparison with the ETM spectra measured at 9 ms and 100 ms mixing, we scaled the BM2 S (4 ms) /S0 (100 ms) ratios by the integrated aliphatic intensity ratio of 1.976 between the 1D BM2 water-edited spectra measured with 9 ms and 4 ms mixing. This scaling factor was verified to be accurate for two resolved sites, T24 and G26, in the 1D 13C spectra.
XPLOR-NIH structure calculations and analysis
Initial structure calculation using ambiguous interhelical restraints, where each helix can contact both neighboring helices, did not converge. Thus, we generated parallel pentameric models to specify the direction of 13C-19F and NHHC distance restraints where possible. The models take into account the water- and lipid-edited spectra to qualitatively identify the pore- versus lipid-facing orientations of the residues. The best-case ideal helix model (Extended Data Fig. 7a), with 3.5 residues per helical turn, places N15 at the pore-facing d position and F20 at the lipid-facing b position, in agreement with the water-edited spectra. However, the model conflicts with other data in significant ways. For example, T35(c) and L31(f) are lipid-facing in this model, which contradict the water-edited spectra; V29(d) and F26 (a) are pore-facing, which contradict the water- and lipid-edited spectra. The arc of F20(b), F23(e) and F26(a) on the helical wheel makes it unlikely to establish interhelical Phe-Phe contacts, thus contradicting the 13C-19F distance data.
Since the ideal-helix geometry cannot agree with all experimental data, we sought better models by including slight deviations from an ideal helix. We turned to the measured chemical shifts to determine where such a deviation is most likely to occur. The Cβ chemical shift of L21 is 1.4 ppm downfield from the average of all other helical Leu residues (Extended Data Fig. 3b), suggesting that the helix is disordered between F20 and F23. Indeed, such a disorder was already noted in previous solution NMR data10. We generated four alternative pentamer models with varying positions and degrees of helix disorder (Extended Data Fig. 7b–e, Supplementary Table 4). Only one model (model 5), generated by a small rotation angle advance of ~50˚ at F23, adequately reproduces all key features of the experimental data. This model places N15(d) and V25(d) at the same pore-facing position and the three aromatic residues at the arc of F20(c), F23(f), F26(b). This model was then used to disambiguate the NHHC and 13C-19F distance restraints (Supplementary Tables 2, 3) by mainly considering only residues that are less than four residues away in the primary sequence and that are in close proximity between two helical wheels. With this approach, 42 of the 87 interhelical restraints were set to be unambiguous. In principle, the handedness of the helical bundle can be determined from the registry of interhelical contacts if the position of interfacial residues are known. However, remaining 13C and 15N chemical shift overlap among the many hydrophobic residues precluded unequivocal determination of the handedness of the helical bundle. Orthogonal experimental constraints such as backbone N-H bond orientations, which would directly probe the helix tilt angle, will be needed to obtain a higher-resolution structure.
As previously25, the ETM structure was calculated using XPLOR-NIH52 hosted on the NMRbox53. The calculation contained two stages. In the first stage, five extended ETM monomers were placed in a parallel pentamer geometry with each monomer located 20 Å from the center of the pentamer. A total of 120 independent simulated annealing runs were performed with 5,000 steps of torsion angle dynamics at 5,000 K followed by annealing to 20 K in decrements of 20 K with 100 steps at each temperature. After the annealing, energy minimizations in torsion angle and Cartesian coordinates were carried out. The five monomers were restrained to be identical in the annealing step using the non-crystallographic symmetry term PosDiffPot and the translational symmetry term DistSymmPot. Chemical-shift derived (ϕ, ψ) torsion angles predicted by TALOS-N were implemented with the dihedral angle restraint term CDIH with ranges set to the higher value between twice the TALOS-N predicted uncertainty and 20°. Measured interhelical distance restraints were implemented using the NOE potential. Distance upper limits were set to 9.0 Å and 11.5 Å for 500 μs and 1000 μs of 1H-1H mixing for the NHHC constraints. Negative REDOR contacts, i.e., 13C sites without dephasing, were implemented as two NOE’s: one to each neighboring helix. Implicit hydrogen bonds using the hydrogen-bonding database potential term HBDB were implemented during annealing to favor the formation of the α-helical conformation. Finally, standard XPLOR potentials were used to restrain the torsion angles using a structural database with the term TorsionDB, and standard bond angles and lengths were set with terms BOND, ANGL, IMPR and RepelPot. The structures were sorted by energy, using all the potentials in the calculation. The scales for all potentials are given in Supplementary Table 5.
In the second stage, the three lowest-energy structures from the annealing stage were used as independent inputs for structure refinement. A total of 64 independent XPLOR-NIH runs from each of the three starting structures were performed with 5,000 steps of torsion angle dynamics at 1,000 K followed by annealing to 20 K in decrements of 10 K with 100 steps at each temperature. This was followed by energy minimizations in torsion angle and Cartesian coordinates. All the potentials employed in annealing were also used during refinement, with two additions. The 13C-13C correlations were implemented as intramolecular NOE restraints with an upper limit of 8.0 Å. Inter-residue cross peaks to long hydrophobic side chains such as Phe, Ile, and Leu were sometimes violated. Consequently, the upper limits for these 5% of restraints were increased to 12.0 Å. Explicit hydrogen bonds for residues I13 (hydrogen-bonded to V17) – N15 (hydrogen-bonded to L19) and F23 (hydrogen-bonded to L27) – T30 (hydrogen-bonded to L34) were substituted for implicit hydrogen bonds using the same HBDB potential. Finally, the scales of the NOE, Repel, and TorsionDB potentials were increased (Supplementary Table 5). All 192 structures from the three independent runs were pooled and sorted using the CDIH, NOE, HBDB, BOND, ANGL, IMPR, Repel and Repel14 potentials, while excluding PosDiffPot, DistSymmPot and TorsionDB potentials. The ten structures with the lowest energies across the specified potentials were included in the final structural ensemble. Where single-structure images are shown, the most representative conformer, selected as the model with the lowest average RMSD for residues 10–36 with respect to all the other structural models, is shown. The Ramachandran Plot statistics for the final structure ensemble are as follows: 93% of residues are in favored regions, 5% of residues are in allowed regions, and 2% of residues are in disallowed regions. The only outlier is L37, which is outside the TM helix, near the C-terminus.
Graphical images depicting the structures were generated in PyMOL v2.3.4. The reported channel radii were calculated using the HOLE program54, and represent the radii of the largest sphere that can be accommodated from exclusion of the van der Waals diameter of all atoms at each XY plane along the Z channel coordinate, which is collinear with the bilayer normal and the putative direction of ion permeation. The cutoff radius for the calculation was 5 Å. The HOLE output was visualized in PyMOL by setting the van der Waals radius of the HOLE-generated spheres ‘SPH’ to the b-factor values of the SPH output. Details of HMA docking to ETM are given in Supplementary Notes.
Extended Data
Extended Data Figure 1.
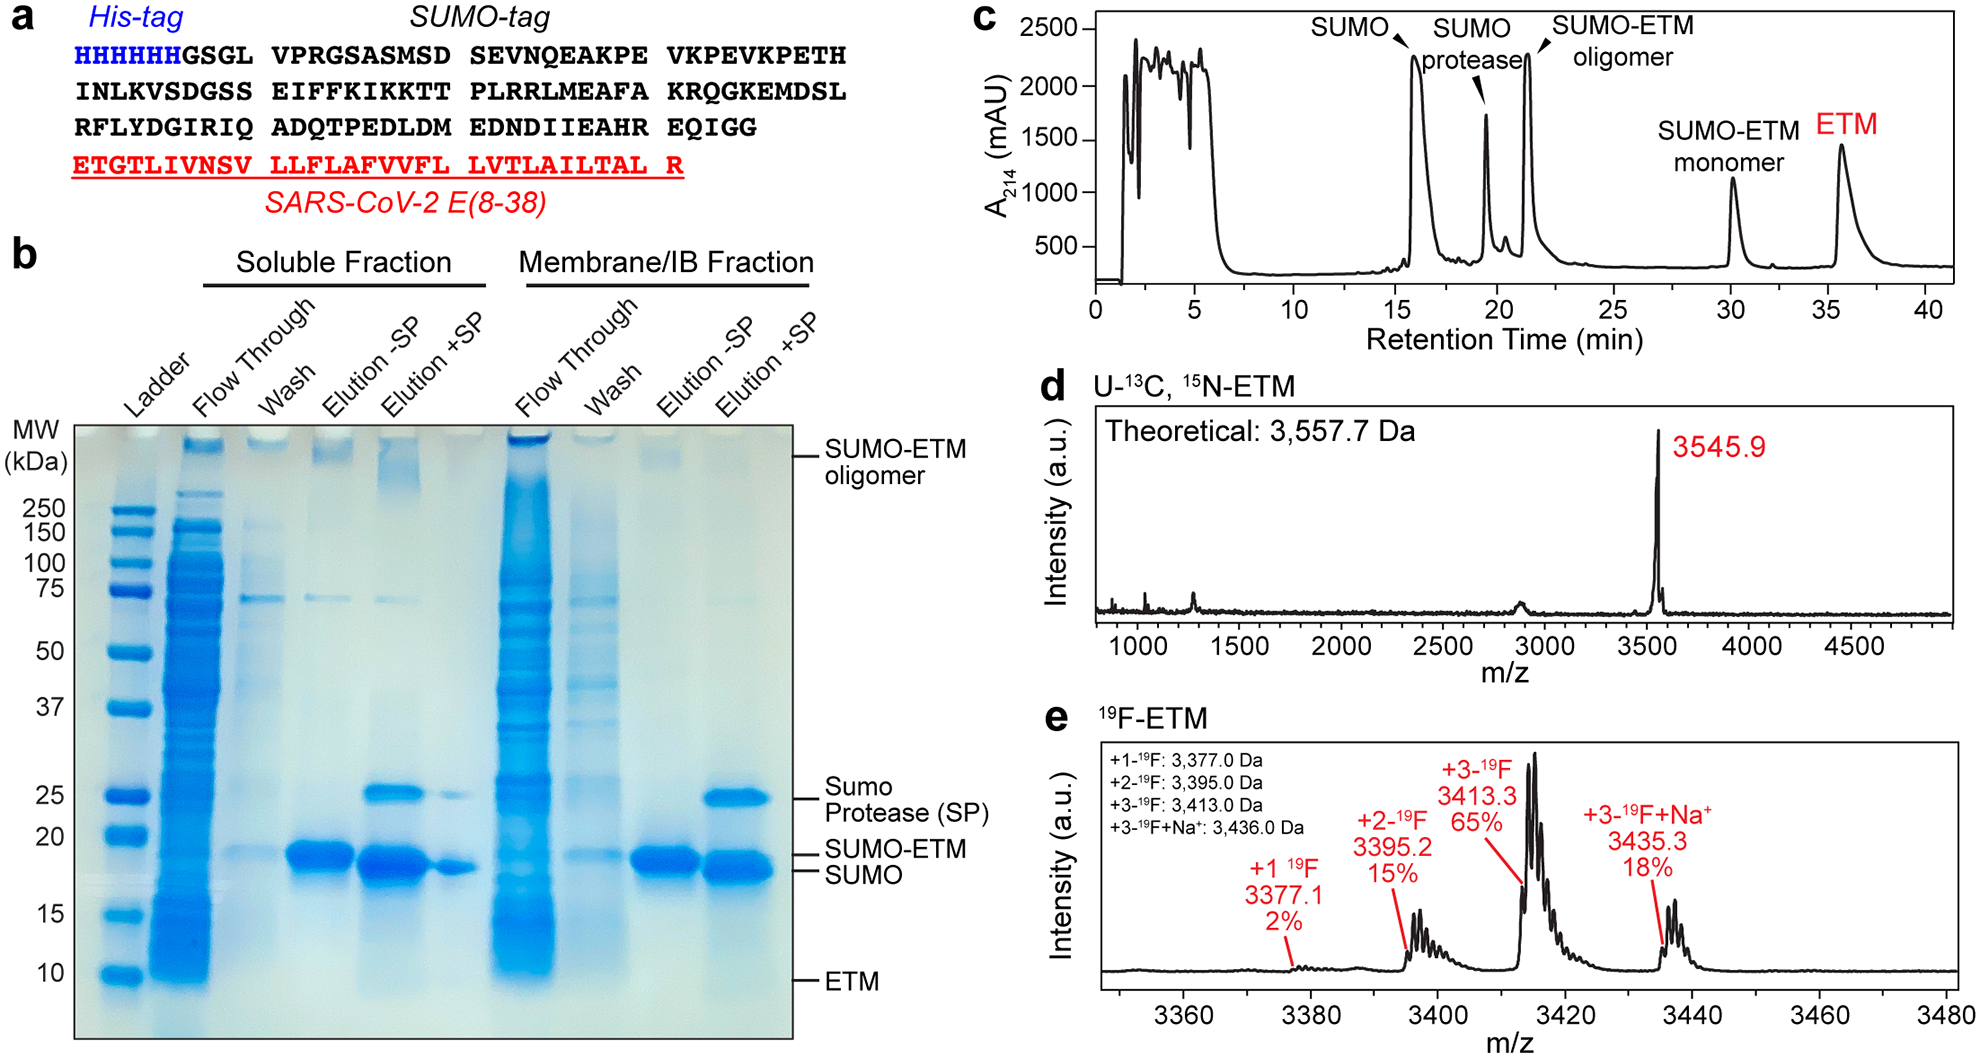
Cloning, purification and characterization of ETM. (a) Amino acid sequence of SUMO-tagged ETM. (b) SDS-PAGE gel showing purification of ETM by nickel affinity column chromatography. The flowthrough contains all soluble proteins that have low affinity for nickel. The column was washed with 30 mM imidazole, and SUMO-ETM (18 kDa band) was eluted at >90% purity with 250 mM imidazole. High molecular-weight SUMO-ETM oligomers are visible as a minor species. ETM was cleaved from the SUMO tag using SUMO protease. (c) Preparative reverse-phase HPLC chromatogram after protease cleavage. ETM elutes at 37.5 min. (d) MALDI mass spectrum of purified U-13C, 15N labeled ETM. (e) MALDI mass spectrum of purified 4-19F-Phe labeled ETM. The measured masses are in good agreement with the theoretical masses. 83% of the 4-19F-Phe labeled ETM monomers have all three Phe residues fluorinated, indicating a per-site labeling efficiency of 94%.
Extended Data Figure 2.
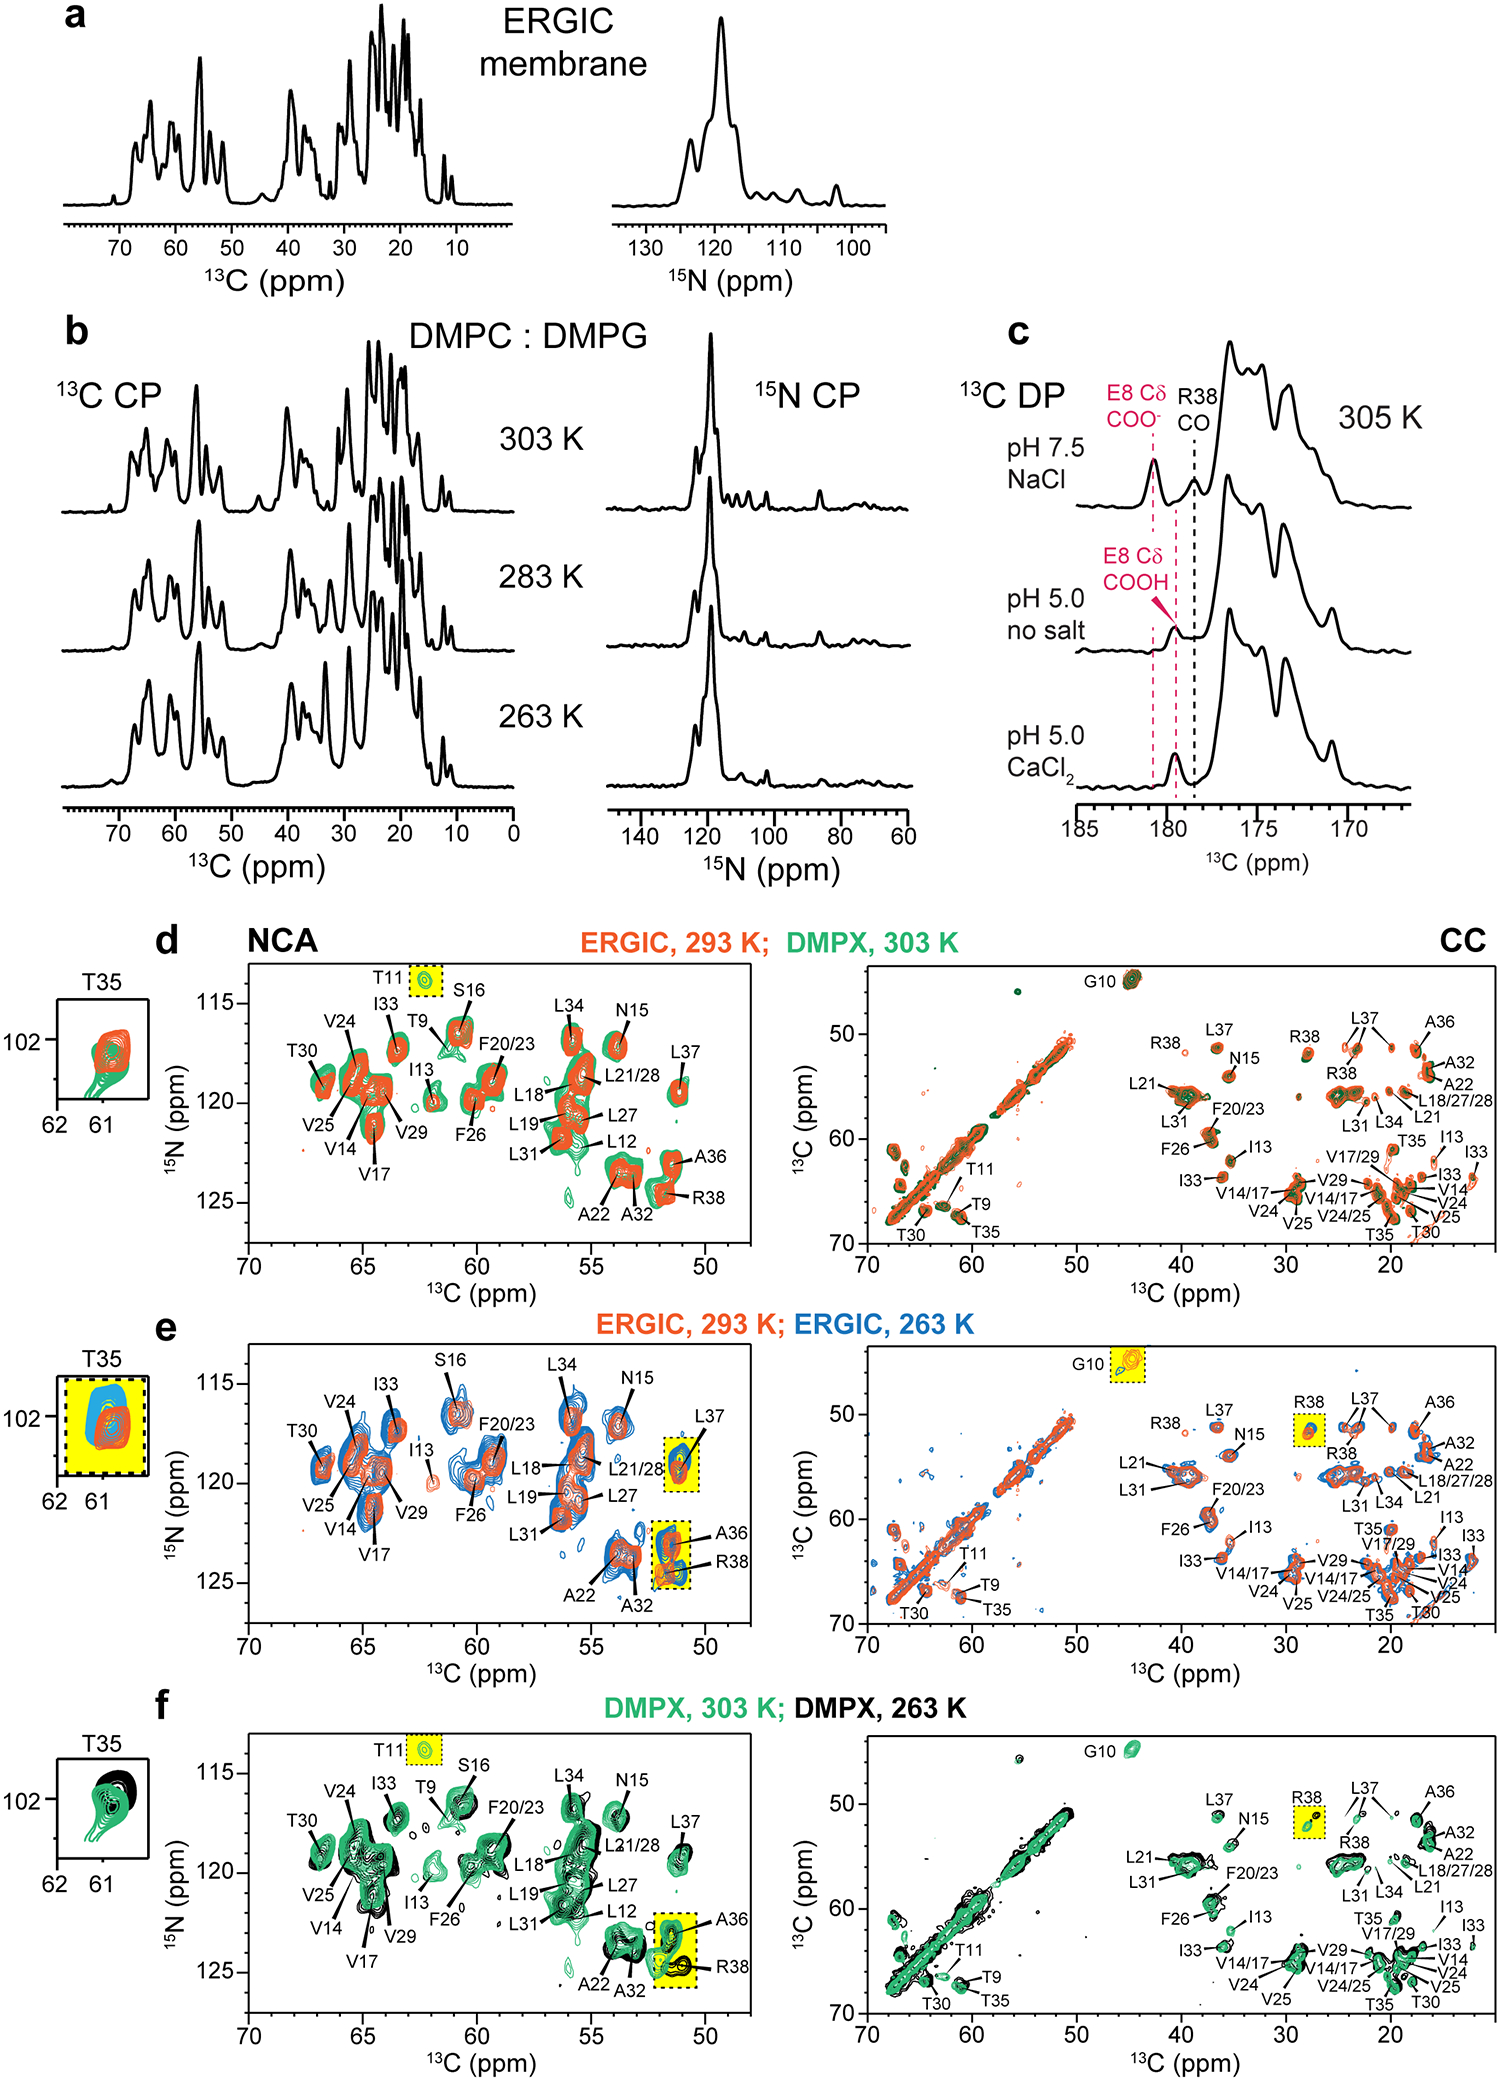
Effects of temperature and membrane composition on ETM structure. (a) 13C and 15N CP-MAS spectra of ERGIC-bound ETM. The spectra show high sensitivity and resolution, indicating a well ordered and rigid protein. (b) 13C and 15N CP-MAS spectra of ETM in DMPX membranes from 303 K to 263 K. The spectral intensities and linewidths are insensitive to temperature, indicating that the protein is mostly immobilized at ambient temperature. (c) 13C direct-polarization (DP) spectra of DMPX-bound ETM. The E8 sidechain carboxyl chemical shift changes between high and low pH, indicating that this residue is protonated at low pH. (d-f) 2D 15N-13C (left) and 13C-13C (right) correlation spectra of ETM at high and low temperatures and in ERGIC versus DMPX membranes. Yellow rectangles highlight peaks with clear chemical shift or intensity changes. (d) 2D spectra of ERGIC-bound ETM (orange) at 293 K and DMPX-bound ETM at 303 K (green). The chemical shifts are similar, indicating that the protein conformation is unaffected by the presence of POPS, POPI and cholesterol. T11 and L12 signals are not detected in the ERGIC sample at this temperature, suggesting that the N-terminus is mobile under these conditions. (e) 2D spectra of ERGIC-bound ETM at 293 K (orange) and 263 K (blue). Moderate chemical shift changes are observed for C-terminal residues from T35 to R38, while the I13 signal is not visible at low temperature. (f) 2D spectra of DMPX-bound ETM at 303 K (green) and 263 K (purple). The C-terminal residues exhibit temperature-dependent chemical shifts, similar to the ERGIC-bound peptide. The N-terminal residues of T9 to I13 do not exhibit signals at 263 K, indicating that the N-terminus undergoes intermediate-timescale motion at this temperature. Thus, the C-terminal conformation is temperature-dependent while the N-terminus is dynamic at high temperature.
Extended Data Figure 3.
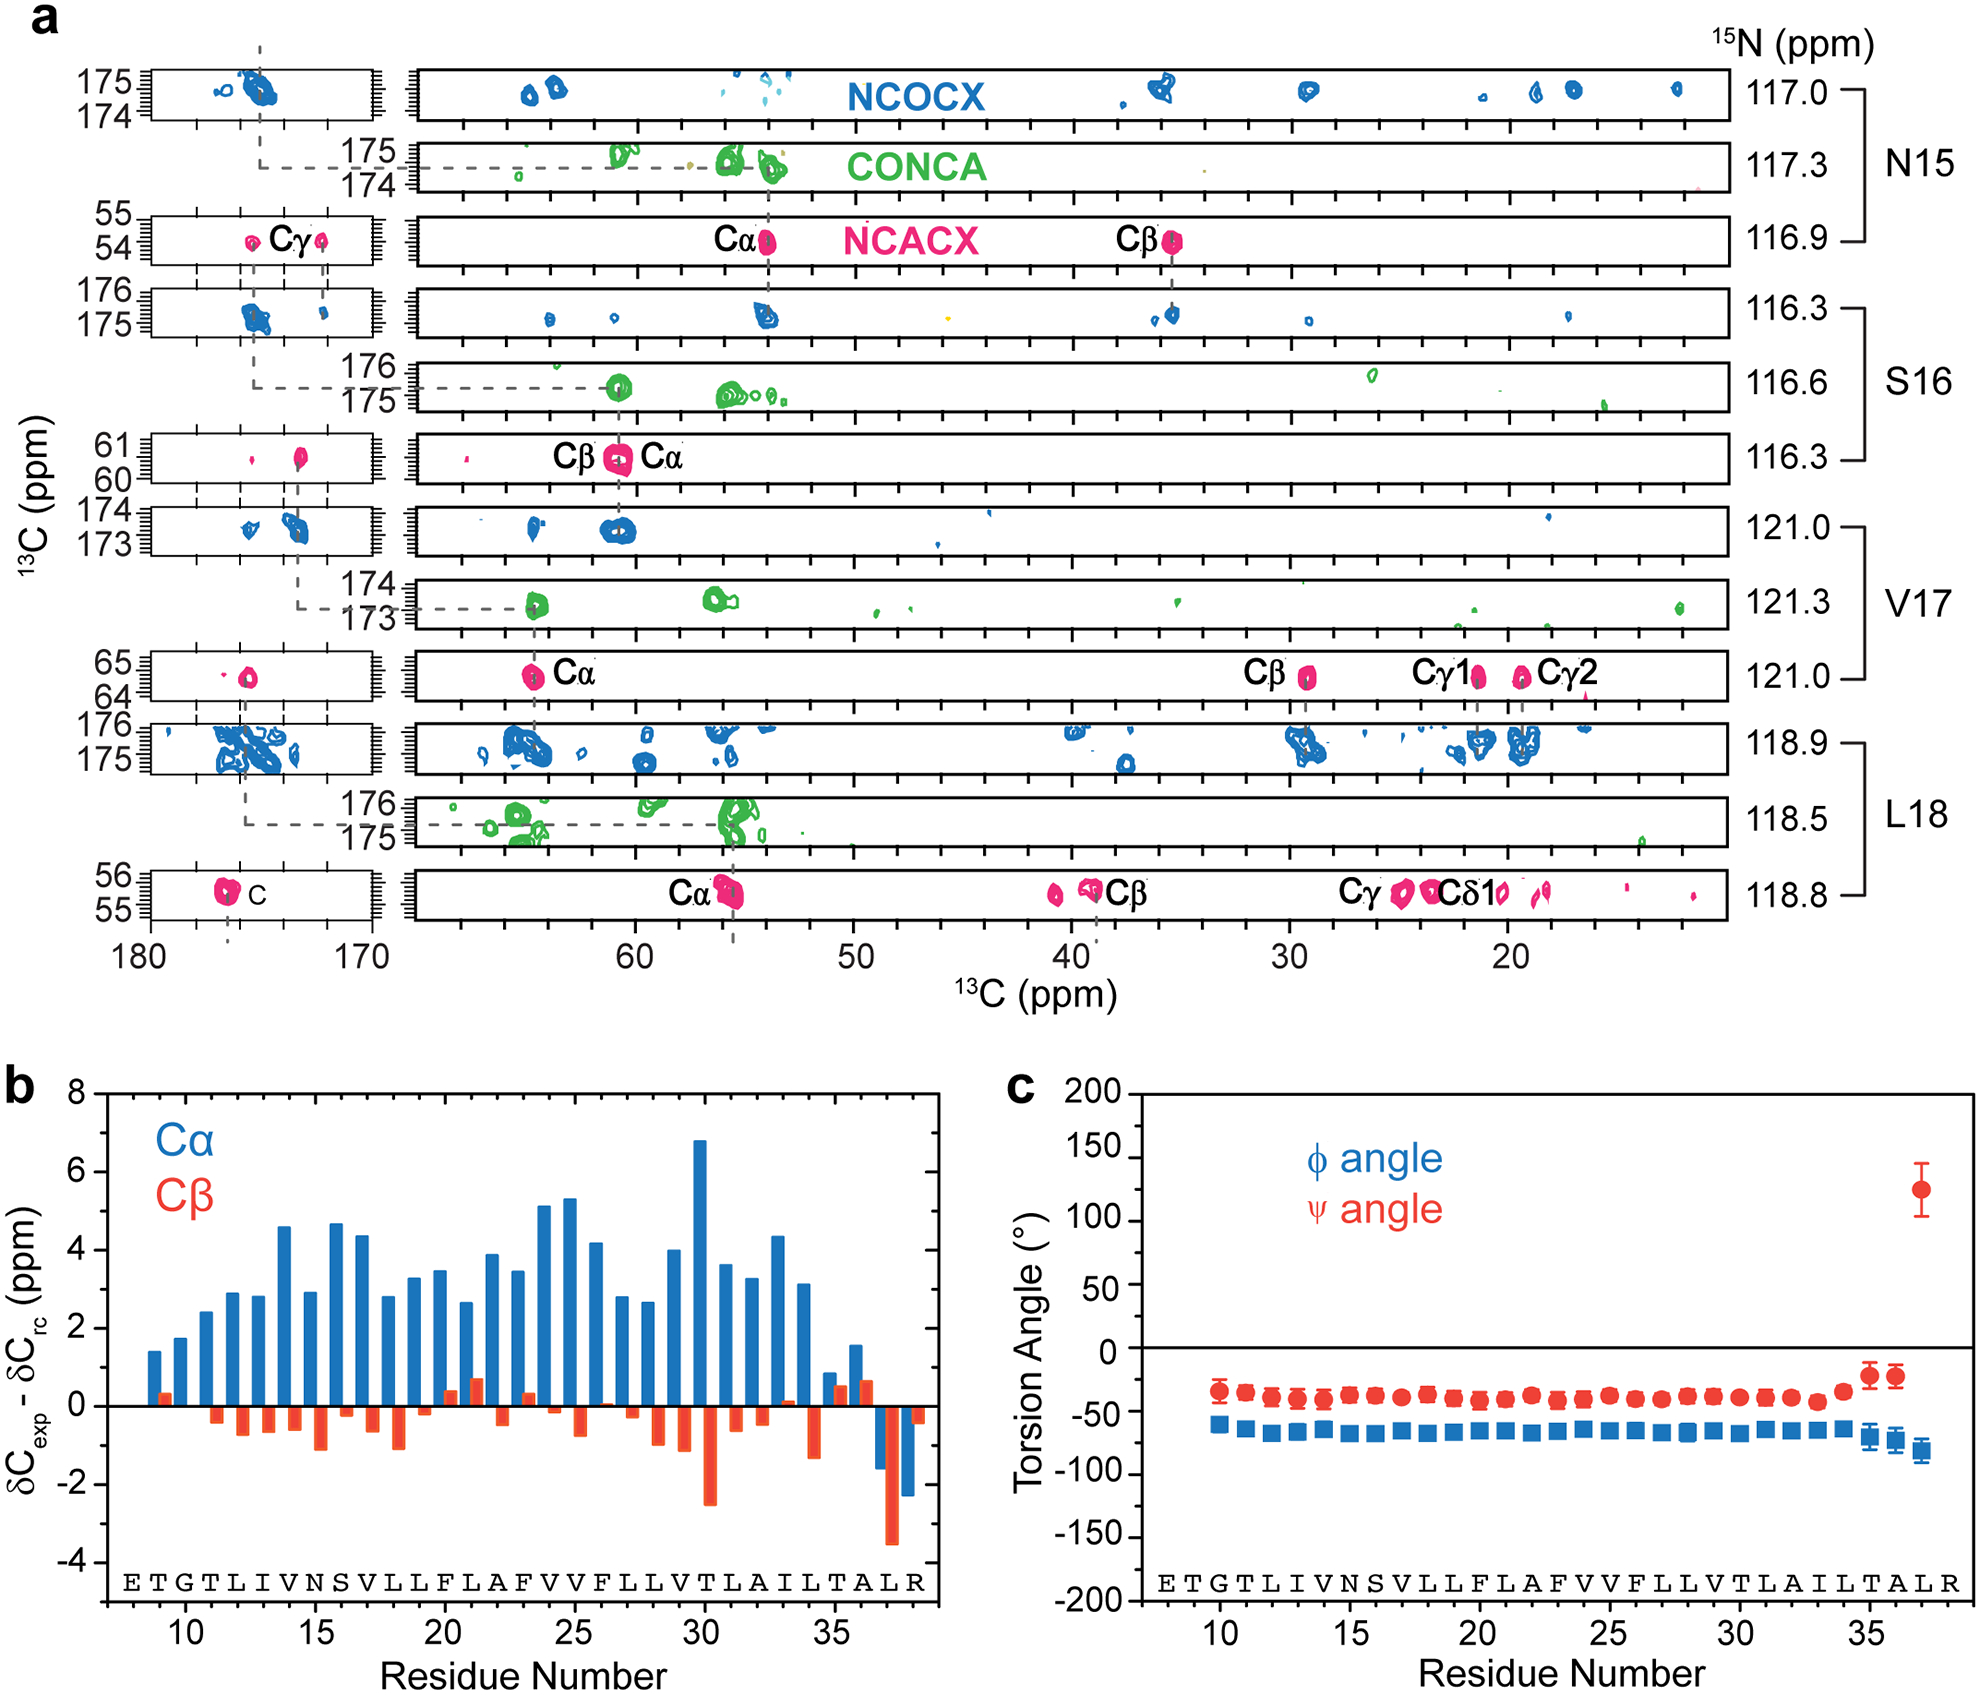
Chemical shift assignment and secondary structure of ETM. (a) Representative strips from 3D NCACX (magenta), CONCA (green) and NCOCX (blue) spectra of ERGIC-membrane bound ETM. These spectra allow full assignment of the 13C and 15N chemical shifts. (b) Cα (blue) and Cβ (orange) secondary chemical shifts compared to random coil chemical shifts. Most residues show positive Cα and negative Cβ secondary shifts, indicating an α-helical conformation. (c) (φ, ψ) torsion angles calculated using TALOS-N. Residues G10 to L34 show α-helical conformation. Error bars represent the precision of the TALOS-N prediction, defined as one standard deviation for the (φ, ψ) angles among the best-matched peptides for each residue.
Extended Data Figure 4.
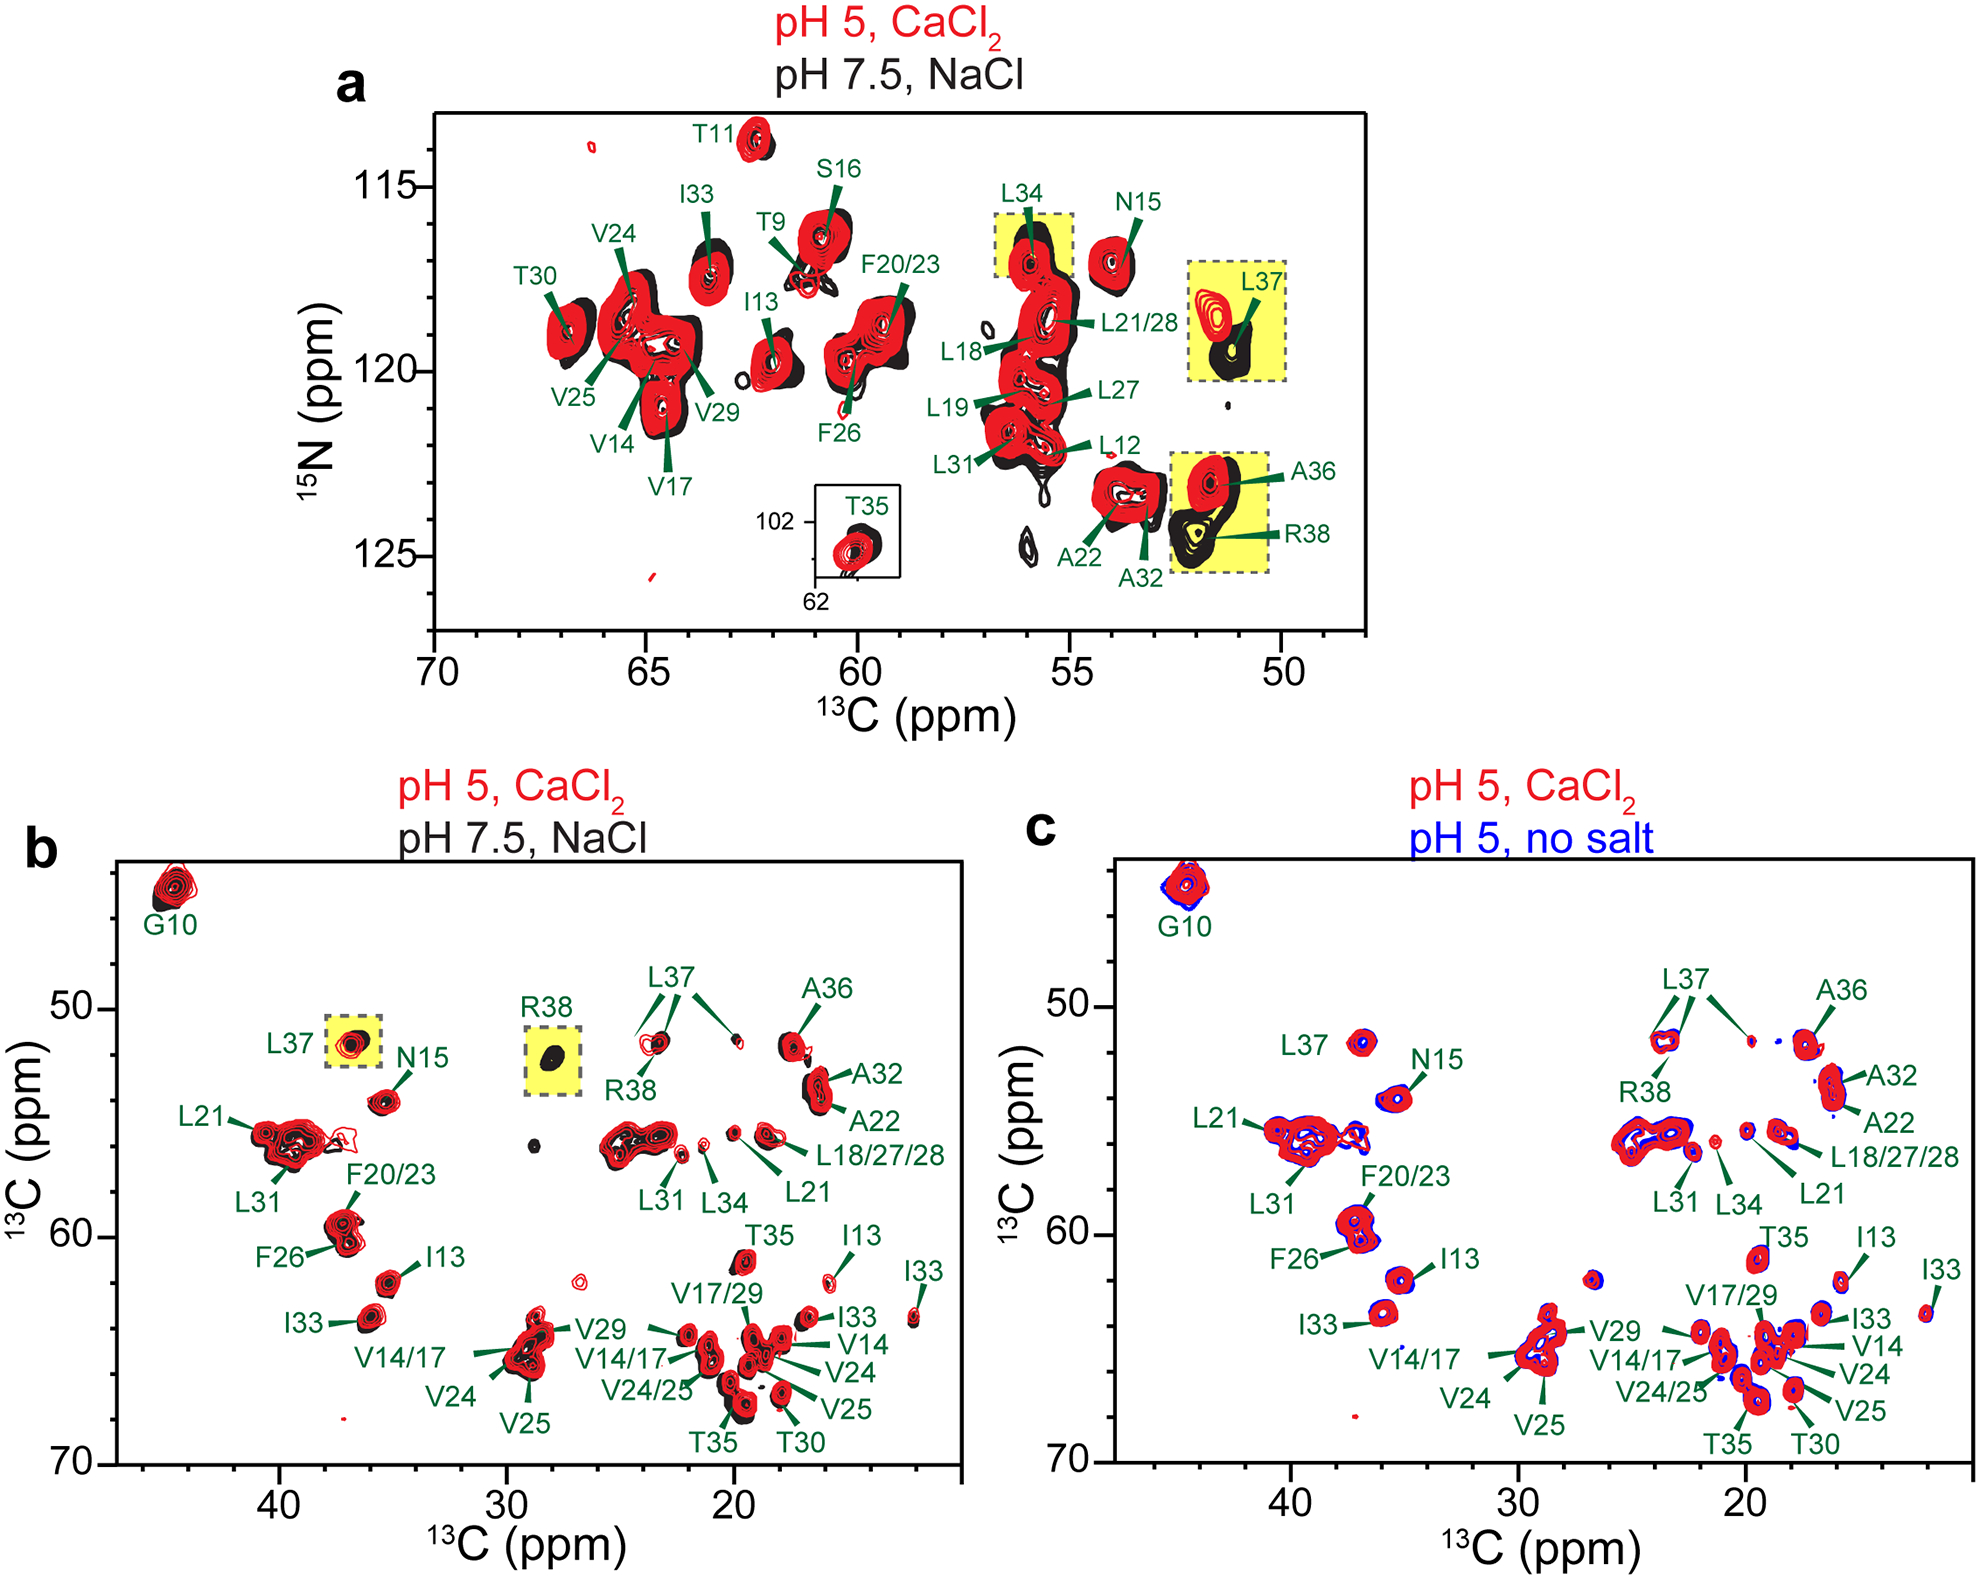
Effects of pH and ions on the chemical shifts of ERGIC-membrane bound ETM. Where cations are present, the ion concentration is 5 mM. (a) 2D 15N-13Cα correlation spectra of high-pH ETM with 5 mM NaCl and low-pH ETM with 5 mM CaCl2. Chemical shift changes are observed for C-terminal residues such as R38, L37 and L34 (yellow highlight). (b) 2D 13C-13C correlation spectra of low-pH ETM with CaCl2 and high-pH ETM with NaCl. (c) 2D 13C-13C correlation spectrum of low-pH ETM with CaCl2 and low-pH ETM without salt. These spectra indicate that the chemical shift changes mainly result from pH changes.
Extended Data Figure 5.
Additional 13C-19F REDOR spectra and water-edited spectra to determine the interhelical packing of ETM. (a) 2D 13C-13C correlation spectrum of mixed 4-19F-Phe labeled and U-13C,15N-labeled ETM (black). The 13C chemical shifts of most residues are similar to the 13C,15N-labeled protein (red), indicating that fluorination does not perturb the ETM conformation. F20/23 Cβ, F26 Cβ, and T30 Cγ2 show small chemical shift changes (blue) of 0.3–0.6 ppm. The spectra were measured at 293 K. (b) 1D 13C-19F REDOR control (S0), dephased (S), and difference (ΔS) spectra. The difference peaks result from carbons that are in close proximity to a fluorine in a neighboring helix. The broadband REDOR spectra (left) show both sidechain and backbone 13C signals whereas the Cα-selective REDOR spectra (right) detect only Cα signals. (c) Representative 13C-19F REDOR dephasing curves for broadband and Cα-selective C-F REDOR spectra. The S/S0 values have been corrected for the isotopic dilution factor (50%) and the peak-overlap factor. Best-fit distance curves are shown as solid lines, and lower and upper distance bounds are shown as dashed lines. Error bars represent random uncertainty of the measured S/S0 values, which were propagated from the signal-to-noise ratios of the S0 and S spectra. (d) Water-edited 2D 15N-13Cα correlation spectra to detect well hydrated residues. The spectra were measured at 293 K under 11.8 kHz MAS using 1H-1H mixing times of 9 ms (red) and 100 ms (blue).
Extended Data Figure 6.
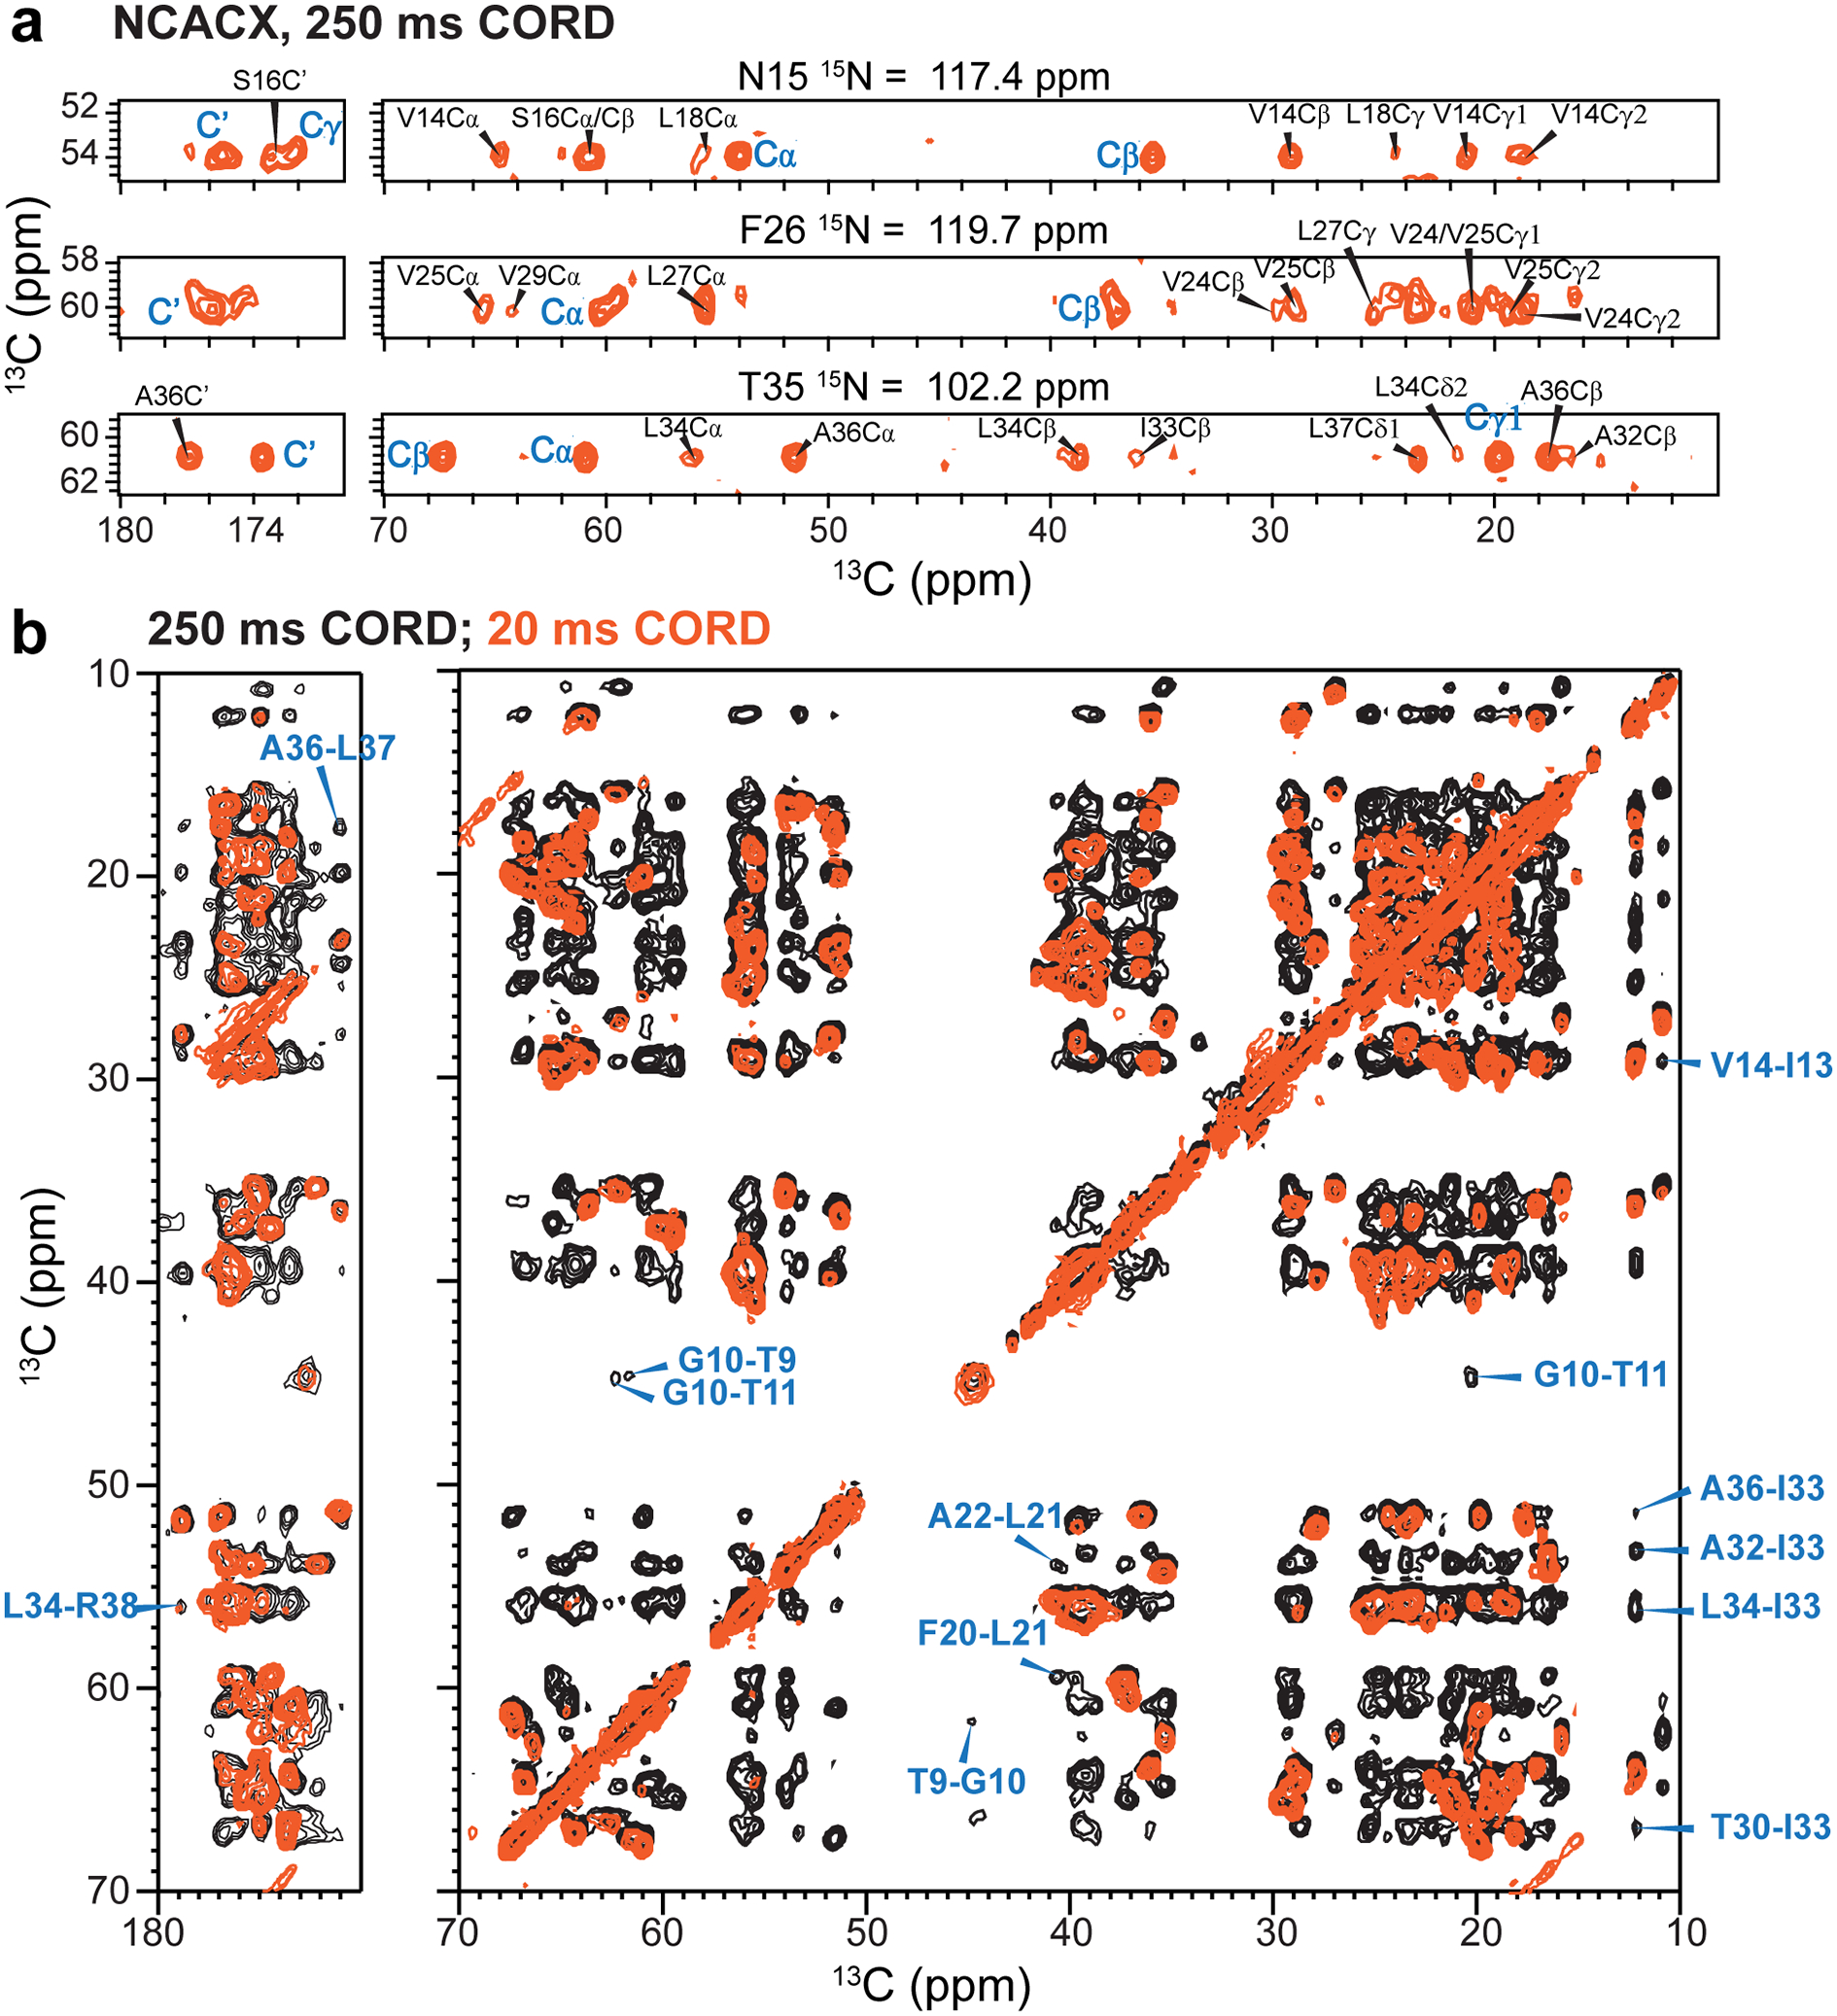
Inter-residue correlations obtained from 250 ms 2D 13C spin diffusion of ERGIC-membrane bound ETM. (a) Representative strips from a well-resolved 3D NCACX spectrum recorded with 250 ms 13C spin diffusion. Inter-residue cross peaks are assigned in black and intra-residue resonances are marked in blue. (b) Overlay of 2D 13C-13C correlation spectra measured with 250 ms mixing (black) and 20 ms (orange). Representative inter-residue cross peaks are assigned in blue. All spectra were measured at 293 K under 11.8 kHz MAS.
Extended Data Figure 7.
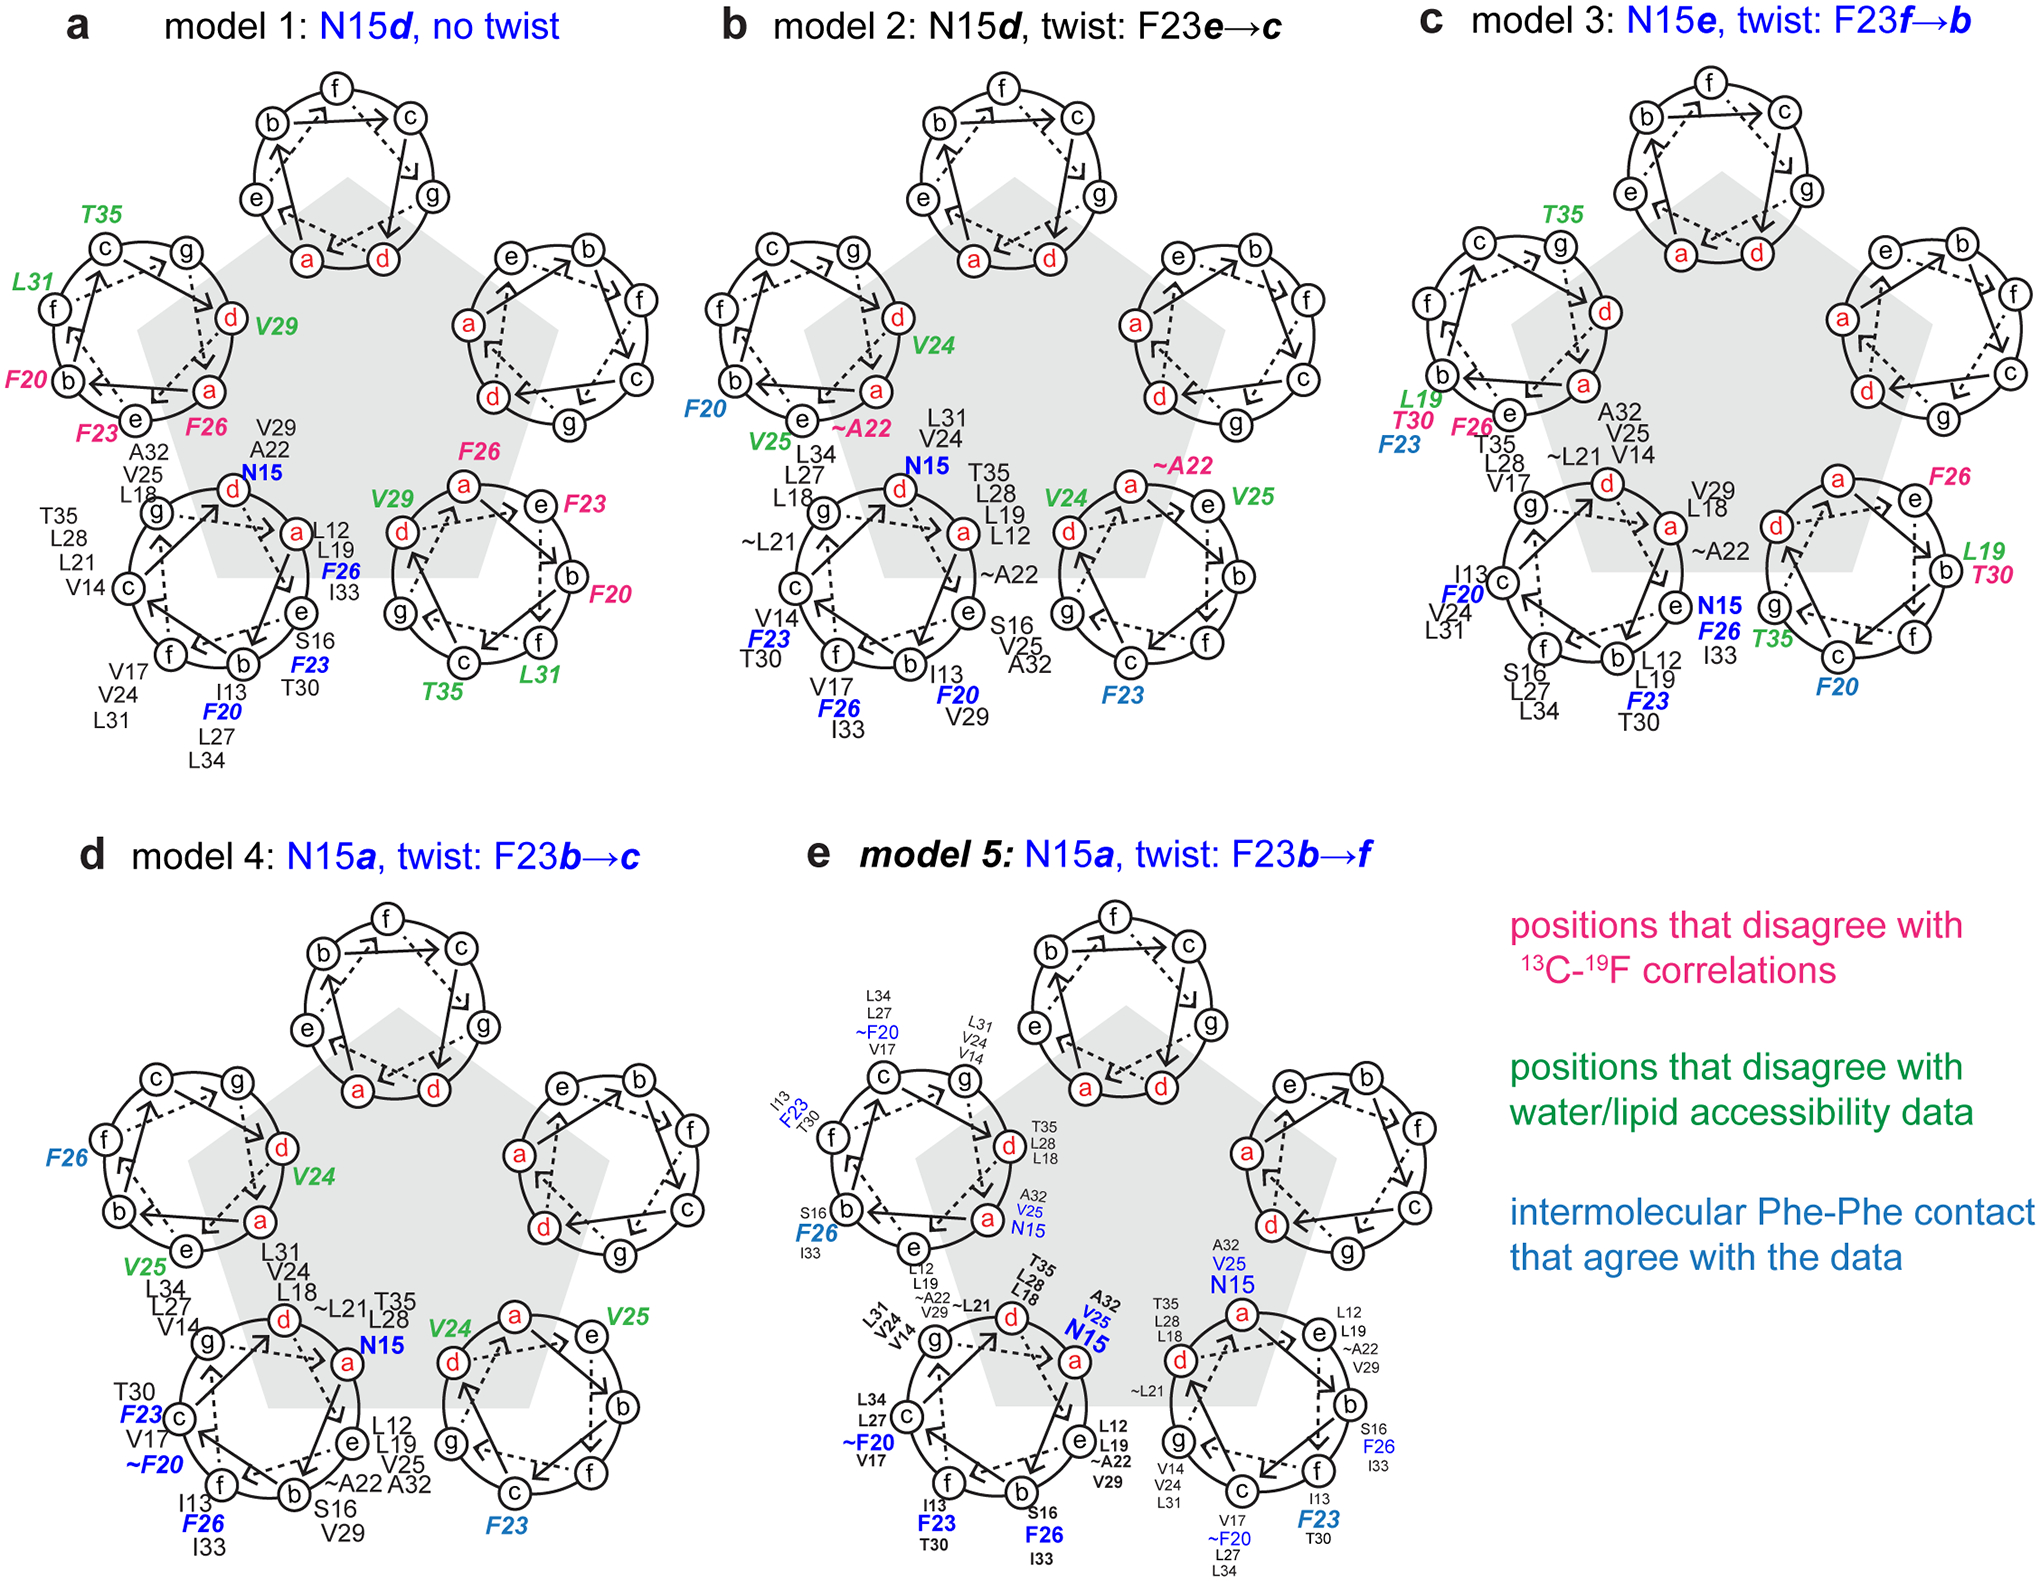
ETM pentameric models analyzed to disambiguate the direction of interhelical constraints used for structure calculation. For each model, the heptad repeat positions (abcdefg) of every residue from L12 to T35 is indicated on the helical wheel for at least one subunit. On the two neighboring helices, residue positions that violate measured 13C-19F correlations are shown in pink, while residue positions that violate the water and lipid accessibility data are shown in green. The positions of Phe residues that satisfy the interhelical contacts are shown in blue. (a) Model 1 places N15 at heptad position d without a twist, and is thus an ideal helix model. (b) Model 2 places N15 at d with a twist such that F23 moves from position e to c. (c) Model 3 places N15 at position e with a twist such that F23 moves from f to b. (d) Model 4 places N15 at position a with a twist such that F23 moves from b to c. (e) Model 5 places N15 at position a with a twist such that F23 moves from b to f. Model 5 does not violate any experimental data and was thus chosen to disambiguate intermolecular contacts for structure calculation. To make the interhelical contacts explicit, model 5 shows the residue positions for three consecutive helices in the pentamer.
Extended Data Figure 8.
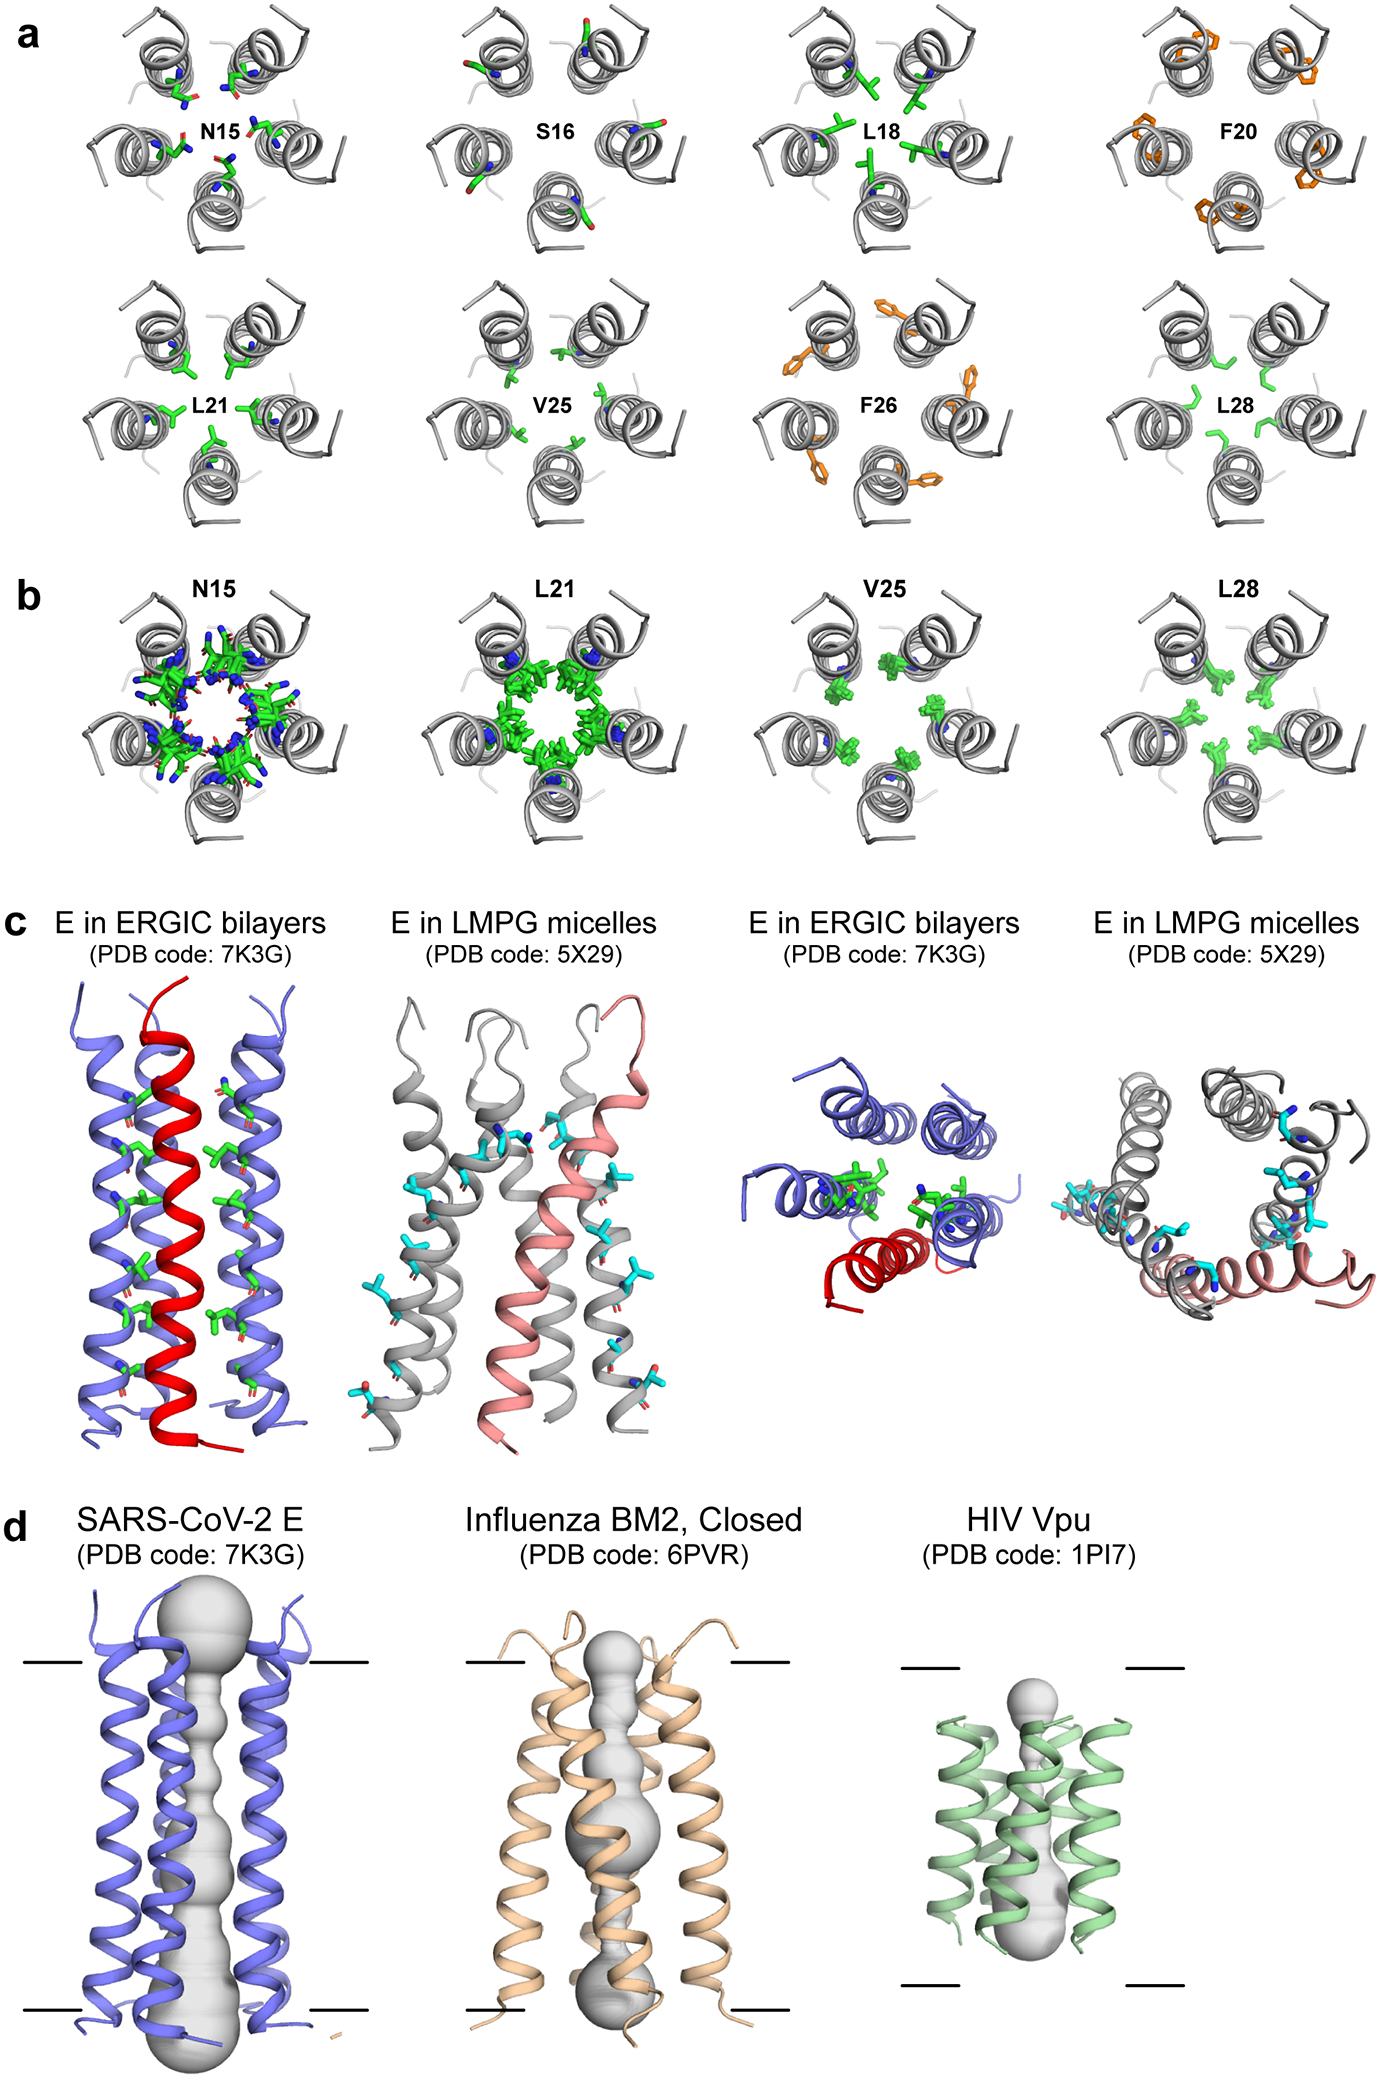
Lipid-bilayer bound SARS-CoV-2 ETM structure (PDB code: 7K3G) and its comparison with ETM structure solved in micelles and with other viroporin structures. (a) N-terminal top views of various residues in the ETM pentamer. Most residues are hydrophobic, including both pore-facing and lipid-facing residues. The most representative structure of the lowest-energy ensemble is shown. (b) Top views of representative pore-facing residues in the lowest-energy ensemble. The structure distribution is most likely due to a combination of the sparseness of experimental restraints and true protein conformational disorder. (c) Comparison of the ERGIC-membrane bound ETM structure model (slate and red) and the LMPG-micelle-bound ETM structure model (gray and salmon)16. Side view depicts differences in helix orientation and helical bundle handedness, while top view shows differences in pore radii. (d) Structural comparison of the pentameric ETM channel, the closed tetrameric influenza BM2 proton channel25, and the pentameric HIV-1 Vpu channel30. The ETM pentamer is longer and tighter than the BM2 and Vpu helical bundles.
Extended Data Figure 9.
Additional docking poses of HMA to SARS-CoV-2 E, shown in side view (left) and N-terminal top view (right). (a) Structure with hexamethylene ring up and HMA vertical, obtained from docking in DMSO. (b) Structure with hexamethylene ring down and HMA vertical, obtained from docking in DMSO. (c) Structure with HMA across the channel entrance, bridging two helices, obtained from docking in water. The lipid-facing I13 and pore-occluding N15 are shown in sticks to guide the eye.
Extended Data Figure 10.
Effects of amantadine binding on ETM. The peptide is reconstituted in DMPC : DMPG membranes with an AMT : ETM monomer molar ratio is 8 : 1. (a) 2D 15N-13Cα correlation spectra of apo (blue) and AMT-bound ETM (magenta). The spectra were measured at 305 K under 14 kHz MAS. Zoomed-in areas show peaks with significant CSPs. (b) 2D 13C-13C correlation spectra with 20 ms mixing of apo (blue) and AMT-bound ETM (magenta). The spectra were measured at 263 K. Zoomed-in areas shows peaks with significant CSPs. The perturbed residues are concentrated in the N- and C-termini of the protein. (c) 1D 19F direct-polarization spectra of 3F-AMT with and without the peptide in DMPX membranes. The spectra were measured at 270 K under 14 kHz MAS. (d) 13Cα selective 19F-dephased REDOR spectra of AMT-bound ETM in DMPC : DMPG membranes. The ΔS spectra show dephasing at 65.5 ppm, 63.6 ppm, 56 ppm and 54 ppm. (e) Broadband 13C-19F REDOR spectra. The ΔS spectra show 13C dephasing for sidechains that belong to residues that show Cα dephasing in (d).
Supplementary Material
Acknowledgements
This research is funded by National Institutes of Health grant GM088204 to M.H and the MIT School of Science Sloan Fund to V.S.M. and A.A.S. The experiments made use of NMR spectrometers at the MIT/Harvard Center for Magnetic Resonance, supported by NIH grant P41 GM132079. Structure calculation made use of NMRbox, supported by NIH grant P41 GM111135.
Footnotes
Code Availability:
NMR pulse programs and in-house Python scripts used for structure calculation and data analysis such as water-edited spectral analysis are available upon request.
Data availability
NMR chemical shifts, distance and torsion-angle restraints have been deposited in the Biological Magnetic Resonance Bank (BMRB) with ID numbers 30795. The structural coordinates for ETM have been deposited in the Protein Data Bank with the accession code 7K3G.
Competing interests
The authors declare no competing financial interests.
Main References
- 1.Weiss SR & Navas-Martin S Coronavirus pathogenesis and the emerging pathogen severe acute respiratory syndrome coronavirus. Microbiol. Mol. Biol. Rev 69, 635–64 (2005). [DOI] [PMC free article] [PubMed] [Google Scholar]
- 2.Wilson L, McKinlay C, Gage P & Ewart G SARS coronavirus E protein forms cation-selective ion channels. Virology 330, 322–31 (2004). [DOI] [PMC free article] [PubMed] [Google Scholar]
- 3.Verdiá-Báguena C, Nieto-Torres JL, Alcaraz A, DeDiego ML, Torres J, Aguilella VM & Enjuanes L Coronavirus E protein forms ion channels with functionally and structurally-involved membrane lipids. Virology 432, 485–94 (2012). [DOI] [PMC free article] [PubMed] [Google Scholar]
- 4.Schoeman D & Fielding BC Coronavirus envelope protein: current knowledge. Virol. J 16, 69 (2019). [DOI] [PMC free article] [PubMed] [Google Scholar]
- 5.Nieto-Torres JL, Verdia-Baguena C, Jimenez-Guardeno JM, Regla-Nava JA, Castano-Rodriguez C, Fernandez-Delgado R, Torres J, Aguilella VM & Enjuanes L Severe acute respiratory syndrome coronavirus E protein transports calcium ions and activates the NLRP3 inflammasome. Virology 485, 330–9 (2015). [DOI] [PMC free article] [PubMed] [Google Scholar]
- 6.Li Y, Surya W, Claudine S & Torres J Structure of a conserved Golgi complex-targeting signal in coronavirus envelope proteins. J. Biol. Chem 289, 12535–49 (2014). [DOI] [PMC free article] [PubMed] [Google Scholar]
- 7.Torres J, Maheswari U, Parthasarathy K, Ng L, Liu DX & Gong X Conductance and amantadine binding of a pore formed by a lysine-flanked transmembrane domain of SARS coronavirus envelope protein. Protein Sci. 16, 2065–71 (2007). [DOI] [PMC free article] [PubMed] [Google Scholar]
- 8.Hong M & DeGrado WF Structural basis for proton conduction and inhibition by the influenza M2 protein. Protein Sci. 21, 1620–1633 (2012). [DOI] [PMC free article] [PubMed] [Google Scholar]
- 9.Cady SD, Schmidt-Rohr K, Wang J, Soto CS, DeGrado WF & Hong M Structure of the amantadine binding site of influenza M2 proton channels in lipid bilayers. Nature 463, 689–692 (2010). [DOI] [PMC free article] [PubMed] [Google Scholar]
- 10.Pervushin K, Tan E, Parthasarathy K, Lin X, Jiang FL, Yu D, Vararattanavech A, Soong TW, Liu DX & Torres J Structure and inhibition of the SARS coronavirus envelope protein ion channel. PLoS Pathog. 5, e1000511 (2009). [DOI] [PMC free article] [PubMed] [Google Scholar]
- 11.DeDiego ML, Alvarez E, Almazan F, Rejas MT, Lamirande E, Roberts A, Shieh WJ, Zaki SR, Subbarao K & Enjuanes L A severe acute respiratory syndrome coronavirus that lacks the E gene is attenuated in vitro and in vivo. J. Virol 81, 1701–13 (2007). [DOI] [PMC free article] [PubMed] [Google Scholar]
- 12.Nieto-Torres JL, DeDiego ML, Verdia-Baguena C, Jimenez-Guardeno JM, Regla-Nava JA, Fernandez-Delgado R, Castano-Rodriguez C, Alcaraz A, Torres J, Aguilella VM & Enjuanes L Severe acute respiratory syndrome coronavirus envelope protein ion channel activity promotes virus fitness and pathogenesis. PLoS Pathog. 10, e1004077 (2014). [DOI] [PMC free article] [PubMed] [Google Scholar]
- 13.Torres J, Wang J, Parthasarathy K & Liu DX The transmembrane oligomers of coronavirus protein E. Biophys. J 88, 1283–90 (2005). [DOI] [PMC free article] [PubMed] [Google Scholar]
- 14.Parthasarathy K, Lu H, Surya W, Vararattanavech A, Pervushin K & Torres J Expression and purification of coronavirus envelope proteins using a modified β-barrel construct. Protein Expr. Purif 85, 133–41 (2012). [DOI] [PMC free article] [PubMed] [Google Scholar]
- 15.Arbely E, Khattari Z, Brotons G, Akkawi M, Salditt T & Arkin IT A highly unusual palindromic transmembrane helical hairpin formed by SARS coronavirus E protein. J. Mol. Biol 341, 769–79 (2004). [DOI] [PMC free article] [PubMed] [Google Scholar]
- 16.Surya W, Li Y & Torres J Structural model of the SARS coronavirus E channel in LMPG micelles. Biochim. Biophys. Acta 1860, 1309–1317 (2018). [DOI] [PMC free article] [PubMed] [Google Scholar]
- 17.Torres J, Parthasarathy K, Lin X, Saravanan R, Kukol A & Liu DX Model of a putative pore: the pentameric alpha-helical bundle of SARS coronavirus E protein in lipid bilayers. Biophys. J 91, 938–47 (2006). [DOI] [PMC free article] [PubMed] [Google Scholar]
- 18.Parthasarathy K, Ng L, Lin X, Liu DX, Pervushin K, Gong X & Torres J Structural flexibility of the pentameric SARS coronavirus envelope protein ion channel. Biophys. J 95, L39–41 (2008). [DOI] [PMC free article] [PubMed] [Google Scholar]
- 19.Gullion T & Schaefer J Rotational echo double resonance NMR. J. Magn. Reson 81, 196–200 (1989). [DOI] [PubMed] [Google Scholar]
- 20.Dregni AJ, Mandala VS, Wu H, Elkins MR, Wang HK, Hung I, DeGrado WF & Hong M In vitro 0N4R tau fibrils contain a monomorphic beta-sheet core enclosed by dynamically heterogeneous fuzzy coat segments. Proc. Natl. Acad. Sci. U.S.A 116, 16357–16366 (2019). [DOI] [PMC free article] [PubMed] [Google Scholar]
- 21.Williams JK & Hong M Probing membrane protein structure using water polarization transfer solid-state NMR. J. Magn. Reson 247, 118–127 (2014). [DOI] [PMC free article] [PubMed] [Google Scholar]
- 22.Lesage A, Emsley L, Penin F & Bockmann A Investigation of dipolar-mediated water-protein interactions in microcrystalline Crh by solid-state NMR spectroscopy. J. Am. Chem. Soc 128, 8246–8255 (2006). [DOI] [PubMed] [Google Scholar]
- 23.Doherty T & Hong M 2D (1)H-(31)P solid-state NMR studies of the dependence of inter-bilayer water dynamics on lipid headgroup structure and membrane peptides. J. Magn. Reson 196, 39–47 (2009). [DOI] [PMC free article] [PubMed] [Google Scholar]
- 24.Dregni AJ, Duan P & Hong M Hydration and Dynamics of Full-Length Tau Amyloid Fibrils Investigated by Solid-State Nuclear Magnetic Resonance. Biochemistry 59, 2237–2248 (2020). [DOI] [PMC free article] [PubMed] [Google Scholar]
- 25.Mandala VS, Loftis AR, Shcherbakov AA, Pentelute BL & Hong M Atomic structures of closed and open influenza B M2 proton channel reveal the conduction mechanism. Nat. Struct. Mol. Biol 27, 160–167 (2020). [DOI] [PMC free article] [PubMed] [Google Scholar]
- 26.Schwieters CD, Kuszewski JJ, Tjandra N & Clore GM The Xplor-NIH NMR molecular structure determination package. J. Magn. Reson 160, 65–73 (2003). [DOI] [PubMed] [Google Scholar]
- 27.Choma C, Gratkowski H, Lear JD & DeGrado WF Asparagine-mediated self-association of a model transmembrane helix. Nat. Struc. Biol 7, 161–166 (2000). [DOI] [PubMed] [Google Scholar]
- 28.Wilson L, Gage P & Ewart G Hexamethylene amiloride blocks E protein ion channels and inhibits coronavirus replication. Virology 353, 294–306 (2006). [DOI] [PMC free article] [PubMed] [Google Scholar]
- 29.Chipot C, Dehez F, Schnell JR, Zitzmann N, Pebay-Peyroula E, Catoire LJ, Miroux B, Kunji ERS, Veglia G, Cross TA & Schanda P Perturbations of Native Membrane Protein Structure in Alkyl Phosphocholine Detergents: A Critical Assessment of NMR and Biophysical Studies. Chem. Rev 118, 3559–3607 (2018). [DOI] [PMC free article] [PubMed] [Google Scholar]
- 30.Park SH, Mrse AA, Nevzorov AA, Mesleh MF, Oblatt-Montal M, Montal M & Opella SJ Three-dimensional structure of the channel-forming trans-membrane domain of virus protein “u” (Vpu) from HIV-1. J. Mol. Biol 333, 409–24 (2003). [DOI] [PubMed] [Google Scholar]
- 31.Lu JX, Sharpe S, Ghirlando R, Yau WM & Tycko R Oligomerization state and supramolecular structure of the HIV-1 Vpu protein transmembrane segment in phospholipid bilayers. Protein Sci. (2010). [DOI] [PMC free article] [PubMed] [Google Scholar]
- 32.Cady SD, Goodman C, Tatko CD, DeGrado WF & Hong M Determining the orientation of uniaxially rotating membrane proteins using unoriented samples: a 2H, 13C, AND 15N solid-state NMR investigation of the dynamics and orientation of a transmembrane helical bundle. J. Am. Chem. Soc 129, 5719–29 (2007). [DOI] [PubMed] [Google Scholar]
- 33.Hou X, Pedi L, Diver MM & Long SB Crystal structure of the calcium release-activated calcium channel Orai. Science 338, 1308–13 (2012). [DOI] [PMC free article] [PubMed] [Google Scholar]
- 34.Xu C et al. Computational design of transmembrane pores. Nature 585, 129–134 (2020). [DOI] [PMC free article] [PubMed] [Google Scholar]
- 35.Lee C, Guo J, Zeng W, Kim S, She J, Cang C, Ren D & Jiang Y The lysosomal potassium channel TMEM175 adopts a novel tetrameric architecture. Nature 547, 472–475 (2017). [DOI] [PMC free article] [PubMed] [Google Scholar]
- 36.Kane Dickson V, Pedi L & Long SB Structure and insights into the function of a Ca(2+)-activated Cl(−) channel. Nature 516, 213–8 (2014). [DOI] [PMC free article] [PubMed] [Google Scholar]
- 37.Yang T, Liu Q, Kloss B, Bruni R, Kalathur RC, Guo Y, Kloppmann E, Rost B, Colecraft HM & Hendrickson WA Structure and selectivity in bestrophin ion channels. Science 346, 355–9 (2014). [DOI] [PMC free article] [PubMed] [Google Scholar]
- 38.Nieto-Torres JL, Dediego ML, Alvarez E, Jimenez-Guardeno JM, Regla-Nava JA, Llorente M, Kremer L, Shuo S & Enjuanes L Subcellular location and topology of severe acute respiratory syndrome coronavirus envelope protein. Virology 415, 69–82 (2011). [DOI] [PMC free article] [PubMed] [Google Scholar]
- 39.Duart G, García-Murria MJ, Grau B, Acosta-Cáceres JM, Martínez-Gil L & Mingarro I SARS-CoV-2 envelope protein topology in eukaryotic membranes. Open Biol. 10, 200209 (2020). [DOI] [PMC free article] [PubMed] [Google Scholar]
- 40.Abramson A et al. An ingestible self-orienting system for oral delivery of macromolecules. Science 363, 611–615 (2019). [DOI] [PMC free article] [PubMed] [Google Scholar]
- 41.Lehninger AL, Nelson DL & Cox MM Principles of Biochemistry, 1013 (Worth Publishers, New York, 1993). [Google Scholar]
- 42.Hou G, Yan S, Trebosc J, Amoureux JP & Polenova T Broadband homonuclear correlation spectroscopy driven by combined R2(n)(v) sequences under fast magic angle spinning for NMR structural analysis of organic and biological solids. J. Magn. Reson 232, 18–30 (2013). [DOI] [PMC free article] [PubMed] [Google Scholar]
- 43.Rienstra CM, Hohwy M, Hong M & Griffin RG 2D and 3D 15N-13C-13C NMR chemical shift correlation spectroscopy of solids: assignment of MAS spectra of peptides. J. Am. Chem. Soc 122, 10979–10990 (2000). [Google Scholar]
- 44.Baldus M, Petkova AT, Herzfeld J & Griffin RG Cross polarization in the tilted frame: assignment and spectral simplification in heteronuclear spin systems. Mol. Phys 95, 1197–1207 (1998). [Google Scholar]
- 45.Hong M & Griffin RG Resonance Assignment for Solid Peptides by Dipolar-Mediated 13C/15N Correlation Solid-State NMR. J. Am. Chem. Soc 120, 7113–7114 (1998). [Google Scholar]
- 46.Lange A, Luca S & Baldus M Structural constraints from proton-mediated rare-spin correlation spectroscopy in rotating solids. J. Am. Chem. Soc 124, 9704–9705 (2002). [DOI] [PubMed] [Google Scholar]
- 47.Shcherbakov AA & Hong M Rapid measurement of long-range distances in proteins by multidimensional (13)C-(19)F REDOR NMR under fast magic-angle spinning. J. Biomol. NMR 71, 31–43 (2018). [DOI] [PMC free article] [PubMed] [Google Scholar]
- 48.Shcherbakov AA, Roos M, Kwon B & Hong M Two-dimensional 19F-13C correlation NMR for 19F resonance assignment of fluorinated proteins. J. Biomol. NMR 74, 193–204 (2020). [DOI] [PMC free article] [PubMed] [Google Scholar]
- 49.Lee W, Tonelli M & Markley JL NMRFAM-SPARKY: enhanced software for biomolecular NMR spectroscopy. Bioinformatics 31, 1325–1327 (2014). [DOI] [PMC free article] [PubMed] [Google Scholar]
- 50.Shen Y & Bax A Protein backbone and sidechain torsion angles predicted from NMR chemical shifts using artificial neural networks. J. Biomol. NMR 56, 227–241 (2013). [DOI] [PMC free article] [PubMed] [Google Scholar]
- 51.Helmus JJ & Jaroniec CP Nmrglue: an open source Python package for the analysis of multidimensional NMR data. J. Biomol. NMR 55, 355–367 (2013). [DOI] [PMC free article] [PubMed] [Google Scholar]
- 52.Schwieters CD, Kuszewski JJ, Tjandra N & Clore GM The Xplor-NIH NMR molecular structure determination package. J. Magn. Reson 160, 65–73 (2003). [DOI] [PubMed] [Google Scholar]
- 53.Maciejewski MW, Schuyler AD, Gryk MR, Moraru II, Romero PR, Ulrich EL, Eghbalnia HR, Livny M, Delaglio F & Hoch JC NMRbox: A Resource for Biomolecular NMR Computation. Biophys. J 112, 1529–1534 (2017). [DOI] [PMC free article] [PubMed] [Google Scholar]
- 54.Smart OS, Neduvelil JG, Wang X, Wallace BA & Sansom MS HOLE: a program for the analysis of the pore dimensions of ion channel structural models. J. Mol. Graph 14, 354–60, 376 (1996). [DOI] [PubMed] [Google Scholar]
Associated Data
This section collects any data citations, data availability statements, or supplementary materials included in this article.