Abstract
Background:
Osteoporosis represents the most common bone disease and has to be respected in planning total hip replacement, especially against the background of increasing uncemented total hip replacement. In this context, the radiographic geometry of the proximal femur got into focus and is controversially discussed.
The aim of the presented study was to find any difference regarding known indices for proximal femur bone geometry between patients with high-grade osteoarthritis and patients suffering from a femoral neck fracture caused by low impact trauma.
Methods:
Retrospective matched-paired analysis of 100 plane pelvic radiographs from 50 patients who suffered from high-grade hip osteoarthritis and 50 patients who suffered from femoral neck fracture was performed. Measurement of Canal-Bone Ratio (CBR), Canal-Calcar Ratio (CCR), Mineral Cortical Index (MCI) and Canal Flare Index (CFI) were performed.
Results:
CBR was significantly higher in the fracture-group (0.45 +/- 0.06 vs. 0.41 +/- 0.08) (P-value= 0.008). Moreover, the femoral thickness 10 cm below the trochanter minor [F] was significantly higher in the osteoarthritis-group (34.68 +/- 4.14 vs 32.11 +/- 3.43) (P-value 0.001).
Conclusion:
In conclusion, patients with a femoral neck fracture demonstrated a higher CBR, which indicates a poorer bone quality. In case of planning a THA, the CBR is an index which can easily be measured and can be seen as one decision criterion in THA regarding fixation technique.
Key Words: one mineral density, one quality, emoral neck fracture, steoporosis, Total hip replacement
Introduction
Treatment of elderly patients with osteopenia and osteoporosis has become a growing challenge, especially in hip surgery. In 2009, 14% of the german population over 50 years suffered from osteoporosis (24% of the females, 6% of the males) (1). According to Makinen et al. 74% of the female patients scheduled for cementless THA showed radiological and/or biochemical signs of osteopenia or osteoporosis (2). Due to demographic changes, surgeons will be confronted with poor bone quality even more frequently in the future (3). In the last decade, cementless THA has become the most frequently performed fixation technique in Germany, but also in countries, where cementless THA is less popular, it is used more frequently nowadays (4, 5). Despite this development, meta-analysis showed an overall superiority of the cemented THA compared to uncemented THA, while Abdulkarim et al. could not find a significant difference in outcome between both fixation methods (6, 7). However, a closer look on data reveals, that uncemented THA is advantageous in younger patients < 55 years (8). Nixon et al. could show, that aseptic loosening of cemented THA is associated with poor bone quality, even cemented THA is known for lower revision rates in patients >75 years (9, 10).
In absence of non-traumatic fractures, the gold-standard in the diagnostic of osteoporosis is the dual energy X-ray absorptiometry (DXA) (11). Most patients undergoing THA do not receive a DXA preoperatively due to the associated additional costs and availability. The decision on whether cemented or uncemented THA is performed is based on a plain X-ray and an intraoperative decision. Studies could show, that osteoarthritis does not protect form osteoporosis (12).
Several radiographic measurement methods have been developed to identify the presence of osteoporosis without performing DXA, such as the Singh-Index, the Dorr-classification, the cortical thickness index (CTI) as well as the canal-calcar ratio (CCR), canal flare index (CFI), morphological cortical index (MCI) and the canal-bone ratio (CBR) (2, 13-15). Yeung et al. showed that the CBR correlates with the T-score. In case of a CBR ≥0,49, the proximal femur could be classified as osteoporotic (15).
Against this context, we compared plain pelvic radiographs from patients who underwent THA due to high-grade osteoarthritis with radiographs from patients who suffered from a femoral neck fracture by a low- impact trauma, which belongs to the characteristic osteoporotic fractures, but does not necessarily mean, that all patients in this group suffers from osteoporosis (16). The purpose of the study was to find out, if there are significant differences concerning CCR, CFI, MCI and CBR between these two groups and if one or several are able to the help the surgeon to decide which fixation should be used (cemented/uncemented).
Materials and Methods
A retrospective matched-paired analysis of one hundred plane pelvic radiographs was performed by two independent observers. Radiographs from patients, who underwent total hip replacement in our department for orthopedic surgery between 2013 and 2019 were screened divided into two groups: Group 1 (n=50, mean age 72.5 years) contained radiographs from patients who suffered from femoral neck fracture, group 2 (n=50, mean age 72.4 years) contained radiographs from patients who suffered from high-grade hip osteoarthritis and underwent THA with 25 females and 25 males in each group. Age and sex-matching was performed, so that each patient in group 1 had an assigned patient with same sex and same age (+/- 0.5 years) in group 2. In each radiograph, distances A-F and indices shown in Figure 1 were determined. A was defined as the distance between the inner cortical borders of the femoral shaft 2 cm above the trochanter minor, B is the distance between the outer cortical borders of the femoral shaft on the level of the minor trochanter, C is the distance between the inner cortical borders of the femoral shaft on the level of the minor trochanter, D is the inner diameter of the femoral shaft 7 cm below the minor trochanter, E is the inner diameter of the femoral shaft 10 cm below the minor trochanter and F represents the outer diameter of the femoral shaft 10 cm below the minor trochanter. The calculated indices were defined as: CCR=E/C, MCI=B/D, CFI=A/E and CBR=E/F.
Table 1.
Interobserver correlation coefficients (ICC)
| Distance/Index Group 1 | ICC | Distance/Index Group 2 | ICC |
|---|---|---|---|
| E | 0.992 | E | 0.993 |
| C | 0.993 | C | 0.979 |
| CCR | 0.977 | CBR | 0.979 |
| A | 0.987 | A | 0.977 |
| CFI | 0.980 | CFI | 0.893 |
| B | 0.981 | B | 0.956 |
| D | 0.986 | D | 0.769 |
| MCI | 0.966 | MCI | 0.849 |
| F | 0.987 | F | 0.983 |
| CBR | 0.976 | CBR | 0.986 |
Interobserver correlation coefficients regarding the measured indices and distances. The correlation was good between both observers, except in D of the osteoarthritis group, ICC was >0.8 in every case.
Table 2.
P-Values of indices
| Distance/Index | p -value |
|---|---|
| E | 0.757 |
| C | 0.408 |
| CCR | 0.320 |
| A | 0.754 |
| CFI | 0.511 |
| B | 0.175 |
| D | 0.661 |
| MCI | 0.403 |
| F | 0.001 |
| CBR | 0.008 |
Differences between the two groups regarding measured distances and indices regarding p-values. A statistically significant difference could be observed for CBR as well as F.
Figure 1.
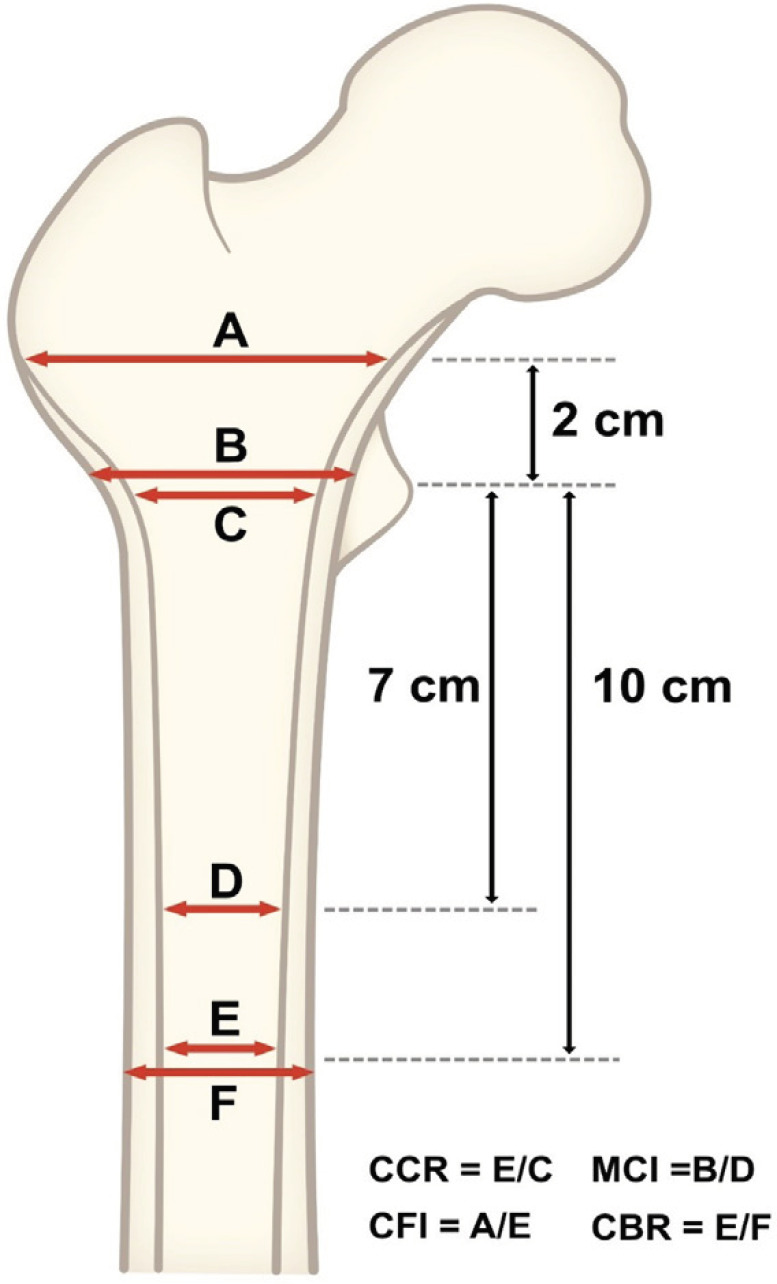
Schematic presentation of the measured distances and indices on the proximal femur.
Figure 2.
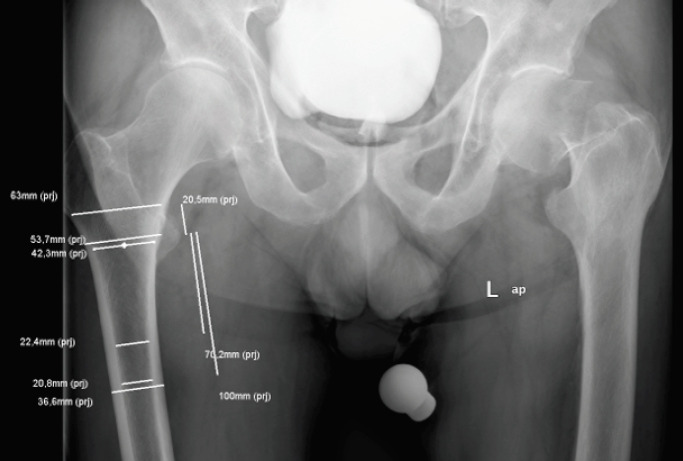
Example of a plain pelvic radiograph with anterior-posterior beam path of group 1.
Figure 3.
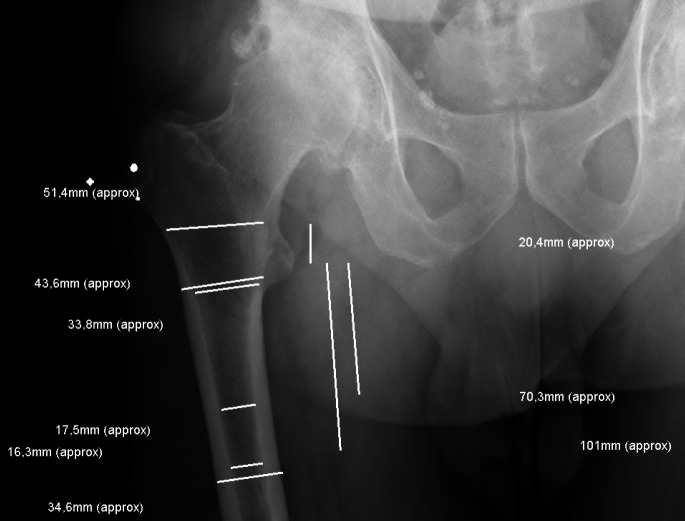
Example of a plain pelvic radiograph with anterior-posterior beam path of group 2. The named distances and indices are measured and marked in the figure. As mentioned, the contralateral side in group 1 was measured.
Figure 4.
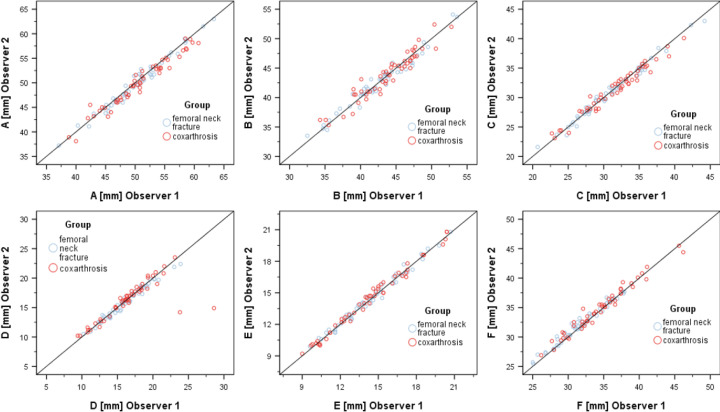
Scatter-plot of the values A, B, C, D, E and F representing the measurements by the two observers.
Figure 5.
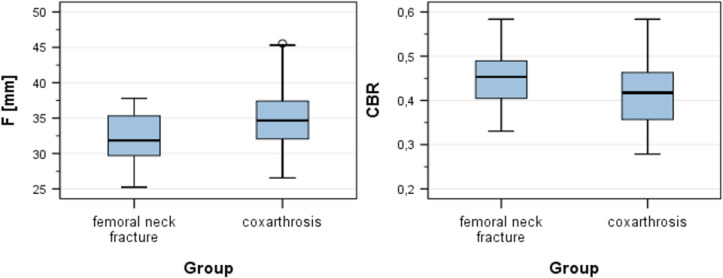
F and CBR in group 1 and group 2. Group 2 showed a statistically significant higher F and lower CBR than group 1.
In group 1, indices could not be determined properly on the injured side because of the fracture morphology, so the measurement were performed contralateral [Figure 2]. In group 2, the surgery-side was measured [Figure 3]. Additionally, at 20 randomized patients from group 2 the indices were measured contralaterally. Special care was taken in the selection of the radiographs examined. Only radiographs, in which the minor trochanter showed a nearly regular a. p.-projection were analysed. Images with malrotation of the trochanters were excluded. For validation of normal distribution the Kolmogorov-Smirnov test was used. We used the mean value of each parameter for the following statistics.
Statistical analysis was done by a professional statistician. For independent samples a two-sided t-test was used, p values <0.05 were considered statistically significant. All radiographs were evaluated by two independent observers. Interobserver correlation coefficient was analyzed. Analysis of the radiographs was performed with IMPAX (Agfa Healthcare, Bonn, Germany), data collection was performed with Microsoft Excel (Microsoft, Washington, USA), statistical analysis was performed using SPSS 25 (IBM, Armonk, USA). All procedures performed were in accordance with the ethical standards of the institutional and/or national research committee. This research has been approved by the IRB of the authors’ affiliated institutions (Ethic committee of the University of Cologne, number 19-1237).
Results
Measurements of both observers did not show any deviation of the normal distribution using Kolmogorov-Smirnov test. Intra- and inter-observer reliability were tested and interclass-correlation coefficients (ICC) are given for repeated measurements of one and two independent observers. The ICC concerning the values A, B, C, D, E, F, CCR, CFI, MCI and CBR varied between 0.769 (D in group 2) and 0.993 (C in group 1 and E in group 2) [Table 1]. Scatter-plots for the values of different measurements of both observers are shown in Figure 4. There was a strong correlation between the measurements of both sides in group two with a Pearson-correlation >0.9 for each value.
Comparing the two groups, there was no statistically significant difference regarding A, B, C, D, E MCI, CFI and CCR. CBR was significantly higher in group 1 (0.45 +/- 0.06) compared to group 2 (0.41 +/- 0.08) (P-value= 0.008). Moreover, F was significantly higher in group 2 (34.68 +/- 4.14) compared to group 1 (32.11 +/- 3.43) (P-value 0.001) [Figure 5; Table 2].
Discussion
In the presented study distances and indices in plain pelvic radiographs, which should allow an evaluation of the bone quality in the proximal femur, in patients who suffered from a femoral neck fracture due to low-impact trauma and in patients with high-grade osteoarthritis in the hip were measured. Statistically significant lower CBR in the osteoarthritis-group could be detected, which indicates a better bone-quality (P<0.05). Moreover, the distance F was significantly higher in the osteoarthritis-group [Figure 1]. Several publications, which investigated the correlation between proximal femur bone architecture and bone quality exist [f. e. 15, 17, 18). Yeung et al. correlated CBR, CCR, MCI and CFI in plain pelvic radiographs with bone mineral density (BMD) of the proximal femur measured by dual-energy x-ray absorptiometry (DEXA). A high correlation between CBR and T-score was postulated. A CBR ≥ 0.49 comes along with osteoporotic bone quality (15). The femoral neck fracture is well-described as an osteoporotic index-fracture. In our patients, the CBR was significantly higher in patients who suffered from a femoral neck fracture, which fits to the results published before and indices poorer bone quality in this group, even the mean value (0.45 +/- 0.06) was lower than cut-off of ≥0.49 described by Yeung et al., which would mean, according this cut-off, that the average patient in our fracture-group can not be classified as osteoporotic (15).
Koese et al. determined the Singh-Index (SI), the CCR and the CTI, which gets calculated with the same distances as CBR. The BMD was assessed by DEXA. In their study, SI turned out to be not reliable, inter- as well as intraobserver-reliability was poor and did not correlate with the BMD. CTI as well as CCR showed good results and authors describe a high correlation with BMD and thus the presence of osteoporosis (17). This matches our observations and confirms our hypothesis, that patients suffering from femoral neck fracture show up with lower bone quality compared to patients who are scheduled for an elective THA, even we could not see a statistically significant difference between our two groups regarding the CCR. Faulkner et al. postulated that a longer hip axis length is associated with an increased risk of femoral neck and trochanteric fractures. An increase of one standard deviation (SD) in hip axis length (HAL) nearly doubled the risk for a femoral neck fracture, a decrease of one SD in femoral BMD increased the risk for a fracture by the 2.7-fold (18). The higher fracture risk in case of longer HAL is caused by a longer lever arm (19). The results of Faulkner et al. were underlined by Gnudi et al. (20). Additionally to a longer hip axis length, women with femoral neck fractures come up with a wider femoral neck diameter and larger femoral neck-shaft angle compared to a control group. Moreover, there was no significant difference in proximal femur geometry (PFG) in osteoporotic women with spine fractures, compared to controls, which indicates, that some PFG have to be seen as a risk-factor for fractures of the proximal femur (20). However, despite the CBR and F, we could not detect a statistically significant difference concerning the CCR, CFI and MCI as well as for the distances A, B, C, D and E between our two groups. The literature is quite inconclusive on this topic. Especially for the CFI, Tawada et al. stated that CFI can be influenced by femoral rotation and anteversion, which makes it less valid in clinical daily set-up (21). Moreover, the CCR as well as the Singh-score did not show a statistical significant correlation with T-score. In the same study, Sah et al. could demonstrate a correlation between T-score and Dorr-score (22). In contrast, Koese et al. certified that CCR is reliable in detecting poor bone quality (17).
In the data presented, we could not detect a statistical significantly difference between both sides in group 2 regarding the measured values. This matches previous research published by Maeda et al., who showed, that there was no statistically significant difference in bone mineral density (BMD) and the cortical index (CI) between the fractured side and the non-fractured side in patients suffering from a femoral neck fracture (23). We believe that, beside our own results, this verifies our method, to measure the contralateral side in group 1. Besides that, we could prove, that the measured indices show quite good interobserver correlation coefficients. This makes them reliable in clinical daily practice even we have to point out, that despite the CBR, based on our data, the meaningfulness of the indices seems to be limited. However, CBR, Dorr-classification and CTI seem to be proper tools for the surgeon to assess bone quality correctly preoperatively and include this information in his decision making when choosing the individual fixation method. In patients with good indexed bone quality, cementless fixation should be the preferred (8). In case of a higher CBR in plain radiographs, a cemented fixation should be available and could be preferred because of the superior results described in the literature, if poor bone quality is verified intraoperatively (8).
The presented study has some limitations. First of all, based on the retrospective character of the study, we did not perform measurement of the BMD, so it is not possible to correlate our values with a T-score. It should be in mind, that femoral neck fracture due to a low-impact trauma indicates osteoporosis. The CBR turned out to be valid regarding this factor in previous studies. Moreover, we matched our groups concerning sex and age. Women suffer more often from osteoporosis as well as from femoral neck fractures, which indicates, that our data does not represent the appearance of the fractures in reality (1, 24). Moreover, the plain pelvic radiographs do have variations in image-rotation. We excluded radiographs, which showed a noticeable malrotation, but it is nearly impossible to get images with identical rotation, especially in injured patients.
In conclusion, patients with a femoral neck fracture demonstrated a higher CBR, which indicates a poorer bone quality. In case of planning a THA, the CBR is an index which can easily be measured and can be seen as one decision criterion in THA regarding fixation technique.
Acknowledgments
This work contains results of the doctoral thesis of Boris Vidovic
References
- 1.Hadji P, Klein S, Gothe H, Häussler B, Kless T, Schmidt T, et al. The epidemiology of osteoporosis—Bone Evaluation Study (BEST): an analysis of routine health insurance data. Deutsches Ärzteblatt International. 2013;110(4) doi: 10.3238/arztebl.2013.0052. [DOI] [PMC free article] [PubMed] [Google Scholar]
- 2.Mäkinen TJ, Alm JJ, Laine H, Svedström E, Aro HT. The incidence of osteopenia and osteoporosis in women with hip osteoarthritis scheduled for cementless total joint replacement. Bone. 2007;40(4):1041–7. doi: 10.1016/j.bone.2006.11.013. [DOI] [PubMed] [Google Scholar]
- 3.Raisz LG, Rodan GA. Pathogenesis of osteoporosis. Endocrinology and metabolism clinics of North America. 2003;32(1) doi: 10.1016/s0889-8529(02)00055-5. [DOI] [PubMed] [Google Scholar]
- 4.Grimberg A, Jansson V, Liebs T, Melsheimer O, Steinbrück A. Endoprothesenregister Deutschland: Jahresbericht 2015. Germany: EPRD Deutsche Endoprothesenregister gGmbH: Berlin; 2016. [Google Scholar]
- 5.Kärrholm J, Lindahl H, Malchau H, Mohaddes M, Nemes S, Rogmark C, et al. The Swedish Hip Arthroplasty Register Annual Report . 2016 [Google Scholar]
- 6.Phedy P, Ismail HD, Hoo C, Djaja YP. Total hip replacement: A meta-analysis to evaluate survival of cemented, cementless and hybrid implants. World journal of orthopedics. 2017;8(2):192. doi: 10.5312/wjo.v8.i2.192. [DOI] [PMC free article] [PubMed] [Google Scholar]
- 7.Abdulkarim A, Ellanti P, Motterlini N, Fahey T, O’Byrne JM. Cemented versus uncemented fixation in total hip replacement: a systematic review and meta-analysis of randomized controlled trials. Orthopedic reviews. 2013;5(1) doi: 10.4081/or.2013.e8. [DOI] [PMC free article] [PubMed] [Google Scholar]
- 8.Malchau H, Herberts P, Eisler T, Garellick G, Söderman P. The Swedish total hip replacement register. JBJS. 2002;84(suppl_2):S2–0. doi: 10.2106/00004623-200200002-00002. [DOI] [PubMed] [Google Scholar]
- 9.Nixon M, Taylor G, Sheldon P, Iqbal SJ, Harper W. Does bone quality predict loosening of cemented total hip replacements? The Journal of bone and joint surgery. 2007;89(10):1303–8. doi: 10.1302/0301-620X.89B10.19038. [DOI] [PubMed] [Google Scholar]
- 10.Scanelli JA, Reiser GR, Sloboda JF, Moskal JT. Cemented femoral component use in hip arthroplasty. JAAOS-Journal of the American Academy of Orthopaedic Surgeons. 2019 ;27(4):119–127. doi: 10.5435/JAAOS-D-17-00245. [DOI] [PubMed] [Google Scholar]
- 11.Baccaro LF, Conde DM, Costa-Paiva L, Pinto-Neto AM. The epidemiology and management of postmenopausal osteoporosis: a viewpoint from Brazil. Clinical interventions in aging. 2015;10:583. doi: 10.2147/CIA.S54614. [DOI] [PMC free article] [PubMed] [Google Scholar]
- 12.Glowacki J, Hurwitz S, Thornhill TS, Kelly M, LeBoff MS. Osteoporosis and vitamin-D deficiency among postmenopausal women with osteoarthritis undergoing total hip arthroplasty. JBJS. 2003;85(12):2371–7. doi: 10.2106/00004623-200312000-00015. [DOI] [PubMed] [Google Scholar]
- 13.Singh M, Nagrath AR, Maini PS. Change in trabecular pattern of the upper end of the femur as an index to osteoporosis. JBJS. 1970;52(3):457–67. [PubMed] [Google Scholar]
- 14.Dorr LD, Faugere MC, Mackel AM, Gruen TA, Bognar B, Malluche HH. Structural and cellular assessment of bone quality of proximal femur. Bone. 1993;14(3):231–42. doi: 10.1016/8756-3282(93)90146-2. [DOI] [PubMed] [Google Scholar]
- 15.Yeung Y, Chiu KY, Yau WP, Tang WM, Cheung WY, Ng TP. Assessment of the proximal femoral morphology using plain radiograph—can it predict the bone quality? The Journal of arthroplasty. 2006;21(4):508–13. doi: 10.1016/j.arth.2005.04.037. [DOI] [PubMed] [Google Scholar]
- 16.Warriner AH, Patkar NM, Curtis JR, Delzell E, Gary L, Kilgore M, et al. Which fractures are most attributable to osteoporosis? Journal of clinical epidemiology. 2011;64(1):46–53. doi: 10.1016/j.jclinepi.2010.07.007. [DOI] [PMC free article] [PubMed] [Google Scholar]
- 17.Köse Ö, Kiliçaslan ÖF, Arik HO, Sarp Ü, Toslak İE, Uçar M. Prediction of Osteoporosis through Radiographic Assessment of Proximal Femoral Morphology and Texture in Elderly; is it Valid and Reliable? Turk Osteoporoz Dergisi. 2015;21(2) [Google Scholar]
- 18.Faulkner KG, Cummings SR, Black D, Palermo L, Glüer CC, Genant HK. Simple measurement of femoral geometry predicts hip fracture: the study of osteoporotic fractures. Journal of bone and mineral research. 1993;8(10):1211–7. doi: 10.1002/jbmr.5650081008. [DOI] [PubMed] [Google Scholar]
- 19.Brownbill RA, Ilich JZ. Hip geometry and its role in fracture: what do we know so far? Current osteoporosis reports. 2003;1(1):25–31. doi: 10.1007/s11914-003-0005-8. [DOI] [PubMed] [Google Scholar]
- 20.Gnudi S, Malavolta N, Testi D, Viceconti M. Differences in proximal femur geometry distinguish vertebral from femoral neck fractures in osteoporotic women. The British Journal of Radiology. 2004;77(915):219–23. doi: 10.1259/bjr/79551075. [DOI] [PubMed] [Google Scholar]
- 21.Tawada K, Iguchi H, Tanaka N, Watanabe N, Murakami S, Hasegawa S, et al. Is the canal flare index a reliable means of estimation of canal shape? Measurement of proximal femoral geometry by use of 3D models of the femur. Journal of Orthopaedic Science. 2015;20(3):498–506. doi: 10.1007/s00776-015-0704-x. [DOI] [PubMed] [Google Scholar]
- 22.Sah AP, Thornhill TS, LeBoff MS, Glowacki J. Correlation of plain radiographic indices of the hip with quantitative bone mineral density. Osteoporosis international. 2007;18(8):1119–26. doi: 10.1007/s00198-007-0348-6. [DOI] [PMC free article] [PubMed] [Google Scholar]
- 23.Maeda Y, Sugano N, Saito M, Yonenobu K. Comparison of femoral morphology and bone mineral density between femoral neck fractures and trochanteric fractures. Clinical Orthopaedics and Related Research®. 2011;469(3):884–9. doi: 10.1007/s11999-010-1529-8. [DOI] [PMC free article] [PubMed] [Google Scholar]
- 24.Wang Z, Bhattacharyya T. Outcomes of hemiar-throplasty and total hip arthroplasty for femoral neck fracture: a medicare cohort study. Journal of orthopaedic trauma. 2017;31(5):260. doi: 10.1097/BOT.0000000000000814. [DOI] [PMC free article] [PubMed] [Google Scholar]


