
Figure 4. Quality evaluation of DeepRescore identifications.
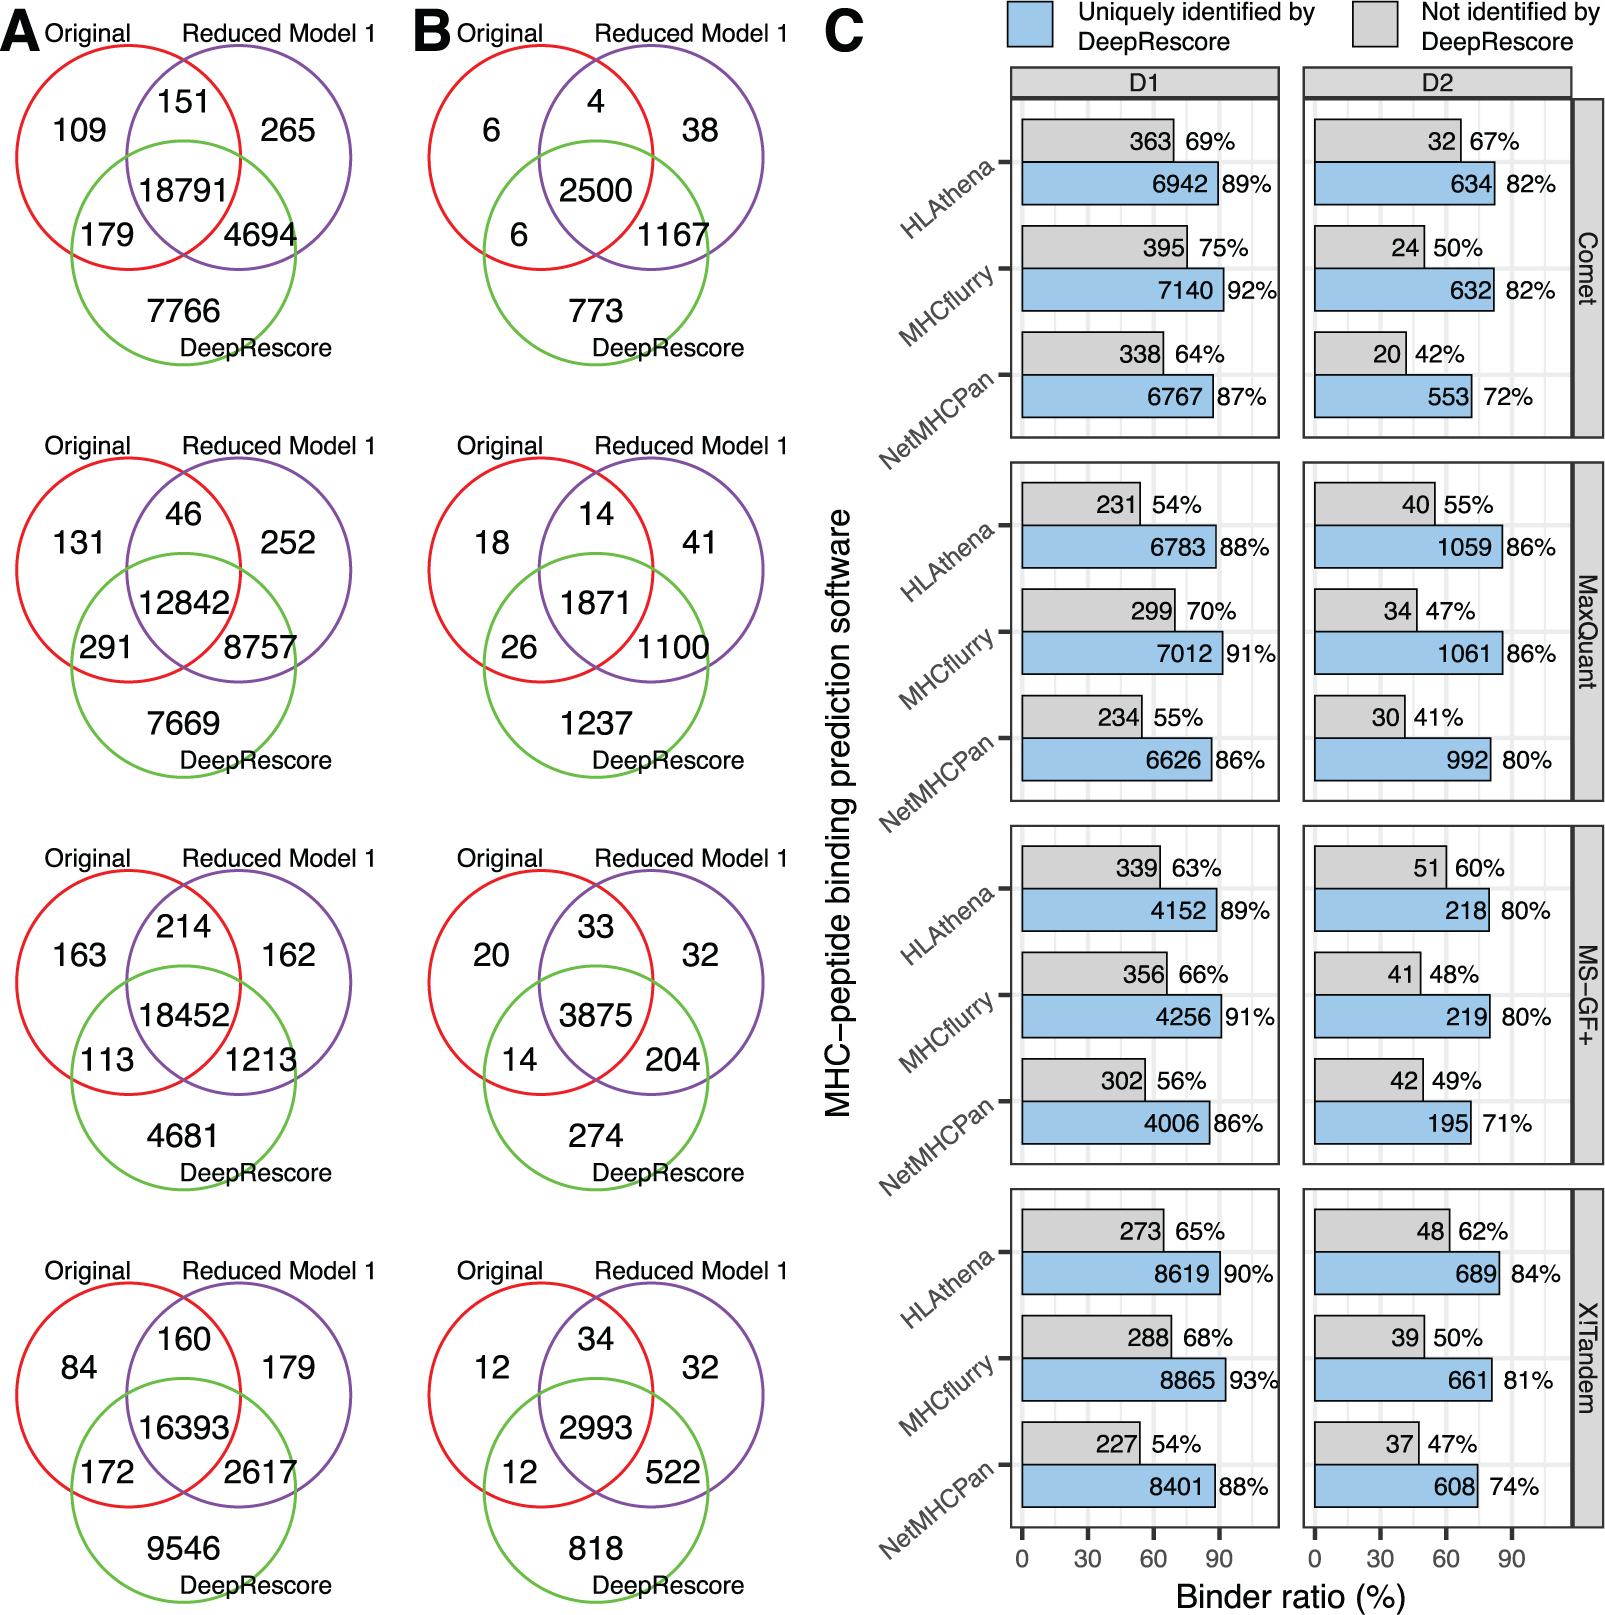
(A) Venn diagrams comparing peptides identified by different methods in dataset D1. (B) Venn diagrams comparing peptides identified by different methods in dataset D2. (C) Ratios of MHC binders predicted by different tools among peptides uniquely identified by DeepResore or among peptides not identified by DeepRescore in the two datasets.