

Abstract
The selection of growth media is a very important consideration of any cell-based proteomics experiment. Alterations thereof may result in differences in basal proteomes simply due to disparities in the metabolite composition of the media. We investigate the effect of growth media on the proteomes of three microorganisms, specifically E. coli, S. cerevisiae, and S. pombe, using tandem mass tag (TMT)-based quantitative proteomics. We compared the protein abundance profiles of these microorganisms propagated in two distinct growth media that are commonly used for the respective organism. Our sample preparation strategy included SP3 bead-assisted protein isolation and digestion. In addition, we assembled a replicate set of samples in which we altered the proteolytic digestion from sequential treatment with LysC and trypsin to only LysC. Despite differences in peptides identified and a drop in quantified proteins, the results were similar between the two datasets for all three microorganisms. Approximately 10% of the proteins of each respective microorganism were significantly altered in each dataset. As expected, gene ontology analysis revealed that the majority of differentially expressed proteins are implicated in metabolism. We emphasize further the importance and the potential consequences of growth media selection.
Keywords: SPS-MS3, Multi-Notch, TMT, Lumos, microorganism, LysC
Graphical Abstract
INTRODUCTION
Escherichia coli (E. coli), Saccharomyces cerevisiae (S. cerevisiae) and Schizosaccharomyces pombe (S. pombe) are three of the most widely studied microorganisms in molecular biology laboratories. Currently in PubMed, ~384,000 research articles pertain to some aspect of E. coli biology, plus more than 129,000 articles for S. cerevisiae, and over 13,000 for S. pombe, thereby accounting for more than a half a million research articles on these topics [1]. An essential, but easy-to-overlook facet of many microorganism-based experiments is the type of growth media used, partially due to the high tolerance of these microorganisms to changes in growth conditions [2–4]. E. coli, for example, can be grown in a variety of media, including, NB (nutrient broth) and the more common LB (Luria-Bertani) broth. Similarly, S. cerevisiae is commonly grown in rich media YPD (yeast-peptone-dextrose), but at times chemically defined media, such as SC (synthetic complete) is preferred. Likewise, S. pombe is frequently propagated in rich YES (yeast extract with supplements) or chemically defined EMM (Edinburgh minimal media). The regulation and adaptation of cellular metabolism is essential for the viability of any living organism, as well as for the response to certain stimuli. E. coli, S. cerevisiae, and S. pombe are well-characterized with respect to cell growth, metabolic processes, and associated genetic components. We hypothesize that the use of different media will change markedly the baseline proteome of a given microorganism.
Isobaric tag-based proteome profiling is a leading technology for proteomic analysis of complex peptide mixtures. Sample multiplexing limits missing values which often appear across experiments and improves statistical power by including replicates within a single experiment. The introduction of the SL-TMT (streamlined-tandem mass tag) protocol facilitated isobaric tag-based proteome profiling [5]. In the SL-TMT protocol, proteins are first extracted with urea, quantified and chloroform-methanol precipitated, before digestion with LysC followed by trypsin and TMT labeling in the same buffer. To improve the efficiency of sample processing, here we used an updated SL-TMT strategy with a more versatile and higher-throughput bead-based protein aggregation step in place of chemical precipitation, which we term SL-SP3-TMT [6]. Differentially labeled samples are combined and fractionated using high-pH reversed-phase chromatography prior to LC-MS3 analysis. The recent widespread use of bead-based protein aggregation technology (SP3) has alleviated caveats associated with chemical-based protein extraction [7–10]. We stress that the addition of SP3 to SL-TMT enables gains in throughput and introduces the potential for automation.
Here, we assembled three TMT6-plexes, one for each microorganism, as biological triplicates with regard to growth media. More specifically, one TMT6-plex was constructed for E. coli propagated in LB and NB, each in triplicate. A second TMT6-plex was assembled for S. cerevisiae propagated in YPD and SC, again in triplicate. And a third TMT6-plex was compiled for S. pombe propagated in YES and EMM, also in triplicate. Along with growth media, we also investigated two digestion conditions. Specifically, we repeated the three TMT6-plexes with new sets of biological triplicates using only LysC as the protease rather than a sequential digest with LysC and trypsin. The data revealed expected alterations in protein abundance, particularly for metabolism-related proteins across all species. Moreover, we provided a resource of tens of thousands of labeled peptides from E. coli, S. cerevisiae, and S. pombe which can be used to develop targeted TMT-based experiments. Our data support the importance of media selection for obtaining reproducible results and its effects on the interpretation of certain treatments performed on different growth media. We also emphasize that the TMT-based methodology (SL-SP3-TMT) used herein can be readily applied to virtually any biological system.
MATERIALS AND METHODS
Materials.
Tandem Mass Tag (TMT) isobaric reagents, BCA Protein Concentration Kit, Protease inhibitor tablets, and trypsin were purchased from ThermoFisher Scientific (Rockford, IL). StageTip Empore-C18 material was purchased from CDS (Oxford, PA). Sep-Pak cartridges (50 mg) were from Waters (Milford, MA). LysC protease was from Fujifilm Wako (Richmond, VA). Mass spectrometry-grade water and organic solvents were from J.T. Baker (Center Valley, PA). The S. cerevisiae strain used was BY4716 from ThermoFisher Scientific (Waltham, MA). The S. pombe strain was NRRL Y-164 purchased from ATCC (Manassas, Virginia). The E. coli strain was purchased from Carolina Biological Supply Co. (Burlington, NC). Synthetic complete (SC), Edinburgh Minimal Media (EMM), yeast extracts with supplements (YES), and yeast-peptone-dextrose (YPD) media was from Sunrise Science (San Diego, CA). Luria-Bertani broth (LB) and Nutrient broth #1 (NB) was purchased from Millipore-Sigma (St. Louis, MO). Media formulations are available in the Supplemental Methods. Sera-MagSpeed Beads (cat. nos. 45152105050350 and 65152105050350) were from GE Life Sciences (Marlborough, MA).
Microorganism growth and protein extraction.
Aseptic technique was practiced with all microbial samples. S. cerevisiae were grown at 30°C in either YPD or SC media. S. pombe were grown at 32°C in EMM or YES media. E. coli were grown at 37°C in LB or NB media. We harvested yeast cells at OD600nm=0.6 and E. coli at OD600nm=0.5 seeded from an overnight starter culture at OD600nm=0.05. We washed the pelleted cells twice with ice cold water and yeast cells were lysed by bead-beating in 8 M urea, 200 mM EPPS (4-(2-hydroxyethyl)-1-piperazinepropanesulfonic acid), pH 8.5 supplemented with protease inhibitors, while E. coli were lysed using B-PER reagent (Thermo Fisher Scientific). Protein concentration was determined with the BCA assay. The BCA assay was performed according to manufacturer’s instructions with samples that were diluted at least 1:20, to ensure that the urea concentration was below its non-compatibility limit. Samples were reduced with 5mM TCEP for 20 min, alkylated with 10 mM iodoacetamide for 20 min in the dark, and quenched with 10 mM DTT for 20 min in the dark, all at room temperature.
SP3-based protein digestion and TMT labeling.
Single‐Pot Solid‐Phase‐enhanced Sample Preparation (SP3) as described previously [10] was used during protein isolation and digestion. In brief, 3 μL of each bead type were added to 30 μg of protein in 50 μL total volume. Neat ethanol was added to a final concentration of 50%. The beads were agitated on a vortex for 10 minutes at medium speed. The samples were centrifuged at 10,000 g for 1 min and the supernatant was aspirated. The beads (with bound protein) were washed 3 times with 80% ethanol in the same manner. For protein digestion, we added 50 μL of 200 mM EPPS pH 8.5 to all samples. For “LysC/trypsin” samples, we added LysC for 6 hr at 37°C on an orbital shaker, followed by trypsin for another 6 hr at 37°C on an orbital shaker. For “LysC-only” samples, we added Lys-C for 6 hr at 37°C on an orbital shaker. Both enzymes were added in the presence of beads and at a 1:100 protease-to-peptide ratio. Following digestion, the samples were centrifuged as above and held to the magnet for 2 min. Digested peptides were simply transferred into a new tube. The beads were then washed with 50 μL of 0.2M EPPS pH 8.5, which was combined with the initial elution.
We added a final volume of 30% acetonitrile to the eluted peptides and labelled the 35 μg of peptide with 70 μg of TMT directly into the digestion mixture. Unit-resolved TMT6 reagents were used. To check mixing ratios, 2.0 μg of each sample were pooled, desalted, and analyzed by mass spectrometry. Using normalization factors calculated from this “label check,” samples were mixed 1:1 across all channels and desalted using a 50 mg Sep-Pak solid phase extraction column. The approximately 180 μg of peptide were fractionated with basic pH reversed-phase (BPRP) HPLC, collected in a 96-well plate and combined down to 24 super-fractions prior to desalting [11, 12].
Mass spectrometry analysis.
Mass spectrometric data were collected on an Orbitrap Lumos mass spectrometer coupled to a Proxeon NanoLC-1200 UHPLC. The 100 μm capillary column was packed with 35 cm of Accucore 150 resin (2.6 μm, 150Å; ThermoFisher Scientific). The scan sequence began with an MS1 spectrum (Orbitrap analysis, resolution 120,000, 350–1400 Th, automatic gain control (AGC) target 5E5, maximum injection time 100 ms). The top ten precursors were then selected for MS2/MS3 analysis. MS2 analysis consisted of collision-induced dissociation (CID), quadrupole ion trap analysis, automatic gain control (AGC) 2E4, NCE (normalized collision energy) 35, q-value 0.25, maximum injection time 120 ms), and isolation window at 0.7. Following acquisition of each MS2 spectrum, we collected an MS3 spectrum in which multiple MS2 fragment ions are captured in the MS3 precursor population using isolation waveforms with multiple frequency notches. MS3 precursors were fragmented by HCD and analyzed using the Orbitrap (NCE 65, AGC 1.5×10⁵, maximum injection time 150 ms, resolution was 50,000 at 400 Th).
Spectra were converted to mzXML via MSconvert [13]. Database searching included all entries from the Saccharomyces Genome Database (SGD; August 2019), Uniprot entries for S. pombe (December 2019), and Uniprot entries for E. coli (December 2019). Each database was concatenated with one composed of all protein sequences for that database in the reversed order. Searches were performed using a 50-ppm precursor ion tolerance for total protein level profiling. The product ion tolerance was set to 0.9 Da. These wide mass tolerance windows were chosen to maximize sensitivity in conjunction with Comet searches and linear discriminant analysis [14, 15]. TMT tags on lysine residues and peptide N termini (+229.163 Da) and carbamidomethylation of cysteine residues (+57.021 Da) were set as static modifications, while oxidation of methionine residues (+15.995 Da) was set as a variable modification. Peptide-spectrum matches (PSMs) were adjusted to a 1% false discovery rate (FDR) [16, 17]. PSM filtering was performed using a linear discriminant analysis, as described previously [15] and then assembled further to a final protein-level FDR of 1% [17]. Proteins were quantified by summing reporter ion counts across all matching PSMs, also as described previously [18]. Reporter ion intensities were adjusted to correct for the isotopic impurities of the different TMT reagents according to manufacturer specifications. The signal-to-noise (S/N) measurements of peptides assigned to each protein were summed and these values were normalized so that the sum of the signal for all proteins in each channel was equivalent to account for equal protein loading. Finally, each protein abundance measurement was scaled, such that the summed signal-to-noise for that protein across all channels equaled 100, thereby generating a relative abundance (RA) measurement. Data analysis and visualization were performed in Microsoft Excel or R.
Data access.
We have included protein lists with TMT relative abundance measurements in supplementary tables: Supplemental Table 1 for E. coli, Supplemental Table 2 for S. cerevisiae, and Supplemental Table 3 for S. pombe. In addition, we provided peptide lists with TMT relative abundance measurements in supplementary tables: Supplemental Table 4 for E. coli, Supplemental Table 5 for S. cerevisiae, and Supplemental Table 6 for S. Pombe. RAW files will be made available upon request. In addition, the data have been deposited in the ProteomeXchange Consortium via the PRIDE [19] partner repository with the dataset identifier PXD020816.
RESULTS and DISCUSSION
SP3 simplified and streamlined sample processing.
We aimed to define the baseline proteome of three microorganisms E. coli, S. cerevisiae, and S. pombe, grown under two common growth media. The cultures were harvested at similar optical densities and all sample processing was performed in parallel, for all three microorganisms. We combined our SL-TMT protocol with the single-pot, solid-phase-enhanced sample preparation (SP3) strategy (3,4). This new approach called SL-SP3-TMT (2) reduces random sample losses associated with chemical-based precipitation strategies, such as trichloroacetic acid or chloroform-methanol precipitation. We briefly highlight a comparison of classic SL-TMT with SL-SP3-TMT (Supplemental Figure 1). Here we assembled a TMT6-plex in which yeast lysate was aliquoted into 6 tubes, 3 for processing with SP3 and 3 for MeOH/CHCl3 precipitation. Peptides were labeled with TMT6-plex and subjected to FAIMS-LC-hrMS2 analysis (Supplemental Figure 1A). We showed no significant difference in TMT summed signal intensity between the two methods (Supplemental Figure 1B). We also showed that the distribution of the coefficients of variation for each method was similar (Supplemental Figure 1C). Similarly, we showed the average TMT summed signal-to-noise for individual proteins (n=3040) were well correlated R2>0.99. These data illustrated that SP3 performs as well as methanol/chloroform precipitation in our hands.
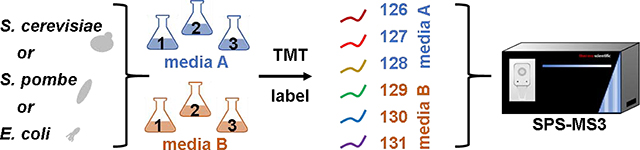
We outlined the SL-SP3-TMT strategy that we used for sample preparation in Figure 1. Growth Media A was NB (nutrient broth), SC (synthetic complete), or EMM (Edinburgh minimal media), while Growth Media B was LB (Luria-Bertani), YPD (yeast-peptone-dextrose), or YES (yeast extract with supplements) for E. coli, S. cerevisiae, and S. pombe, respectively. Along with growth media, differences in proteases were also investigated, namely the use of LysC-only or sequential LysC/trypsin treatment. In all, for each digestion condition, we assembled a total of three TMT6-plexes, one for each microorganism, in biological triplicate with respect to growth media (Supplemental Figure 2).
Figure 1: Experimental overview.

A) E. coli, S. cerevisiae, and S. pombe are propagated in two common media formulations. Cells are harvested and lysed. B) Proteins are extracted and digested using an SP3-based protocol. C) Samples are labeled with TMT6-plex reagents for SPS-MS3 analyses. Adapted from [6]. BPRP, basic pH reversed-phase.
LysC followed by trypsin -based digests quantified more proteins and peptides than LysC alone.
We observed a considerable drop in protein identifications when trypsin was omitted from the digest, that is, when LysC was the only protease used (Table 1). For E. coli, we quantified 2,433 proteins with the LysC/trypsin digest and this value was 1,979 using LysC-only, representing a drop of 20%. Likewise, for S. cerevisiae, we quantified 4,150 proteins with the LysC/trypsin digest, and this dropped to 3,748 using LysC-only, representing a drop of 10%. Similarly, for S. pombe, we quantified 3,752 proteins with the LysC/trypsin digest and this value was 3,443 using LysC-only, representing a drop of only 8%. As expected, the decrease in the number of peptides were more substantial at 47%, 37%, and 36% for E. coli, S. cerevisiae, and S. pombe, respectively. We noted that these data showed a ~10% greater drop in peptides between LysC/trypsin and LysC-only digest for E. coli than the two yeast species. To investigate this finding, we determined the percentage of lysine and arginine in the proteomes of these three microorganisms (Supplemental Table 7). We noted that whereas the yeasts have 7–8% lysine in their respective proteomes, E. coli only had 4% and we speculate this point may influence the observed greater loss in peptides and proteins when only LysC is used for the E. coli samples. These peptides originating from the LysC-only E. coli digest were longer and less likely to be amenable to mass spectrometry analysis, with our current settings.
TABLE 1:
Dataset summary
| Protein | Unique Peptides | Decrease with LysC-only | ||||
|---|---|---|---|---|---|---|
| LysC/tryp | LysC | LysC/tryp | LysC | protein | peptide | |
| E. coli | 2,433 | 1,979 | 20,273 | 10,775 | 19% | 47% |
| S. cerevisiae | 4,150 | 3,748 | 32,693 | 20,688 | 10% | 37% |
| S. pombe | 3,752 | 3,443 | 24,321 | 15,532 | 8% | 36% |
The different protease treatments quantified many distinct peptides, although protein overlap was high.
We compared the protein and peptide overlap with respect to protease treatment. (Supplemental Figure 3). Foremost, we observed high disparities at peptide level as a result of different protease treatment for the three microorganisms, having an overlap of only 16.5%, 22.6%, and 17.8% for E. coli (Supplemental Figure 3A), S. cerevisiae (Supplemental Figure 3B), and S. pombe (Supplemental Figure 3C), respectively. As expected, this large disparity did not carry over to the protein level, as protein overlap was 72.4%, 80.7%, and 78.8% for E. coli, S. cerevisiae, and S. pombe, respectively. These data emphasize that although fewer peptides and proteins were quantified using LysC-alone, the enzyme was robust enough to produce a reliable subset of peptides to infer the proteome of each microorganism having a good overlap with the digestion de facto gold standard (i.e., LysC/trypsin).
We examined further the properties of LysC/trypsin and LysC-only peptides as we observed considerable differences between the two sets. We performed an in silico digest of the proteome of each microorganism with sequential LysC/trypsin digestion or with LysC alone (Protein Digestion Simulator, omics.pnl.gov, PNNL). We then compared several metrics between the two sets of peptides, including hydrophobicity, charge, peptide length, molecular weight, aliphatic index, and isoelectric point [20] (Supplemental Figure 4). Comparing across microorganisms, we observed a moderate difference in hydrophobicity (Supplemental Figure 4A) between peptides originating in E. coli and the two yeast species, while all other properties were similar. We also noted the increased length (Supplemental Figure 4C) and, expectedly, molecular weight (Supplemental Figure 4D) of LysC-only digested peptides originating from E. coli in comparison with LysC/trypsin. From this finding, we speculate that the 10% drop in the number of peptides identified using LysC-only (rather than LysC followed by trypsin) may result from the increased peptide length being unfavorable with the data acquisition parameter settings used herein.
A high degree of difference in the basal level proteome was observed when the microorganisms were grown in different media.
We noted considerable differences in the proteomes related to the growth media used. For each microorganism, we performed hierarchical clustering using Euclidean distance with Ward’s inter-cluster linkage using data that had been scaled to 100 across all six channels for each experiment. We noted for all microorganisms that the three replicates clustered the tightest, followed by the protease treatment. The dendrogram showed that the choice of growth media dwarfed the differences between replicates for all microorganisms: E. coli (Figure 2A), S. cerevisiae (Figure 2B), and S. pombe (Figure 2C).
Figure 2: Overview of protein abundance differences due to growth media for samples digested with LysC/trypsin or LysC-only.

A)-C) Heat maps illustrate the relative abundance the proteins quantified in the A) E. coli, B) S. cerevisiae, and C) S. pombe experiment. Each protein abundance value sums to 100 across the 6 channels. D)-F) Plots illustrating the correlation between in TMT relative abundance values of the proteins quantified in the D) E. coli, E) S. cerevisiae, and F) S. pombe experiment. We note the Pearson correlation (R2) and the number of proteins identified in both the LysC/trypsin or LysC-only datasets on the plots.
We had noted above (Table 1) the considerable difference in the number of quantified proteins with respect to the digestive enzyme used. However, we now interrogated the quantitative TMT data to determine the degree of correlation in terms of the alterations in proteins abundance. We visualized the correlation of protein abundance alterations with scatter plots comparing the log2 ratios of protein abundance using Growth Media A to Growth Media B, that is, NB/LB for E. coli (Figure 2D), SC/YPD for S. cerevisiae (Figure 2E), and EMM/YES for S. pombe (Figure 2F). We calculated the R2 as 0.93, 0.90 and 0.80 for E. coli, S. cerevisiae, and S. pombe, respectively. These data suggested that while the total number of proteins differed between protease treatments, the overall quantification was well-correlated.
Similar number of differentially expressed proteins were quantified with respect to protease treatment.
We examined further fold changes due to the type of growth media used with respect to protease treatment. As expected, the distribution of these changes was nearly identical when comparing protease treatment, with S. cerevisiae having a slightly narrower distribution than the other two microorganisms (Supplemental Figure 5A). In addition to fold change, we also considered hypothesis testing to determine significantly changing proteins. More specifically, we defined statistically significant quantified proteins here as those in which the absolute fold-change was greater than 2 and the Benjamini-Hochberg-corrected p-value [21] was less than 0.01. With these criteria, we obtained a similar number of differentially expressed proteins for both protease treatments (Supplemental Figure 5B). For E. coli, we determined 162 and 142 were up with LysC-only or LysC/trypsin digested samples, respectively, while 287 and 281 were significantly lower in abundance. Similarly, for S. cerevisiae, 305 and 294 were up with LysC-only or LysC/trypsin digested samples, respectively, while 373 and 354 were significantly lower in abundance. Finally, for S. pombe, 291 and 379 were up with LysC-only or LysC/trypsin digested samples, respectively, while 318 and 344 were significantly lower in abundance. Overall, in addition to the comparable number of differentially expressed proteins between protease treatments, these numbers were similar with respect to proteome size among microorganisms as well, i.e., ~10% of each proteome was altered.
We used a series of volcano plots to illustrate statistically significant protein differences. Here, the negative log10 of the Benjamini-Hochberg-corrected p-value is plotted against the log2 ratio of Media A/ Media B (NB/LB for E. coli, SC/YPD for S. cerevisiae, and EMM/YES for S. pombe) for the TMT signal-to-noise quantitation value for each protein. We observed similar plots with respect to protease treatment for E. coli (Figure 3A and 3B), S. cerevisiae (Figure 3C and 3D), and S. pombe (Figure 3E and 3F). The statistically significant proteins were colored in red, with those in the upper left corner being of statistically significant lower abundance, while that in the upper right representing those proteins of higher abundance. We noted similar patterns when comparing the volcano plots for each microorganism for the different protease treatment, which concurs with the comparable number of differentially expressed proteins and fold change distributions (Supplemental Figure 5).
Figure 3: Statistically significant protein abundance differences due to growth media selection.

Volcano plots depict the statistically significant fold-changes of proteins quantified in the E. coli dataset digested with A) LysC-only or B) LysC/trypsin, in the S. cerevisiae dataset digested with C) LysC-only or D) LysC/trypsin, and in the S. pombe dataset digested with E) LysC-only or F) LysC/trypsin. We note the number of statistically significant proteins with absolute fold-changes greater than 2 and Benjamini-Hochberg corrected p-values less than 0.01 in the upper left corner of each plot for lower abundance and the upper right for higher abundance.
Gene ontology categories of differentially expressed proteins were mainly related to metabolic pathways.
Upon defining differentially expressed proteins, we next investigated the gene ontology (GO) classifications of these proteins. Although the media types used for each microorganism were used in routine studies, they varied widely in composition. For example, the chemically defined media, such as EMM for S. pombe and SC for S. cerevisiae have different concentrations of metabolites compared to rich media, such as YES for S. pombe and YPD for S. cerevisiae as these contain, for instance, whole yeast extract which is highly enriched in nutrients. We highlight the major GO categories for the differentially expressed proteins in Table 2. As expected, most GO categories were metabolism-related and many of these categories were common among the three microorganisms.
TABLE 2:
Summary of gene ontology enrichment
| Term | Species | Protease | Direction | Count | % total | p-value |
|---|---|---|---|---|---|---|
| Biosynthesis of amino acids | ||||||
| E.c. | LysC | up | 15 | 10.6 | 4.3E-03 | |
| E.c. | L/T | up | 17 | 10.5 | 1.5E-03 | |
| S.c. | LysC | up | 14 | 4.7 | 9.9E-02 | |
| S.c. | L/T | up | 17 | 5.9 | 1.1E-02 | |
| Biosynthesis of antibiotics | ||||||
| E.c. | LysC | up | 17 | 12.0 | 6.3E-02 | |
| E.c. | L/T | up | 19 | 11.7 | 4.2E-02 | |
| S.c. | LysC | up | 47 | 15.8 | 5.5E-13 | |
| S.c. | L/T | up | 50 | 17.5 | 1.9E-15 | |
| Biosynthesis of 2° metabolites | ||||||
| E.c. | LysC | down | 29 | 10.4 | 2.7E-02 | |
| E.c. | L/T | down | 30 | 10.5 | 4.2E-02 | |
| S.p. | LysC | up | 24 | 16.9 | 9.8E-03 | |
| S.p. | L/T | up | 27 | 16.7 | 2.4E-02 | |
| S.c. | LysC | up | 60 | 20.1 | 1.9E-15 | |
| S.c. | L/T | up | 61 | 21.3 | 1.0E-16 | |
| Carbon metabolism | ||||||
| E.c. | LysC | down | 15 | 5.4 | 1.1E-02 | |
| E.c. | L/T | down | 13 | 4.6 | 4.3E-02 | |
| S.c. | LysC | up | 42 | 14.1 | 1.7E-20 | |
| S.c. | L/T | up | 44 | 15.4 | 7.3E-23 | |
| Metabolic pathways | ||||||
| E.c. | LysC | up | 51 | 35.9 | 5.8E-03 | |
| E.c. | L/T | up | 53 | 32.7 | 2.3E-02 | |
| S.c. | LysC | up | 114 | 38.3 | 9.4E-28 | |
| S.c. | L/T | up | 111 | 38.8 | 1.6E-26 | |
| S.p. | LysC | up | 8 | 42.1 | 2.6E-04 | |
| S.p. | L/T | up | 7 | 38.9 | 4.4E-03 | |
Abbreviations: E.c., E. coli; S.c., S. cerevisiae; S.p., S. pombe; L/T, LysC/trypsin
Several GO categories were similarly enriched across organisms, while some others were exclusive to a given microorganism. For example, several metabolism-related proteins were homologous across the three microorganisms and were significantly different in protein abundance. The first three proteins were implicated in glutamate metabolism and demonstrated a decrease in abundance of greater than 50%. In E. coli, GLTD_ECOLI (Glutamate synthase [NADPH] small chain) catalyzes the conversion of L-glutamine and 2-oxoglutarate into two molecules of L-glutamate (Figure 4A). In S. cerevisiae, DHE2_YEAST (NAD(+)-dependent glutamate dehydrogenase) degrades glutamate to ammonia and alpha-ketoglutarate (Figure 4B). In S. pombe, GDH2_SCHPO (NAD-specific glutamate dehydrogenase) also degrades glutamate to ammonia and alpha-ketoglutarate (Figure 4C).
Figure 4: Example proteins from pathways altered across all three species.

Glutamate metabolism is altered in all three species. Here we highlight: A) GLTD_ECOLI (glutamate synthase), B) DHE2_YEAST (glutamate dehydrogenase), and C) GDH2_SCHPO (glutamate dehydrogenase). In addition, the thiamine biosynthesis pathway is also altered. The specific proteins highlighted are: D) THIG_ECOLI (thiazole synthase), E) THI6_YEAST (thiamine bifunctional enzyme), F) THI6_SCHPO (thiamine bifunctional enzyme), G) THIC_ECOLI (phosphomethylpyrimidine synthase), H) THI21_YEAST (phosphomethylpyrimidine kinase), and I) THI4_SCHPO (thiamine thiazole synthase). TMT RA, tandem mass tag relative abundance. The values for average and standard deviation for the data plotted were tabulated in Supplementary Table 8.
We also highlighted six proteins that were involved in thiamine biosynthesis. The first set of homologous proteins included: THIG_ECOLI, THI6_YEAST, and THI6_SCHPO. In E. coli, THIG_ECOLI (thiazole synthase) catalyzes the rearrangement of 1-deoxy-D-xylulose 5-phosphate to produce the thiazole phosphate moiety of thiamine (Figure 4D). In S. cerevisiae, THI6_YEAST (thiamine biosynthetic bifunctional enzyme) is a bifunctional enzyme that is a thiamine-phosphate pyrophosphorylase and 4-methyl-5-beta-hydroxyethylthiazole kinase (Figure 4E). In S. pombe, THI6_SCHPO (thi4, thiamine biosynthetic bifunctional enzyme) converts 4-methyl-5-(beta-hydroxyethyl)thiazole monophosphateand 2-methyl-4-amino-5-hydroxymethyl pyrimidine pyrophosphate to form thiamine monophosphate (Figure 4F). The set of homologous proteins necessary for thiamine biosynthesis included: THIC_ECOLI, THI21_YEAST, and THI4_SCHPO. In E. coli, THIC_ECOLI (phosphomethylpyrimidine synthase) catalyzes the synthesis of hydroxymethylpyrimidine phosphate from aminoimidazole ribotide (Figure 4G). In S. cerevisiae, THI21_YEAST (hydroxymethylpyrimidine phosphate kinase) is involved in the last steps in thiamine biosynthesis (Figure 4H). In S. pombe, THI4_SCHPO (thi2, thiamine thiazole synthase) is involved in the biosynthesis of the thiamine precursor thiazole (Figure 4I). From these data we can speculate that the absence or low amount of thiamine in NB, SC and EMM media induces the activation of the thiamine pathway and the concomitant up-regulation of proteins associated with thiamine biosynthesis in E. coli, S. cerevisiae, and S. pombe, respectively. The values for the averages and standard deviations of the data plotted in Figure 4 were tabulated in Supplementary Table 8.
Moreover, the selection of growth media is critical for reproducibility across research laboratories. For S. cerevisiae, the effect of thiamine goes beyond the expression of genes associated with its production, in fact, thiamine is factor that affects yeast susceptibility against oxidative, osmotic and thermal stressors (19, 20). The overall effects of compounds or treatments aimed to reduce the detrimental effects of a certain stressor could be over- or under-estimated by the amount of thiamine in the growth media. Supporting this idea, we found significantly increased expression of proteins associated with protection to oxidative stress, for example, catalase A/T, sHSP (small heat shock proteins) and CCP1 (cytochrome-c peroxidase). Catalase A is involved in the breakdown of hydrogen peroxide produced during fatty acid oxidation, while CCP1 degrades reactive oxygen species in the mitochondria. Media selection also has biotechnological implications. For instance, the carbon-to-nitrogen ratio is a critical factor for improving protein expression in E. coli (21), having different carbon-to-nitrogen ratios will affect the carbon flux thus decreasing or increasing the expression of the foreign protein.
Finally, we observed that each microorganism had some exclusively-affected pathways (Figure 5). For instance, in the case of E. coli, we found an increase in the relative abundance of proteins associated with iron transport (Figure 5A) and a decrease of those implicated in tryptophan biosynthesis when the cells were grown in NB media. This differential expression could bias the result of different biochemical tests, as iron is a well-known element that regulates energy metabolism and iron availability in pathogens regulates their virulence. Enterobactin (part of the iron-uptake system), for example, is associated with pathogenesis in urinary tract infections caused by E. coli (22). The overexpression of iron transport-related proteins indicated less iron bioavailability in nutrient broth compared to Luria-Bertani broth. This finding suggested that for studies aiming to explore the pathogenesis of E. coli, using media with appropriate iron availability is essential. In the case of the two yeast species, S. cerevisiae and S. pombe (Figure 5B and 5C), we observed that different steps of energy production associated with the electron transport chain were up-regulated. Furthermore, the steps associated with ribosome assembly were downregulated when the cells were grown in chemically defined media (Synthetic complete media for S. cerevisiae and Edinburg minimal media for S. pombe). In all, some dysregulated pathways were shared, while others were exclusive to a given microorganism, all of which merit further investigation.
Figure 5: Microorganism-specific differentially affected pathways.

Each microorganism has several metabolic pathways affected exclusively by the growth media used. Here we highlight: A) Iron transport and tryptophan biosynthetic process in E. coli, B) Mitochondrial electron transport and ribosomal large subunit assembly for S. cerevisiae, and C) Mitochondrial ATP synthesis and maturation of 5.8S rRNA for S. pombe.
Conclusions.
We showed growth media-induced proteome remodeling in three commonly used laboratory microorganisms, specifically E. coli, S. cerevisiae, and S. pombe. Using the streamlined SP3-assisted TMT (SL-SP3-TMT) method, we quantified over 80% of the proteins in their respective microbial proteome. We tested two protease treatments, LysC followed by trypsin and LysC alone. Although digestion with two proteases increased the number of both peptides and proteins quantified, the biological findings were similar for either approach. Unique peptides that were identified from each digestion condition may be valuable for targeted TMT-based assays [22]. At the protein level, 300–700 proteins (representing ~10% of the respective microbial proteomes) were significantly altered for each microorganism, the majority of which functioned in metabolic processes, as expected due to disparities in metabolite composition of each growth medium. Our data showed that the differences in baseline proteomes for these microorganisms changed drastically with choice of media and could impact scientific findings or may explain disparities among experiments, thus emphasizing the importance of growth media selection for cell-based proteomic assays. In summary, we provided six datasets for further datamining that are potentially valuable for deciding growth media selection with respect to downstream biochemical analysis.
Supplementary Material
Supplemental Figure 1: Comparison of SP3 and methanol-chloroform precipitation (MeOH/CHCl3 ppt) A) Workflow. Yeast lysate was aliquoted into 6 tubes, 3 for processing with SP3 and 3 for MeOH/CHCl3 precipitation. Peptides were labeled with TMT6-plex and subjected to FAIMS-LC-hrMS2 analysis. B) Bar plot of the signal intensities for each method. Error bars represent standard deviations. C) Frequency distribution plot of the coefficients of variation for each method. D) A correlation plot of the average TMT summed signal-to-noise for each protein (n=3040).
Supplemental Figure 2: TMT6-plex layouts. We illustrate the order of the TMT6-plex labels for the A) E. coli, B) S. cerevisiae, and C) S. pombe experiments.
Supplemental Figure 3: Overlap of quantified peptides and proteins for the digestion conditions for each proteome. Venn diagrams depicting the overlap of digestion conditions for peptides (left) and proteins (right) for the A) E. coli, B) S. cerevisiae, and C) S. pombe experiment.
Supplemental Figure 4: Physicochemical properties of peptides from the proteomes of each data set. The box-and-whisker plots represent the distribution of A) hydrophobicity, B) charge, C) peptide length, D) molecular weight, E) aliphatic index, and F) isoelectric point (PI) for in silico LysC or LysC-trypsin (L/tryp.) digested peptides originating from E. coli (E.c.), S. cerevisiae (S.c.), and S. pombe (S.p.).
Supplemental Figure 5: Fold changes across all three microorganisms. A) Probability density function plot of the fold changes in each of the three microorganisms investigated. The ratios (of the media types used) for each microorganism are depicted in the lower right corner of the plot. B) Table depicting the number of statistically significant differences for each microorganism and digestive enzyme(s) used. A statistically significant quantified protein is defined here as one in which the absolute fold-change is greater than 2 and the Benjamini-Hochberg corrected p-value less than 0.01.
SIGNIFICANCE.
Various microorganisms are used as model systems throughout in biological studies, including proteomics-based investigations. The growth conditions of these organisms are of utmost importance, of which one major consideration is the choice of growth media. We hypothesize that growth media selection has a considerable impact on the baseline proteome of a given microorganisms. To test this hypothesis, we used tandem mass tag (TMT)-based quantitative multiplexed proteomics to profile the proteomes of E. coli, S. cerevisiae, and S. pombe each grown in two different, yeast common, growth media for the respective species. Our data show that approximately 10% of the proteins of each respective microorganism were significantly altered and that many of the differentially expressed proteins are implicated in metabolism. We provide several datasets which are potentially valuable for growth media selection with respect to downstream biochemical analysis.
HIGHLIGHTS.
We investigate the effect of growth media on the proteomes of three microorganisms
10% of the proteins in each respective microbe were significantly altered
The majority of differentially expressed proteins are implicated in metabolism
Sample preparation integrates SP3 bead-assisted protein isolation and digestion
We compared digestion with sequential with LysC and trypsin treatment to only LysC
ACKNOWLEDGEMENTS
We would like to thank the members of the Gygi Lab at Harvard Medical School. This work was funded in part by NIH/NIGMS grant R01 GM132129 (J.A.P.) and GM67945 (S.P.G.).
Footnotes
Publisher's Disclaimer: This is a PDF file of an unedited manuscript that has been accepted for publication. As a service to our customers we are providing this early version of the manuscript. The manuscript will undergo copyediting, typesetting, and review of the resulting proof before it is published in its final form. Please note that during the production process errors may be discovered which could affect the content, and all legal disclaimers that apply to the journal pertain.
REFERENCES
- [1].Sayers EW, Agarwala R, Bolton EE, Brister JR, Canese K, Clark K, Connor R, Fiorini N, Funk K, Hefferon T, Holmes JB, Kim S, Kimchi A, Kitts PA, Lathrop S, Lu Z, Madden TL, Marchler-Bauer A, Phan L, Schneider VA, Schoch CL, Pruitt KD, Ostell J, Database resources of the National Center for Biotechnology Information, Nucleic Acids Res 47(D1) (2019) D23–D28. [DOI] [PMC free article] [PubMed] [Google Scholar]
- [2].Tao H, Bausch C, Richmond C, Blattner FR, Conway T, Functional genomics: expression analysis of Escherichia coli growing on minimal and rich media, J Bacteriol 181(20) (1999) 6425–40. [DOI] [PMC free article] [PubMed] [Google Scholar]
- [3].Paulo JA, O’Connell JD, Gaun A, Gygi SP, Proteome-wide quantitative multiplexed profiling of protein expression: carbon-source dependency in Saccharomyces cerevisiae, Mol Biol Cell 26(22) (2015) 4063–74. [DOI] [PMC free article] [PubMed] [Google Scholar]
- [4].Paulo JA, O’Connell JD, Everley RA, O’Brien J, Gygi MA, Gygi SP, Quantitative mass spectrometry-based multiplexing compares the abundance of 5000 S. cerevisiae proteins across 10 carbon sources, J Proteomics 148 (2016) 85–93. [DOI] [PMC free article] [PubMed] [Google Scholar]
- [5].Navarrete-Perea J, Yu Q, Gygi SP, Paulo JA, Streamlined Tandem Mass Tag (SL-TMT) Protocol: An Efficient Strategy for Quantitative (Phospho)proteome Profiling Using Tandem Mass Tag-Synchronous Precursor Selection-MS3, J Proteome Res 17(6) (2018) 2226–2236. [DOI] [PMC free article] [PubMed] [Google Scholar]
- [6].Paulo JA, Navarrete-Perea J, Gygi SP, Multiplexed proteome profiling of carbon source perturbations in two yeast species with SL-SP3-TMT, J Proteomics 210 (2020) 103531. [DOI] [PMC free article] [PubMed] [Google Scholar]
- [7].Hughes CS, Sorensen PH, Morin GB, A Standardized and Reproducible Proteomics Protocol for Bottom-Up Quantitative Analysis of Protein Samples Using SP3 and Mass Spectrometry, Methods Mol Biol 1959 (2019) 65–87. [DOI] [PubMed] [Google Scholar]
- [8].Hughes CS, Moggridge S, Muller T, Sorensen PH, Morin GB, Krijgsveld J, Single-pot, solid-phase-enhanced sample preparation for proteomics experiments, Nat Protoc 14(1) (2019) 68–85. [DOI] [PubMed] [Google Scholar]
- [9].Moggridge S, Sorensen PH, Morin GB, Hughes CS, Extending the Compatibility of the SP3 Paramagnetic Bead Processing Approach for Proteomics, J Proteome Res 17(4) (2018) 1730–1740. [DOI] [PubMed] [Google Scholar]
- [10].Hughes CS, Foehr S, Garfield DA, Furlong EE, Steinmetz LM, Krijgsveld J, Ultrasensitive proteome analysis using paramagnetic bead technology, Mol Syst Biol 10 (2014) 757. [DOI] [PMC free article] [PubMed] [Google Scholar]
- [11].Paulo JA, Nicotine alters the proteome of two human pancreatic duct cell lines, JOP : Journal of the pancreas 15(5) (2014) 465–74. [DOI] [PMC free article] [PubMed] [Google Scholar]
- [12].Paulo JA, Gygi SP, Nicotine-induced protein expression profiling reveals mutually altered proteins across four human cell lines, Proteomics 17(1–2) (2017). [DOI] [PMC free article] [PubMed] [Google Scholar]
- [13].Chambers MC, Maclean B, Burke R, Amodei D, Ruderman DL, Neumann S, Gatto L, Fischer B, Pratt B, Egertson J, Hoff K, Kessner D, Tasman N, Shulman N, Frewen B, Baker TA, Brusniak MY, Paulse C, Creasy D, Flashner L, Kani K, Moulding C, Seymour SL, Nuwaysir LM, Lefebvre B, Kuhlmann F, Roark J, Rainer P, Detlev S, Hemenway T, Huhmer A, Langridge J, Connolly B, Chadick T, Holly K, Eckels J, Deutsch EW, Moritz RL, Katz JE, Agus DB, MacCoss M, Tabb DL, Mallick P, A cross-platform toolkit for mass spectrometry and proteomics, Nat Biotechnol 30(10) (2012) 918–20. [DOI] [PMC free article] [PubMed] [Google Scholar]
- [14].Beausoleil SA, Villen J, Gerber SA, Rush J, Gygi SP, A probability-based approach for high-throughput protein phosphorylation analysis and site localization, Nature biotechnology 24(10) (2006) 1285–92. [DOI] [PubMed] [Google Scholar]
- [15].Huttlin EL, Jedrychowski MP, Elias JE, Goswami T, Rad R, Beausoleil SA, Villen J, Haas W, Sowa ME, Gygi SP, A tissue-specific atlas of mouse protein phosphorylation and expression, Cell 143(7) (2010) 1174–89. [DOI] [PMC free article] [PubMed] [Google Scholar]
- [16].Elias JE, Gygi SP, Target-decoy search strategy for mass spectrometry-based proteomics, Methods Mol Biol 604 (2010) 55–71. [DOI] [PMC free article] [PubMed] [Google Scholar]
- [17].Elias JE, Gygi SP, Target-decoy search strategy for increased confidence in large-scale protein identifications by mass spectrometry, Nat Methods 4(3) (2007) 207–14. [DOI] [PubMed] [Google Scholar]
- [18].McAlister GC, Huttlin EL, Haas W, Ting L, Jedrychowski MP, Rogers JC, Kuhn K, Pike I, Grothe RA, Blethrow JD, Gygi SP, Increasing the Multiplexing Capacity of TMTs Using Reporter Ion Isotopologues with Isobaric Masses, Analytical Chemistry 84(17) (2012) 7469–7478. [DOI] [PMC free article] [PubMed] [Google Scholar]
- [19].Perez-Riverol Y, Csordas A, Bai J, Bernal-Llinares M, Hewapathirana S, Kundu DJ, Inuganti A, Griss J, Mayer G, Eisenacher M, Perez E, Uszkoreit J, Pfeuffer J, Sachsenberg T, Yilmaz S, Tiwary S, Cox J, Audain E, Walzer M, Jarnuczak AF, Ternent T, Brazma A, Vizcaino JA, The PRIDE database and related tools and resources in 2019: improving support for quantification data, Nucleic Acids Res 47(D1) (2019) D442–D450. [DOI] [PMC free article] [PubMed] [Google Scholar]
- [20].R.C.T.R.A.l.a.e.f.s.c.R.F.f. Statistical, V. Computing, Austria: URL http://www.R-project.org/. [Google Scholar]
- [21].Benjamini YH, Yosef Controlling the false discovery rate: a practical and powerful approach to multiple testing. J. Roy. Statist. Soc. Ser B 57 (1995), no. 1, 289–300. . [Google Scholar]
- [22].Erickson BK, Rose CM, Braun CR, Erickson AR, Knott J, McAlister GC, Wuhr M, Paulo JA, Everley RA, Gygi SP, A Strategy to Combine Sample Multiplexing with Targeted Proteomics Assays for High-Throughput Protein Signature Characterization, Mol Cell 65(2) (2017) 361–370. [DOI] [PMC free article] [PubMed] [Google Scholar]
Associated Data
This section collects any data citations, data availability statements, or supplementary materials included in this article.
Supplementary Materials
Supplemental Figure 1: Comparison of SP3 and methanol-chloroform precipitation (MeOH/CHCl3 ppt) A) Workflow. Yeast lysate was aliquoted into 6 tubes, 3 for processing with SP3 and 3 for MeOH/CHCl3 precipitation. Peptides were labeled with TMT6-plex and subjected to FAIMS-LC-hrMS2 analysis. B) Bar plot of the signal intensities for each method. Error bars represent standard deviations. C) Frequency distribution plot of the coefficients of variation for each method. D) A correlation plot of the average TMT summed signal-to-noise for each protein (n=3040).
Supplemental Figure 2: TMT6-plex layouts. We illustrate the order of the TMT6-plex labels for the A) E. coli, B) S. cerevisiae, and C) S. pombe experiments.
Supplemental Figure 3: Overlap of quantified peptides and proteins for the digestion conditions for each proteome. Venn diagrams depicting the overlap of digestion conditions for peptides (left) and proteins (right) for the A) E. coli, B) S. cerevisiae, and C) S. pombe experiment.
Supplemental Figure 4: Physicochemical properties of peptides from the proteomes of each data set. The box-and-whisker plots represent the distribution of A) hydrophobicity, B) charge, C) peptide length, D) molecular weight, E) aliphatic index, and F) isoelectric point (PI) for in silico LysC or LysC-trypsin (L/tryp.) digested peptides originating from E. coli (E.c.), S. cerevisiae (S.c.), and S. pombe (S.p.).
Supplemental Figure 5: Fold changes across all three microorganisms. A) Probability density function plot of the fold changes in each of the three microorganisms investigated. The ratios (of the media types used) for each microorganism are depicted in the lower right corner of the plot. B) Table depicting the number of statistically significant differences for each microorganism and digestive enzyme(s) used. A statistically significant quantified protein is defined here as one in which the absolute fold-change is greater than 2 and the Benjamini-Hochberg corrected p-value less than 0.01.