Abstract
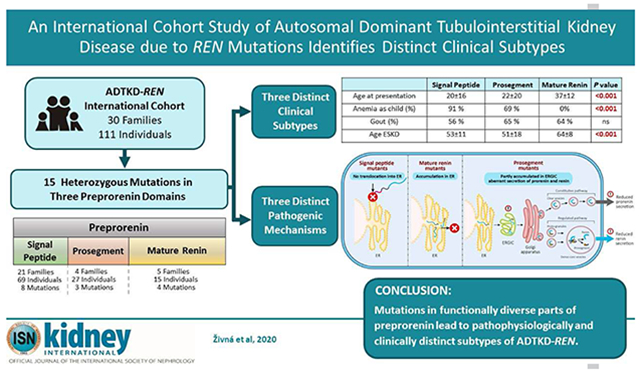
There have been few clinical or scientific reports of autosomal dominant tubulointerstitial kidney disease due to REN mutations (ADTKD-REN), limiting characterization. To further study this, we formed an international cohort characterizing 111 individuals from 30 families with both clinical and laboratory findings. Sixty-nine individuals had a REN mutation in the signal peptide region (signal group), 27 in the prosegment (prosegment group), and 15 in the mature renin peptide (mature group). Signal group patients were most severely affected, presenting at a mean age of 19.7 years, with the prosegment group presenting at 22.4 years, and the mature group at 37 years. Anemia was present in childhood in 91% in the signal group, 69% prosegment, and none of the mature group. REN signal peptide mutations reduced hydrophobicity of the signal peptide, which is necessary for recognition and translocation across the endoplasmic reticulum, leading to aberrant delivery of preprorenin into the cytoplasm. REN mutations in the prosegment led to deposition of prorenin and renin in the endoplasmic reticulum Golgi intermediate compartment and decreased prorenin secretion. Mutations in mature renin led to deposition of the mutant prorenin in the endoplasmic reticulum, similar to patients with ADTKD-UMOD, with a rate of progression to end stage kidney disease (63.6 years) that was significantly slower vs. the signal (53.1 years) and prosegment groups (50.8 years) (significant hazard ratio 0.367). Thus, clinical and laboratory studies revealed subtypes of ADTKD-REN that are pathophysiologically, diagnostically, and clinically distinct.
Keywords: Autosomal dominant tubulo-interstitial kidney disease, renin, mutation, characterization, signal peptide, prosegment
Graphical Abstract
INTRODUCTION
Autosomal dominant tubulo-interstitial kidney disease (ADTKD) is characterized by autosomal dominant inheritance, bland urinary sediment, and slowly progressive chronic kidney disease (CKD) leading to end-stage kidney disease (ESKD) between 30 and 80 years (1). While ADTKD was described in fewer than 10 families prior to 1990, genetic testing has led to increased detection, with over 300 families reported (2–5). ADTKD due to mutations in the REN gene encoding renin (ADTKD-REN) is one of the least common forms of ADTKD (5), with only 8 families and 28 individuals reported before 2020 (5–11).
Renin is a hormone primarily produced in the kidney that is requisite for tubulogenesis (12) and embryonic kidney formation (13). The renin angiotensin system (RAS) is a key modulator of blood pressure (14) and CKD progression (15). Renin biosynthesis constitutes the first enzymatic steps in the RAS. The human renin precursor is synthesized in the juxtaglomerular cells of the macula densa as a 406 amino acid preprorenin, composed of a 23 amino acid N-terminal signal peptide, a 43 amino acid prosegment, and a 340 amino acid mature renin peptide (16). During biosynthesis, the signal peptide mediates insertion of the nascent preprorenin into the translocation channel in the endoplasmic reticulum (ER) and initiates cotranslational translocation of preprorenin into the ER lumen, where glycosylation and proteolytic processing of the nascent preprorenin occur, conditioning further transit of prorenin and renin through the constitutive and regulated secretory pathways (17).
In ADTKD-REN, heterozygous REN mutations lead to decreased synthesis of prorenin and renin, resulting in mild hyperkalemia, anemia, hyperuricemia, and a predisposition to the development of acute kidney injury (5). REN mutations have been reported in the segment of the REN gene encoding the signal peptide (5–8) and the mature renin protein (9, 10). Mutations in the prosegment – a segment of the gene after the signal peptide that assists in protein folding – have not been reported. The small number of case reports of ADTKD-REN has prevented clinical correlation with mutation type and identification of risk factors for progression to ESKD.
We performed an international retrospective cohort study and collected clinical and genetic data on 111 individuals from 30 families with heterozygous REN mutations in order to better characterize this condition. We performed laboratory investigations on ten representative mutations (five in the signal peptide, three in the prosegment, and two in mature renin) and characterized two missense REN variants of unknown significance found in African-Americans, p.P8A and p.R33W.
RESULTS
Of 111 individuals from 30 families (see Table 1 and Supplementary Figures S1, S2), sixty-nine (62%) individuals had a mutation in the signal peptide, 27 (24%) in the prosegment, and 15 (14%) in the mature renin peptide. A mutation in p.S45N was identified in one individual with ADTKD of unknown cause. This mutation did not segregate with disease and was determined to be nonpathogenic; it was included as a control for laboratory investigations. While searching variant databases, we noticed two additional rare missense variants (AA_REN variants) found specifically in African-Americans, a group with an increased prevalence of low-renin hypertension and CKD (18). These variants encode p.P8A in the signal peptide and p.R33W in the prosegment of preprorenin. Their allelic frequencies in African-Americans are 0.007 and 0.001 respectively.
Table 1.
Distribution of heterozygous mutations causing ADTKD-REN mutations by mutation group and family.
| Mutation group | Nucleotide change | Mutation | Families (n) | Individuals (n) |
|---|---|---|---|---|
| Signal | c. 28T>C | p.Trp10Arg | 1 | 5 |
| c.35T>C | p.Leu12Pro | 1 | 1 | |
| c. 38T>A | p.Leu13Gln | 1 | 1 | |
| c.45_47del | p.delLeu16 | 6 | 28 | |
| c. 47T>C | p.Leu16Pro | 3 | 11 | |
| c. 47T>G | p.Leu16Arg | 2 | 9 | |
| c. 49T>C | p.Trp17Arg | 4 | 9 | |
| c. 58T>C | p.Cys20Arg | 3 | 5 | |
| Signal total | 21 | 69 | ||
| Prosegment | c.77C>T | p.Thr26Ile | 2 | 19 |
| c. 116T>A | p.Met39Lys | 1 | 5 | |
| c.142G>A | p.Glu48Lys | 1 | 3 | |
| Prosegment total | 4 | 27 | ||
| Mature | c. 973T>C | p.Cys325Arg | 1 | 3 |
| c. 1097T>A | p.Ile366Asn | 1 | 2 | |
| c. 1142T>C | p.Leu381Pro | 1 | 5 | |
| c. 1172C>G | p.Thr391Arg | 1 | 4 | |
| c. 255G>C | p.Gln85His | 1 | 1 | |
| Mature Total | 5 | 15 | ||
| Total | 30 | 111 |
Effect of Mutation Class on Clinical Characteristics
Presentation
After excluding patients with missing data (n=14) and those identified by genetic screening (n=16), there were 81 patients for analysis (see Table 2 and Supplementary Table S1 for clinical characteristics according to each mutation). Patients in the signal group were the most severely affected and presented at the youngest age. The mean age of clinical presentation was 19.7±15.7 years for the signal group, 22.4±20.2 years for the prosegment group, and 37.0±12.4 years for the mature group (p<0.001 for comparison of the mature group vs. signal and prosegment group). Only patients in the signal group presented with acute kidney injury (10%) or acidosis, anemia, and kidney failure (13%). Thirty-one percent of patients in the signal group and 50% of patients in the prosegment group presented with anemia. Patients in the mature group presented only with gout (75%) or CKD (25%). The mean age of presentation was similar for men and women (19.3±13.7 years vs. 19.9±19.4 years, p=0.6).
Table 2.
Characteristics according to mutation group.
| Signal | Prosegment | Mature | P value | |
|---|---|---|---|---|
| Individuals | 69 (62%) | 27(24%) | 15(14%) | |
| Families | 21(70%) | 4(13%) | 5(17%) | |
| Age at presentation1 < 10 | 23(39%) | 11(61%) | 0 | 0.003 |
| Age at presentation1 10 to < 20 | 19(32%) | 2(11%) | 0 | 0.02 |
| Age at presentation1 >20 | 17(29%) | 5(28%) | 12(100%) | <0.001 |
| Age at presentation (mean±s.d.)1,2 | 19.7±15.7 | 22.4±20.2 | 37.0±12.42 | |
| Reason for presentation1,2 | 0.014 | |||
| Acute kidney injury | 5/55 (10%) | 0 | 0 | |
| Anemia, acidosis, kidney failure | 7/55(13%) | 0 | 0 | |
| Anemia | 17/55(31%) | 7/14(50%) | 0 | |
| Chronic kidney disease | 12/55(22%) | 2/14(14%) | 3/12(25%) | |
| Gout | 14/55(25%) | 5/14(36%) | 9/12(75%) | |
| Total | 55 | 14 | 12 | |
| Anemia as child (%) | 39/43(91%) | 11/16(69%) | 0/7(0%) | <0.001 |
| Gout developed during the course of disease (%) | 31/55(56%) | 13/20(65%) | 9/14(64%) | 0.74 |
| Age at first gout attack (mean±s.d.) | 29.7±9.9 | 25.7±8.2 | 32.9±11.2 | 0.4 |
| Age at ESKD onset (mean±s.d.) | 53.1±10.6 | 50.8±17.6 | 63.6±7.62 |
Excluding individuals who presented for asymptomatic genetic screening. Six of 61 (10%) in the signal group, 7/21 (33%) in the prosegment group, and 3/15 (20%) patients in the mature group were identified by asymptomatic genetic screening.
p<0.001 when compared to the two other groups.
Kidney function
Kidney function was less severely affected in the mature group vs. the signal and prosegment groups. Figure 1A displays all estimated glomerular filtration (eGFR) values obtained for the entire cohort of patients. An eGFR of 10 mL/min/1.73m2 was assigned at the age of ESKD. Patients in the signal and prosegment group presented much earlier in life. At earliest clinical presentation, the majority of eGFR readings in these groups were below 60 mL/min/1.73 m2, suggesting that decreased kidney function is present at birth in most patients. Despite early decreased function, eGFR values tended to remain relatively stable during childhood and through adolescence. Figure 1B shows data on 13 children in the signal group with multiple eGFR measurements. In almost all cases, eGFR remained steady with minimal decline, including one patient whose eGFR remained stable at approximately 30 mL/min/1.73m2 from age 2 through age 16 (Figure 1B: p.C20R with red markers). Another patient (p.M39K) presented during infancy with an eGFR of 19 mL/min/1.73 m2 and had a relatively stable eGFR through childhood before proceeding to renal replacement therapy at 15 years, being the only individual reaching ESKD prior to age 30 years. After adolescence, there was in general a slow decline in eGFR in the signal and prosegment groups (see Figure 1A). The median age of ESKD was 57 years in the signal group, 62 years in the prosegment group, and 68 years in the mature group (Figure 2). Patients in the mature group had no laboratory values until age 20 years, due to milder manifestations (see Figure 1A). Patients in the mature group presenting at this age appeared to have normal kidney function.
Figure 1. Age vs. estimated glomerular filtration rate (eGFR) in ADTKD-REN patients.
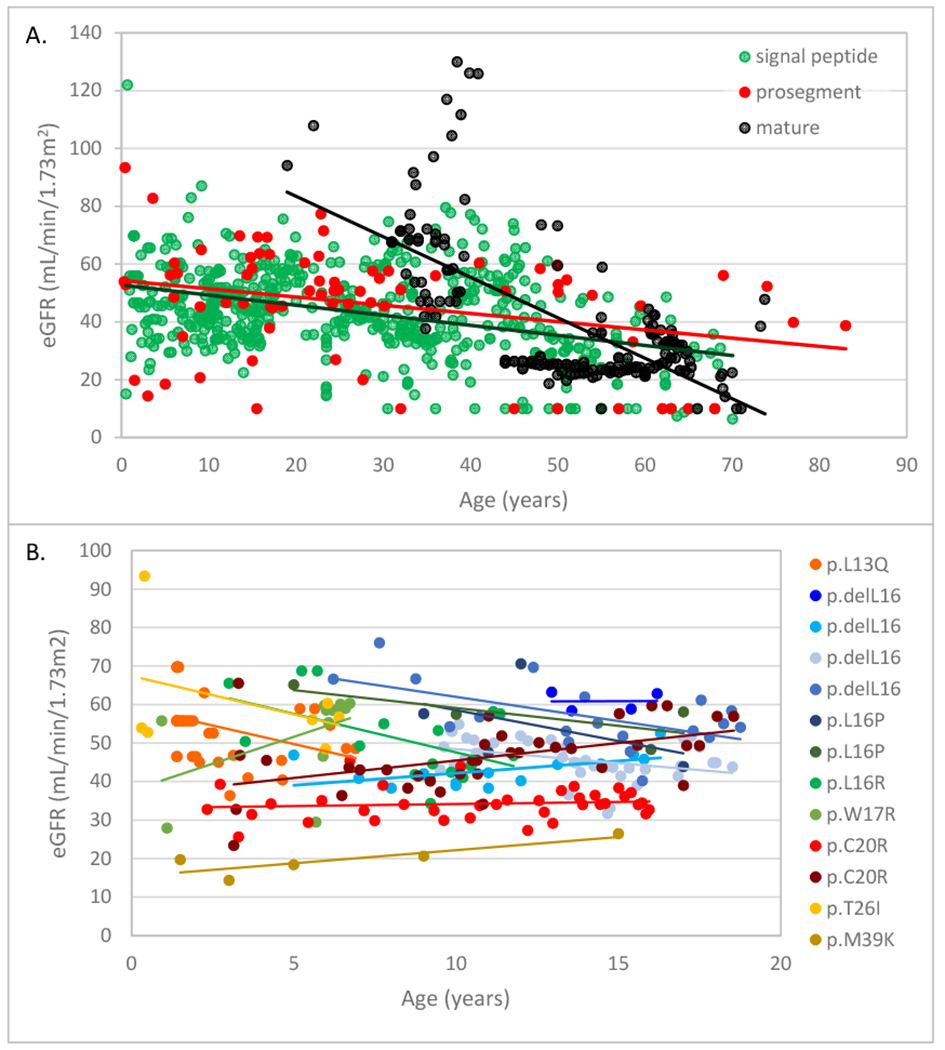
A. All estimated glomerular filtration rate (eGFR) measurements for each group are included (signal group green, prosegment group red, mature group black). A best-fit line is included for each group. Patients in the mature group presented later in life and had normal kidney function at earliest measurement. Patients in the signal and prosegment group often presented early in life, and eGFR was significantly decreased from the time of first measurement in most patients. B. eGFR values in 13 children with longitudinal follow-up from the signal group. Each child is represented by a different color with a best-fit line, and the REN mutation is given in the legend. Despite having low eGFR values at earliest measurement, kidney function remained stable until age 20 in most patients.
Figure 2. End-stage kidney disease (ESKD) survival in ADTKD-REN individuals according to REN mutation group.
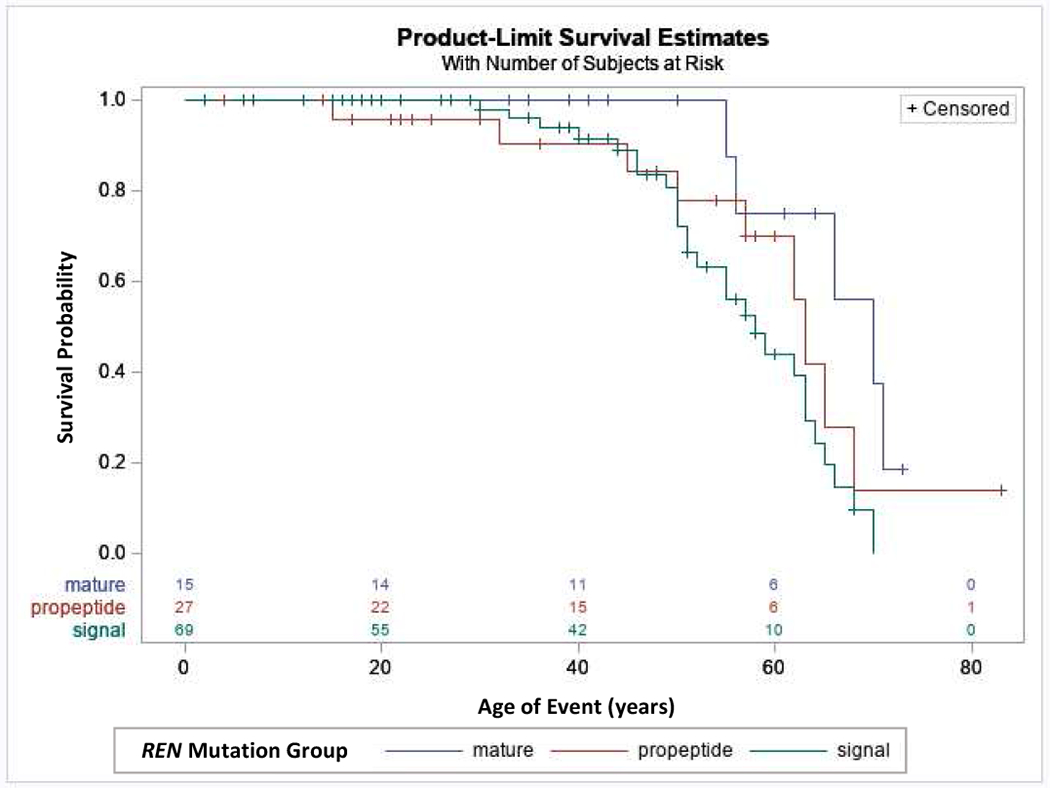
This analysis included 111 individuals. An event was defined as starting dialysis or receiving a transplant. Censoring occurred if the individual had not reached ESKD by the end of the study period. Patients in the mature group had a later age of onset of ESKD compared to the signal and prosegment groups (hazard ratio = 0.237, p=0.023).
To evaluate risk factors for ESKD progression, univariate Cox proportional hazards models were created, with the event being age of ESKD. Patients in the mature group had a significantly decreased risk of developing ESKD over time vs the signal and prosegment groups combined, with a hazard ratio of 0.37 (p=0.023) (See Table 3 and Figure 2). In other univariate models, anemia in childhood (hazard ratio 2.82, p=0.03) (See Table 3 and Figure 3) was significantly associated with an earlier age of ESKD, while gender was not associated with progression to ESKD. The best-fit Cox proportional hazards model included only anemia in childhood (See Table 3 and Figure 3).
Table 3. Proportional hazards models including all individuals, with the event being age of end-stage kidney disease (ESKD).
The univariate model showing anemia in childhood was also the best-fit multivariate model.
| Model | Risk | Reference | Hazard ratio | P value |
|---|---|---|---|---|
| Univariate | Mutation affecting mature renin | Mutations affecting signal peptide and prosegment | 0.367 | 0.023 |
| Univariate | Anemia in childhood | No anemia in childhood or unknown | 2.82 | 0.003 |
| Univariate | Male | Female | 0.92 | 0.80 |
Figure 3. End-stage kidney disease (ESKD) survival according to presence of anemia in childhood.
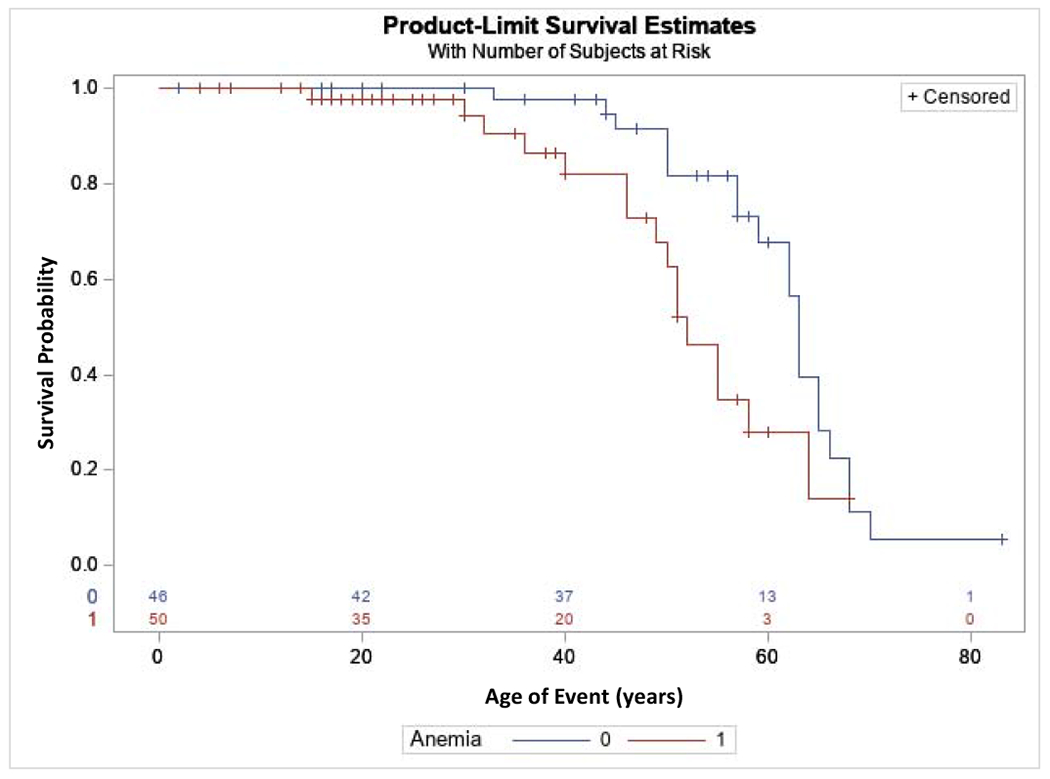
This analysis included 111 ADTKD-REN individuals. An event was defined as starting dialysis or receiving a transplant. Censoring occurred if the individual had not reached ESKD by the end of the study period. A diagnosis of anemia in childhood was associated with a worse prognosis (hazard ratio 2.82, p=0.03).
Anemia
Figure 4A shows hemoglobin levels in patients not on erythropoietin. The lowest hemoglobin values were 7.5 g/dL. The mean hemoglobin levels were 9.6±1.04 g/dL for age <10 years, 10.1±1.1 g/dL for 10 to <15 years, and 10.5±1.2 g/dL for ages 15 to < 20y. Females were more likely to have anemia as children (97% vs. 46%, p=0.005) and have lower hemoglobin levels (see Table 4 and Figure 4A). Hemoglobin levels in women tended to remain low over time, while in men, hemoglobin levels appeared to rise after age 20 years. For 14 children who never received erythropoietin, the mean hemoglobin level was 9.8±1.2 g/dL (range 7.4-13.8 g/dL). For children who received erythropoietin, while not receiving erythropoietin the mean hemoglobin level was 10.1±1.3 g/dL (range 7.6-12.6 g/dL).
Figure 4. Hemoglobin, hyperkalemia and acidemia in ADTKD-REN patients.
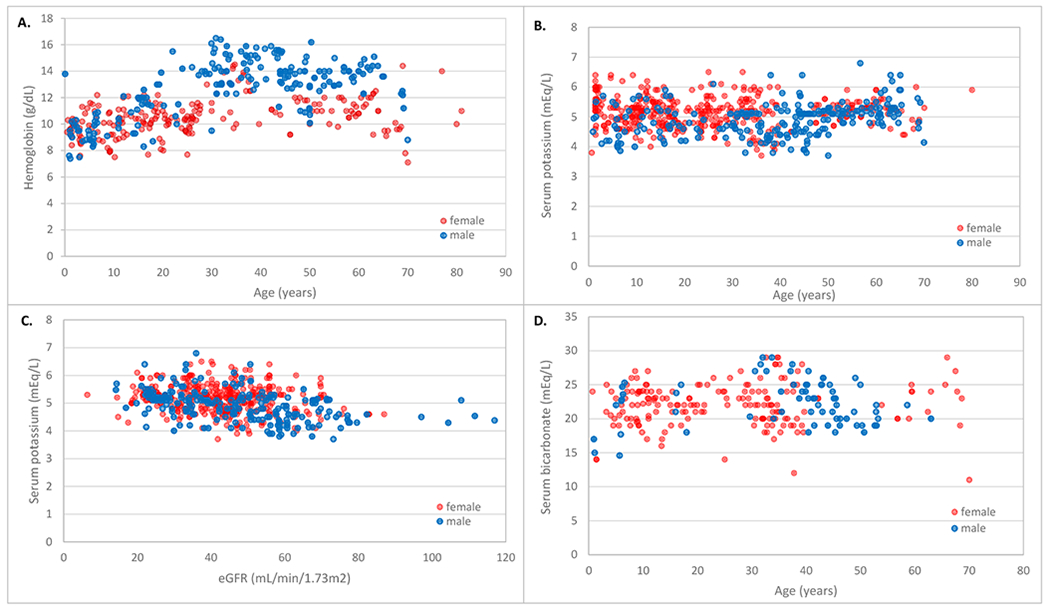
Red circles represent females and blue circles represent males. A. Hemoglobin values according to age. For females, hemoglobin values were low throughout the period of measurement. For males, hemoglobin values began to rise at age 20. B. Serum potassium values according to age. Values remained consistent over time. C. Serum potassium according to estimated glomerular filtration rate (eGFR). D. Serum bicarbonate values according to age. There were many serum bicarbonate values <24 mEq/l.
Table 4.
Characteristics of presentation according to gender for patients with signal peptide or prosegment mutations.
| Female | Male | P value | |
|---|---|---|---|
| Individuals | 44 | 52 | 0.41 |
| Age at presentation1 < 10 | 18/35(48.6%) | 17/43(39.5) | 0.42 |
| Age at presentation1 10 to < 20 | 9/35(25.7%) | 12/43(27.9%) | 0.85 |
| Age at presentation1 >20 | 9/35(25.7) | 13/43(30.2%) | 0.66 |
| Age at presentation (mean±s.d.) | 19.9±19.4 | 19.3±13.7 | 0.6 |
| Anemia as child (%) | 31/32(96.7%) | 19/27(45.8%) | 0.005 |
| Gout(%) | 15/38(39.5%) | 29/37(49.3%) | 0.0006 |
| Age at first gout attack (mean±s.d.) | 30.3±9.6 | 27.8±9.7 | 0.45 |
| Age at ESKD onset (mean±s.d.) | 50.1±11.4 | 55.8±10.5 | 0.25 |
| Serum potassium (mEq/L) (mean±s.d.) | 5.1±0.5 | 5.1±0.6 | 0.75 |
| Serum bicarbonate (mEq/L) (mean±s.d.) | 21.3±0.4 | 22.2±2.5 | 0.38 |
| Serum urate (mg/dL) without urate-lowering therapy (mean±s.d.) | 7.7±1.6 | 9.4±2.7 | 0.02 |
Excluding individuals who presented for asymptomatic genetic screening.
Hyperkalemia and academia
Hyperkalemia was present but rarely reach life-threatening levels. Figure 4 shows serum potassium values according to age (4B) and eGFR (4C). Serum bicarbonate levels vs. age are depicted in Figure 4D. Serum bicarbonate values were frequently below 24 mEq/L.
Gout
In individuals not taking allopurinol or febuxostat, males had a higher mean serum urate level than women (9.4±2.7 mg/dl vs. 7.7±1.6 mg/dl, p=0.02) and were more likely to have gout (49.3% vs. 39.5%, p<0.01).
Renin levels
Plasma renin levels were low, with the mean random plasma renin activity (normal range 2.9 to 24 ng/mL/h) in the signal group 0.5±0.8 ng/ml/h (n=18), in the prosegment group 0.5±0.6 ng/ml/h (n=4), and in the mature group 0.8±0.7 ng/ml/h (n=5).
Fludrocortisone
Fludrocortisone was administered to two patients consistently and in seven patients for a short period of time. There were no adverse effects from fludrocortisone. In one patient, it was taken consistently from age 11 onwards, and in another patient from age 13 (Figure 5). The serum potassium values were lower in nine individuals while taking vs. not taking fludrocortisone (4.37±0.54 mEq/L vs 4.77±0.55 mEq/L, p< 0.01). The serum bicarbonate values were also higher (25.9±2.3 mEq/L vs. 23.7±3.5 mEq/L, p=0.003).
Figure 5. ADTKD-REN treatment with fludrocortisone.
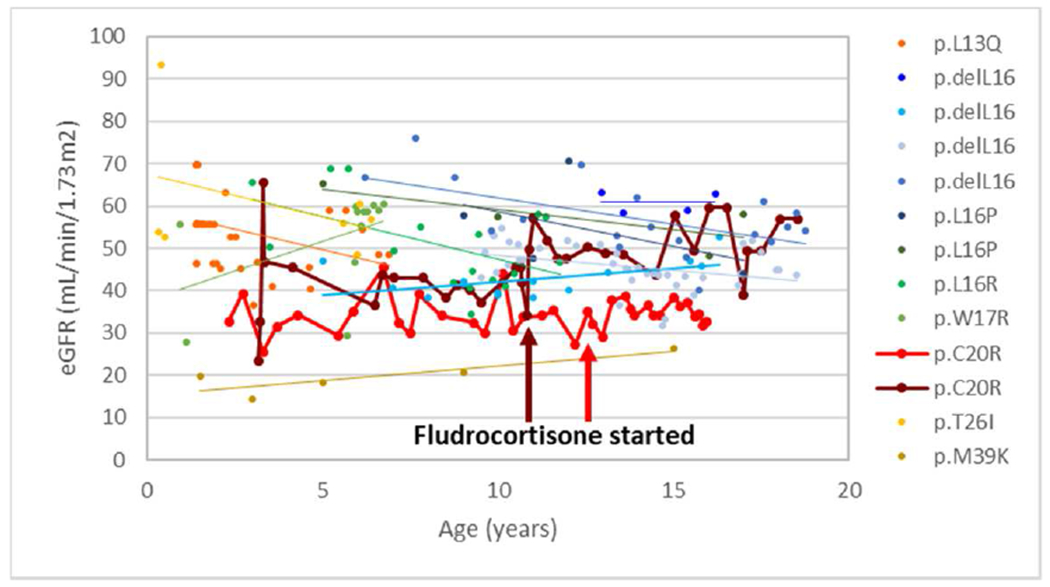
This figure includes 13 young patients in signal (n=11) and prosegment groups (n=2) with mutations are listed in the legend. The patient denoted with burgundy markers began fludrocortisone age 11, with an increase in eGFR that was sustained. The patient denoted with red markers started fludrocortisone at age 13.
In silico analysis
Figure 6A displays the REN mutations identified in ADTKD families. Except for the p.T26I and the non-pathogenic p.S45N, all amino acid residues at mutation sites are absolutely conserved across species (Figure 6B). SignalP 4.1 prediction software (19) indicates that all signal peptide mutations except p.C20R decrease the cleavage site prediction scores (C-score) (Figure 6C), suggesting a decrease in the efficacy of the signal peptidase mediated release of the signal peptide from preprorenin. Scores for the AA_REN p.P8A variant are similar to wild type (Figure 6C). The mutations in the prosegment, including the AA_REN variant p.R33W, are classified by the M-CAP pathogenicity classifier (20) as either likely benign (p.T26I, p.M39K and p.S45N (non-pathogenic)) or possibly pathogenic (p.R33W). Mutations in mature renin (p.C325R, p.I366N) are classified as possibly pathogenic (Figure 6D).
Figure 6. In silico analysis of REN variants.
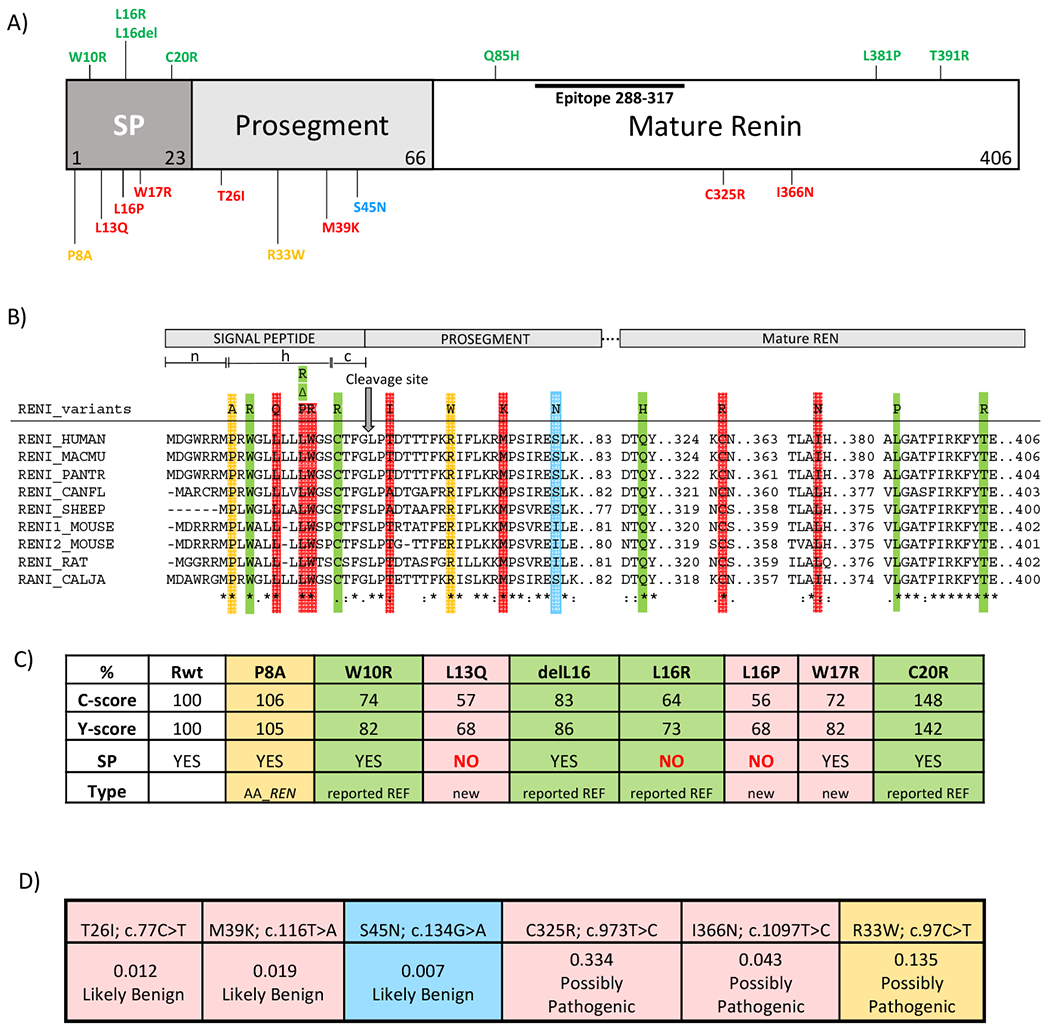
(A) Preprorenin, a precursor of prorenin and renin, consists of : i) the signal peptide (SP) essential for targeting and insertion of the synthesized protein into the endoplasmic reticulum membrane, ii) the prosegment that determines the biosynthesis, cellular trafficking and enzymatic activity and iii) the mature enzymatically active renin that is formed upon the proteolytic cleavage of prorenin. Novel pathogenic mutations identified and characterized in this study are shown in red. Previously reported dominant mutations associated with ADTKD are shown in green. The p.S45N is considered nonpathogenic and is shown in blue. Variants of unknown significance identified in African-American variants are shown in yellow. Epitope 288-377 denotes the protein segment recognized by the anti-preprorenin antibody used in this study. The n, h and c regions respectively denote stretches of positively charged amino acids (n-region), hydrophobic amino acids (h-region) essential for targeting and insertion of the signal peptide into ER membrane, and polar amino acids (c-region), forming a recognition site for the signal peptidase that releases translocated preproprotein from its ER membrane-anchored signal peptide. (B) Amino acids conservation across mutated segments of REN in higher mammals. Asterisks (*) indicate amino acid residues that are absolutely conserved, a colon (:) indicates residues with strong conservation and a dot (.) indicate residues with weak conservation between species. (C) Computational prediction by the SignalP 4.1 server of the impact of missense REN mutations located in the signal peptide on the conformation of the signal peptide cleavage site location (C-score) and on the sequence characteristics of the signal peptide (Y-score). SP denotes presence (YES/NO) of the signal peptidase cleavage site within the given sequence. The first 60 N-terminal amino acids of REN were used for this calculation. (D) Computational prediction by Mendelian Clinically Applicable Pathogenicity Score (M-CAP) of the pathogenicity of missense REN mutations located in the propeptide and mature renin.
All mutations have significant effects on prorenin structure (Figure 7) and may modulate renin activity by affecting the folding, constitutive secretion and proteolytic processing of prorenin (21–23).
Figure 7. Structural topology and impact of prosegment and renin mutations.
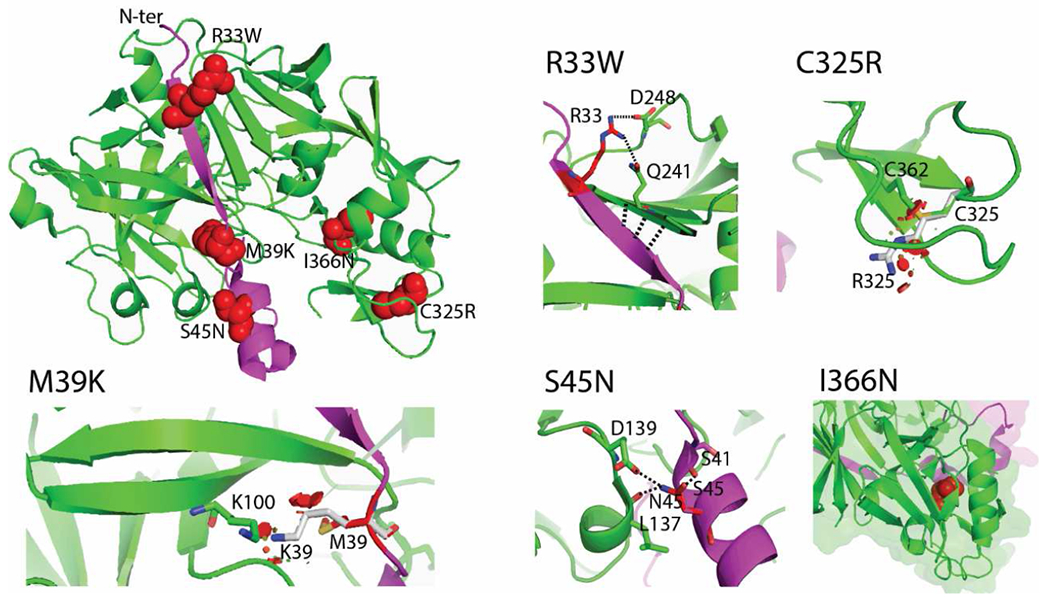
The crystal structure of prorenin (PDB ID 3VCM) was used for modelling. The prorenin segment (amino acid residues 24-66) and the renin core (amino acid residues 67-406) are colored in magenta and green, respectively. The location of mutated residues is shown in the full structural model using red spheres. The effects of each mutation are illustrated in detail at individual images. Mutated residues and their interactions are highlighted as sticks and dashed lines. The mutation p.R33W loses polar contacts with p.Q241 and p.D248. Possible compensatory interactions between the proximal two beta-sheets are highlighted as three dashed lines. These changes decrease affinity between prorenin and renin. The mutation p.M39K causes steric clashes and charge repulsion with K100, resulting in decreased affinity between prorenin and renin. The nonpathogenic mutation p.S45N changes the interaction network, with p.S45 interacting with p.S41, while p.N45 interacts with p.L137 and p.D139. These changes increase affinity due to a changed interaction network. The mutation p.C325R disrupts a disulfide bridge (highlighted as sticks), and incorporation of the arginine residue causes steric clashes (shown as red areas). The mutation p.I366Nresults in the loss of hydrophobic contacts (shown by red spheres) in the renin core.
Functional studies of identified REN variants
Wild type and mutant proteins were transiently expressed in HEK293 cells (Figure 8). Western blot and immuno-detection of corresponding proteins showed that the wild type protein was present in the cell lysate in three major forms (Figure 8A) corresponding to preprorenin (45 kDa), prorenin (47 kDa) and renin (43 kDa), with the preprorenin being less abundant. In the culture media (Figure 8B), only prorenin was detected. Except for the p.L16del mutation that allows partial translocation, processing and secretion, proteins with other mutations in the signal peptide were present in cell lysates mostly in the form of preprorenin, with no prorenin or renin detected in culture media. Proteins with mutations p.T26I and p.M39K in the prosegment were present in cell lysates in all three forms similar to the wild type protein, whereas the nonpathogenic p.S45N was present mostly in the form of prorenin. Prosegment mutations affected secretion of p.M39K prorenin into culture media; however, secretion of p.T26I and p.S45N was unaffected. Proteins with mutations in the mature renin were present in cell lysate predominantly as prorenin and were not secreted into culture media. Proteins with AA_REN variants in the signal peptide (p.P8A) or prosegment (p.R33W), showed similar profiles to wild type protein in cell lysates. The mutation p.R33W affected secretion of prorenin into culture media (Figure 8A, B). Quantitative immunoradiometric assay (Figure 8E, F) showed that mutations in the signal peptide either significantly reduced (p.L16del) or entirely prevented renin and prorenin synthesis in cells and their secretion into culture media. Mutations in the prosegment had either no effect or a marginal effect (p.M39K) on renin and prorenin synthesis, but affected secretion of p.T26I and p.M39K into culture media. Secretion of nonpathogenic p.S45N was unaffected. Mutations in the mature renin led to the synthesis of prorenin and renin that were either inactive or undetectable by the antibody used in the assay. The AA_REN variant p.P8A had no effect on renin and prorenin synthesis in cells and secretion of prorenin and renin into the culture media. For the AA_REN variant p.R33W, there was reduced secretion of prorenin into the culture media (Figure 8C, D). Proteolytic activity assay showed that mutations in the signal peptide either reduced (p.L16del) or entirely abolished renin activity in culture media. Mutations in the prosegment led either to a production of proteolytically “hyperactive” prorenin (p.M39K) or reduced the activity of renin in the culture media (p.T26I, p.S45N). Mutations in the mature renin abolished production of active renin. The AA_REN variant p.P8A had no effect on the proteolytic activity of secreted renin and prorenin. The AA_REN variant p.R33W reduced renin activity via low prorenin secretion (Figure 8E, F). Mutated proteins had altered intracellular localization (Figure 9, Supplementary Figures S3, 4A). Wild type protein was present in coarsely granular structures that were localized in the cytoplasm and in the LAMP2 positive lysosomal-like structures. Proteins with signal peptide mutations demonstrated mostly diffuse cytoplasmic staining. Proteins with prosegment mutations were localized mainly to endoplasmic reticulum intermediate compartment (ERGIC). Proteins with mutations in the mature renin formed intracellular clumps localized in the ER (Figures 9, Supplementary Figures S4, S5). There was little renin staining in the Golgi apparatus for wild-type and REN mutations (Supplementary Figure S6). Wild type protein and proteins with prosegment mutations were localized in lysosomes whereas proteins with signal peptide mutations (except of p.L16del) and proteins with mutations in the mature renin were not (Supplementary Figure S7). All functional data are summarized in Table 5.
Figure 8. Transient expression and functional characterization of REN variants in Human Embryonic Kidney 293 cells.
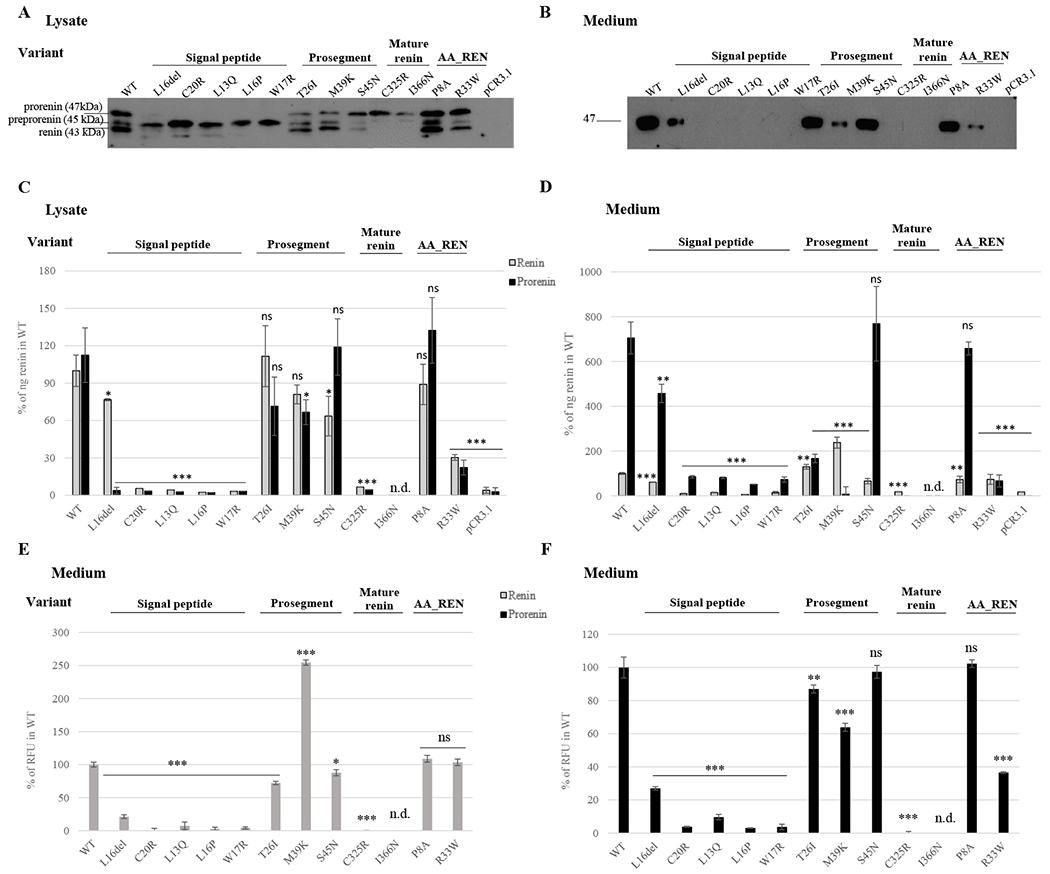
The wild type renin (WT); signal peptide, prosegment and mature renin mutations; African-American (AA_REN) variants and empty vector were analyzed. (A, B) Western blot analysis of (A) cell lysates and (B) culture media. Molecular weights of immuno-reactive proteins present in the WT lysates correspond with expected molecular weights of prorenin (47 kDa), preprorenin (45 kDa) and renin (43 kDa). (C, D) Immunoradiometric assay (IRMA) of prorenin and renin amounts in (C) cell lysates and (D) culture media employing a radio-labeled antibody that specifically recognizes active site of renin. The concentration of prorenin was calculated as the difference between the renin concentration measured before and after trypsin treatment, which activates renin by proteolytic cleavage of the prosegment from prorenin. Amounts of mutated renin (grey bars) and prorenin (black bars) were normalized to the amount of wild type renin. The values represent means ± SD. Measurements were performed in three independent clones for each of the constructs. The individual measurements were carried out in triplicate. The statistical significance of the differences between the WT and renin variants protein amounts was tested by t test. *p < 0.05; **p > 0.01; ***p > 0.001; n.d. not done. (E, F) Enzymatic activity of (E) mature renin secreted into culture media and (F) prorenin secreted into culture media. The values were normalized to the WT (100%) and represent means ± SD of relative fluorescent unit (RFU) generated by renin mediated cleavage of the 5-FAM and QXL520 conjugated renin substrate. Measurements were performed in three independent clones for each of the constructs. The individual measurements were carried out in triplicate. The statistical significance of the differences between activity of the wild type renin (WT) and renin variants was tested by t test. *p < 0.05; **p > 0.01; ***p > 0.001; n.d. not done.
Figure 9. Transient expression and intracellular localization of transiently expressed mutated preprorenin, prorenin and renin in Human Embryonic Kidney 293 cells.
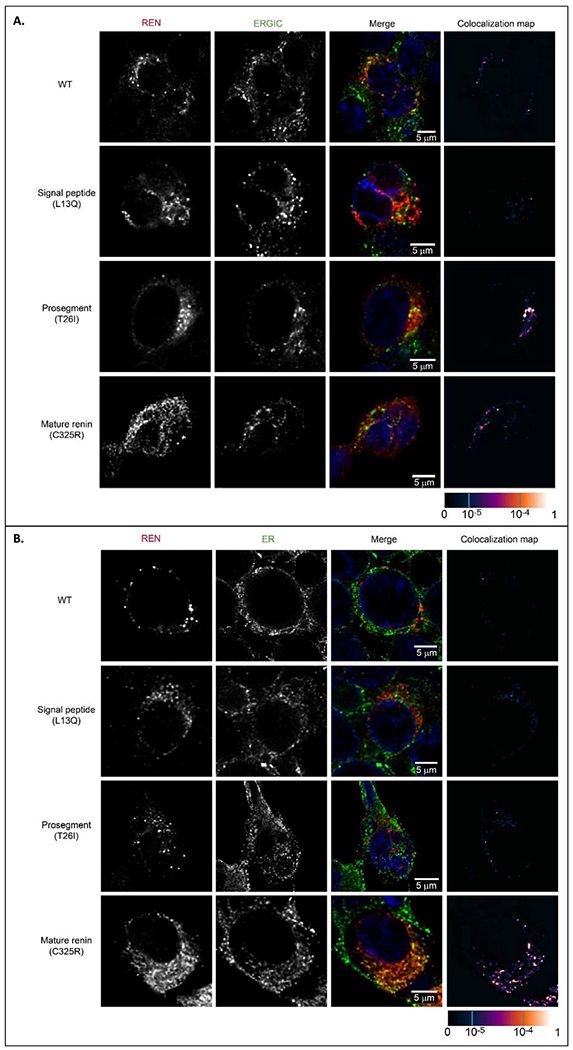
(A) Preprorenin, prorenin and renin were detected using an antibody recognizing the epitope 288-317 of preprorenin and co-localized with a marker of endoplasmic reticulum intermediate compartment (ERGIC53); wild type protein was present in coarsely granular structures that were localized exclusively in the cytoplasm. Proteins with signal peptide mutations (represented here by the p.L13Q mutation) demonstrated intense diffuse cytoplasmic staining; (for detailed renin staining see Supplementary Figure S3). Proteins with prosegment mutations (represented here by the p.T26I mutation) demonstrated a less distinct and diffuse pattern localized mainly to ERGIC. Mutations in mature renin part (represented here by the p.C325R mutation) demonstrated a less distinct and more diffuse pattern . For renin and ERGIC staining of other mutations, see Supplementary Figure S4A and S5. (B) Co-staining of renin with protein disulphide isomerase (PDI), a marker of endoplasmic reticulum (ER) demonstrating localization of mature renin mutations (represented here by the p.C325R mutation) in the ER. For renin and ER staining of other mature renin mutations, see Supplementary Figure S4B. The degree of renin colocalization with selected markers is demonstrated by the fluorescent signal overlap coefficient values that ranging from 0-1. The resulting overlap coefficient values are presented as the pseudo color which scale is shown in corresponding lookup table.
Table 5.
REN mutations; a summary of in vitro characteristics
| Cell lyzate | Culturing medium | Cellular localization | |||||||||||
|---|---|---|---|---|---|---|---|---|---|---|---|---|---|
| Localization of the mutation | Preprorenin (WB) | Prorenin (WB) IRMA % of wild type renin | Renin (WB) IRMA % of wild type) | Prorenin / Renin ratio | Prorenin (WB) | Renin (WB) | Prorenin IRMA assay % of wild type renin | Renin IRMA assay % of wild type renin | Prorenin / Renin ratio | Prorenin activity % of wild type renin | Renin activity % of wild type renin | Prorenin / Renin ratio | Immunofluorescence using anti-human preprorenin 288-317 antibody detecting preprorenin + prorenin + renin |
| wild type protein | + | + 112±19 |
+ 100±13 |
1.1 | + | − | 705±71 | 100±4 | 7.5 | 100±6 | 100±4 | 1 | Coarsely granular structures in cytoplasm and lysosomes |
| signal peptide del16L | + | + 4±3 |
+ 77±1 |
0.1 | + | − | 457±41 | 61±1 | 7.5 | 27±1 | 21±3 | 1.3 | Less distinct granular structures in cytoplasm and lysosomes |
| signal peptide missense | + |
− 2-3 |
− 2-6 |
0 | − | − | 51-85 | 7-15 | 0 | 3-10 | 0-7 | 0 | Diffuse cytoplasmic staining |
| prosegment T26I | + | + 72 |
+ 112 |
0.6 | + | − | 167±19 | 130±11 | 1.3 | 87 | 72 | 1.2 | |
| prosegment M39K | + | + 67 |
+ 81 |
0.8 | + | − | 7±33 | 238±24 | 0.03 | 64 | 255 | 0.25 | Less distinct granular structures in cytoplasm and lysosomes with diffuse staining localized partly to ERGIC |
| prosegment VUS_S45N | + | + 119±23 |
+ 64 ±16 |
1.9 | + | − | 768±170 | 66±12 | 11.6 | 97±4 | 88±5 | 1.1 | |
| mature renin C325R | − | + 5 |
+ 7 |
0 | − | − | 0 | 0 | 0 | 0.1±0.1 | 0 | 0 | Intracellular clumps localized to ER |
| AA variants | |||||||||||||
| signal peptide P8A | + | + 132±26 |
+ 89±16 |
1.5 | + | − | 658±29 | 73±14 | 9 | 102±2 | 109±5 | 0.9 | Similar to wild type |
| prosegment R33W | + | + 22±6 |
+ 30±3 |
0.7 | + | − | 67±7 | 74±22 | 0.9 | 37±1 | 103±5 | 0.4 | More diffuse pattern localized to ERGIC |
Gray-shaded values are those significantly different from the wild type.
DISCUSSION
In this work we describe distinct clinical and pathophysiologic differences (Figure 10) in signal, prosegment, and mature peptide mutations of the REN gene in a cohort of 111 patients from 30 families with ADTKD-REN.
Figure 10. Pathophysiology of ADTKD-REN.
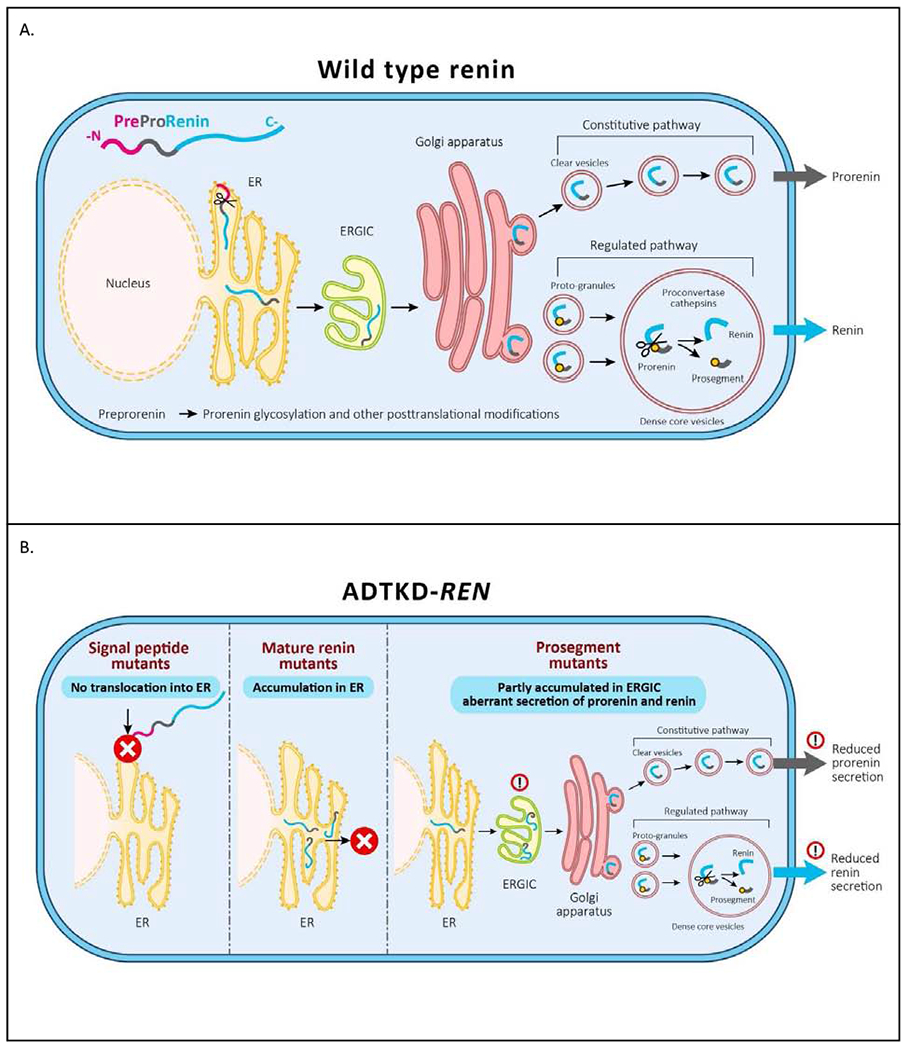
(A) Wild type preprorenin is cotranslationally translocated into the ER. The signal sequence is cleaved during translocation, and nascent prorenin is glycosylated. Prorenin then transits through the ER-Golgi Intermediate Compartment (ERGIC), which monitors proper protein folding and detects aberrant protein forms. In the Golgi apparatus prorenin is both sorted to clear vesicles and constitutively secreted to proto-granules, where it is proteolytically processed to renin, which is later subjected to regulated secretion. (B) Mutations in the signal peptide prevent translocation across the ER membrane and the preprorenin is aberrantly located in the cytoplasm. This results in clinical renin deficiency and ER stress in renin producing cells. Mutations in the mature renin lead to retention of mutated protein in ER. This initiates ER stress similar to that seen in UMOD mutations and uromodulin retention in ADTKD-UMOD. Mutations in the prosegment introduce structural changes affecting protein biosynthesis, folding and travel along the secretory pathway causing clinical renin deficiency and potentially also cellular toxicity leading to chronic kidney disease.
Patients with mutations in the signal peptide region were the most severely affected. One-third presented before age 10, with 10% having acute kidney injury and 13% presenting with anemia, acidosis, and kidney failure. The mean age of presentation was lower than in the other two groups (19.7±15.7 years vs. 22.4±20.2 years and 37.0±12.4 years). We demonstrated that transiently expressed proteins with mutations in the signal peptide lead to proteosynthesis of preprorenin that, according to immunofluorescence studies, is probably located in the cytoplasm or faces the cytoplasmic side of the ER or ERGIC membranes. This phenomena has previously been described in a case of signal peptide mutations of preproinsulin leading to β cell failure and autosomal dominant diabetes (24, 25) and in a mutation in the preproparathyroid hormone (PTH) gene resulting in familial isolated hypoparathyroidism (26). The effects of aberrant renin production not only resulted in manifestations of clinical renin deficiency but likely also affected normal renal embryogenesis, resulting in decreased kidney function at birth. The presence of significantly decreased renin activity in the setting of a heterozygous mutation is likely due to the mutated protein blocking the translocon and affecting synthesis of functional renin from the wild-type allele, a phenomenon that has been observed in ADTKD caused by mutations of Translocon Subunit Alpha 1 (SEC61A1) (4) or in preproinsulin signal peptide mutations, resulting in permanent neonatal diabetes, despite the presence of a wild-type insulin allele (27).
61% of individuals in the prosegment group presented at less than 10 years (61%), often presenting with gout (36%) and anemia (50%). The prosegment (propeptide) is a structural element that determines the biosynthesis, cellular trafficking and function of most proteases (28), including prorenin (21–23). Mutations in the prosegment leading to dominant phenotypes have been reported in several other preproteins, including proinsulin (leading to diabetes) (29) and factor IX deficiency (haemophilia) (30). The prosegment mutations in prorenin described here are classified as likely benign by various pathogenicity prediction programmes. However, based on structural studies, they are predicted to change interactions of the prosegment region with renin that are critical for the maintenance of the protease in its inactive state [24]. Accordingly, we demonstrated that mutations in the prosegment do not significantly affect the amounts of synthesized prorenin and renin, but rather they alter secretion and enzyme activity regulating properties of the prosegment as demonstrated by altered proportions of synthesized, enzymatically active renin and prorenin (Table 5). This altered proportion may also reflect the effect of prosegment mutations on trafficking through the intracellular vesicular network, within which processing of prorenin to renin occurs. Such an effect is suggested by specific accumulation of proteins with prosegment mutations (compared to other REN mutations) in the ER-Golgi intermediate compartment (ERGIC), where the quality control system of the early secretory pathway and the concentration process of nascent secretory proteins into secretory granules take place (31). The age of presentation and severity of prosegment mutations may vary significantly due to the type of mutation and its specific effects on biosynthesis, cellular trafficking and proteolytic processing of prorenin and renin activity regulation. In addition to causing cellular toxicity, these dominant negative effects may be due to abnormal interactions between the mutant and wild-type proteins that are being processed in parallel, as seen in early onset insulin-deficient diabetes (32). The non-pathogenic p.S45N variant showed normal in vitro scores and normal (actually increased) enzyme activity. Accumulation in the ERGIC however suggests that the p.S45N mutation affects protein trafficking and could potentially lead to late-onset CKD.
Mutations in the genetic region encoding the mature renin peptide had a much milder course compared to patients with mutations in the region encoding the signal peptide or preprorenin, as first noted by Schaeffer in a case report of a family with the p.L381P REN mutation (11). In contrast to patients in the signal and prosegment group who often present in childhood, patients in the mature group first present in their twenties with gout or present later in life with unexplained CKD. These patients appear to have normal kidney function early in life. Whether individuals in the mature group had anemia in childhood is unclear, but if present it was asymptomatic in the patients in our cohort. While patients in this group presented later and had a higher mean age of ESKD, they appeared to have a faster rate of eGFR decline in adulthood (Figure 1B) than the other two groups. This finding may have been related to the small sample size, fewer measurements of eGFR earlier in life, and/or case ascertainment bias. Two mutations in mature renin were studied in vitro. These mutations destabilize renin structure and produce an enzymatically inactive prorenin that is trapped within the ER, similar to the mature REN mutation p.L381P (11). The localization of the mutated mature renin protein and pathophysiologic changes are very similar to changes found in ADTKD due to UMOD mutations, and the two conditions are quite similar clinically. Better clinical outcomes in the mature group may be due to decreased cellular toxicity of the mature renin mutations and decreased effects on cellular processing of the wild-type renin produced by the normal allele, similar to mutations in the mature insulin peptide found in diabetes mellitus, with onset of symptoms in adulthood (33–35).
REN mutations identified in African-Americans
We also evaluated two missense REN variants of unknown significance, p.P8A and p.R33W, which are located in the signal peptide and prosegment of preprorenin and are present in relatively high frequencies in African-Americans. Individuals of African descent show a higher prevalence of low renin hypertension and ESKD (18), and we were interested to evaluate their functional impact. Our analyses demonstrated that whereas the p.P8A variant has no effect, the p.R33W variant has altered properties that are very similar to other ADTKD-REN prosegment mutations. With population frequencies of 0.001 the p.R33W may thus represent a genetic factor contributing to heritability of low circulating plasma renin and CKD in a small group of African-Americans. We were unable to recruit and study any individuals with the p.R33W mutation, who could have mild hyperkalemia, gout, and CKD with aging.
While this is the largest study of patients with ADTKD-REN, the small number of participants still limited our ability to assess the effects of fludrocortisone. Moreover, data was limited in teenage males and patients in the mature group. As the study was retrospective and these individuals were asymptomatic, there was no need for clinicians to perform laboratory studies earlier in life. We are interested in adding further families to our registry in order to improve clinical characterization, and we would appreciate information on other families with this disorder (please contact ableyer@wakehealth.edu).
In summary, families with ADTKD-REN can be divided into three groups. Patients with mutations in the region encoding the mature peptide present with gout in early adulthood or CKD later in life. Their course is milder than in patients with mutations in the regions encoding the signal peptide and prosegment. In these latter two groups, kidney function appears to be decreased starting from birth in many patients but remains stable through early adulthood. Anemia, hyperkalemia, and acidosis are frequently present, with acidosis being inadequately treated in a number of patients. Fludrocortisone raises eGFR, lowers serum potassium, and improves serum bicarbonate, but only a few patients received treatment with this medication, limiting our abilities to understand advantages and disadvantages of treatment.
METHODS
This investigation was approved by the institutional review boards of the participating centers and was carried out in accordance with the Declaration of Helsinki.
Identification of cases
Between January 1, 2019 and February 29, 2020, the literature was reviewed for families reported with heterozygous REN mutations, and the authors were contacted for additional information regarding affected patients. Academic centers with an interest in ADTKD were contacted and asked to provide clinical and genetic data from families with ADTKD-REN that had not been reported (Supplementary Figure S1). Investigators were asked to provide the following information for each individual from birth through February 29, 2020: mutation, age and reason for presentation, all hemoglobin values and use of erythropoietin, all serum electrolyte, uric acid, blood urea nitrogen and creatinine values, the age of onset of ESKD, and the use of fludrocortisone, allopurinol, or alkali supplementation. These mutations were not present in the Genome Aggregation Database (36) and segregated with disease in affected families, with the exception of p.S45N, which was found not to segregate with disease in the one family found to have this mutation.
Genetic evaluation
REN mutations were identified using either Sanger sequencing of individual REN exons, panel sequencing or whole exome sequencing essentially as described (4, 5).
Calculation of estimated glomerular filtration rate
The estimated glomerular filtration rate (eGFR) was determined using the Pottel equation (37). This equation takes into account age, gender, and serum creatinine values. It was specifically chosen because it has been shown to be accurate in all age groups and allows for a continued comparison of data from childhood into adulthood (37), a critical period of analysis in this cohort.
Statistical analysis
Statistical analysis was carried out using SAS statistical software (Cary, NC), using standard analytical tests such as the T-test, Chi-squared test, multivariate regression, and Cox proportional hazards regression. For comparison of laboratory values (including serum potassium, uric acid, hemoglobin, and bicarbonate), the mean values for each patient were determined and compared with the mean values of other patients. This analysis was chosen to maximize the use of data while also controlling for an increased number of measurements for some individuals.
In silico analysis
Properties of the signal sequences were assessed as described (5, 6). Mutations were mapped into the prorenin structure (PDB ID 3VCM). Structural models were visualized using Pymol Viewer (DeLano Scientific Palo Alto, CA, USA).
Transient expression of preprorenin in HEK293 cells
Wild type REN cloned into pCR3.1 a eukaryotic expression vector was used and corresponding mutated constructs were prepared by site-directed mutagenesis as in our previous study (5, 6). Transfection, qualitative and quantitative assays and immunofluorescence analysis of renin were performed as described in (5, 6) and in Supplementary methods.
Supplementary Material
Supplementary Table
Table S1. Clinical Characteristics of each ADTKD-REN mutation by Preprorenin Domain
Supplementary Figures
Figure S1. Flow diagram of the ADTKD-REN International Cohort
Figure S2. Representative family trees from 3 families with dominant REN mutations
Figure S3. Intracellular localization of transiently expressed mutated preprorenin, prorenin and renin in Human Embryonic Kidney 293 cells
Figure S4. Transient expression and intracellular localization of transiently expressed mutated preprorenin, prorenin and renin in Human Embryonic Kidney 293 cells.
Figure S5. Colocalization of transiently expressed mutated preprorenin, prorenin and renin in ERGIC of Human Embryonic Kidney 293 cells
Figure S6. Localization of transiently expressed mutated preprorenin, prorenin and renin in Golgi apparatus of Human Embryonic Kidney 293 cells
Figure S7. Localization of transiently expressed mutated preprorenin, prorenin and renin in lysosomes of Human Embryonic Kidney 293 cells
Supplementary Methods
Transient expression of preprorenin in HEK293 cells
Western blot analysis
Quantitative analysis of renin and prorenin by immunoradiometric assay (IRMA)
Measurement of the enzymatic activity of renin secreted into the culture media
Confocal microscopy
Image acquisition and analysis
Supplementary References
ACKNOWLEDGEMENTS
We thank all participating patients and families, and the referring physicians. We thank Dr. Heike Göbel (Institute of Pathology, University Hospital of Cologne, Cologne, Germany) and Dr. Helmut Hopfer (Institute of Pathology, University Hospital Basel, Basel, Switzerland) for providing renal sections. This study was supported by grant NV17-29786A from the Ministry of Health of the Czech Republic and by institutional programs of Charles University in Prague (UNCE/MED/007 and PROGRES-Q26/LF1). The National Center for Medical Genomics (LM2018132) kindly provided sequencing and genotyping. AJB was funded by the Slim Health Foundation, the Black-Brogan Foundation, and NIH-NIDDK R21 DK106584. KT was supported by MTA-SE Lendulet Research Grant (LP2015-11/2015). JAS is supported by Kidney Research UK and the Northern Counties Kidney Research Fund. BBB and AW were supported by intramural grants from the Koeln Fortune Program/Faculty of Medicine (grant KF Nr 245/2011, grant KF Nr 172/2013, and grant KF 472/18), University of Cologne, Germany. LR was supported by the Italian Society of Nephrology (SIN) under the “Adotta un progetto di ricerca” program, Telethon-Italy (GGP14263); the Italian Ministry of Health (grant RF-2010-2319394), Soli Deo Gloria. MTFW received grants from NIH/NIDDK, grants from Children’s Health Dallas, grants from Department of Defense, during this study.
Footnotes
Publisher's Disclaimer: This is a PDF file of an article that has undergone enhancements after acceptance, such as the addition of a cover page and metadata, and formatting for readability, but it is not yet the definitive version of record. This version will undergo additional copyediting, typesetting and review before it is published in its final form, but we are providing this version to give early visibility of the article. Please note that, during the production process, errors may be discovered which could affect the content, and all legal disclaimers that apply to the journal pertain.
DISCLOSURE STATEMENT
Authors have nothing to disclose.
REFERENCES
- 1.Devuyst O, Olinger E, Weber S, et al. Autosomal dominant tubulointerstitial kidney disease. Nat Rev Dis Primers. 2019;5:60. [DOI] [PubMed] [Google Scholar]
- 2.Hart TC, Gorry MC, Hart PS, et al. Mutations of the UMOD gene are responsible for medullary cystic kidney disease 2 and familial juvenile hyperuricaemic nephropathy. J Med Genet. 2002;39:882–892. [DOI] [PMC free article] [PubMed] [Google Scholar]
- 3.Kirby A, Gnirke A, Jaffe DB, et al. Mutations causing medullary cystic kidney disease type 1 lie in a large VNTR in MUC1 missed by massively parallel sequencing. Nat Genet. 2013;45:288–393. [DOI] [PMC free article] [PubMed] [Google Scholar]
- 4.Bolar NA, Golzio C, Zivna M, et al. Heterozygous Loss-of-Function SEC61A1 Mutations Cause Autosomal-Dominant Tubulo-Interstitial and Glomerulocystic Kidney Disease with Anemia. Am J Hum Genet. 2016;99:174–187. [DOI] [PMC free article] [PubMed] [Google Scholar]
- 5.Zivna M, Hulkova H, Marignon M, et al. Dominant renin gene mutations associated with early-onset hyperuricemia, anemia, and CKD. Am J Human Genet. 2009;85:204–213. [DOI] [PMC free article] [PubMed] [Google Scholar]
- 6.Bleyer AJ, Zivna M, Hulkova H, et al. Clinical and molecular characterization of a family with a dominant renin gene mutation and response to treatment with fludrocortisone. Clin Nephrol. 2010;74:411–422. [DOI] [PMC free article] [PubMed] [Google Scholar]
- 7.Beck BB, Trachtman H, Gitman M, et al. Autosomal dominant mutation in the signal peptide of renin in a kindred with anemia, hyperuricemia, and CKD. Am J Kidney Dis. 2011;58:821–825. [DOI] [PMC free article] [PubMed] [Google Scholar]
- 8.Clissold RL, Clarke HC, Spasic-Boskovic O, et al. Discovery of a novel dominant mutation in the REN gene after forty years of renal disease: a case report. BMC Nephrol. 2017;18:234. [DOI] [PMC free article] [PubMed] [Google Scholar]
- 9.Petrijan T, Menih M. Discovery of a Novel Mutation in the REN Gene in Patient With Chronic Progressive Kidney Disease of Unknown Etiology Presenting With Acute Spontaneous Carotid Artery Dissection. J Stroke Cerebrovasc Dis. 2019;28:104302. [DOI] [PubMed] [Google Scholar]
- 10.Abdelwahed M, Chaabouni Y, Michel-Calemard L, et al. A novel disease-causing mutation in the Renin gene in a Tunisian family with autosomal dominant tubulointerstitial kidney disease. Int J Biochem Cell Biol. 2019;117:105625. [DOI] [PubMed] [Google Scholar]
- 11.Schaeffer C, Izzi C, Vettori A, et al. Autosomal Dominant Tubulointerstitial Kidney Disease with Adult Onset due to a Novel Renin Mutation Mapping in the Mature Protein. Sci Rep. 2019;9:11601. [DOI] [PMC free article] [PubMed] [Google Scholar]
- 12.Gribouval O, Gonzales M, Neuhaus T, et al. Mutations in genes in the renin-angiotensin system are associated with autosomal recessive renal tubular dysgenesis. Nat Genet. 2005;37:964–968. [DOI] [PubMed] [Google Scholar]
- 13.Gomez RA, Sequiera-Lopez MLS. Renin cells in homeostasis, regeneration and immune defence mechanisms. Nat Rev Nephrol. 2018;14:231–245. [DOI] [PMC free article] [PubMed] [Google Scholar]
- 14.Pugliese NR, Masi S, Taddei S. The renin-angiotensin-aldosterone system: a crossroad from arterial hypertension to heart failure. Heart Fail Rev. 2020;25:31–42. [DOI] [PubMed] [Google Scholar]
- 15.Sparks MA, Crowley SD, Gurley SB, Mirotsou M, Coffman TM. Classical Renin-Angiotensis system in kidney physiology. Compr Physiol. 2014;4:1201–1228. [DOI] [PMC free article] [PubMed] [Google Scholar]
- 16.Imai T, Miyazaki H, Hirose S, et al. Cloning and sequence analysis of cDNA for human renin precursor. Proc Natl Acad Sci USA. 1983;80:7405–7409. [DOI] [PMC free article] [PubMed] [Google Scholar]
- 17.Schweda F, Friis U, Wagner C, et al. Renin release. Physiology (Bethesda). 2007;22:310–319. [DOI] [PubMed] [Google Scholar]
- 18.Sagnella GA. Why is plasma renin activity lower in populations of African origin? J Hum Hypertens. 2001;15:17–25. [DOI] [PubMed] [Google Scholar]
- 19.Petersen TN, Brunak S, von Heijne G, Nielsen H. SignalP 4.0: discriminating signal peptides from transmembrane regions. Nat Methods. 2011;8:785–786. [DOI] [PubMed] [Google Scholar]
- 20.Jagadeesh KA, Wenger AM, Berger MJ, et al. M-CAP eliminates a majority of variants of uncertain significance in clinical exomes at high sensitivity. Nat Genet. 2016;48:1581–1586. [DOI] [PubMed] [Google Scholar]
- 21.Nagahama M, Nakayama K, Hori H, Murakami K. Expression of a deletion mutant of the prosegment of human prorenin in Chinese hamster ovary cells. FEBS Lett. 1989;259:202–204. [DOI] [PubMed] [Google Scholar]
- 22.Nakayama K, Nagahama M, Kim WS, et al. Prorenin is sorted into the regulated secretory pathway independent of its processing to renin in mouse pituitary AtT-20 cells. FEBS Lett. 1989;257:89–92. [DOI] [PubMed] [Google Scholar]
- 23.Mercure C, Thibault G, Lussier-Cacan S, et al. Molecular analysis of human prorenin prosegment variants in vitro and in vivo. J Biol Chem. 1995;270:16355–16359. [DOI] [PubMed] [Google Scholar]
- 24.Guo H, Xiong Y, Witkowski P, et al. Inefficient translocation of preproinsulin contributes to pancreatic beta cell failure and late-onset diabetes. J Biol Chem. 2014;289:16290–16302. [DOI] [PMC free article] [PubMed] [Google Scholar]
- 25.Liu M, Lara-Lemus R, Shan SO, et al. Impaired cleavage of preproinsulin signal peptide linked to autosomal-dominant diabetes. Diabetes. 2012;61:828–837. [DOI] [PMC free article] [PubMed] [Google Scholar]
- 26.Arnold A, Horst SA, Gardella TJ, et al. Mutation of the signal peptide-encoding region of the preproparathyroid hormone gene in familial isolated hypoparathyroidism. J Clin Invest. 1990;86:1084–1087. [DOI] [PMC free article] [PubMed] [Google Scholar]
- 27.Hussain S, Mohd Ali J, Jalaludin MY, Harun F. Permanent neonatal diabetes due to a novel insulin signal peptide mutation. Pediatr Diabetes. 2013;14:299–303. [DOI] [PMC free article] [PubMed] [Google Scholar]
- 28.Demidyuk IV, Shubin AV, Gasanov EV, Kostrov SV. Propeptides as modulators of functional activity of proteases. Biomol Concepts. 2010;1:305–322. [DOI] [PubMed] [Google Scholar]
- 29.Weiss MA. Diabetes mellitus due to the toxic misfolding of proinsulin variants. FEBS Lett. 2013;587:1942–1950. [DOI] [PMC free article] [PubMed] [Google Scholar]
- 30.Bentley AK, Rees DJ, Rizza C, Brownlee GG. Defective propeptide processing of blood clotting factor IX caused by mutation of arginine to glutamine at position -4. Cell. 1986;45:343–348. [DOI] [PubMed] [Google Scholar]
- 31.Saraste J, Marie M. Intermediate compartment (IC): from pre-Golgi vacuoles to a semi-autonomous membrane system. Histochem Cell Biol. 2018;150:407–430. [DOI] [PMC free article] [PubMed] [Google Scholar]
- 32.Liu M, Sun J, Cui J, et al. INS-gene mutations: from genetics and beta cell biology to clinical disease. Mol Aspects Med. 2015;42:3–18. [DOI] [PMC free article] [PubMed] [Google Scholar]
- 33.Given BD, Mako ME, Tager HS, et al. Diabetes due to secretion of an abnormal insulin. N Engl J Med. 1980;302:129–135. [DOI] [PubMed] [Google Scholar]
- 34.Sakura H, Iwamoto Y, Sakamoto Y, et al. Structurally abnormal insulin in a diabetic patient. Characterization of the mutant insulin A3 (Val----Leu) isolated from the pancreas. J Clin Invest. 1986;78:1666–16672. [DOI] [PMC free article] [PubMed] [Google Scholar]
- 35.Shoelson S, Fickova M, Haneda M, et al. Identification of a mutant human insulin predicted to contain a serine-for-phenylalanine substitution. Proc Natl Acad Sci US . 1983;80:7390–7394. [DOI] [PMC free article] [PubMed] [Google Scholar]
- 36.Genome Aggregation Database [Available from: https://gnomad.broadinstitute.org/gene/ENSG00000143839?dataset=gnomad_r3.
- 37.Pottel H, Hoste L, Dubourg L, et al. An estimated glomerular filtration rate equation for the full age pectrum. Nephrol Dial Transplant. 2016;31:798–806. [DOI] [PMC free article] [PubMed] [Google Scholar]
Associated Data
This section collects any data citations, data availability statements, or supplementary materials included in this article.
Supplementary Materials
Supplementary Table
Table S1. Clinical Characteristics of each ADTKD-REN mutation by Preprorenin Domain
Supplementary Figures
Figure S1. Flow diagram of the ADTKD-REN International Cohort
Figure S2. Representative family trees from 3 families with dominant REN mutations
Figure S3. Intracellular localization of transiently expressed mutated preprorenin, prorenin and renin in Human Embryonic Kidney 293 cells
Figure S4. Transient expression and intracellular localization of transiently expressed mutated preprorenin, prorenin and renin in Human Embryonic Kidney 293 cells.
Figure S5. Colocalization of transiently expressed mutated preprorenin, prorenin and renin in ERGIC of Human Embryonic Kidney 293 cells
Figure S6. Localization of transiently expressed mutated preprorenin, prorenin and renin in Golgi apparatus of Human Embryonic Kidney 293 cells
Figure S7. Localization of transiently expressed mutated preprorenin, prorenin and renin in lysosomes of Human Embryonic Kidney 293 cells
Supplementary Methods
Transient expression of preprorenin in HEK293 cells
Western blot analysis
Quantitative analysis of renin and prorenin by immunoradiometric assay (IRMA)
Measurement of the enzymatic activity of renin secreted into the culture media
Confocal microscopy
Image acquisition and analysis
Supplementary References


