

Abstract
Pharmacological cardioversion of atrial fibrillation (AF) is frequently inefficacious. AP30663, a small conductance Ca2+ activated K+ (KCa2) channel blocker, prolonged the atrial effective refractory period in preclinical studies and subsequently converted AF into normal sinus rhythm. This first‐in‐human study evaluated the safety and tolerability, and pharmacokinetic (PK) and pharmacodynamic (PD) effects were explored. Forty‐seven healthy male volunteers (23.7 ± 3.0 years) received AP30663 intravenously in ascending doses. Due to infusion site reactions, changes to the formulation and administration were implemented in the latter 24 volunteers. Extractions from a 24‐hour continuous electrocardiogram were used to evaluate the PD effect of AP30663. Data were analyzed with a repeated measure analysis of covariance, noncompartmental analysis, and concentration‐effect analysis. In total, 33 of 34 adverse events considered related to AP30663 exposure were related to the infusion site, mild in severity, and temporary in nature, although full recovery took up to 110 days. After formulation and administration changes, the local infusion site reaction remained, but the median duration was shorter despite higher dose levels. AP30663 displayed a less than dose proportional increase in peak plasma concentration (Cmax) and a terminal half‐life of around 5 hours. In healthy volunteers, no effect of AP30663 was observed on electrocardiographic parameters, other than a concentration‐dependent effect on the corrected QT Fridericia’s formula interval (+18.8 ± 4.3 ms for the highest dose level compared with time matched placebo). In conclusion, administration of AP30663, a novel KCa2 channel inhibitor, was safe and well‐tolerated systemically in humans, supporting further development in patients with AF undergoing cardioversion.
Study Highlights.
WHAT IS THE CURRENT KNOWLEDGE ON THE TOPIC?
☑ Pharmacological cardioversion of atrial fibrillation (AF) is frequently inefficacious. However, Ca2+ activated K+ (KCa2) channel blockade may, in humans, prolong the atrial effective refractory period and be a novel pathway for conversion of AF.
WHAT QUESTION DID THIS STUDY ADDRESS?
☑ This first‐in‐human study evaluated the safety and tolerability of AP30663, a KCa2 channel blocker. Other objectives included evaluation of the pharmacokinetic profile of AP30663 and the effect of AP30663 on electrocardiographic parameters.
WHAT DOES THIS STUDY ADD TO OUR KNOWLEDGE?
☑ This study found that administration of AP30663, a novel KCa2 channel inhibitor, was safe and well‐tolerated systemically. AP30663 displayed a less than dose proportional increase in peak plasma concentration (Cmax) and induced a transient dose dependent QT Fridericia’s formula interval prolongation.
HOW MIGHT THIS CHANGE CLINICAL PHARMACOLOGY OR TRANSLATIONAL SCIENCE?
☑ Clinical development of AP30663 will be continued and the compound may in the future obtain a place as a pharmacological treatment for cardioversion of AF in patients.
Episodes of atrial fibrillation (AF) often convert spontaneously but can otherwise be converted to sinus rhythm by electrical or pharmacological treatment. Although electrical direct current cardioversion is generally considered highly effective, it is cumbersome because it requires anesthesia and is not available 24 hours a day in all hospitals. Pharmacological cardioversion is a tempting alternative, but current options are limited by lower efficacy compared with electrical treatment and by the fact that not all patients are eligible for treatment. 1
Several cardiac ion channels are targets for marketed antiarrhythmic drugs. Conventional class III antiarrhythmic drugs decrease repolarizing K+‐ currents and are effective for treatment of AF by a prolongation of the atrial effective refractory period, mostly through Kv11.1 channel, also known as human ether‐à‐go‐go‐related gene inhibition. However, this approach carries the caveat of concomitant prolongation of the action potential duration in ventricular myocardial tissue, which is proarrhythmic. 2 , 3 Therefore, ion channel targets that are selective for atrial tissue have been pursued.
One novel target for AF treatment is the KCa2 channel, also known as the small conductance Ca2+‐activated K+, or SK channel. 4 , 5 , 6 , 7 , 8 , 9 , 10 AP30663 is a first in class Ca2+ activated K+ (KCa2) channel inhibitor in development for conversion of AF into normal sinus rhythm and inhibits all three subclasses of KCa2 channels. Preclinical studies showed that the KCa2 channel inhibitor AP30663 can selectively increase atrial refractoriness, convert vernakalant‐resistant AF, and prevent its reinduction in conscious pigs while exerting little or no effect on the ventricular repolarization (unpublished data).
The present study reports the first administration of AP30663 into man. The primary objective of the study was to evaluate the safety and tolerability of AP30663 in healthy male subjects. Other objectives included evaluation of the pharmacokinetic (PK) profile of AP30663 and the effect of AP30663 on electrocardiographic parameters.
METHODS
The current study was conducted as a randomized, single ascending dose, double‐blind, placebo‐controlled phase I study in 47 healthy subjects. The study was conducted between January 2018 and September 2018 at the Centre for Human Drug Research, Leiden, The Netherlands. The Declaration of Helsinki was the principle for trial execution. The independent Medical Ethics Committee “Medisch Ethische Toetsingscommissie van de Stichting Beoordeling Ethiek Biomedisch Onderzoek” (Assen, The Netherlands) approved the study prior to any clinical study activity. All subjects provided written informed consent before participation.
Subjects
The main inclusion criteria were male subjects, generally healthy, 18–45 years of age, with a body mass index between 18 and 30 kg/m2, and absence of clinically significant abnormalities in the 12‐lead surface electrocardiogram (ECG). The health status was verified by a detailed medical history, a complete physical examination, vital signs, 12‐lead ECG, and laboratory testing (including hepatic and renal panels, complete blood count, virology, and urinalysis). Subjects were excluded in case of any use of prescription medication within 2 weeks prior to enrollment.
Study design and treatment
Subjects were enrolled in six cohorts, all consisting of eight subjects except for the first cohort which consisted of seven subjects after one of the subjects withdrew consent before AP30663 administration. The dose level of the first cohort was based on the no observed adverse event level in mini‐pigs and considering a safety margin of 10, leading to a dose level of 1 mg/kg. The dose levels for the subsequent cohorts were selected jointly between the clinical investigators and the sponsor based on blinded reports of safety, PK, and pharmacodynamic (PD) data. Within each cohort, subjects were randomized 6 vs. 2 (5 vs. 2 for cohort 1) to 30 minutes of intravenous administration of AP30663 or placebo. Placebo consisted of 0.9% NaCl solution. Two sentinel healthy subjects, of whom one received active treatment and one placebo, were studied in the first cohort followed by dosing of the remaining 5 after 48 hours. Table 1 describes the dose levels, dose volumes, and AP30663 concentrations that were administered.
Table 1.
Administered dose levels and adverse events considered related to AP30663 administration
| Dose level, mg/kg | Number of subjects | Mean administered volume per 30 minutes, mL | Number of subjects with AEs | Number of AEs | Number of infusion site AEs | Median duration | Severity |
|---|---|---|---|---|---|---|---|
| 1 | 5 | 12.4 ± 4.5 | 1 (20%) | 1 | 1 | >7 days a | Mild |
| 2 | 6 | 15.0 ± 1.5 | 4 (67%) | 4 | 4 | 12.5 hours | Mild |
| 2 | 6 | 33.3 ± 4.4 | 5 (83%) | 10 | 10 | 32 days | Mild |
|
1.5 2 |
3 3 |
96.8 ± 1.3 155.0 ± 20.2 |
1 (33%) | 3 | 3 | 26 hours | Mild |
|
3 4 |
3 3s |
242.7 ± 44.5 268.0 ± 9.3 |
1 (33%) | 2 | 2 | 13 days | Mild |
|
5 6 |
3 3 |
361.2 ± 23.6 411.5 ± 74 |
1 (33%) | 2 | 2 | 22 days | Mild |
| Placebo | 12 | N/A | 2 (66%) | 3 | 3 | 37 hours | Mild |
AE, adverse event.
Subject was lost to follow‐up after study discharge visit. AE was still ongoing at study discharge visit, 7 days after AP30663 administration.
Reconstitution procedure
The Leiden University Medical Center pharmacy performed the reconstitution for all administrations in this study. For the first 3 cohorts, sterile water was injected into the infusion bag, for the latter 3 cohorts, glucose 5% was injected. Subsequently AP30663 was injected into the infusion bag, which was reconstituted from a vial with a 200 mg/mL concentration. The injection of AP30663 into the infusion bag was performed slowly, and, at various timepoints in the reconstitution, checks were implemented to confirm no precipitation of AP30663 had occurred.
In the first three cohorts, infusion site reactions were observed, which were relieved after changes to the AP30663 formulation and study drug administration procedure. These changes were implemented in cohorts 4–6 and consisted of using 5% glucose solution for dilution instead of sterile water for infusion and a reduction in the concentration of the investigational product to 1 mg/mL. This also resulted in a larger volume to be administered and, thus, a higher infusion rate. An overview of the administered treatments can be found in Table 1 . Furthermore, the administration was performed with an 16G cannula compared with the initial 18G cannula, which was inserted in the largest antecubital vein that could be found. In cohorts 4–6, the cannula was flushed with 5 mL 5% glucose solution immediately after completion of the administration.
Assessments
Safety and tolerability were monitored by tracking adverse events (AEs), performing physical examinations, recording vital signs, 24‐hour Holter ECGs, and laboratory tests (i.e., full blood count, biochemistry, and urinalysis) at regular intervals. Serum concentrations of AP30663 for PKs were measured by Ardena Biochemical Laboratory (Assen, The Netherlands) using a validated bioanalytical assay. The PK concentrations were measured using liquid chromatography tandem mass spectrometry. The lower limit of quantification of the method was 5 ng/mL.
Tremorography
In the preclinical good laboratory practice safety‐toxicology studies, AP30663 induced tremor in minipigs at high dose levels (equivalent to 27.3 mg/kg in man). Therefore, tremorography measurements were implemented at predefined timepoints predosing and postdosing in order to detect any signs of tremor should they occur. The tremorography consisted of a three‐axis accelerometer (ACL300; Biometrics, Newport, UK; with DataLink900 base unit) that was taped to the middle part of the third ray on the dorsal side of the subject’s right hand. Subjects were instructed to extend their arm horizontally while in a semirecumbent position, with the dorsal side of the hand facing up. The measurements were recorded with the DataLink Management Software (Biometrics). Each of the three axes were bandpass filtered between 1 and 20 Hz using a zero‐phase third order Butterworth filter. After calculating the Power Spectrum Density for each axis, the L1‐norm was calculated. Then, the peak frequency and corresponding amplitude were used as read‐outs, as also described elsewhere. 12
Holter ECGs
Twenty‐four‐hour 12‐lead Holter ECGs were recorded in all volunteers, starting just before dose administration. An overview of the timepoints for the Holter ECG extractions and the PK sampling can be found in Table S1 . As can be observed from these timepoints, all PK samples were drawn after the ECG extraction was performed. At these set intervals, subjects were placed in a supine position for at least 8 minutes. In the latter 3 minutes, triplicate 12‐lead ECGs were extracted from the Holter ECG by Intermark Technology ECG Research BV (Someren, The Netherlands). The selection of ECG strips was performed so that an even distribution occurred within the 3‐minute time frame, and the quality of the ECGs was sufficiently high to perform the ECG measurements. A single certified operator, blinded for treatment and time, measured P wave duration, PR‐interval duration, QRS duration, QT interval duration, and RR interval duration using global median beat analysis in the Mortara E‐scribe environment. The QT interval duration was corrected for the RR interval with Fridericia’s formula (QTcF).
Additionally, a QT subinterval analysis was performed, as described by Johannesen et al. 12 The QT interval was split up into three subintervals: QRS duration, J‐point to T‐peak interval, corrected for heart rate (Jp‐Tpc), and T‐peak‐T‐end interval (Tp‐Tend). The correction of the Jp‐Tpc interval was performed using the formula proposed by Johannesen et al. 12 :
Statistics
Statistical analysis was performed using SAS for windows version 9.4 (SAS Institute, Cary, NC), noncompartmental analysis was performed using R for Windows version 3.4.4 (R Core Team, Vienna, Austria), and concentration‐QTcF and QT subinterval analysis were performed using NONMEM version 7.3 (ICON Development Solutions, Hanover, MD) and R for Windows version 3.5.1. Demographic and baseline variables were summarized by treatment. For safety and tolerability end points, summary statistics for observed values were calculated for all continuous parameters. For every AP30663 dose, noncompartmental analyses of PK data were performed. Data below the lower limit of quantification were set to zero if these occurred before time of maximum plasma concentration (Tmax), whereas after Tmax these were treated as missing. In case of missing actual times, the expected time of sampling was used. The elimination rate constant (lambdaz) and its derived parameters were excluded when they could not be accurately estimated (adjusted R‐square < 0.5, nonpositive value for lambdaz or < 3 data points after Tmax). PD end points measured at multiple timepoints postbaseline were analyzed with a mixed effect repeated measures model with treatment, time, and treatment by time as fixed factors, subject as random factor, and the baseline measurement as covariate. The Kenward–Roger approximation was used to estimate denominator degrees of freedom and model parameters were estimated using the restricted maximum likelihood method. The general treatment effect and specific contrasts were reported with the estimated difference and the 95% confidence interval, the least square mean estimates, and the P value. Graphs of the change from baseline least square mean estimates over time by treatment were presented with 95% confidence interval as error bars.
Concentration vs. QTcF and QT subinterval statistical analysis was performed using the following prespecified model 13
where ΔPDijk was the change from baseline (Δ) of QTcF, Jp‐Tpc, Tp‐Tend, or QRS for subject i in treatment j at time k; θ 0 was the population intercept; TRT was 1 for active and 0 for placebo; PDi,0 was the individual baseline value; was the overall mean of all baseline values; NTIM was the nominal (protocol) time as a factor; and θ 4 was the slope for the assumed linear relationship between AP30663 concentration (C) in plasma and ΔPD. The subject was included as additive random effect on intercept and slope. The adequacy of the prespecified direct effect linear model was evaluated prior to analysis using hysteresis plots and scatter plots of placebo‐corrected ΔPD (obtained by subtracting the mean of the placebo group at each protocol time from the mean ΔPD) vs. AP30663 concentration overlaid with Loess smooth line and linear regression line; and after analysis using goodness‐of‐fit plots and visual predictive checks. The final concentration‐effect models were used to compute the placebo‐corrected (Δ) ΔQTcF, ΔJp‐Tpc, ΔTp‐Tend, and ΔQRS at a range of concentrations and at the geometric mean peak plasma concentration (Cmax) for each dose level.
RESULTS
Forty‐seven healthy male subjects were enrolled in the study. All 6 cohorts consisted of 8 subjects, except for cohort 1, which consisted of 7 subjects after 1 of the subjects withdrew consent before AP30663 administration. All enrolled subjects completed the study and there were no discontinuations due to AEs. Baseline characteristics are displayed in Table S2 .
Safety and tolerability
Overall, AP30663 was safe and systemically well‐tolerated. No serious AEs occurred. Seventy‐three AEs occurred, 34 of which were considered related to AP30663 administration, in 30 of 47 subjects. Except for one myalgia AE, all AEs considered to be related to AP30663 were injection‐site reactions, were considered mild in intensity, and were temporary.
Thirty‐four AEs related to the administration site were observed in 19 subjects, of which 15 in 10 of 17 subjects (59%) were in cohorts 1–3 and 15 in 9 of 18 subjects (50%) were in cohorts 4–6, in which the changes in the administration procedure were implemented, and 4 AEs were in 2 of 11 subjects (17%) who received placebo treatment. The infusion site reactions consisted of a hardening of the vein where AP30663 was administered and redness and painfulness of the area. After the abovementioned changes to mitigate infusion site reactions were implemented to the administration procedure and formulation, the infusion site reactions were shorter in duration and milder in intensity, even though the doses that were administered were higher than used in cohorts 1–3, as can also be observed in Table 1 .
Notably, there were no symptoms or signs of engagement of the central nervous system. In addition, all tremorography recordings were normal and unchanged at all dose levels, with a mean amplitude of 0.2 mG2•Hz‐1, as is also depicted in Figure S1 . Note that this is nearly 200‐fold lower than in patients with Parkinson’s disease. 11
Pharmacokinetics
The PK profiles of AP30663 are displayed in Figure 1 . AP30663 was administered as a 30‐minute linear infusion, reflected in a median Tmax at 30 minutes. The mean clearance was 12.5 ± 3.2 L/h and tended to be higher for the three highest dose levels (15.9 L/h) as compared with the lower dose levels (11.5 L/h). Volume of distribution ranged from 65.8 L at the lowest dose to 98.4 L at the highest dose levels. The mean terminal half‐life was 4.7 ± 0.9 hours. The Cmax of AP30663 increased with increasing doses, however, the dose normalized Cmax and area under the curve (AUC) decreased with increasing doses (Figure 2 ). Furthermore, comparison of the 3 cohorts where 2 mg/kg was administered showed a lower Cmax with a reduced drug product volume (Figure 2 ). The cause of these observations was not examined as part of this study. An overview of the PK parameters per dose level can be found in Table S3 .
Figure 1.
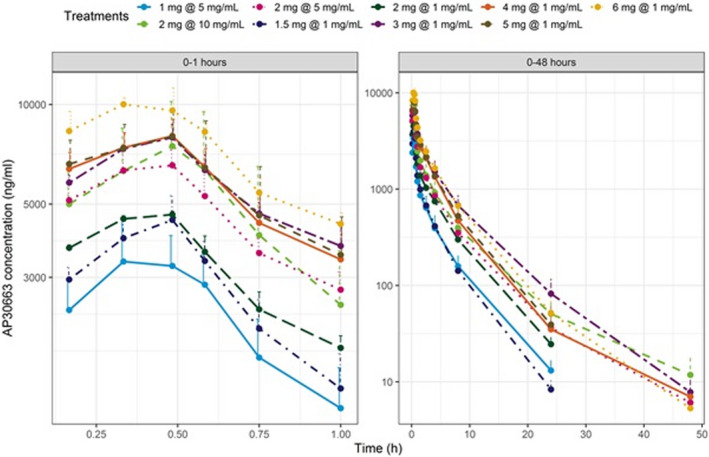
Pharmacokinetic (PK) profiles of AP30663. This figure displays the PK profiles of AP30663 per cohort. The left panel displays the PK profile up to 1 hour after AP30663 administration, the right panel display the profile up to 48 hours after administration.
Figure 2.
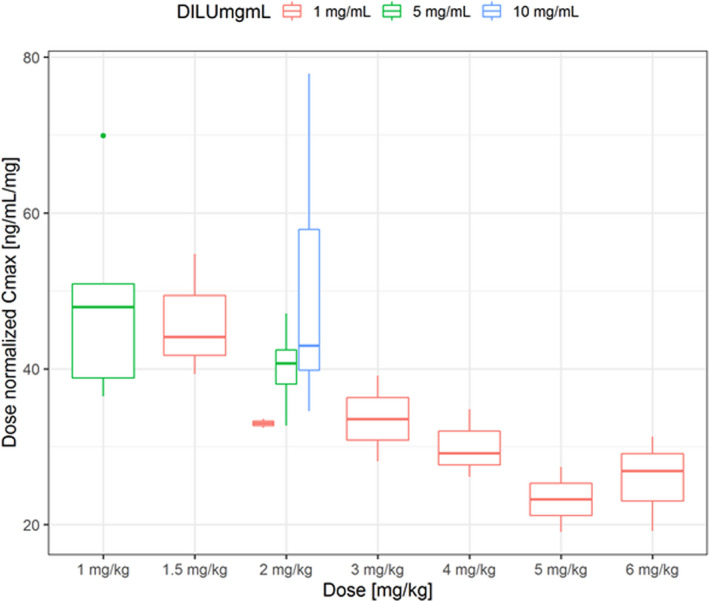
Dose normalized AP30663 peak plasma concentration (Cmax) values. This figure displays the median dose normalized AP30663 Cmax for the doses of AP30663 that were administered in this study. Note that with increasing volume of drug product, there is a less than proportional increase in Cmax.
ECG parameters
Because measurements of atrial effective refractory period (AERP) were not performed in our study population, it was not possible to observe intended PD effects. There was no effect of AP30663 on the P‐wave duration, the PR interval, the RR interval, and the QRS duration. However, a dose‐dependent transient effect of AP30663 on the QTcF interval and QT subintervals was observed, as can be observed in Figure 3 and Figure 4 .
Figure 3.
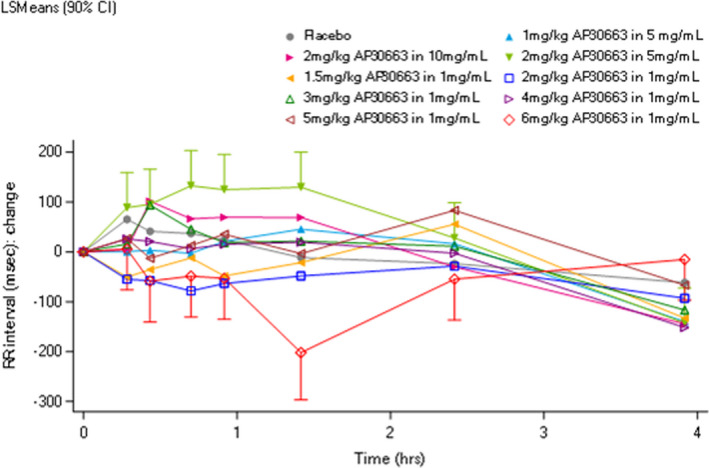
Effect of AP30663 on the RR interval. This figure displays the RR interval in the first 4 hours after AP30663 administration. No effect of AP30663 could be observed on the RR interval. CI, confidence interval; LSM, least square mean.
Figure 4.
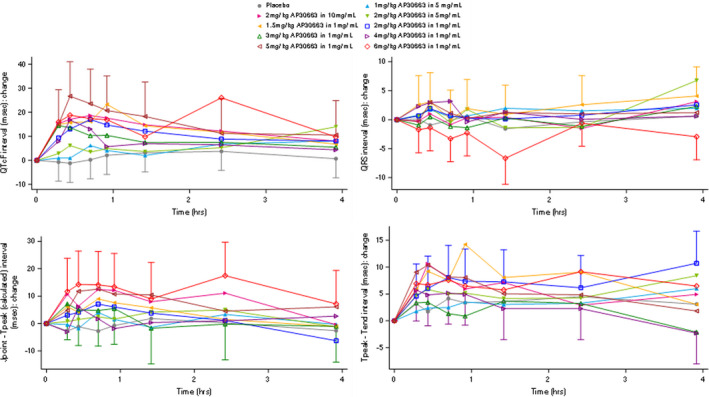
Effect of AP30663 on the QT Fridericia’s formula (QTcF) interval and QT subintervals. This figure displays the effect of AP30663 on the QTcF, QRS, J‐point to T‐peak interval, corrected for heart rate (Jp‐Tpc) and T‐peak‐T‐end interval (Tp‐Tend) intervals in the first 4 hours after dose administration. Note that there is a concentration‐dependent effect of AP30663 on the QTcF, Jp‐Tpc, and Tp‐Tend intervals but not on the QRS duration.
The hysteresis plots suggested no delay between maximum AP30663 exposure and maximum effect, except for ΔQTcF and ΔJp‐Tpc in the 4 mg/kg and 5 mg/kg dose groups, as can be observed in Figure S2 , left panels. The scatter plots overlaid with smooth and linear regression lines supported the assumption of a linear relationship between concentration and effect as can be observed in Figure S3 . The prespecified linear model provided an adequate description of the data as observed by the visual predictive checks (Figure S4 ) and, therefore, no changes to the model were made. Analysis with the prespecified model showed that AP30663 had an effect on the QTcF, Jp‐Tpc, and Tp‐Tend intervals with estimated slopes (±standard error) of 1.201 ± 0.431 ms/(ug/mL; P = 0.003), 0.799 ± 0.327 ms/(ug/mL; P = 0.007), and 0.670 ± 0.221 ms/(ug/mL; P = 0.001), respectively, but no effect on the QRS duration for which the slope was estimated to −0.145 ± 0.129 ms/(ug/mL; P = 0.870). Model‐predicted placebo‐corrected change from baseline of QTcF and each of the QT subintervals vs. AP30663 concentration are displayed in Figure 5 . It should be noted that although the intercept for the Jp‐Tpc interval was above the intercept for Tp‐Tend, the slope of Tp‐Tend interval line was slightly lower. The model prediction at the geometric mean Cmax for each dose level are summarized in Table 2 . Note that no subject had a QTcF interval exceeding 450 ms, or a QTcF interval prolongation of > 60 ms at any dose level.
Figure 5.
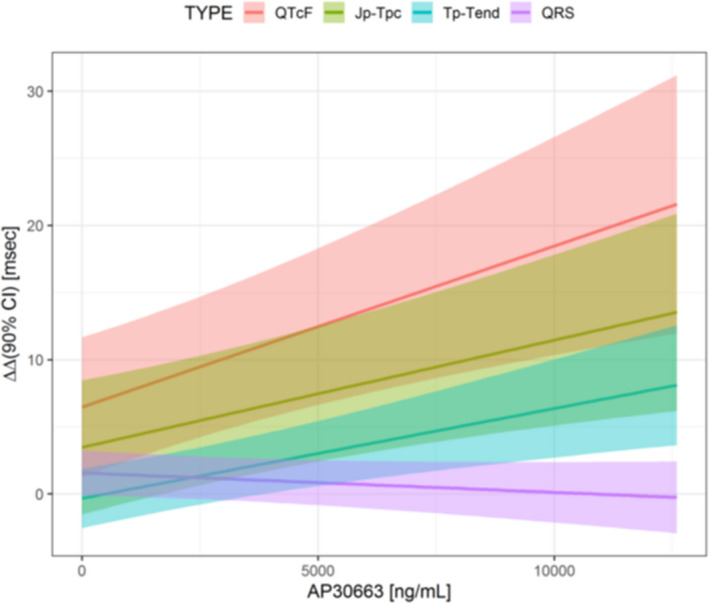
Concentration‐effect analysis of AP30663 and QtcF and QT Fridericia’s formula (QTcF) subintervals. This figure displays the concentration‐effect analysis between AP30663 concentration and the QTcF interval and QT subintervals. Note that there is no effect of AP30663 on the QRS duration, but there is a significant association between AP30663 concentration and the J‐point – T‐peak interval, corrected for heart rate (Jp‐Tpc) and T‐peak‐T‐end interval (Tp‐Tend). CI, confidence interval.
Table 2.
Effect of AP30663 on the placebo corrected ΔQTcF interval and QT subintervals at the geometric mean Cmax per dose level
| Dose level | Concentration, mg/mL | Geometric mean Cmax of AP30663, ng/mL | ΔΔQTcF | ΔΔJp‐Tpc | ΔΔ Tp‐Tend | ΔΔQRS |
|---|---|---|---|---|---|---|
| 1 mg/kg | 5 mg/mL | 3398 | 10.5 ± 3.3 | 6.2 ± 3.0 | 1.9 ± 1.3 | 1.0 ± 1.0 |
| 2 mg/kg | 10 mg/mL | 7154 | 15.1 ± 4.1 | 9.2 ± 3.3 | 4.5 ± 1.8 | 0.5 ± 1.1 |
| 2 mg/kg | 5 mg/mL | 6609 | 14.4 ± 3.9 | 8.8 ± 3.3 | 4.1 ± 1.7 | 0.6 ± 1.1 |
| 1.5 mg/kg | 1 mg/mL | 4428 | 11.8 ± 3.4 | 7.0 ± 3.0 | 2.6 ± 1.4 | 0.9 ± 1.0 |
| 2 mg/kg | 1 mg/mL | 4644 | 12.0 ± 3.5 | 7.2 ± 3.0 | 2.8 ± 1.4 | 0.9 ± 1.9 |
| 3 mg/kg | 1 mg/mL | 7950 | 16.0 ± 4.3 | 9.8 ± 3.5 | 5.0 ± 1.9 | 0.4 ± 1.2 |
| 4 mg/kg | 1 mg/mL | 7994 | 16.1 ± 4.3 | 9.9 ± 3.5 | 5.0 ± 1.9 | 0.4 ± 1.2 |
| 5 mg/kg | 1 mg/mL | 7941 | 16.0 ± 4.3 | 9.8 ± 3.5 | 5.0 ± 1.9 | 0.4 ± 1.2 |
| 6 mg/kg | 1 mg/mL | 10245 | 18.8 ± 4.3 | 11.7 ± 3.9 | 6.5 ± 2.3 | 0.1 ± 1.4 |
Data are presented as mean ± SD.
Jp‐Tpc, corrected Jpoint ‐ Tpeak interval; QTcF, Fridericia corrected QT interval; Tp‐Tend, Tpeak – Tend interval.
DISCUSSION
The present study found that AP30663 in doses up to 6 mg/kg was safe and well‐tolerated systemically. Administration was associated with mild and transient infusion site reactions, which were reduced in duration at higher dose levels after changes to the reconstitution and administration procedure. AP30663 displayed a less than dose proportional increase in Cmax. The estimated terminal half‐life was in the order of 5 hours. AP30663 resulted in a transient dose‐dependent QTcF interval prolongation. Overall, these results support the further clinical development of AP30663 in patients with AF.
Although no KCa2 channel inhibiting agent has been administered to man prior to this study, there are several reports describing the antiarrhythmic effects of KCa2 channel inhibitors in animal models (3–9), showing a dose‐dependent prolongation of the AERP. In preclinical studies, the KCa2 channel inhibitor AP30663 increased atrial refractoriness, converted vernakalant‐resistant AF, and prevented its reinduction in conscious pigs (unpublished data). Moreover, KCa2 channel inhibition prolonged atrial action potential duration in sharp electrode recordings from human atrial appendages, but not in human septal tissue. 14
In the present study, the administration of AP30663 was associated with local infusion site reactions, consisting of a hardening of the vein, redness, and pain. All AEs were mild, although the duration of the hardening of the vein upon palpation was nearly 4 months before the AE was completely resolved in 2 subjects in cohort 3. The exact cause for these observations is unknown, but a direct or combined effect with AP30663 was not ruled out. An alternative is that the pH of the drug product was 4, which is recognized to induce infusion‐site reactions. 15 , 16
There was a less than dose proportional increase in Cmax. The quantity of AP30663 that was estimated to be “lost” in the 6 mg/kg cohort as compared with the 1.5 mg/kg cohort was about 200 mg. Therefore, it is considered most likely that nonlinear mechanisms within the body is responsible for this observation (e.g., a concentration‐dependent clearance or a concentration or volume‐dependent distribution volume), although this could not completely explain the difference. The exact mechanism was not further evaluated as part of this study, but warrants further evaluation.
The target engagement for AP30663 that was observed in this study is estimated to be slightly below the estimated target engagement in the preclinical experiments in mini‐pigs that were treated with 25 mg/kg. The half maximum inhibitory concentration (IC50) of AP30663 for the KCa2 channel was 0.77 µM, equivalent to ~ 300 ng/mL concentration. To achieve this AP30663 concentration in man, assuming a 6.4% free fraction, would require a systemic total concentration of ~ 13,000 ng/mL, whereas, in the present study, the Cmax in the highest dose level was ~ 10,000 ng/mL.
Ventricular effects of KCa2 channel inhibition
The effects of KCa2 channel inhibition on ventricular repolarization are incompletely understood. Reports have suggested that KCa2 channels have a negligible role on ventricular repolarization in healthy animals but that might be different in certain pathophysiological conditions, such as myocardial infarction and congestive heart failure. Under these conditions, some studies have shown that ventricular small‐conductance Ca2+‐activated K+ current can be upregulated and that blocking small‐conductance Ca2+‐activated K+ current can exhibit both proarrhythmic 17 , 18 and antiarrhythmic. 19 , 20 , 21 In addition, preclinical experiments with AP30663 yielded conflicting results. In an in vitro experiment, no effect of AP30663 on the ventricular interval was observed at a concentration of 30 µM (estimated concentration: 12,000 ng/mL). Another study found that dose levels of 5–25 mg/kg showed a nearly linear association between the dose level and the QT corrected with Van de Water formula interval prolongation.
In the current study, high precision ECG analysis was performed, which showed a concentration‐dependent increase of the QTcF interval, with an increase up to 18.8 ms in the highest dose level across the first 4 hours after AP30663 administration. Hypothetically, the QTcF interval can be mediated through two mechanisms, namely KCa2 channel inhibition and Kv11.1 (human ether‐à‐go‐go‐related gene) channel inhibition. In vitro, AP30663 displayed selectivity toward KCa2 channels compared with the Kv11.1 channel with an IC50 of 4 µM vs. ~ 1 µM for the KCa2 channels (unpublished data). Note that the observed maximum total plasma concentration of AP30663 in this study was well above these levels at around 25.5 µM at the 6 mg/kg dose level. The difference in the IC50 values of AP30663 for KCa2 and Kv11.1 channels does not exclude that AP30663 also to some extent inhibited Kv11.1 channels, and that this was at least partly responsible for the prolongation of the QTcF interval. Because this is the first administration of a KCa2 channel inhibitor in humans, it is not possible to compare these results to previously observed effects of a KCa2 channel inhibitor on the QT subintervals. However, Johannesen et al. reported on the QT subinterval prolongation profile after dofetilide, a pure Kv11.1 blocking agent. 12 Dofetilide was found to affect the Jp‐Tpc interval slightly less than the Tp‐Tend interval (14.1 ms per ng/mL vs. 14.5 ms per ng/mL), which seems to be slightly different from the observations in the present study. Whether the observed prolongation of QTcF stemmed from either KCa2 or Kv11.1 inhibition or from a combination thereof cannot be determined from the data currently available.
PD measures of effect in AF could not be measured in the present study because the effect on AERP is not reflected on a surface ECG. Future studies will focus on the efficacy of AP30663 measured as the ability to convert AF episodes to normal sinus rhythm in patients with AF.
Limitations
This was a phase I study with a relatively limited sample size, particularly at the higher dose levels where only three subjects received the same dose of AP30663. However, this small sample size did not preclude to conclude on concentration‐dependency for the PK and PD results presented. On the other hand, the apparent nonlinear PKs of AP30663 observed in this study would need more detailed studies in a larger number of subjects to be conclusive. Furthermore, the placebo consisted of saline and was thus not an exact match of the vehicle used for AP30663. It is, therefore, difficult to discern whether the cause of the observed infusion site reactions were caused by the vehicle per se or by the combination of the vehicle and AP30663.
CONCLUSION
Administration of AP30663, a novel KCa2 channel inhibitor, to humans was considered safe and well‐tolerated systemically. A mild and transient increase in the QTcF interval was observed in the investigated dose levels, mediated through an increase in the Jp‐Tpc and Tp‐Tend intervals, whereas the QRS interval was not affected. These results support further development of AP30663.
Funding
No funding was received for this work.
Conflict of Interest
C.S., U.S., B.H.B., M.G. J.G.D., N.E. are employees of Acesion Pharma ApS. All other authors declared no competing interests for this work.
Author Contributions
P.G. and N.E. wrote the manuscript. All authors designed the research. P.G., M.S., J.B., C.S., and N.E. performed the research. E.S.K. and K.R.B. analyzed the data.
Supporting information
Fig S1‐S4
Table S1‐3
References
- 1. Kriz, R. et al Safety and efficacy of pharmacological cardioversion of recent‐onset atrial fibrillation: a single‐center experience. Am. J. Emerg. Med. 34, 1486–1490 (2016). [DOI] [PubMed] [Google Scholar]
- 2. Waldo, A.L. et al Survival with oral d‐sotalol in patients with left ventricular dysfunction after myocardial infarction: rationale, design, and methods (the SWORD trial). Am. J. Cardiol. 75, 1023–1027 (1995). [DOI] [PubMed] [Google Scholar]
- 3. Epstein, A.E. et al Events in the Cardiac Arrhythmia Suppression Trial (CAST): mortality in the entire population enrolled. J. Am. Coll. Cardiol. 18, 14–19 (1991). [DOI] [PubMed] [Google Scholar]
- 4. Diness, J.G. et al Inhibition of small‐conductance Ca2+‐activated K+ channels terminates and protects against atrial fibrillation. Circ. Arrhythm. Electrophysiol. 3, 380–390 (2010). [DOI] [PubMed] [Google Scholar]
- 5. Diness, J.G. et al Effects on atrial fibrillation in aged hypertensive rats by Ca(2+)‐activated K(+) channel inhibition. Hypertension 57, 1129–1135 (2011). [DOI] [PubMed] [Google Scholar]
- 6. Skibsbye, L. , Diness, J.G. , Sorensen, U.S. , Hansen, R.S. & Grunnet, M. The duration of pacing‐induced atrial fibrillation is reduced in vivo by inhibition of small conductance Ca(2+)‐activated K(+) channels. J. Cardiovasc. Pharmacol. 57, 672–681 (2011). [DOI] [PubMed] [Google Scholar]
- 7. Qi, X.Y. et al Role of small‐conductance calcium‐activated potassium channels in atrial electrophysiology and fibrillation in the dog. Circulation 129, 430–440 (2014). [DOI] [PubMed] [Google Scholar]
- 8. Haugaard, M.M. et al Pharmacologic inhibition of small‐conductance calcium‐activated potassium (SK) channels by NS8593 reveals atrial antiarrhythmic potential in horses. Heart Rhythm 12, 825–835 (2015). [DOI] [PubMed] [Google Scholar]
- 9. Diness, J.G. et al Termination of Vernakalant‐resistant atrial fibrillation by inhibition of small‐conductance Ca(2+)‐activated K(+) channels in pigs. Circ. Arrhythm. Electrophysiol. 10, e005125 (2017). [DOI] [PMC free article] [PubMed] [Google Scholar]
- 10. Gatta, G. et al AP14145: An atrial‐selective pharmacological therapy to terminate stable atrial fibrillation. Heart Rhythm 16, S439 (2019). [Google Scholar]
- 11. van Brummelen, E.M.J. et al Quantification of tremor using consumer product accelerometry is feasible in patients with essential tremor and Parkinson's disease: a comparative study. J. Clin. Mov. Disord. 7, 4 (2020). [DOI] [PMC free article] [PubMed] [Google Scholar]
- 12. Johannesen, L. et al Differentiating drug‐induced multichannel block on the electrocardiogram: randomized study of dofetilide, quinidine, ranolazine, and verapamil. Clin. Pharmacol. Ther. 96, 549–558 (2014). [DOI] [PubMed] [Google Scholar]
- 13. Garnett, C. et al Scientific white paper on concentration‐QTc modeling. J. Pharmacokinet. Pharmacodyn. 45, 383–397 (2018). [DOI] [PubMed] [Google Scholar]
- 14. Skibsbye, L. et al Small‐conductance calcium‐activated potassium (SK) channels contribute to action potential repolarization in human atria. Cardiovasc. Res. 103, 156–167 (2014). [DOI] [PubMed] [Google Scholar]
- 15. Stranz, M. & Kastango, E.S. A Review of pH and Osmolarity. Int. J. Pharm. Compd. 6, 216–220 (2002). [PubMed] [Google Scholar]
- 16. Lee, Y.C. , Zocharski, P.D. & Samas, B. An intravenous formulation decision tree for discovery compound formulation development. Int. J. Pharm. 253, 111–119 (2003). [DOI] [PubMed] [Google Scholar]
- 17. Chang, P.C. et al Apamin induces early afterdepolarizations and torsades de pointes ventricular arrhythmia from failing rabbit ventricles exhibiting secondary rises in intracellular calcium. Heart Rhythm 10, 1516–1524 (2013). [DOI] [PMC free article] [PubMed] [Google Scholar]
- 18. Bonilla, I.M. et al Calcium‐activated potassium current modulates ventricular repolarization in chronic heart failure. PLoS One 9, e108824 (2014). [DOI] [PMC free article] [PubMed] [Google Scholar]
- 19. Chua, S.K. et al Small‐conductance calcium‐activated potassium channel and recurrent ventricular fibrillation in failing rabbit ventricles. Circ. Res. 108, 971–979 (2011). [DOI] [PMC free article] [PubMed] [Google Scholar]
- 20. Gui, L. et al Ventricular tachyarrhythmias in rats with acute myocardial infarction involves activation of small‐conductance Ca2+‐activated K+ channels. Am. J. Physiol. Heart Circ. Physiol. 304, H118–H130 (2013). [DOI] [PubMed] [Google Scholar]
- 21. Hundahl, L.A. et al Pharmacological blockade of small conductance Ca(2+)‐activated K(+) channels by ICA reduces arrhythmic load in rats with acute myocardial infarction. Pflugers Archiv. 469, 739–750 (2017). [DOI] [PubMed] [Google Scholar]
Associated Data
This section collects any data citations, data availability statements, or supplementary materials included in this article.
Supplementary Materials
Fig S1‐S4
Table S1‐3