

Abstract
Understanding the prevalence of clinically relevant pharmacogenetic variants using large unselected populations is critical for gauging the potential clinical impact of widespread preemptive pharmacogenetic testing. To this end, we assessed the frequencies and ethnic distribution of the three most common CYP2C19 alleles (*2, *3, and *17) in 2.29 million direct‐to‐consumer genetics research participants (23andMe, Sunnyvale, CA). The overall frequencies of *2, *3, and *17 were 15.2%, 0.3%, and 20.4%, respectively, but varied by ethnicity. The most common variant diplotypes were *1/*17 at 26% and *1/*2 at 19.4%. The less common *2/*17, *17/*17, and *2/*2 genotypes occurred at 6.0%, 4.4%, and 2.5%, respectively. Overall, 58.3% of participants had at least one increased‐function or no‐function CYP2C19 allele. To better understand how this high frequency might impact a real patient population, we examined the prescription rates (Rx) of high‐pharmacogenetic‐risk medications metabolized by CYP2C19 using the University of California at San Francisco (UCSF) health system’s anonymized database of over 1.25 million patients. Between 2012 and 2019, a total of 151,068 UCSF patients (15.8%) representing 5 self‐reported ethnicities were prescribed one or more high‐pharmacogenetic‐risk CYP2C19 medications: proton pump inhibitors (145,243 Rx), three selective serotonin reuptake inhibitor antidepressants (54,463 Rx), clopidogrel (14,376 Rx), and voriconazole (2,303 Rx).
Study Highlights.
WHAT IS THE CURRENT KNOWLEDGE ON THE TOPIC?
☑ Well‐characterized variants in the CYP2C19 gene can significantly alter the metabolism of several medications that have genotype‐based dosing guidelines available. High prevalence of these variants has implications for clinical decision making.
WHAT QUESTION DID THIS STUDY ADDRESS?
☑ What are the frequencies and ethnic distribution of common CYP2C19 variants in 2.29 million direct‐to‐consumer genetics participants, and what is the prescription rate for medications metabolized by CYP2C19?
WHAT DOES THIS STUDY ADD TO OUR KNOWLEDGE?
☑ Analysis across nine ethnic groups showed distinct patterns of CYP2C19 variant distribution, including discovery of extremely rare genotypes. Almost 60% of participants had at least one potentially actionable CYP2C19 variant, and almost 16% of a University of California at San Francisco (UCSF) patient cohort were prescribed one or more high‐pharmacogenetic‐risk CYP2C19 medications.
HOW MIGHT THIS CHANGE CLINICAL PHARMACOLOGY OR TRANSLATIONAL SCIENCE?
☑ Approximately 120,000 prescriptions in the UCSF system were written for patients with potentially non‐normal CYP2C19 metabolism, some of whom might have benefited from genotype‐guided dosing. This study re‐affirms that preemptive pharmacogenetic testing has the potential to impact a significant number of patients.
Direct‐to‐consumer (DTC) genetic testing is gaining in popularity in the United States. An increasing number of people are choosing to learn about how genetics may inform their ancestry, health predispositions, and common traits. In October 2018, the US Food and Drug Administration (FDA) granted 23andMe the first authorization of a DTC test for detecting genetic variants associated with the metabolism of certain medications. 1 With this authorization, 23andMe can provide consumers information about variants in eight pharmacogenes. Most of those variants are part of the cytochrome P450 (CYP) superfamily of enzymes, which are involved in 70–80% of all phase I drug metabolism and bioactivation. 2 Ethnicity‐dependent polymorphisms in these genes account for up to 30% of interindividual variations in drug metabolism. 3 The purpose of this study is to assess the frequencies of several actionable variants in the highly polymorphic CYP2C19 gene in a large unselected sample and to measure the potential impact of inter‐ethnic variation on patients prescribed certain high‐pharmacogenetic‐risk CYP2C19 medications (Table 1 ).
Table 1.
High‐pharmacogenetic‐risk medications metabolized by CYP2C19
| Medication | Indication | Overview of pharmacogenetic risks | CPIC or DPWG guideline |
|---|---|---|---|
|
Antiplatelet clopidogrel |
|
CPIC Guidelines for CYP2C19 Genotype and Clopidogrel Therapy: 2013 Update 6 | |
|
SSRIs citalopram escitalopram sertraline |
CPIC Guideline for CYP2D6 and CYP2C19 Genotypes and Dosing of Selective Serotonin Reuptake Inhibitors 7 | ||
|
PPIs omeprazole lansoprazole pantoprazole |
Pharmacogenetics: From Bench to Byte – An Update of Guidelines 13 | ||
|
Antifungal voriconazole |
CPIC Guidelines for CYP2C19 and Voriconazole Therapy 8 |
The well‐characterized variants of CYP2C19 are the increased‐function allele *17 (c.‐806C>T) and the no‐function alleles *2 (c. 681G>A) and *3 (c. 636G>A). 4 The observed allele combinations correspond to different phenotypic CYP2C19‐mediated metabolism rates—poor, intermediate, normal, rapid, or ultrarapid metabolism (Table S1 ). 5 These phenotypes are associated with meaningful individual differences in medication efficacy and safety (Table 1 ). Several FDA‐approved medication labels include information about important interindividual differences in CYP2C19 metabolism, and the Clinical Pharmacogenetics Implementation Consortium (CPIC) has released dosing guidelines based on CYP2C19 genotype for patients prescribed clopidogrel, selective serotonin reuptake inhibitors (SSRIs), tricyclic antidepressants, and voriconazole. 6 , 7 , 8 , 9 , 10 , 11 , 12 The Dutch Pharmacogenetics Working Group (DPWG) has published genotype‐dependent dosing recommendations for three proton pump inhibitors (PPIs): omeprazole, lansoprazole, and pantoprazole. 13 , 14 A CPIC guideline for genotype‐guided dosing of PPIs is currently in progress. 15 In fact, in the United States during the calendar year 2013, the 30 most commonly prescribed medications with a high‐pharmacogenetic‐risk accounted for 738 million prescriptions: 220 million of those were for CYP2C19 substrates, with omeprazole and SSRIs listed in the top 10 of most highly prescribed. 16
Studies of CYP2C19 allele frequencies are not uncommon and tend to be population‐specific, including Iran, Mexico, Tibet, China, Jordan, Egypt, Russia, Saudi Arabia, Europe, and multi‐ethnic groups. 17 , 18 , 19 , 20 , 21 , 22 , 23 , 24 , 25 , 26 , 27 , 28 , 29 These studies show varying frequencies across populations, but they are limited by relatively small samples. To address this limitation, a meta‐analysis of 138 original research studies pooled 52,181 participants to examine worldwide CYP2C19 allele frequencies among different ethnic groups and geographic regions. 30 A separate analysis of 19 CYP2C19 variants among 56,945 unrelated individuals from the Exome Aggregation Consortium, which consists of a wide variety of sequencing projects presented a similar global allele frequency distribution. 31 Although these large‐scale meta‐analyses present a broad overview of the frequencies of various ethnic and geographic populations, they fail to control for potential differences in CYP2C19 genotyping assays and population classification methodology.
The primary aim of this study is to utilize the 23andMe cohort to examine frequencies and ethnic distribution of the three most common clinically important CYP2C19 variants—CYP2C19*2 (c.681G>A), CYP2C19*3 (c.636G>A), and CYP2C19*17 (c.‐806C>T)—in a large multi‐ethnic sample. The secondary aim of the study is to examine the prevalence of patients in the UCSF health system who have been prescribed one or more high‐pharmacogenetic‐risk CYP2C19 medications, as defined in Table 1 . Our analysis provides an opportunity to understand the potential magnitude of tailoring prescriptions of selected CYP2C19 drugs based on pharmacogenetics at UCSF.
METHODS
23andMe cohort
Study participants in the 23andMe cohort were customers of 23andMe, a personal genetics company in Sunnyvale, CA. There were 2.3 million eligible subjects included in the analyses who provided informed consent and answered online surveys according to 23andMe’s human subjects protocol, which was approved by Ethical and Independent Review Services. The 23andMe cohort encompassed nine different self‐reported ethnicities: European, African American, Ashkenazi Jewish, East Asian, Hispanic or Latino, South Asian, Middle Eastern, American Native Indian and Alaska Native, and Native Hawaiian and Other Pacific Islander. A group labeled as “Other” includes research participants who self‐identified with two or more of these ethnicities. Consistent with recommended industry privacy practices, all individual counts greater than zero but fewer than five participants were rounded up to five.
CYP2C19 genotyping
Saliva samples were genotyped between 2013 and 2018 on V4 and V5 genotyping platforms that included CYP2C19 *2, *3, and *17 alleles. The V4 platform is a customized Illumina array that has been previously described. 32 The V5 platform (currently used) is a customized version of the Illumina Global Screening Array chip (Illumina, San Diego, CA). Samples that failed to reach 98.5% genomewide call rate were re‐analyzed. Samples that failed repeatedly were excluded from the study.
Allele frequencies of each individual variant (*2, *3, and *17) were calculated separately from the genotype analysis, in order to utilize the maximum amount of data available. A total of 1,171 23andMe participants had missing data at one or more of the three CYP2C19 markers (i.e., *2, *3, *17), and whereas the data from these individuals were excluded from any diplotype calculations, their data were used to calculate the individual allele frequencies (Table S2 ). The final *2, *3, and *17 allele frequencies were derived from 2,298,020, 2,298,599, and 2,298,577 participants, respectively.
University of California, San Francisco patient cohort
De‐identified patient information was collected from the Cogito Data Warehouse utilizing the UCSF Research Data Browser tool. Data has been de‐identified per Health Insurance Portability and Accountability Act (HIPAA) guidelines and includes records from UCSF’s electronic medical record system, named APEX, starting June 2012 through September 2019. For each self‐reported ethnic group, the number of patients with active high‐pharmacogenetic‐risk CYP2C19 medication (Table 1 ) prescriptions was determined. Only patients with known self‐reported ethnicity were included in this analysis. Patients prescribed multiple of the investigated medications were included in the counts of each individual medication.
RESULTS
Data from a total of 2,297,738 participants of 23andMe passed quality control requirements and were used to calculate the genotype frequencies. This sample was distributed across nine self‐reported ethnicities (Table 2 ): European (73.5%), East Asian (3.7%), African American (2.0%), Hispanic or Latino (1.6%), South Asian (1.0%), Middle Eastern (0.7%), Ashkenazi Jewish (0.5%), American Native Indian and Alaska Native (0.2%), and Native Hawaiian and Other Pacific Islander (0.1%). The second largest portion of participants (16.7%) self‐identified with two or more ethnicities.
Table 2.
Demographic characteristics of study participants
| Characteristic | 23andMe a ( N = 2,297,738) | UCSF (N = 1,254,081) |
|---|---|---|
| Age ( years ) | ||
| Mean ± SD | 48.4 ± 18.8 | 41.4 ± 24.4 |
| Sex | ||
| Male | 45.5% | 45.5% |
| Ancestry | ||
| White or Caucasian | ‐‐ | 538,342 (42.9%) |
| European | 1,689,308 (73.5%) | ‐‐ |
| Asian | ‐‐ | 139,588 (11.1%) |
| East Asian | 84,454 (3.7%) | ‐‐ |
| South Asian | 23,141 (1.0%) | ‐‐ |
| African American | 46,063 (2.0%) | 63,263 (5.0%) |
| Hispanic or Latino | 37,279 (1.6%) | ‐‐ |
| Middle Eastern | 15,089 (0.7%) | ‐‐ |
| Ashkenazi Jewish | 12,733 (0.6%) | ‐‐ |
| American Native Indian or Alaska Native | 3,497 (0.2%) | 6,235 (0.5%) |
| Native Hawaiian and Other Pacific Islander | 2,216 (0.1%) | 18,712 (1.5%) |
| Other | 383,958 (16.7%) | 189,795 (15.1%) |
| Unknown or Declined | ‐‐ | 298,146 (23.8%) |
UCSF, University of California at San Francisco.
Percentages are based on the total number of study participants without any missing data at the CYP2C19 *2, *3, or *17 markers.
A total of 1,254,081 UCSF patients were included in this study. Table 2 summarizes the demographic characteristics of these patients. The mean age of UCSF patients was 41.4 years. White or Caucasian (42.9%) was the most common ethnic group followed by Asian (11.1%), Black or African American (5.0%), Native Hawaiian or Other Pacific Islander (1.5%), and American Indian or Alaska Native (0.5%); another 15.1% had reported “Other” as their ethnic group. Approximately 23.8% of UCSF patients had either declined or did not have a self‐reported ethnicity documented in their chart; these 298,146 individuals were excluded from the subsequent medication analysis.
Allele frequencies
The distributions of the CYP2C19 *2, *3, and *17 variants were significantly different by ethnicity (Table 3 ). The frequency of *2 in East Asian (28.4%), South Asian (31.8%), and Native Hawaiian and Other Pacific Islander (27.6%) populations was approximately double the rate of that seen in other populations, which ranged from 11.9% (Middle Eastern) to 17.5% (African American). The *3 allele was most common in the Native Hawaiian and Other Pacific Islander and East Asian populations, at 6.5% and 6.0%, respectively. These two groups also had the lowest frequency of the *17 variant at 5.5% and 3.7%, respectively. The frequency of the *17 allele across all other groups varied from 15.8% (Hispanic/Latino) to 22.0% (African American) with people of European, Ashkenazi Jewish, or Middle Eastern descent exhibiting very similar frequencies at 21.7%, 21.4%, and 21.7%, respectively. Across all populations, the common no‐function allele *2 and the increased‐function allele *17 were observed at rates of 15.2% and 20.4%, respectively, whereas *3 was rare overall (0.3%).
Table 3.
CYP2C19 *2, *3, and *17 allele frequencies among different ancestral groups
| Population | N | Allele frequency, % |
|---|---|---|
| A. CYP2C19*2 (rs4244285; c.681G>A) | ||
| European | 1,689,553 | 14.62 |
| East Asian | 84,463 | 28.38 |
| African American | 46,063 | 17.53 |
| Hispanic or Latino | 37,280 | 13.75 |
| South Asian | 23,138 | 31.76 |
| Middle Eastern | 15,082 | 11.91 |
| Ashkenazi Jewish | 12,728 | 13.97 |
| American Native Indian and Alaska Native | 3,494 | 13.49 |
| Native Hawaiian and Other Pacific Islander | 2,216 | 27.62 |
| Other | 384,003 | 14.07 |
| All populations | 2,298,020 | 15.24 |
| B. CYP2C19*3 (rs4986893; c.636G>A) | ||
| European | 1,689,908 | 0.02 |
| East Asian | 84,507 | 5.99 |
| African American | 46,086 | 0.09 |
| Hispanic or Latino | 37,286 | 0.29 |
| South Asian | 23,148 | 0.30 |
| Middle Eastern | 15,087 | 0.24 |
| Ashkenazi Jewish | 12,738 | 0.18 |
| American Native Indian and Alaska Native | 3,499 | < 0.07 |
| Native Hawaiian and Other Pacific Islander | 2,217 | 6.45 |
| Other | 384,123 | 0.15 |
| All populations | 2,298,599 | 0.28 |
| C. CYP2C19*17 (rs12248560; c.‐806C>T) | ||
| European | 1,689,898 | 21.74 |
| East Asian | 84,517 | 3.66 |
| African American | 46,080 | 22.03 |
| Hispanic or Latino | 37,285 | 15.84 |
| South Asian | 23,145 | 17.34 |
| Middle Eastern | 15,084 | 21.70 |
| Ashkenazi Jewish | 12,736 | 21.37 |
| American Native Indian and Alaska Native | 3,496 | 16.98 |
| Native Hawaiian and Other Pacific Islander | 2,217 | 5.503 |
| Other | 384,119 | 18.62 |
| All populations | 2,298,577 | 20.39 |
Genotype and predicted phenotype frequencies
Genotype and predicted phenotype data are presented in Table 4 . Consistent with previously reported findings, the most common genotypes across all populations are *1/*1 at 41.2%, *1/*17 at 26.0%, and *1/*2 at 19.4%. The frequencies for *2/*17, *17/*17, and *2/*2 are distributed at 6.0%, 4.4%, and 2.5%, respectively, with the rest falling below 1%. Individuals of Hispanic and American Native Indian descent had the highest rate of normal metabolizers with 49.2% and 48.3%, respectively. The South Asian population had the lowest prevalence of normal metabolizers at 26.1%, indicating that almost three‐quarters of this population have a potentially actionable genotype. The East Asian and Native Hawaiian and Other Pacific Islander populations exhibited a similar trend in genotype distributions. Both groups had the lowest rate of *1/*17 (4.6%; 6.6%), *2/*17 (1.9%; 2.4%), and *17/*17 (0.2%; 0.8%), and the highest rate of *1/*2 (35.2%; 33.5%), *1/*3 (7.3%; 8.3%), and *2/*3 (3.3%; 3.6%).
Table 4.
Frequency of CYP2C19 genotypes among different ancestral groups
| Genotype | Predicted phenotype | Frequency by population a (%) | ||||||||||
|---|---|---|---|---|---|---|---|---|---|---|---|---|
| EUR (1,689,308) | EAS (84,454) | AA (46,063) | HISP (37,279) | SAS (23,141) | ME (15,089) | AJ (12,733) | AIAN (3,497) | NHPI (2,216) | Other (383,958) | All (2,297,738) | ||
| *1/*1 b | Normal | 40.54 | 38.44 | 36.44 | 49.22 | 26.14 | 44.05 | 41.73 | 48.27 | 36.19 | 45.44 | 41.23 |
| *1/*17 | Rapid | 27.56 | 4.55 | 26.79 | 22.20 | 17.09 | 28.53 | 27.50 | 23.91 | 6.63 | 24.62 | 26.00 |
| *1/*2 | Intermediate | 18.57 | 35.16 | 20.90 | 19.22 | 31.50 | 15.40 | 17.84 | 18.44 | 33.53 | 18.62 | 19.37 |
| *2/*17 | Intermediate c | 6.36 | 1.85 | 7.62 | 4.20 | 10.63 | 5.43 | 5.98 | 4.63 | 2.35 | 5.26 | 6.03 |
| *17/*17 | Ultrarapid | 4.77 | 0.2380 | 4.82 | 2.61 | 3.41 | 4.66 | 4.59 | 2.69 | 0.8123 | 3.66 | 4.36 |
| *2/*2 | Poor | 2.15 | 8.22 | 3.26 | 1.99 | 10.59 | 1.46 | 1.99 | 1.92 | 7.90 | 2.10 | 2.47 |
| *1/*3 | Intermediate | 0.0292 | 7.34 | 0.1064 | 0.3621 | 0.3025 | 0.2585 | 0.1335 | ‐‐ | 8.30 | 0.1979 | 0.3457 |
| *2/*3 | Poor | 0.0058 | 3.33 | 0.0174 | 0.1234 | 0.1642 | 0.0596 | 0.1021 | < 0.1430 | 3.56 | 0.0620 | 0.1456 |
| *3/*17 | Intermediate c | 0.0096 | 0.4511 | 0.0282 | 0.0644 | 0.1296 | 0.0862 | 0.0471 | ‐‐ | 0.4061 | 0.0365 | 0.0339 |
| *3/*3 | Poor | < 0.0003 | 0.4381 | < 0.0109 | < 0.0134 | ‐‐ | < 0.0331 | < 0.0393 | ‐‐ | 0.3159 | 0.0065 | 0.0186 |
| *N/*17 | Indeterminate | 0.0022 | ‐‐ | < 0.0109 | ‐‐ | < 0.0216 | < 0.0331 | < 0.0393 | ‐‐ | ‐‐ | 0.0029 | 0.0030 |
| *N/*2 | Indeterminate | 0.0011 | ‐‐ | ‐‐ | ‐‐ | < 0.0216 | ‐‐ | ‐‐ | ‐‐ | ‐‐ | < 0.0013 | 0.0013 |
| *N/*N | Indeterminate | < 0.0003 | ‐‐ | ‐‐ | ‐‐ | ‐‐ | ‐‐ | ‐‐ | ‐‐ | ‐‐ | ‐‐ | < 0.0002 |
AA, African American; AIAN, American Native Indian and Alaska Native; AJ, Ashkenazi Jewish; EAS, East Asian; EUR, European; HISP, Hispanic or Latino; ME, Middle Eastern; NHPI, Native Hawaiian and Other Pacific Islander; SAS, South Asian.
*N: novel haplotype where both the *2 and *17 defining SNPs were present on the same chromosome.
Frequencies are expressed in percentages and in brackets is the total number of research participants in each population.
Individuals without *2, *3, or *17 variant. It is possible that participants in this group have additional variants that this analysis did not investigate.
The predicted metabolizer phenotype for the CYP2C19 *2/*17 and *3/*17 genotypes is a provisional classification. The currently available evidence indicates that the CYP2C19*17 increased function allele is unable to completely compensate for the CYP2C19*2 and CYP2C19*3 no function alleles. 6
The increased‐function genotypes, *1/*17 and *17/*17, accounted for almost a third of all study participants at 30.4% with comparable prevalences among European (32.3%), African American (31.6%), Ashkenazi Jewish (32.1%), and Middle Eastern (33.2%) populations. These 4 groups had the highest prevalence of ultrarapid metabolizers at 4.6% to 4.8%. The Hispanic or Latino group had a slightly lower rate of increased‐function genotypes with 22.2% of rapid metabolizers and 2.6% of ultrarapid metabolizers.
Poor metabolizers carrying 2 no‐function alleles accounted for 2.6% across all populations; the *2/*2 combination was the most common (2.5%) of the poor metabolizer genotypes. East Asians, South Asians, and Pacific Islanders were the primary carriers (12.0%, 10.8%, and 11.8%, respectively) when compared with the rest of the populations, which ranged from 1.6% of the Middle Eastern group to 3.3% of the African American group. A similar trend was observed for the intermediate metabolizers. East Asian, South Asian, and Pacific Islander populations had the highest total rate of *1/*2, *2/*17, *1/*3, and *3/*17 (44.8%, 42.6%, and 44.6%, respectively). Middle Easterners had the lowest prevalence at 21.2% with the rest ranging from 23.1% in the American Native Indian group to 28.6% in the African American population.
The scale of the 23andMe cohort allowed the discovery of three especially rare CYP2C19 genotypes, in which individuals were concurrently either heterozygous at *2 and homozygous at *17, homozygous at *2, and heterozygous at *17, or homozygous at both *2 and *17. These participants were inferred to carry a novel haplotype (denoted as *N) in which both the *2 and *17 defining SNPs were present on the same gene copy (in cis; Table 4 ). These genotypes were most common in participants of European descent; 38 were designated *N/*17, 19 were *N/*2, and 5 or fewer were homozygous *N/*N. Five or fewer individuals from each of the African American, Ashkenazi Jewish, South Asian, and Middle Eastern groups carried the *N/*17 genotype, and five or fewer participants from the South Asian group carried the *N/*2 genotype. The predicted metabolizer phenotype for the *N allele is currently unknown.
For the entire research cohort, the rate of having at least one clinically relevant CYP2C19 variant is 58.3%, with the South Asian group having the highest rate at 73.9%, and the Hispanic and American Native Indian and Alaska Native groups having the lowest at 50.8% and 51.7%, respectively (Figure 1 ).
Figure 1.
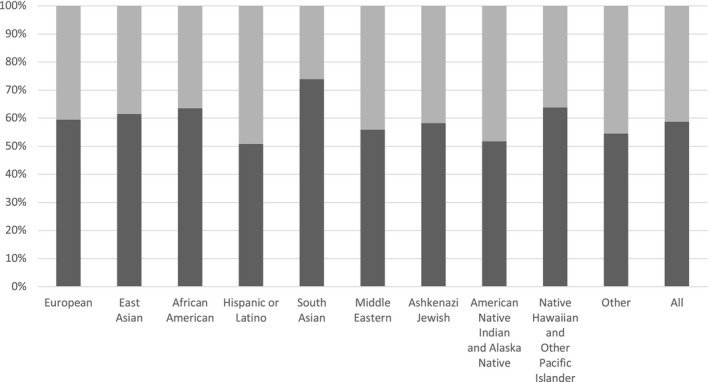
Proportion of individuals with at least one *2, *3, or *17 allele. Dark grey portion represents the percentage of each population carrying at least one clinically relevant CYP2C19 allele, that is *2, *3, or *17. Light grey portion is the percentage of each population that did not have a detected *2, *3, or *17 variant.
High‐risk CYP2C19 medication prescription rates
In the UCSF health system, 151,068 patients (15.8%) representing 5 self‐reported ethnicities were prescribed one or more high‐pharmacogenetic‐risk CYP2C19 medications (Table 1 ). Native Hawaiian or Other Pacific Islanders had the lowest prescription rate with 11.0% prescribed high‐risk CYP2C19 drugs, whereas American Indian and Alaska Natives had the highest rate of active prescriptions for high‐risk CYP2C19 medications (19.4%). White or Caucasian, African American, and Asian populations fall at 17.5%, 15.6%, and 13.7% of their respective groups (Figure 2 ).
Figure 2.
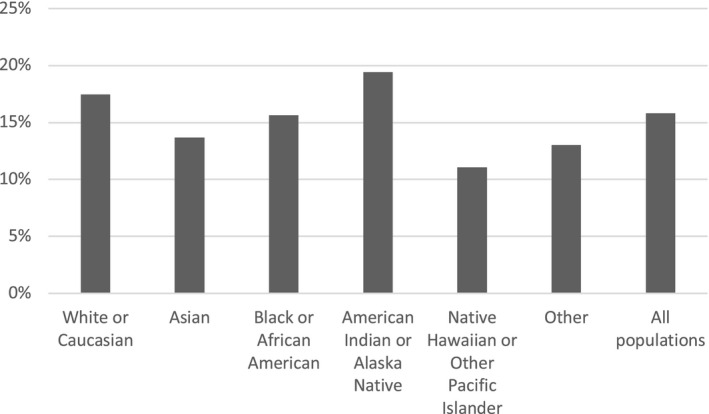
Percentage of University of California at San Francisco patients in each ethnic group who were prescribed one or more high‐pharmacogenetic‐risk CYP2C19 medications. A high‐pharmacogenetic‐risk medication is defined as a drug with an associated Clinical Pharmacogenetics Implementation Consortium or Dutch Pharmacogenetics Working Group genotype‐based prescribing guideline. Medications included in this study were clopidogrel, citalopram, escitalopram, sertraline, omeprazole, lansoprazole, pantoprazole, and voriconazole.
The three PPIs were the most frequently prescribed medications with 145,243 prescriptions (67%), followed by SSRIs (54,463), clopidogrel (14,376), and voriconazole (2,303; Table S3 ). Omeprazole and lansoprazole were prescribed at almost double the rate of pantoprazole. Sertraline, escitalopram, and citalopram had comparable prescription rates, with citalopram prescribed least often.
In each ethnic group, different medications accounted for different proportions of overall prescriptions (Figure S1 ). For example, SSRI antidepressants comprised 28.8% of the high‐pharmacogenetic‐risk CYP2C19 prescriptions for the White or Caucasian group but only 16.6% of prescriptions for participants of Asian descent. SSRI prescriptions in other ethnic groups ranged from 24.1–18.4%. In comparison, PPI prescriptions accounted for 73.7% of prescriptions for the Asian group but only 63.9% of prescriptions for the White or Caucasian participants. PPI prescriptions in other groups ranged from 72.5% (Black or African American) to 68.8% (American Indian or Alaskan Native). Clopidogrel prescriptions had the highest rate in people of Native Hawaiian or Other Pacific Islander descent (10.8%) and ranged from 8.5% (Asians) to 6.1% (Other) in the other populations.
DISCUSSION
In order to expand the knowledge of CYP2C19 allele and genotype frequencies among nine different ethnic groups and to improve understanding of rare and novel variant combinations, we performed the largest study of common CYP2C19 variants to date. Our results are consistent with previously reported findings. Fricke‐Galindo et al., in a meta‐analysis study of 138 original publications with a sample size of 52,181 research participants, showed that CYP2C19*2 was most common in Native Oceanians (61.3%), followed by East and South Asians (30.3%). CYP2C19*3 was predominantly found in Native Oceanians (14.4%) and East Asians (6.9%), and CYP2C19*17 was most prevalent in Mediterranean and South European (42.0%), and Middle East (24.9%) populations. Geographically, *2 and *3 alleles were most frequently observed in Oceania (60.6% and 14.2%, respectively), and *17 was most common in Europe (26.5%) and Middle East (24.9%) regions. 30 Our cohort revealed a lower frequency of CYP2C19*2 in Native Hawaiian and Other Pacific Islander group (27.6%), but comparable frequencies in East and South Asian groups (28.4% and 31.8%, respectively). CYP2C19*3 prevalence was also lower in our cohort of Native Hawaiian and Other Pacific Islander group (6.5%) compared to the meta‐analysis results, but similar frequency was observed in the East Asians (6.0%). Our study did not analyze allele frequencies of a Mediterranean ancestry group, but the CYP2C19*17 frequency in the Middle Eastern population was comparable to the findings of Fricke‐Galindo et al. (21.7% vs. 24.9%).
The data from 23andMe participants showed a similar trend in allele prevalence to another large frequency analysis by Zhou et al. that showed CYP2C19*2 and CYP2C19*17 as the most common alleles, with *2 being more abundant in East Asian and South Asian populations (31.0% and 34.0%, respectively) and *17 in Europeans (22.4%) and Africans (23.5%). The CYP2C19*3 variant was found to be most abundant in East Asians (6.7%). 31 The analysis by Zhou et al. based their findings on genetically identified populations whereas our study analyzed frequencies based on self‐reported ethnicity. Despite the difference in population identification methods, the comparable findings highlight the reliability of our methodology.
CYP2C19 is the main enzyme involved in bioactivation and metabolism of commonly prescribed medications, including those with a high‐pharmacogenetic‐risk as identified by the CPIC and the DPWG. Although the risk of varying metabolism rates due to genetic variability is high for all of these medications, the risk severity depends on the medication. For instance, poor metabolizers and intermediate metabolizers on clopidogrel are at an increased risk of severe cardiovascular events, such as myocardial infarction or stroke. However, the risk is minor for patients taking PPIs. Ultrarapid and rapid metabolizers taking medications, such as omeprazole, have lower plasma concentrations of the drug and, thus, reduced acid suppression (Table 1 ).
Given the high prevalence of various CYP2C19 phenotypes across different populations, as demonstrated by this study, CYP2C19 phenotypes should be given serious consideration when prescribing medications that have CYP2C19 genotype‐based dosing guidelines available. Based on previously described methodology, 16 we calculated the estimated proportion of UCSF patients prescribed a high‐pharmacogenetic‐risk CYP2C19 medication (see Table 1 ) who have a potentially clinically relevant CYP2C19 variant (Figure 3 ). The number of patients prescribed high‐pharmacogenetic‐risk medications and who potentially have at least one *2, *3, or *17 variant surpasses the patients who are most likely normal metabolizers. In total, 127,169 prescriptions were written for potential CYP2C19 non‐normal metabolizers, for whom, depending on the medication and specific genotype, standard dosing or drug choice may not be optimal according to CPIC or DPWG guidelines. Of these, 1,353 prescriptions were for voriconazole and 32,007 prescriptions were for SSRIs. In comparison, 8,448 prescriptions were for clopidogrel, a medication with potentially severe pharmacogenetic consequences for those with the no‐function *2 and *3 variants. It is worth noting that people of Asian or Native Hawaiian/other Pacific Islander descent had both the highest prevalence of the no‐function variants in the 23andMe cohort (Table 4 and Table 5) and the highest proportion of clopidogrel prescriptions in the UCSF cohort compared with other ethnic groups (Figure S1 ).
Figure 3.
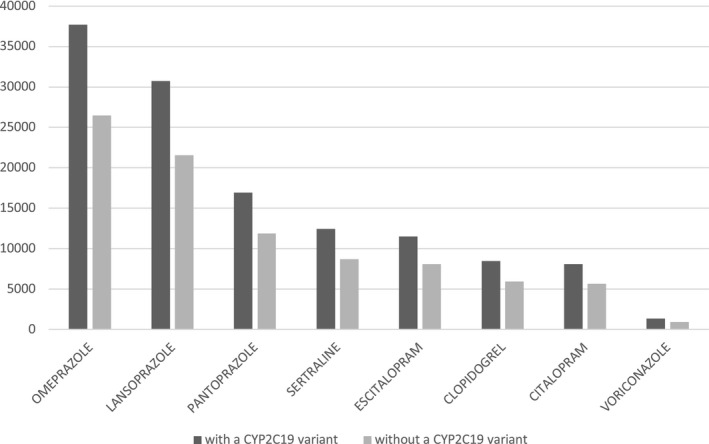
Number of University of California at San Francisco (UCSF) patients prescribed high‐pharmacogenetic‐risk CYP2C19 medications from June 2012 to September 2019, divided into two groups based on predicted CYP2C19 genotype. The dark grey bars represent the number of potential UCSF patients likely to have a clinically actionable CYP2C19 variant, as extrapolated from the genotype frequencies observed in the 23andMe cohort. The light grey bars represent the potential patients likely to be CYP2C19 normal metabolizers. The number of potential patients with a clinically relevant variant was calculated as follows: (total number of UCSF patients on the drug) * (percent of 23andMe research participants with one or more clinically relevant variant). The number of patients without a clinically relevant variant was calculated as follows: (total number of UCSF patients on the drug) * (percent of 23andMe research participants with an observed *1/*1 genotype). Note: Patients prescribed multiple high‐pharmacogenetic‐risk CYP2C19 medications are included in each respective drug group.
A recent study using allele frequencies from the 1000 Genomes Project aimed to predict the proportion of veterans with actionable pharmacogenetic variants. 33 Similar to our projection described above, the study based their estimate on the product of the reported frequency of actionable genotypes and the number of veterans receiving medications with high‐levels of evidence of gene‐drug interaction according to CPIC. Unlike our focused approach, the US Department of Veterans Affairs examined multiple genes implicated in drug metabolism, and it was projected that among Veterans Health Administration (VHA) pharmacy users, 99% carry at least one actionable pharmacogenetic variant. 33 Based on predicted genotype frequencies, this group projected that 26.2% have an actionable CYP2C19 genotype comprised of the *2, *3, *4, or *8 variant, and that 43.1% have an actionable genotype comprised of the increased‐function *17 variant. 33 It did not include PPIs or sertraline as part of its analysis. Nevertheless, the VHA study strongly supports our argument that the patients on high‐pharmacogenetic‐risk medications could potentially use their genetic information to engage in conversation with their healthcare provider about treatment decisions. DTC genetic testing and clinical implementation of genetic testing have the potential to provide a mechanism by which clinically relevant genotypes can be identified preemptively.
Several limitations of our study warrant attention. First, this analysis only examines the most common CYP2C19 variants—*2, *3, and *17. It is possible that participants have additional variants that this analysis did not investigate, which suggests this study may underestimate the number of people with actionable genotypes. Another limitation of this study is that these data were not phased; metabolizer phenotypes were assigned based on the assumption that co‐occurring variants are in trans. In addition, the genetic assessment was based solely on self‐reported ethnicity, which might differ from genetically determined ancestry and, therefore, may not be as accurate in predicting CYP2C19 metabolism phenotypes and possible therapeutic outcomes within more homogenous genetic populations. However, clinicians typically assign race or ethnicity without the availability of genetically determined ancestry, making these estimates more consistent with current clinical practice. Last, this study extrapolated the number of patients on CYP2C19 medications with a likely clinically relevant genotype based on the frequency data of a different sample. Although this provides a reasonable estimate of the potential impact of genetic background on medication selection, it would be even more informative to obtain genetic data of the UCSF patients, or vice versa, to obtain detailed medication history from the 23andMe cohort. It would have been additionally informative to map the occurrence of adverse events onto high‐pharmacogenetic‐risk CYP2C19 prescription rates in the context of ethnicity for the UCSF population. However, at the time of this research, the adverse event data available in the UCSF Research Data Browser tool was insufficient and inadequately cataloged.
Importantly, genetics is not the only determinant of drug metabolism. Analyzing clinical outcomes, such as cardiovascular events, while on clopidogrel therapy in conjunction with genotype assessment provides an important measure of total pharmacogenetic risk, as evidenced by several recent studies. 34 , 35 , 36 Future research that includes direct mapping of clinical outcomes onto individual genetic background at a larger scale would be informative. Such research may be facilitated by DTC genetic testing, by large national health system genotyped cohorts like the UK Biobank, and by academic collaborations.
Funding
J.A., J.Z., H.N., C.K., and A.C. are directly compensated by 23andMe. Y.I. and B.T. received no compensation from 23andMe for this work.
Conflict of Interest
J.A., J.Z., H.N., C.K., and A.C. are employees of 23andMe, Inc. and hold shares and/or options of the company. All other authors declared no competing interests for this work.
Author Contributions
Y.I. and A.C. wrote the manuscript. A.C., J.A., B.T., C.K., and H.N. designed the research. J.A. and J.Z. performed the research. Y.I. analyzed the data.
Supporting information
Fig S1
Table S1
Table S2
Table S3
Acknowledgments
The authors thank the 23andMe research participants who made this work possible. We also thank the employees of 23andMe who developed the infrastructure that made this research possible. We gratefully acknowledge the support of Shirley Wu, Bertram Koelsch, and Jamaica Perry on the 23andMe Health Team and all of our 23andMe reviewers. Y.I. acknowledges UCSF Enterprise Information and Analytics Program Office and UCSF School of Pharmacy Pharmaceutical Sciences Pathway for their guidance and support.
References
- 1. Lias, C.H. 23andMe Personal Genome Service (PGS) Pharmacogenetic Reports. U.S. Food and Drug Administration, Division of Chemistry and Toxicology Devices. <https://www.accessdata.fda.gov/cdrh_docs/pdf18/DEN180028.pdf> (2019). Accessed February 2, 2019. [Google Scholar]
- 2. National Institute of Health . Cytochrome p450. Genetics Home Reference. <https://ghr.nlm.nih.gov/primer/genefamily/cytochromep450> (2018). Accessed October 29, 2018.
- 3. Eichelbaum, M. , Ingelman‐Sundberg, M. & Evans, W.E. Pharmacogenomics and individualized drug therapy. Annu. Rev. Med. 57, 119–137 (2006). [DOI] [PubMed] [Google Scholar]
- 4. Scott, S.A. et al PharmGKB summary: very important pharmacogenes information for cytochrome P450, family 2, subfamily C, polypeptide 19. Pharmacogenet. Genomics 22, 159–165 (2012). [DOI] [PMC free article] [PubMed] [Google Scholar]
- 5. Caudle, K.E. et al Standardizing terms for clinical pharmacogenetic test results: consensus terms from the Clinical Pharmacogenetics Implementation Consortium (CPIC). Genet. Med. 19, 215–223 (2017). [DOI] [PMC free article] [PubMed] [Google Scholar]
- 6. Scott, S.A. et al Clinical pharmacogenetics implementation consortium guidelines for CYP2C19 genotype and clopidogrel therapy: 2013 update. Clin. Pharmacol. Ther. 94, 317–323 (2013). [DOI] [PMC free article] [PubMed] [Google Scholar]
- 7. Hicks, J.K. et al Clinical Pharmacogenetics Implementation Consortium (CPIC) guideline for CYP2D6 and CYP2C19 genotypes and dosing of selective serotonin reuptake inhibitors. Clin. Pharmacol. Ther. 98, 127–134 (2015). [DOI] [PMC free article] [PubMed] [Google Scholar]
- 8. Moriyama, B. et al Clinical Pharmacogenetics Implementation Consortium (CPIC) guidelines for CYP2C19 and voriconazole therapy. Clin. Pharmacol. Ther. 102, 45–51 (2017). [DOI] [PMC free article] [PubMed] [Google Scholar]
- 9. Drugs@FDA: Drug Product Plavix (clopidogrel bisulfate), NDA020839. <https://www.accessdata.fda.gov/scripts/cder/daf/index.cfm?event=overview.process&varApplNo=020839>. Accessed October 29, 2018.
- 10. Drugs@FDA: Drug Product Celexa (citalopram), NDA020822. <https://www.accessdata.fda.gov/scripts/cder/daf/index.cfm?event=overview.process&varApplNo=020822>. Accessed October 29, 2018.
- 11. Drugs@FDA: Drug Product Prilosec (omeprazole magnesium), NDA022056. <https://www.accessdata.fda.gov/scripts/cder/daf/index.cfm?event=overview.process&varApplNo=022056>. Accessed October 29, 2018.
- 12. Hicks, J.K. et al Clinical pharmacogenetics implementation consortium (CPIC) guideline for CYP2D6 and CYP2C19 genotypes and dosing of tricyclic antidepressants: 2016 update. Clin. Pharmacol. Ther. 102, 37–44 (2017). [DOI] [PMC free article] [PubMed] [Google Scholar]
- 13. Swen, J.J. et al Pharmacogenetics: from bench to byte – an update of guidelines. Clin. Pharmacol. Ther. 89, 662–673 (2011). [DOI] [PubMed] [Google Scholar]
- 14. Dutch Pharmacogenetics Working Group . Esomeprazole. <https://www.g‐standaard.nl/risicoanalyse/B0001824.PDF> (2018). Accessed September 20, 2019.
- 15. Clinical Pharmacogenetics Implementation Consortium . Prioritization of CPIC guidelines. <https://cpicpgx.org/prioritization‐of‐cpic‐guidelines/>. Accessed October 25, 2018.
- 16. Dunnenberger, H.M. et al Preemptive clinical pharmacogenetics implementation: current programs in five United States medical centers. Annu. Rev. Pharmacol. Toxicol. 55, 89–106 (2015). [DOI] [PMC free article] [PubMed] [Google Scholar]
- 17. Zand, N. , Tajik, N. , Moghaddam, A.S. & Milanian, I. Genetic polymorphisms of cytochrome P450 enzymes 2C9 and 2C19 in a healthy Iranian population. Clin. Exp. Pharmacol. Physiol. 34, 102–105 (2007). [DOI] [PubMed] [Google Scholar]
- 18. Saldana‐Cruz, A.M. et al CYP2C19 and CYP2C19 allele and haplotype distributions in four mestizo populations from Western Mexico: an interethnic comparative study. Genet. Test. Mol. Biomarkers 20, 702–709 (2016). [DOI] [PubMed] [Google Scholar]
- 19. Jin, T. et al Genotype‐phenotype analysis of CYP2C19 in the Tibetan population and its potential clinical implications in drug therapy. Mol. Med. Rep. 13, 2117–2123 (2016). [DOI] [PMC free article] [PubMed] [Google Scholar]
- 20. Ding, Y. et al Genetic polymorphisms and phenotypic analysis of drug‐metabolizing enzyme CYP2C19 in a Li Chinese population. Int. J. Clin. Exp. Pathol. 8, 13201–13208 (2015). [PMC free article] [PubMed] [Google Scholar]
- 21. Zhong, Z. et al Analysis of CYP2C19 genetic polymorphism in a large ethnic Hakka population in Southern China. Med. Sci. Monit. 23, 6186–6192 (2017). [DOI] [PMC free article] [PubMed] [Google Scholar]
- 22. Yousef, A.M. et al Allele and genotype frequencies of the polymorphic cytochrome P450 genes (CYP1A1, CYP3A4, CYP3A5, CYP2C9, and CYP2C19) in the Jordanian population. Mol. Biol. Rep. 39, 9423–9433 (2012). [DOI] [PubMed] [Google Scholar]
- 23. Hamdy, S.I. et al Allele and genotype frequencies of polymorphic cytochromes P450 (CYP2C9, CYP2C19, CYP2E1) and dihydropyrimidine dehydrogenase (DPYD) in the Egyptian population. Br. J. Clin. Pharmacol. 53, 596–603 (2002). [DOI] [PMC free article] [PubMed] [Google Scholar]
- 24. Gaikovitch, E.A. et al Polymorphisms of drug‐metabolizing enzymes CYP2C9, CYP2C19, CYP2D6, CYP1A1, NAT2, and P‐glycoprotein in a Russian population. Eur. J. Clin. Pharmacol. 59, 303–312 (2003). [DOI] [PubMed] [Google Scholar]
- 25. Al‐Jenoobi, F.I. et al CYP2C19 genetic polymorphism in Saudi Arabians. Basic Clin. Pharmacol. Toxicol. 112, 50–54 (2013). [DOI] [PubMed] [Google Scholar]
- 26. Petrovic, J. , Pesic, V. & Lauschke, V.M. Frequencies of clinically important CYP2C19 and CYP2D6 alleles are graded across Europe. Eur. J. Hum. Genet. 28, 88–94 (2020). [DOI] [PMC free article] [PubMed] [Google Scholar]
- 27. Martis, S. , Peter, I. , Hulot, J.S. , Kornreich, R. , Desnick, R.J. & Scott, S.A. Multi‐ethnic distribution of clinically relevant CYP2C genotypes and haplotypes. Pharmacogenomics J. 13, 369–377 (2013). [DOI] [PMC free article] [PubMed] [Google Scholar]
- 28. Strom, C.M. et al Testing for variants in CYP2C19: population frequencies and testing experience in a clinical laboratory. Genet. Med. 14, 95–100 (2012). [DOI] [PubMed] [Google Scholar]
- 29. Dehbozorgi, M. et al Prevalence of the CYP2C19*2 (681 G>A), *3 (636 G>A) and *17 (‐806 C>T) alleles among an Iranian population of different ethnicities. Mol. Med. Rep. 17, 4195–4202 (2018). [DOI] [PMC free article] [PubMed] [Google Scholar]
- 30. Fricke‐Galindo, I. et al Interethnic variation of CYP2C19 alleles, ‘predicted’ phenotypes and ‘measured’ metabolic phenotypes across world populations. Pharmacogenomics J. 16, 113–123 (2016). [DOI] [PubMed] [Google Scholar]
- 31. Zhou, Y. , Ingelman‐Sundberg, M. & Lauschke, V.M. Worldwide distribution of cytochrome P450 alleles: a meta‐analysis of population‐scale sequencing projects. Clin. Pharmacol. Ther. 102, 688–700 (2017). [DOI] [PMC free article] [PubMed] [Google Scholar]
- 32. Winslow, A.R. et al Self‐report data as a tool for subtype identification in genetically‐defined Parkinson’s Disease. Sci. Rep. 8, 12992 (2018). [DOI] [PMC free article] [PubMed] [Google Scholar]
- 33. Chanfreau‐Coffinier, C. et al Projected prevalence of actionable pharmacogenetic variants and level a drugs prescribed among US Veterans Health Administration pharmacy users. JAMA Netw. Open 2, e195345 (2019). [DOI] [PMC free article] [PubMed] [Google Scholar]
- 34. Cavallari, L.H. et al Multisite investigation of outcomes with implementation of CYP2C19 genotype‐guided antiplatelet therapy after percutaneous coronary intervention. JACC Cardiovasc. Interv. 11, 181–191 (2018). [DOI] [PMC free article] [PubMed] [Google Scholar]
- 35. Lee, C.R. et al Clinical outcomes and sustainability of using CYP2C19 genotype‐guided antiplatelet therapy after percutaneous coronary intervention. Circ. Genom. Precis. Med. 11, e002069 (2018). [DOI] [PMC free article] [PubMed] [Google Scholar]
- 36. Notarangelo, F.M. et al Pharmacogenomic approach to selecting antiplatelet therapy in patients with acute coronary syndromes: the PHARMCLO trial. J. Am. Coll. Cardiol. 71, 1869–1877 (2018). [DOI] [PubMed] [Google Scholar]
- 37. O’Gara, P.T. et al 2013 ACCF/AHA guideline for the management of ST‐elevation myocardial infarction. Circulation 127, e362–e425 (2012). [DOI] [PubMed] [Google Scholar]
- 38. Amsterdam, E.A. et al 2014 AHA/ACC guideline for the management of patients with non‐ST elevation acute coronary syndromes: executive summary. Circulation 130, 2354–2394 (2014). [DOI] [PubMed] [Google Scholar]
- 39. Smith, S.C. et al AHA/ACCF secondary prevention and risk reduction therapy for patients with coronary and other atherosclerotic vascular disease: 2011 update. Circulation 124, 2458–2473 (2011). [DOI] [PubMed] [Google Scholar]
- 40. Kernan, W.N. et al Guidelines for the prevention of stroke in patients with stroke and transient ischemic attack. Stroke 45, 2160–2236 (2014). [DOI] [PubMed] [Google Scholar]
- 41. Alonso‐Coello, P. et al Antithrombotic therapy in peripheral artery disease: antithrombotic therapy and prevention of thrombosis, 9th ed: American College of Chest Physicians Evidence‐Based Clinical Practice Guidelines. Chest 141, e669S–e690S (2012). [DOI] [PMC free article] [PubMed] [Google Scholar]
- 42. Gelenberg, A.J. et al Practice Guideline for the Treatment of Patients with Major Depressive Disorder (American Psychiatric Association, Arlington, VA, 2010). [Google Scholar]
- 43. Ursano, R.J. et al Practice guideline for the treatment of patients with acute stress disorder and posttraumatic stress disorder. Am. J. Psychiatry 161, 3–31 (2004). [PubMed] [Google Scholar]
- 44. Lanza, F.L. et al Guidelines for prevention of NSAID‐related ulcer complications. Am. J. Gastroenterol. 104, 728–738 (2009). [DOI] [PubMed] [Google Scholar]
- 45. Badillo, R. & Francis, D. Diagnosis and treatment of gastroesophageal reflux disease. World J. Gastrointest. Pharmacol. Ther. 5, 105–112 (2014). [DOI] [PMC free article] [PubMed] [Google Scholar]
- 46. Chey, W.D. , Leontiadis, G.I. , Howden, C.W. & Moss, S.F. ACG clinical guideline: treatment of Helicobacter pylori infection. Am. J. Gastroenterol. 112, 212–239 (2017). [DOI] [PubMed] [Google Scholar]
- 47. Pappas, P.G. et al Clinical practice guideline for the management of candidiasis: 2016 update by the Infectious Diseases Society of America. Clin. Infect. Dis. 62, e1–e50 (2016). [DOI] [PMC free article] [PubMed] [Google Scholar]
- 48. Patterson, T.F. et al Practice guidelines for the diagnosis and management of Aspergillosis: 2016 update by the Infectious Diseases Society of America. Clin. Infect. Dis. 63, e1–e60 (2016). [DOI] [PMC free article] [PubMed] [Google Scholar]
Associated Data
This section collects any data citations, data availability statements, or supplementary materials included in this article.
Supplementary Materials
Fig S1
Table S1
Table S2
Table S3