Abstract
Purpose
Computational models are widely used during the design and characterization of microwave ablation (MWA) devices, and have been proposed for pre-treatment planning. Our objective was to assess 3D transient temperature and ablation profiles predicted by MWA computational models with temperature profiles measured experimentally using magnetic resonance (MR) thermometry in ex vivo bovine liver.
Materials and methods
We performed MWA in ex vivo tissue under MR-guidance using a custom, 2.45 GHz water-cooled applicator. MR thermometry data were acquired for 2 min prior to heating, during 5–10 min microwave exposures, and for 3 min following heating. Fiber-optic temperature sensors were used to validate the accuracy of MR temperature measurements. A total of 13 ablation experiments were conducted using 30 – 50 W applied power at the applicator input. MWA computational models were implemented using the finite element method, and incorporated temperature-dependent changes in tissue physical properties. Model-predicted ablation zone extents were compared against MRI-derived Arrhenius thermal damage maps using the Dice similarity coefficient (DSC).
Results
Prior to heating, the observed standard deviation of MR temperature data was in the range of 0.3 – 0.7 °C. Mean absolute error between MR temperature measurements and fiber-optic temperature probes during heating was in the range of 0.5 – 2.8 °C. The mean DSC between model-predicted ablation zones and MRI-derived Arrhenius thermal damage maps for 13 experimental set-ups was 0.95. When comparing simulated and experimentally (i.e. using MRI) measured temperatures, the mean absolute error (MAE %) relative to maximum temperature change was in the range 5 % - 8.5 %.
Conclusion
We developed a system for characterizing 3D transient temperature and ablation profiles with MR thermometry during MWA in ex vivo liver tissue, and applied the system for experimental validation of MWA computational models.
Keywords: microwave ablation, computational modeling, MR-thermometry, model validation, MRI-guided interventions
1. INTRODUCTION
Computational models of thermal ablation procedures aim to predict the extent of the thermal ablation zone, which is a function of the transient temperature profile within the heated tissue, for a candidate set of treatment delivery parameters. Models of microwave ablation (MWA) are widely used during the design and optimization of ablation applicators, and are also frequently used to characterize applicator performance as part of regulatory submissions [1]–[4]. Models are also used for comparative assessment of energy-delivery strategies [5] and for assessing the impact of various sources of uncertainty on ablation outcome [6]–[10]. Recently, there has been growing interest in the development of computational models for guiding planning of clinical ablation procedures, and for assessing treatment outcome [11]. Experimental validation of MWA computational models is important to provide confidence in model predictions [12]–[16] and may contribute to increased use of modeling tools in the clinical setting. Although the ultimate application of MWA technology is in pathologic tissue in the in vivo setting, extensive validation in the controlled ex vivo tissue environment represents an important first step for establishing model credibility.
MWA computational modeling consists of 1) defining the geometry of the ablation applicator and the medium (or media) within which the applicator is inserted; 2) assigning biophysical properties to each domain of the simulation geometry; 3) discretizing the computational domain, and solving the electromagnetic, bioheat transfer, and other equations, subject to the specified initial and boundary conditions. The electromagnetic power density profile serves as the heat source for the bioheat transfer equation [5]. The output of the MWA computational model is transient temperature profile from which thermal damage can be estimated [18]. The model outputs may be affected by several sources of uncertainty and variations (e.g. substantial changes in thermal and biophysical properties due to temperature change [19]).
Validation of a computational model is defined as determining the degree to which the model accurately represents of the physical world given the intended use of the model [20]. Validation of MWA computational models may be performed by comparing model outputs, such as transient temperature profiles and extents of the thermal damage/ ablation zone, with experimental measurements. A widely used approach to assess the validity of MWA models is to place point-based temperature sensors at a few discrete points during experimental ablations, and to compare the measured temperatures with simulated temperature profiles at the same location [5]–[7]. To compare the extent of the ablation zone, simulated thermal damage maps, derived from transient temperature profiles, may be compared with the extent of visibly discolored tissue. This comparison provides an additional level of validation as it accounts for the ablation zone size and shape, in addition to the transient temperature profiles at a few discrete points. However, determining the boundary of the experimental ablation zone (i.e. segmentation) may be subjective prone to inter- and intra-observer bias [21], and challenging with some tissue types, e.g. lung tissue in which ablation zone boundary may be diffuse and not visibly separated from the healthy tissue background [22]. In addition to providing temperature measurements at a large number of points, methods for measuring the transient evolution of spatial temperature profiles during ablation would enable calculation of the extent of the ablation boundary, for example, using the Arrhenius thermal damage model [18]. In order to provide transient temperature profiles at more than just a few discrete points, infrared cameras have been used to measure spatial temperature profiles during MWA experiments [17]. However, this technique only provides surface temperature measurements and requires experimental apparatus that provides an optical window in the heated tissue, thus making it unsuitable for volumetric temperature measurements during ablation.
Magnetic resonance imaging (MRI) provides a means for spatial measurement of transient temperature profiles in multiple planes. A number of temperature-sensitive MR parameters have been investigated for monitoring of thermal therapy procedures, with the most widely used approach being the proton resonance frequency shift (PRFS) technique [23], [24]. Although tissue dielectric changes may lead to PRFS-measured temperature errors due to phase retardation, it should not significantly affect the temperature measurements when the heated volume is restricted to a small fraction of the imaged sample [25]. While MR thermometry has been widely applied for monitoring and guiding delivery of ultrasound and laser ablation [26]–[30], it has not been widely used with microwave ablation systems. Integrating microwave ablation systems with MRI may be challenging due to the need to design the ablation applicators and feeding cables from MRI-conditional materials, as well as considerable attenuation in long feeding cables due to the requirement that the microwave power source is placed outside the scanner room [31]. Some prior studies have investigated the use of 1.5 T MRI thermometry for monitoring microwave heating of ex vivo tissues such as brain, muscle, liver, kidney, in vivo rabbit brain, as well as ablation of prostate cancer in humans [32]–[34]. In these studies, MR thermometry images were acquired with different imaging sequences such as spoiled gradient-recalled echo (SPGR) and fast-SPGR in a single plane with an update time of ~13 – 26 s. Prior studies have also employed gradient eco sequences (GRE) with Z-shimming for minimizing artifacts in the proximity of metallic microwave ablation applicator [35]. With advances in MR thermometry sequence development, multi-slice thermometry with update times of under 10 s are now available, offering a potential avenue for 3D measurement of transient temperature profiles during ablation procedures [23].
In our earlier study [36], we presented a preliminary assessment of 3D computational models of microwave thermal therapy (over the temperature range 20 °C – 45 °C) in an agar phantom using a 14.1 T ultra-high field small-animal MR scanner. Due to the limited size of the high-field small-animal scanner, the phantom diameter was restricted to 27 mm, and the use of power levels typically used during ablative exposures was precluded. The objective of current study was to develop an experimental MWA platform integrated with 3T MRI and to apply this platform for assessing the thermal profiles predicted by computational thermal models in comparison to thermal profiles measured with Magnetic Resonance Thermometry (MRT). We used a custom 2.45 GHz, water-cooled, microwave applicator for MWA experiments in ex vivo tissue performed inside the 3T MRI scanner. A 3D MWA computational model was implemented to predict transient temperature profiles during 30 – 50 W microwave exposure. Volumetric temperature maps and thermal damage profiles measured using MRT were compared to profiles predicted by MWA computational models. To further analyze the sources of uncertainty in measured temperature profiles, we studied the sensitivity of parameters affecting the model output and compared to experimentally measured thermal damage using our developed MWA platform.
2. MATERIALS AND METHODS
The overall goal of this study was to assess 3D transient temperature and ablation profiles predicted by MWA computational models with temperature profiles measured experimentally using MRT. Measured transient temperature and ablation zone profiles were compared directly against model predictions. A sensitivity study was conducted to assess the impact of various sources of uncertainty on model outputs, for comparison against variability in experimental measurements.
2.A. Ex vivo tissue MR-guided microwave ablation experimental setup
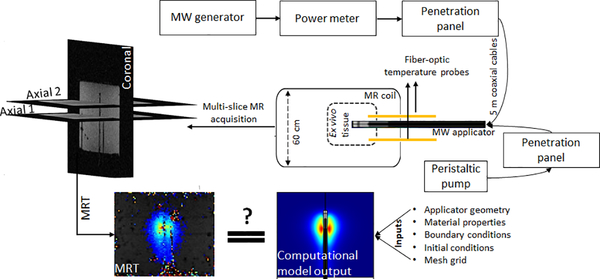
We developed a custom apparatus for conducting MWA experiments in ex vivo tissue within the 3T MRI environment (Fig. 1). The MWA system consists of a 200 W, 2.45 GHz solid state generator (SAIREM, GMS 200 W, Neyron, France), peristaltic pump (Masterflex, 07554–90, Vernon Hills, IL), and a custom, water-cooled, microwave applicator fabricated from MR-conditional materials. The microwave generator was connected to power monitoring instrumentation (BirdRF 7022 statistical wideband power sensor, Bird Technologies, Solon, OH) to keep track of power delivered to the applicator. The generator, power monitoring instrumentation, and peristaltic pump were placed outside the MRI room in the controller room. The water-cooling lines and the fiber-optic temperature probe extensions were introduced into the scanner room via a waveguide. The microwave signal was coupled to the MWA applicator inside the MRI room via a penetration panel. The coaxial cable and water line tubing between the generator, pump and the applicator were 6 m long (5 m from microwave applicator to waveguide and 1 m from waveguide to the generator). This length of cables in between the microwave generator and the MWA applicator placed limits on maximum power applied at the MWA applicator connector. Considering the attenuation level of cables, with a generator of maximum 200 W, the maximum power at the applicator input port was limited to 52 W.
FIG. 1.
Block diagram of the microwave ablation system integrated with 3T MRI
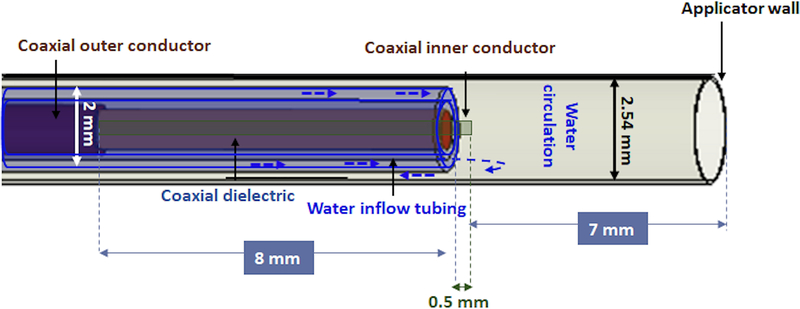
We performed MWA in ex vivo tissue (bovine liver) under 3T MRT guidance using a custom, 2.45 GHz cylindrically-symmetric water-cooled applicator. As illustrated in Fig. 2, the ablation applicator consists of a monopole antenna created by modifying the distal tip of a low-loss, coaxial cable with a non-magnetic copper jacket (UT-047C-LL; Microstock, Inc, PA, USA) to expose the center conductor. The antenna is concentrically positioned within a water in-flow tube (FEP, O.D. = 2 mm; I.D. = 1.4 mm) and an outer tube (PEEK, O.D. = 2.54 mm, I.D. = 2.4 mm) that provides a return flow path. Water flow around the distal tip of the radiating antenna, was employed to remove waste heating along the applicator’s shaft due to attenuation within the coaxial cable, as well as to provide a high dielectric constant material that yields a short electromagnetic wavelength.
FIG. 2.
Geometry of the distal tip of the microwave ablation applicator
MR thermometry data were acquired on a 3T Siemens Skyra scanner using a vendor provided 15-channel Tx/Rx knee coil in one coronal (parallel to microwave ablation applicator) and two axial planes (perpendicular to coronal view). One axial plane was aligned with the distal point of fiber-optic temperature probes while the second one was placed 13 mm apart distally, to capture thermometry data in a plane near the tip of the radiating antenna element as illustrated in Fig. 1. Phase and magnitude maps were reconstructed from a series of fast low-angle shot (FLASH) images (TR/TE = 50/12.3 ms, FOV = 128 × 128 mm2, matrix = 128 × 128, flip angle = 15°, slice thickness = 1.5 mm and acquisition time = 6.4 s per image) to measure changes in tissue temperature. The PRFS method, a widely used MR temperature monitoring technique, was utilized in this work to measure temperature changes during microwave heating [23], [24]. In this work, a fast spoiled GRE sequence (FLASH) was used due to its relatively short TE/TR, which decreases the scanning time that is appropriate for temperature monitoring and high accuracy in temperature monitoring spatially and temporally while maintaining a relatively high SNR [30].
To compensate for the magnetic field drift of MRT at 3T, we applied the phase drift correction [34] to our measurements as follows:
| (1) |
where α,γ,B0 and TE are the PRF temperature coefficient, gyromagnetic ratio, the magnetic field and echo time defined in the MR scanning sequence, respectively. In the above equation, Δϕ(t) is the phase change due to both temperature and other changes and ϕdrift(t) is a 3×3 region of interest (ROI) selected far away from the applicator where no temperature change was expected. The first phase image during course of experiment was considered as the reference image, ϕdrift(0), which was subtracted from the all other images to capture the non-temperature phase changes.
A total of 13 ablation experiments were conducted using 30 – 50 W applied power at the applicator input (corresponding to 100 – 180 W power level at the generator). MRT data were acquired for 2 min prior to heating, during 5–10 min microwave exposures, and for 3 min following heating. The MWA applicator was inserted 5 cm deep inside the tissue. Two fiber-optic temperature probes were introduced during ablation experiments to compare the monitored temperatures to MRT measurements (FO1 at 5 mm and FO2 at 35 mm radially from the applicator). The fiber-optic temperature probes were placed at pre-defined depths in regions where peak (FO1) and moderate (FO2) temperatures were anticipated. FO1 was axially aligned to be in proximity to the junction of the coaxial outer and inner conductors. Initial tissue temperature was also monitored by FO1 and FO2, which later was used as a baseline temperature for MRT measurements to determine absolute temperature of tissue during ablation experiments. We used a 8×8×8 cm3, 1 cm thick custom-made 3D printed container (polylatic acid, PLA, filament) to hold the same volume of ex vivo tissue for each experiment. The container’s lid (1.5 cm thickness) had 3 holes to align the fiber-optic temperature probes with the microwave applicator at 5 mm and 35 mm radial distance from the applicator. This fixture was designed to produce repeatable experiment outcomes.
2.B. Microwave ablation computational modeling
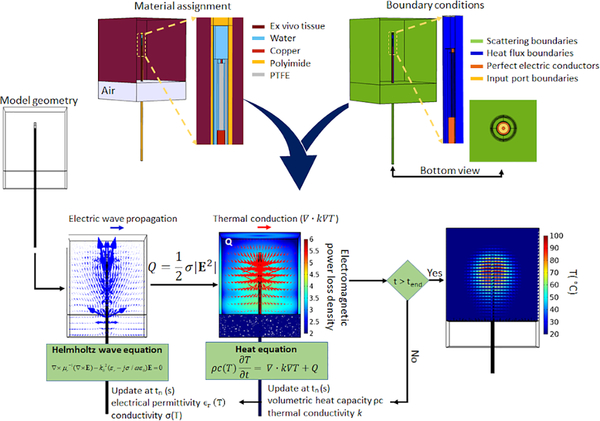
We implemented MWA computational models using the finite element method with COMSOL Multiphysics (v 5.4) software. These models utilize time-harmonic wave propagation equation to calculate the electromagnetic power absorption profile in tissue. The electromagnetic model is coupled with the transient heat transfer equation to calculate 3D temperature profiles. Similar to state-of-art MWA computational models [5], [9], changes in tissue physical properties as a function of temperature change were incorporated within our model. Similar to prior modeling studies of water-cooled microwave ablation applicators [10], [37], we employed a convective heat transfer boundary condition assuming a constant cooling temperature for the circulating water flowing inside the applicator (during ablation experiments, a 1 °C change in circulating water was measured, see Fig. S1 in the supplementary material). Since this study only considered experiments in ex vivo tissue, no perfusion term was included. Fig. 3 illustrates the various components of the computational model, including specification of boundary conditions, and how the electromagnetic and thermal model are coupled. Further details of the computational model were previously described in [4].
FIG. 3.
Schematic of the 3D microwave computational model
Similar to existing computational models of MWA [9], we incorporated temperature-dependent changes in tissue physical and thermal properties in our models.
Table I lists the equations for temperature dependent tissue properties which were used in the computational models in this work, similar to [9]. Briefly, the dielectric properties are represented with a sigmoidal temperature dependency, where both relative permittivity and effective conductivity transition from relatively high values at low temperatures to relatively low values at temperatures in excess of ~100 °C (attributed to desiccation) [6], [7]. The volumetric heat capacity incorporates the effects of latent heat of water vaporization at temperatures close to 100 °C [38]. Thermal conductivity is represented with a linear increase with increasing temperature, as reported in [39]. A non-uniform tetrahedral mesh grid was applied through the geometry such that the finest mesh was applied at the applicator input port boundry (maximum element edge length = 0.05 mm), with increasing element size at distant regions, with the largest mesh elements within the tissue domain (maximum element edge length = 3 mm).
Table I.
Temperature dependent tissue properties for microwave ablation computational model
| Temperature dependent tissue properties | Equation used in the coupled computational model of microwave ablation |
|---|---|
| σef(T) | |
| ϵr(T) | |
| ρc (T) | |
| k (T) |
The Arrhenius thermal damage model is a well-established model for assessing thermal damage following non-isothermal heating, and was used in this study to compare model-predicted thermal ablation zones with experimental measurement (Equation 2):
| (2) |
In Eq. (2), the frequency factor (A = 5.51×1041 s−1) and energy barrier (Ea = 2.769×10⁵ J.mol−1), were selected for pig liver tissue whitening [18]. R is gas constant (8.3145 J mol−1 k−1) and T(t) is the temperature (°C) at time t. A binary thermal damage map, showing the extent of ablated area, was calculated using I = Ω(T) > 1, which corresponds to 63% of the thermal damage process being completed.
2.C. Experimental assessment of microwave ablation computational models
We compared 3D transient temperature profiles predicted by computational models with temperature profiles measured using MRT. To consider volumetric temporal and spatial distribution of temperature, we made the following comparisons between simulated and measured temperature profiles:
-
a
Transient temperature in multiple 3×3 ROIs in coronal and axial planes
-
b
Radial distribution of temperature at different time-points in the duration of experiments at multiple locations along the axis of the MWA applicator.
The mean absolute error (MAE %) between MRT and simulated temperature (TMRT and Tsimulated in equation 3, respectively) is reported for the above comparisons (a and b), as a percentage of the maximum temperature change observed during experimental ablations. Equation 3 is used to measure MAE %:
| (3) |
MAE % is an established measure of difference between simulations and measurements relative to the largest measured value [10].
-
c
Extents of the ablation zone, using binary Arrhenius thermal damage maps. To compare simulated and MR-derived binary Arrhenius map, Dice similarity coefficient (DSC) is used (Equation 4, in which I is binary Arrhenius map).
| (4) |
2.D. Sensitivity analysis
Tissue biophysical properties are known to vary considerably across patients, as well as a function of tissue pathological state. Prior studies of tissue dielectric and thermal properties made on ex vivo tissue have also demonstrated variability in these properties across samples [19]. The inter-sample variability of tissue dielectric and thermal properties may affect the experimental outcome. Similar to previous studies on sensitivity analysis of thermal ablation [9], [40], we used the Morris method to determine the sensitivty of microwave ablation zones to uncertainty in tissue physical properties. The seven variables considered for this sensitivity study and their range of tissue physical properties are defined and shown in Table II. The equations describing the temperature dependence of the dielectric and thermal parameters is provided in Table I. In this work, we have considered 30 starting points for the variables with significant influence on the ablation zone shape according to sensitivity study in (i.e. a total of 210 simulations).
Table II.
Range of values for tissue physical properties used in the sensitivity study.
| Sensitivity parameters | Definition | Range | Units |
|---|---|---|---|
| εr | Relative permittivity | 30.73 – 68.8 | - |
| σef | Effective conductivity | 1.14 – 2.55 | S/m |
| Δel | Temperature transition in sigmoid function (Temperature at which state of sigmoid function changes from high to low) | −15 to 15 | °C |
| ρc0 | Basline volumetric heat capacity | (3.7 – 4.3). 106 | J/(°C.m3) |
| ΔT | Temperature interval across which the tissue changes phase | 1 – 10 | °C |
| k0 | Thermal conductivity | 0.46 – 0.57 | W/(°C.m) |
| Δk | Thermal conductivity change with temperature | 0 – 0.0033 | W/(°C.m) |
3. RESULTS
3.A. MRT validity assessment
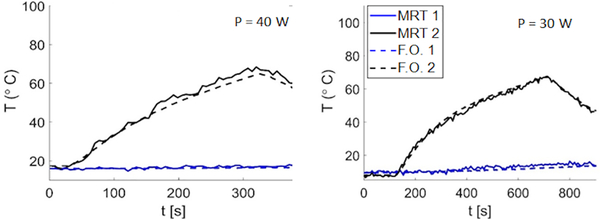
MRT measurements were compared against fiber-optic temperature data for a wide range of temperatures, with a maximum temperature rise of 100 °C monitored with FO1 at 5 mm radially from the ablation applicator. Prior to heating, the observed standard deviation of MRT data was in the range of 0.3– 0.7 °C, which provides an indication of the uncertainty in our MRT measurements. Fig. 4 shows exemplar transient temperature profiles prior to, during and post MWA measured with MRT and FO1 and FO2. Mean absolute error (MAE) between MRT and FO1 and FO2 during heating across 13 ex vivo tissue MWA experiments was in the range of 1 – 2.8 °C and 0.5 – 1.4 °C, respectively.
FIG. 4.
Experimental transient temperature measurments with fiber-optic temperature sensors in comparison to MRT at ROIs located at the tip of fiber-optic temperature probes in 5 mm (black lines) and 30 mm (blue lines) distance from the applicator with input power of 30 and 40 W.
3.B. Experimental assessment of computational models
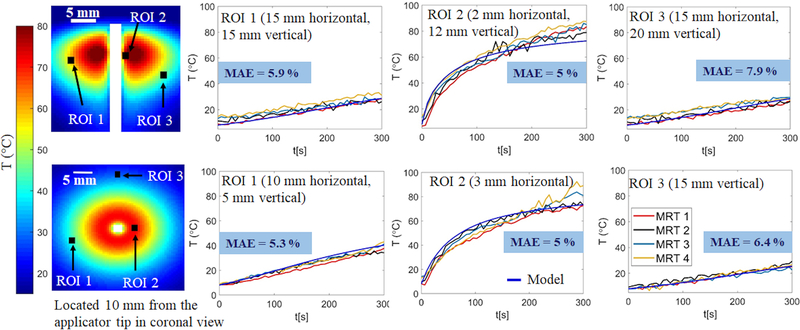
Fig. 5 shows MRT measurements from four different experiments (labeled MRT 1- MRT 4) during microwave ablation of ex vivo tissue compared to simulated temperatures in multiple 3×3 ROIs in axial and coronal views. ROIs in proximity to the applicator were selected to include high temperatures and locations that dielectric and thermal properties of tissue were expected to change substantially during the ablation experiment. Conversely, ROIs further away from the applicator were also selected to include regions of lower temperatures. The MAE %, as a percentage of overall temperature rise, between experimentally measured and simulated temperatures was calculated for each of the transient temperature profiles shown in Fig. 5, which ranges between 1.2 % and 11 % with an average of 5.91 ± 1.1 %.
FIG. 5.
Experimentally measured and simulated transient temperature profiles at multiple ROIs in coronal (first row) and axial views (second row) for input power P = 30 W. MAE % reports the average percentage of mean absolute error between temperature measurements from four experimental datasets (MRT1, MRT2, MRT3, MRT4) and temperatures computed by the model.
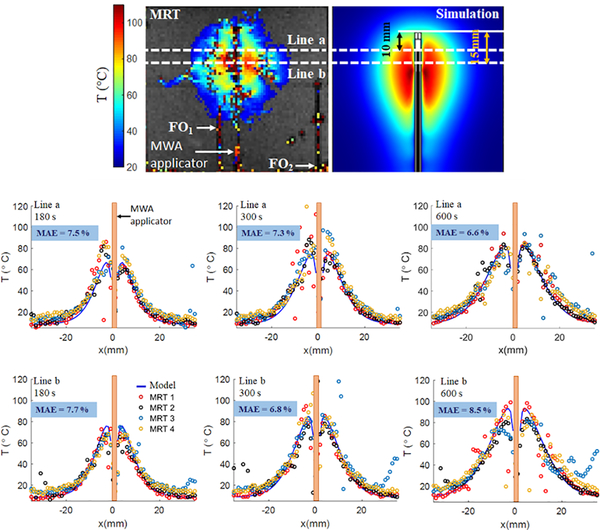
We further compared MR-measured and simulated temperatures radially at different time-points during the MWA experiments at multiple regions of tissue relative to the applicator distal point (Fig. 6). The MAE % between radial temperatures measured using MRI map and predicted by 3D model is calculated. The MAE % shown on each of the temperature profiles in Fig. 6, is the mean of the MAE % between each of the MRTs and the model-predicted temperature profile.
FIG. 6.
Experimentally measured and simulated radial temperature profiles located at 10 mm and 15 mm from the applicator tip at t = 180, 300 and 600 s followed by input power of 30 W. MAE % represents the mean absolute error as a percentage of maximum temperature between MRT1, MRT2, MRT3, MRT4 and simulations.
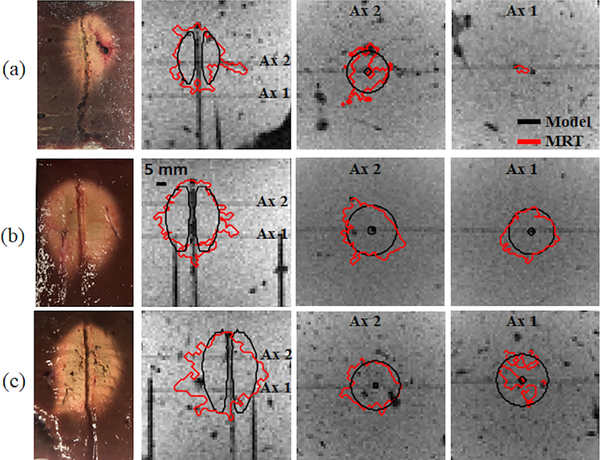
We also compared model-predicted ablation zone extents against MRT-derived Arrhenius thermal damage maps in 3D view. In Fig. 7, three examples of Arrhenius thermal damage maps with different combinations of power and ablation duration are illustrated. The DSC between model-predicted ablation zones and MRT derived Arrhenius thermal damage maps were 0.8 ± 0.0 (30 W, 10 min, n=4), 0.8 ± 0.08 (30 W, 5 min, n=8) and 0.75 ± 0.06 (50 W, 5 min, n=3).
FIG. 7.
Thermal damage boundaries of MRT measured and simulated Arrhenius thermal damage maps superimposed on magnitude images. (a) input power of 30 W after 300 s; (b) input power of 30 W after 600 s; and (c) input power of 50 W after 300 s.
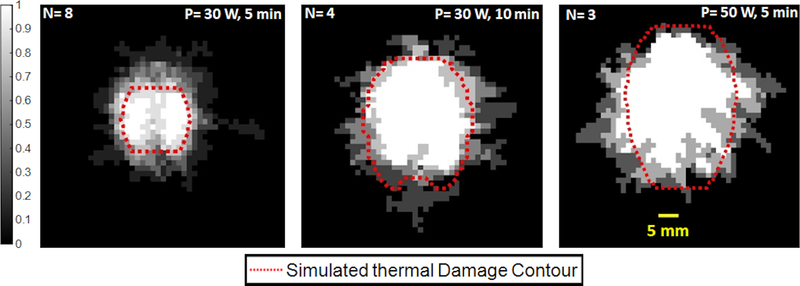
Fig. 8 depicts the variation of MRT-derived Arrhenius thermal damage maps across ex vivo tissue experiments. We have averaged the binary thermal damage maps computed from MRT measurements during ex vivo tissue MWA experiments for each particular power and time combination. This illustration provides an assessment of the variability of ablation outcome across multiple experiments. Regions which were ablated in all experiments yielded an average value of 1, while regions not ablated in any of the experiments yielded an average value of 0. Regions where the average value was between 0 and 1 were ablated in a subset of experiments. A single model-predicted thermal damage contour, using the average value of tissue physical properties, is superimposed on the averaged thermal damage map. As shown in Fig. 8, the simulated thermal damage contour is in alignment with the ablated region that is in common among all ex vivo tissue MWA experiments (white regions in Fig. 8).
FIG. 8.
Experimentally measured Arrhenuis thermal damage maps averaged across multiple experiments, superimposed on the simulated arrhenuis map; white regions indicate ablation zones in common between all MRT-derived Arrhenuis thermal damage map, gray regions are areas ablated in a subset of experiments, and black regions are non-ablated tissues across all experiments.
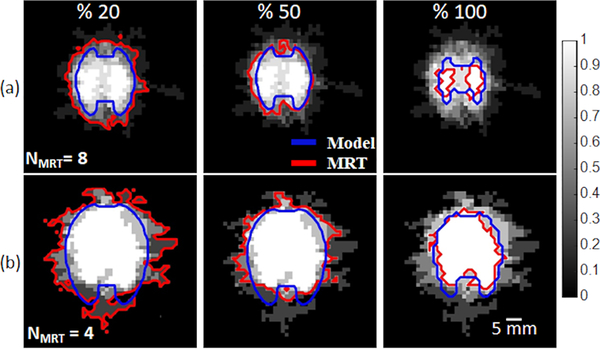
The sensitivity of simulated experimental profiles to uncertain tissue dielectric and thermal properties and their temperature dependecies, is illustrated in Fig. 9. The data are presented as the average of the binary ablation maps across multiple experiments. Also illustrated are 20%, 50%, and 100% contours from both simulations and experiments, which provide an interpretation of the likelihood of ablation for a given location.
FIG. 9.
Probability of tissue being ablated in experimentally measured and simulated Arrhenuis thermal damage map with P = 30 W followed by (a) 5 min and (b) 10 min ablation duration. 210 simulations and NMRT number of MR-guided experiments were used to calculate the probability map.
4. DISCUSSION
Validation of MWA computational models would contribute to applying models to their full potential for ablation device design and characterization, comparative assessment of energy delivery strategies, and patient-specific pre-treatment planning. The objective of this work was to integrate a MWA system with 3T MRI, and to use the volumetric MR thermometry as a means for validating computational models. The MR-guided MWA platform that we developed offered 3D temperature measurements during ablation experiments in ex vivo tissue, facilitating comparison against simulated temperatures in both axial and coronal planes. The present study considered an MWA applicator with a cylindrically symmetric pattern, similar to applicators in current clinical use, inserted within a homogenous medium. If evaluating thermal ablation profiles within more heterogeneous media, as in the clinical context, or when considering emerging MWA applicators with directional control of radiation [41], measurement of the 3D temperature profiles and ablation patterns enabled by the presented technique would offer considerably more detailed characterization of ablation profiles in contrast to the widely-used point-based temperature measurement which enables model assessment at only a few discrete points [10]. Evaluating the performance of computational models by insertion of few temperature probes not only monitors temperature in just few points at the location of temperature probes but it presents source of variability due to the inherent uncertainty in accurately localizing the temperature probe position relative to the ablation applicator.
Similar to several other prior studies [32]–[34], we employed fast spoiled GRE sequence (FLASH on Siemens scanners and SPGR on GE scanners) as the thermometry sequence. This sequence was selected as it has previously been validated for MR thermometry monitoring of ablation, although it is noted that several other thermometry sequences are available for monitoring tissue ablation, as reviewed in [23]. Since MRT measurements are known to be sensitive to B0 magnetic field inhomogeneity, which can be affected by the insertion of MWA applicator, we measured temperature changes in an agar phantom within regions of interest in proximity to the MWA applicator (5 mm) and distant (27 mm) from the applicator. Without any applied microwave power (i.e. no heating), standard deviation of MRT data over time at 5 mm was in the range of 0.38 – 0.47 °C, while the standard deviation of MRT data over time at 27 mm was in the range 0.37 – 0.41 °C. These results indicate that introducing our applicator into the tissue did not have a significant impact on the uncertainty of MRT data (see Fig. S2 in the supplementary material). While prior studies [35] noted considerable impact of artifacts in proximity to metallic ablation probes, limited artifact may have been observed in the present study since the water-cooled ablation applicator does not have any metallic components in direct contact with tissue; rather, the antenna is surrounded by circulating water that is enclosed by plastic tubes.
Temperature profiles measured by MRT were used to comparatively assess the validity of the MWA computational model (Fig. 5 and Fig. 6). The mean absolute error (MAE %), expressed as a percentage of maximum change in temperature, of MRT measured and model predicted temperatures at different ROIs was 5.91 ± 1.1 %. Radial temperature profiles at multiple time-points during the experiment and different locations relative to the distal point of the applicator were then compared. As a result of this comparison, the average of MAE % was 7.4 ± 0.7. These data indicate that although discrepancies between model predicted and experimentally measured temperatures can be quite large, in regions at the periphery of the ablation zone, simulated and measured temperatures are generally well aligned. We note that the presence of the MWA applicator may cause an artifact in the anatomical (i.e. magnitude) images acquired by FLASH sequence [42]. This may decrease the accuracy of locating the MWA applicator tip, which was used as a reference for temperature comparison between experimental and simulated temperatures. This may also be a source of discrepancy between MR-measured and simulated temperatures at different ROIs or radially measured temperatures especially in the proximity of the applicator (Fig. 5 and 6). We also anticipate the asymmetric water inflow inside the applicator as another potential source of discrepancy. While fabricating the microwave applicator, we attempted to center the inner conductor in the water inflow tube, however, it may have been slightly shifted toward one side of the water inlet tubing. In this case, the cooling effect would be higher on one side of the applicator relative to the other side while the cooling effect remains symmetric within the computational model. In Fig. 6, the discrepancy in the temperature measurements that are distances further from the applicator are primarily in regions with blood vessels, that are filled with air in this ex vivo tissue model.
A widely used approach for validation of MWA computational models is to compare experimental measurements of the extent of visible tissue discoloration, with simulated ablation zone, either using a thermal damage model, or with a temperature isotherm [10]. Another widely used approach is to compare transient temperatures at select discrete points with model predictions at corresponding locations [5]–[7]. Volumetric assessment, with MRT, enables both spatial and temporal comparison of temperature profiles and ablation zone size and shape (Fig. 7 and Fig. 8). It’s noteworthy that in a few experiments, high power microwave exposure, P > 40 W (n = 4) or long duration of ablation exposure, t = 600 s (n = 2) were associated with extensive water vaporization in proximity to the applicator, which corrupted MRT data in these regions. The discontinuity in the thermal damage profile of the transaxial views of Fig. 7 (c) is a result of this incident. Due to this limitation, conventional MRT measurements may not be an appropriate technique for monitoring tissue temperatures reaching elevated temperatures in excess of 100 °C, as are commonly observed during MWA. In spite of this limitation, the ability of MRT to provide volumetric assessment of ablation profiles, as well as accurately capture transient temperature profiles in regions below 100 °C, offers considerable added information over probe-based thermometry techniques.
We found the area of regions ablated in all experiments was 283 mm2, and the area of regions ablated in only one experiment was 411 mm2 (Figs. 8 and 9). In contrast, the corresponding areas of these regions in simulations were 327 mm2 and 395 mm2, respectively, after conducting 210 simulations using the Morris method. The relatively smaller difference between these areas in simulation suggests that, for the power levels and ablation durations considered in this study, the ablation zone is relatively insensitive to variability in tissue physical properties. This may be attributed to the applicator design, where the antenna is surrounded by a relatively static, high dielectric constant medium, achieved by circulating chilled water through the applicator up to the distal radiating tip. Prior sensitivity studies of MWA [9], [43] suggested larger variations due to uncertainty in tissue properties, but the antennas considered in those studies did not have water circulated to the radiating tip. The relatively larger variations observed in experiments may be due to additional sources of uncertainty not accounted for within simulations. These include variations in MRT slice localization relative to the applicator across various simulations and ablation zones affected by steam transport within vessels during these ex vivo tissue experiments. Nevertheless, the 100% contours from experiments and simulations were 283 mm2 and 327 mm2 and, the 50% contours from experiments and simulations were 503 mm2 and 406 mm2, respectively, indicating the model’s ability to represent the ablation zone profiles observed experimentally.
This study had several limitations. During MWA, the center of ablation region in the proximity of applicator loses water first and the water is driven outwards, evaporates and may recondense in cooler regions away from the applicator [5], [44]. This effect was not incorporated in the 3D computational model we used for the assessment. Furthermore, changes in tissue physical properties at elevated temperatures (Table I) were modeled as functions of temperature alone, based on the currently available models in the literature. However, it is plausible that tissue properties may also be a function of rate of heating, in addition to temperature. The impact of rate of heating and tissue water transport may be of most significance in proximity to the applicator, where the highest temperatures are observed, and could thus have contributed to the discrepancy between model and experiment in these regions. However, not accounting for these changes is not anticipated to have a significant impact on the extent of the ablation zone, which is governed by more temperatures at distances ~10–15 mm from the applicator [5]. Furthermore, our computational models did not account for tissue shrinkage [45], [46].
5. Conclusion
We have developed a system for characterizing 3D transient temperature profiles with MR thermometry in ex vivo tissue during 2.45 GHz MWA, and applied the system for experimental validation of MWA computational models. Experimentally measured and simulated temperatures as a function of time and distance were compared at multiple locations along the MWA applicator length and were in agreement with DSC in the range of 0.75 – 0.8. Ablation zone shape was also compared between MRT-derived and model-predicted using thermal damage profile. The average of MAE % were in the range of 5 % – 8.5 %. These results report on the validity of transient temperature and ablation profiles predicted by the state-of-art computational models of microwave ablation and pave the way for further development and investigation of models for ultimate application in pre-treatment planning of MWA ablation procedures.
Supplementary Material
Ackwnowledgements
This work was supported by NIH grant R01 CA 218357 and by a grant from Broncus Medical, Inc. MRI data was acquired at the Hoglund Brain Imaging Center at University of Kansas medical Center; The Hoglund Brain Imaging Center is supported by a generous gift from Forrest and Sally Hoglund and funding from the National Institutes of Health (S10 RR29577 and UL1 RR033179).
Footnotes
Conflicts of interest
The authors have no conflict to disclose.
References
- [1].Cavagnaro M, Amabile C, Bernardi P, Pisa S, and Tosoratti N, “A minimally invasive antenna for microwave ablation therapies: design, performances, and experimental assessment,” IEEE Trans. Biomed. Eng, vol. 58, no. 4, pp. 949–959, 2010. [DOI] [PubMed] [Google Scholar]
- [2].Cavagnaro M, Amabile C, Cassarino S, Tosoratti N, Pinto R, and Lopresto V, “Influence of the target tissue size on the shape of ex vivo microwave ablation zones,” Int. J. Hyperthermia, vol. 31, no. 1, pp. 48–57, 2015. [DOI] [PubMed] [Google Scholar]
- [3].Brace CL, “Dual-slot antennas for microwave tissue heating: Parametric design analysis and experimental validation,” Med. Phys, vol. 38, no. 7, pp. 4232–4240, 2011. [DOI] [PMC free article] [PubMed] [Google Scholar]
- [4].Faridi P, Bossmann SH, and Prakash P, “Simulation-based design and characterization of a microwave applicator for MR-guided hyperthermia experimental studies in small animals,” Biomed. Phys. Eng. Express, 2019. [DOI] [PMC free article] [PubMed] [Google Scholar]
- [5].Chiang J, Wang P, and Brace CL, “Computational modelling of microwave tumour ablations,” Int. J. Hyperthermia, vol. 29, no. 4, pp. 308–317, 2013. [DOI] [PMC free article] [PubMed] [Google Scholar]
- [6].Lopresto V, Pinto R, Lovisolo GA, and Cavagnaro M, “Changes in the dielectric properties of ex vivo bovine liver during microwave thermal ablation at 2.45 GHz,” Phys. Med. Biol, vol. 57, no. 8, p. 2309, 2012. [DOI] [PubMed] [Google Scholar]
- [7].Ji Z and Brace CL, “Expanded modeling of temperature-dependent dielectric properties for microwave thermal ablation,” Phys. Med. Biol, vol. 56, no. 16, p. 5249, 2011. [DOI] [PMC free article] [PubMed] [Google Scholar]
- [8].Wang P and Brace CL, “Tissue dielectric measurement using an interstitial dipole antenna,” IEEE Trans. Biomed. Eng, vol. 59, no. 1, pp. 115–121, 2011. [DOI] [PMC free article] [PubMed] [Google Scholar]
- [9].Sebek J, Albin N, Bortel R, Natarajan B, and Prakash P, “Sensitivity of microwave ablation models to tissue biophysical properties: A first step toward probabilistic modeling and treatment planning,” Med. Phys, vol. 43, no. 5, p. 2649, May 2016, doi: 10.1118/1.4947482. [DOI] [PubMed] [Google Scholar]
- [10].Cavagnaro M, Pinto R, and Lopresto V, “Numerical models to evaluate the temperature increase induced by ex vivo microwave thermal ablation,” Phys. Med. Biol, vol. 60, no. 8, pp. 3287–3311, Apr. 2015, doi: 10.1088/0031-9155/60/8/3287. [DOI] [PubMed] [Google Scholar]
- [11].Lyons GR and Pua BB, “Ablation Planning Software for Optimizing Treatment: Challenges, Techniques, and Applications,” Tech. Vasc. Interv. Radiol, vol. 22, no. 1, pp. 21–25, Mar. 2019, doi: 10.1053/j.tvir.2018.10.005. [DOI] [PubMed] [Google Scholar]
- [12].Prakash P, Salgaonkar VA, and Diederich CJ, “Modelling of endoluminal and interstitial ultrasound hyperthermia and thermal ablation: Applications for device design, feedback control and treatment planning,” Int. J. Hyperthermia, vol. 29, no. 4, pp. 296–307, 2013. [DOI] [PMC free article] [PubMed] [Google Scholar]
- [13].Fuentes D, Walker C, Elliott A, Shetty A, Hazle JD, and Stafford RJ, “Magnetic resonance temperature imaging validation of a bioheat transfer model for laser-induced thermal therapy,” Int. J. Hyperthermia, vol. 27, no. 5, pp. 453–464, 2011. [DOI] [PMC free article] [PubMed] [Google Scholar]
- [14].Ryan TP and Brace CL, “Interstitial microwave treatment for cancer: historical basis and current techniques in antenna design and performance,” Int. J. Hyperthermia, vol. 33, no. 1, pp. 3–14, 2017. [DOI] [PubMed] [Google Scholar]
- [15].Kagadis GC, Katsanos K, Karnabatidis D, Loudos G, Nikiforidis GC, and Hendee WR, “Emerging technologies for image guidance and device navigation in interventional radiology,” Med. Phys, vol. 39, no. 9, pp. 5768–5781, 2012. [DOI] [PubMed] [Google Scholar]
- [16].Zhai W, Xu J, Zhao Y, Song Y, Sheng L, and Jia P, “Preoperative surgery planning for percutaneous hepatic microwave ablation,” in International Conference on Medical Image Computing and Computer-Assisted Intervention, 2008, pp. 569–577. [DOI] [PubMed] [Google Scholar]
- [17].Deshazer G, Prakash P, Merck D, and Haemmerich D, “Experimental measurement of microwave ablation heating pattern and comparison to computer simulations,” Int. J. Hyperthermia, vol. 33, no. 1, pp. 74–82, 2017. [DOI] [PMC free article] [PubMed] [Google Scholar]
- [18].Pearce JA, “Models for thermal damage in tissues: processes and applications,” Crit. Rev. Biomed. Eng, vol. 38, no. 1, 2010. [DOI] [PubMed] [Google Scholar]
- [19].Rossmanna C and Haemmerich D, “Review of temperature dependence of thermal properties, dielectric properties, and perfusion of biological tissues at hyperthermic and ablation temperatures,” Crit. Rev. Biomed. Eng, vol. 42, no. 6, pp. 467–492, 2014, doi: 10.1615/critrevbiomedeng.2015012486. [DOI] [PMC free article] [PubMed] [Google Scholar]
- [20].“Reporting of Computational Modeling Studies in Med.pdf.” Accessed: May 20, 2020 [Online]. Available: https://www.fda.gov/media/87586/download.
- [21].Egger J et al. , “RFA-cut: Semi-automatic segmentation of radiofrequency ablation zones with and without needles via optimal st-cuts,” in 2015 37th Annual International Conference of the IEEE Engineering in Medicine and Biology Society (EMBC), 2015, pp. 2423–2429. [DOI] [PubMed] [Google Scholar]
- [22].Pfannenstiel A, Keast T, Kramer S, Wibowo H, and Prakash P, “Flexible microwave ablation applicator for the treatment of pulmonary malignancies,” in Energy-based Treatment of Tissue and Assessment IX, Feb. 2017, vol. 10066, p. 100660M, doi: 10.1117/12.2255504. [DOI] [Google Scholar]
- [23].Winter L et al. , “Magnetic resonance thermometry: Methodology, pitfalls and practical solutions,” Int. J. Hyperth. Off. J. Eur. Soc. Hyperthermic Oncol. North Am. Hyperth. Group, vol. 32, no. 1, pp. 63–75, 2016, doi: 10.3109/02656736.2015.1108462. [DOI] [PubMed] [Google Scholar]
- [24].Rieke V and Pauly KB, “MR Thermometry,” J. Magn. Reson. Imaging JMRI, vol. 27, no. 2, pp. 376–390, Feb. 2008, doi: 10.1002/jmri.21265. [DOI] [PMC free article] [PubMed] [Google Scholar]
- [25].Peters RD and Henkelman RM, “Proton-resonance frequency shift MR thermometry is affected by changes in the electrical conductivity of tissue,” Magn. Reson. Med. Off. J. Int. Soc. Magn. Reson. Med, vol. 43, no. 1, pp. 62–71, 2000. [DOI] [PubMed] [Google Scholar]
- [26].Norred SE and Johnson JA, “Magnetic resonance-guided laser induced thermal therapy for glioblastoma multiforme: a review,” BioMed Res. Int, vol. 2014, 2014, Accessed: Jan. 13, 2017 [Online]. Available: http://www.hindawi.com/journals/bmri/2014/761312/abs/. [DOI] [PMC free article] [PubMed] [Google Scholar]
- [27].Chen L, Wansapura JP, Heit G, and Butts K, “Study of laser ablation in the in vivo rabbit brain with MR thermometry,” J. Magn. Reson. Imaging Off. J. Int. Soc. Magn. Reson. Med, vol. 16, no. 2, pp. 147–152, 2002. [DOI] [PubMed] [Google Scholar]
- [28].Merckel LG et al. , “First clinical experience with a dedicated MRI-guided high-intensity focused ultrasound system for breast cancer ablation,” Eur. Radiol, pp. 1–10, 2016. [DOI] [PMC free article] [PubMed] [Google Scholar]
- [29].Staruch R, Chopra R, and Hynynen K, “Hyperthermia in bone generated with MR imaging–controlled focused ultrasound: Control strategies and drug delivery,” Radiology, vol. 263, no. 1, pp. 117–127, 2012. [DOI] [PubMed] [Google Scholar]
- [30].Fite BZ et al. , “Magnetic resonance thermometry at 7T for real-time monitoring and correction of ultrasound induced mild hyperthermia,” PloS One, vol. 7, no. 4, p. e35509, 2012. [DOI] [PMC free article] [PubMed] [Google Scholar]
- [31].Hoffmann R et al. , “Preclinical evaluation of an MR-compatible microwave ablation system and comparison with a standard microwave ablation system in an ex vivo bovine liver model,” Int. J. Hyperthermia, vol. 33, no. 6, pp. 617–623, 2017. [DOI] [PubMed] [Google Scholar]
- [32].Chen JC et al. , “Prostate cancer: MR imaging and thermometry during microwave thermal ablation-initial experience,” Radiology, vol. 214, no. 1, pp. 290–297, 2000. [DOI] [PubMed] [Google Scholar]
- [33].Moriarty JA et al. , “MRI monitoring of interstitial microwave-induced heating and thermal lesions in rabbit brain in vivo,” J. Magn. Reson. Imaging JMRI, vol. 8, no. 1, pp. 128–135, Feb. 1998, doi: 10.1002/jmri.1880080125. [DOI] [PubMed] [Google Scholar]
- [34].Peters RT, Hinks RS, and Henkelman RM, “Ex vivo tissue-type independence in proton-resonance frequency shift MR thermometry,” Magn. Reson. Med, vol. 40, no. 3, pp. 454–459, 1998. [DOI] [PubMed] [Google Scholar]
- [35].Zhang Y, Poorman ME, and Grissom WA, “Dual-echo Z-shimmed proton resonance frequency-shift magnetic resonance thermometry near metallic ablation probes: Technique and temperature precision,” Magn. Reson. Med, vol. 78, no. 6, pp. 2299–2306, Dec. 2017, doi: 10.1002/mrm.26634. [DOI] [PMC free article] [PubMed] [Google Scholar]
- [36].Faridi P and Prakash P, “Experimental Validation of Computational Models of Microwave Tissue Heating with Magnetic Resonance Thermometry,” in 2018 IEEE/MTT-S International Microwave Symposium-IMS, 2018, pp. 1282–1284. [Google Scholar]
- [37].Fallahi H, Clausing D, Shahzad A, O’Halloran M, Dennedy MC, and Prakash P, “Microwave antennas for thermal ablation of benign adrenal adenomas,” Biomed. Phys. Eng. Express, vol. 5, no. 2, p. 025044, Feb. 2019, doi: 10.1088/2057-1976/ab068b. [DOI] [Google Scholar]
- [38].Shafirstein G et al. , “Conductive interstitial thermal therapy device for surgical margin ablation: in vivo verification of a theoretical model,” Int. J. Hyperth. Off. J. Eur. Soc. Hyperthermic Oncol. North Am. Hyperth. Group, vol. 23, no. 6, pp. 477–492, Sep. 2007, doi: 10.1080/02656730701591476. [DOI] [PubMed] [Google Scholar]
- [39].Bhattacharya A and Mahajan RL, “Temperature dependence of thermal conductivity of biological tissues,” Physiol. Meas, vol. 24, no. 3, pp. 769–783, Aug. 2003, doi: 10.1088/0967-3334/24/3/312. [DOI] [PubMed] [Google Scholar]
- [40].Hall SK, Ooi EH, and Payne SJ, “Cell death, perfusion and electrical parameters are critical in models of hepatic radiofrequency ablation,” Int. J. Hyperthermia, vol. 31, no. 5, pp. 538–550, 2015. [DOI] [PMC free article] [PubMed] [Google Scholar]
- [41].Pfannenstiel A et al. , “Directional Microwave Ablation: Experimental Evaluation of a 2.45-GHz Applicator in Ex Vivo and In Vivo Liver,” J. Vasc. Interv. Radiol. JVIR, Mar. 2020, doi: 10.1016/j.jvir.2020.01.016. [DOI] [PubMed] [Google Scholar]
- [42].Hoffmann R et al. , “In vitro artefact assessment of a new MR-compatible microwave antenna and a standard MR-compatible radiofrequency ablation electrode for tumour ablation,” Eur. Radiol, vol. 26, no. 3, pp. 771–779, Mar. 2016, doi: 10.1007/s00330-015-3891-0. [DOI] [PubMed] [Google Scholar]
- [43].Lopresto V, Pinto R, Farina L, and Cavagnaro M, “Microwave thermal ablation: Effects of tissue properties variations on predictive models for treatment planning,” Med. Eng. Phys, vol. 46, pp. 63–70, 2017, doi: 10.1016/j.medengphy.2017.06.008. [DOI] [PubMed] [Google Scholar]
- [44].Yang D, Converse MC, Mahvi DM, and Webster JG, “Expanding the bioheat equation to include tissue internal water evaporation during heating,” IEEE Trans. Biomed. Eng, vol. 54, no. 8, pp. 1382–1388, 2007. [DOI] [PubMed] [Google Scholar]
- [45].Brace CL, Diaz TA, Hinshaw JL, and Lee FT Jr, “Tissue contraction caused by radiofrequency and microwave ablation: a laboratory study in liver and lung,” J. Vasc. Interv. Radiol, vol. 21, no. 8, pp. 1280–1286, 2010. [DOI] [PMC free article] [PubMed] [Google Scholar]
- [46].Sommer CM et al. , “Quantification of tissue shrinkage and dehydration caused by microwave ablation: experimental study in kidneys for the estimation of effective coagulation volume,” J. Vasc. Interv. Radiol, vol. 24, no. 8, pp. 1241–1248, 2013. [DOI] [PubMed] [Google Scholar]
Associated Data
This section collects any data citations, data availability statements, or supplementary materials included in this article.


