Abstract
Objectives:
The purpose of this study was to evaluate the MRI-artifact pattern produced by titanium and zirconia dental implants with different geometries (diameter and height).
Methods:
Three titanium (Titan SLA, Straumann) and three zirconia (Pure Ceramic Implant, Straumann) dental implants differing on their design (diameter x height) were installed in porcine bone samples. Samples were scanned with a MRI (3T, T1W turbo spin echo sequence, TR/TE 25/3.5ms, voxel size 0.22×0.22×0.50 mm, scan time 11:18). Micro-CT was used as control group (80kV, 125mA, voxel size 16µm). Artifacts’ distribution was measured at vestibular and lingual sites, mesial and distal sites, and at the apex. Statistical analysis was performed with Within-ANOVA (p=0.05).
Results:
Artifacts distribution measured 2.57 ± 1.09 mm for titanium artifacts and 0.37 ± 0.20 mm for zirconia artifacts (p<0.05). Neither the measured sites (p=0.73) nor the implant geometries (p=0.43) influenced the appearance of artifacts.
Conclusion:
Artifacts were higher for titanium than zirconia implants. The artifacts pattern was similar for different dental implant geometries.
Keywords: dental implants, magnetic resonance imaging, microCT
Introduction
Magnetic resonance imaging (MRI) is a non-invasive imaging technique used for diagnosis of head and neck pathologies.1,2 One of the main advantages of using the technique is the ability to reproduce anatomical and functional structures without involving ionizing radiation. Furthermore, MRI provides a high contrast between hard and soft tissues, which is valuable for medical and dental diagnostic imaging purposes.2,3
However, the technique is susceptible to misinterpretation and diagnostic errors due to the appearance of unintended effects. The so-called artifacts are dependent not only on the system features, but also on the interaction between MRI and the scanned object. Whereas the MRI sequence parameters and phase-encoding direction can be modulated to minimize the appearance of artifacts, physical properties of the scanned object must be taken into consideration.4
For instance, in the presence of dental materials, two main types of artifacts, known as susceptibility and non-susceptibility artifacts, are expected. Susceptibility artifacts occur due to the signal loss caused by the discrepancy between magnetic susceptibility of neighboring structures. Conversely, a non-susceptibility artifact is related to eddy currents, which are induced by the alternation of gradients and radiofrequency magnetic fields.5–10
Although previous studies have confirmed MRI artifacts produced by the composition of dental implants, it is still unclear whether the dental implant geometry can influence the severity and pattern of the artifacts.11–14 Due to the variability of commercially available dental implants, the relations between dental implant features and artifacts should be further analyzed.
In this sense, the purpose of the present study was to evaluate the distribution of MRI artifacts produced by dental implants when considering different geometries (diameter and height). The rationale of this study was to verify whether the formation of artifacts could differ according to the dental implant features. The null hypothesis is that there would be no difference among MRI artifacts produced by dental implants with different geometries.
Methods and materials
Sample acquisition
Sample size was calculated based on a pilot study using G*Power (University of Düsseldorf).15Considering a statistical power of 80% and a significance level at 0.05, nine bone samples were required to detect a statistical difference between artifacts produced by dental implants with differences in their composition.
Freshly extracted porcine ribs were acquired at a local butchery and prepared by removing all soft tissues and periosteum. Specimens were sectioned with a diamond disc in order to produce bone samples measuring approximately 3 cm wide.
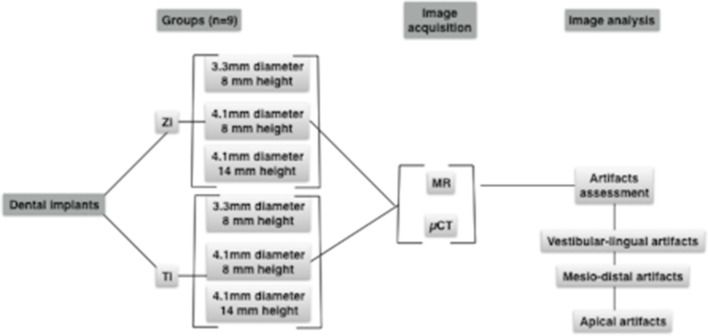
Titanium (Titan SLA, Straumann) and zirconia (Pure Ceramic Implant, Straumann) dental implants with different diameters and heights were used in this study (Figure 1). Dental implant bed preparation was performed according to the manufacturer instructions using appropriate surgical drills (Straumann GmbH, Freiburg, Germany). Prior to the experimental phase, specimens were immersed in a 3.5% formaldehyde bath for 4 weeks.
Figure 1.
Study design.
Image acquisition
Micro-computed tomography (µCT)
High accuracy images of the implant bed preparation were used as the control group. Thus, before the implants were installed, the bone samples were scanned using µCT (SkyScan 1272; Bruker, Kontich, Belgium) at 80kV, 125mA, and voxel size of 16 µm.
Magnetic resonance imaging
After installing the dental implants, MRI scans of the bone samples were performed. For this purpose, each sample was positioned in a conical plastic container measuring 25×45 mm (diameter×height) filled with ultrasound gel. T1W turbo spin echo sequence imaging was performed for each sample using a whole body 3T magnetic resonance system (Philips, Healthcare System) with 8-channel SENSE-foot/Ankle coil, TR/TE 25/3.5 ms, FOV 100×100×90, voxel size 0.22×0.22×0.50 mm, scan time 11:18, phase-encoding direction RL.
Artifact assessment
Images were assessed using an imaging software (Imalytics Preclinical, Gremse-IT GmbH, Aachen, Germany),16 which enabled segmentation of the dental implant artifact and cortical bone surrounding dental implants. A combination of manual and automatic segmentation operations were performed.
For MRI, two segmentations were applied: the first containing both cortical bone and dental implant artifacts, and the second, containing only the artifacts. Threshold values were individually determined according to the mean gray value between each artifact and air/bone. Segmentation quality was visually controlled, and when required, it was refined using morphological operations based on distance maps. For µCT, bed implant preparation and cortical bone were segmented in accordance with a mean threshold value calculated by the software.
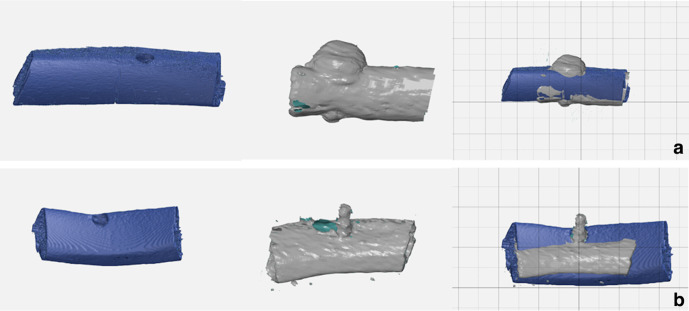
All segmentations were reconstructed in 3D images and then imported into an Inspection Software (GOM Inspect) for analysis. MRI and µCT images were spatially oriented according to the reference lines provided by the software. First, MRI and µCT segmentations containing the cortical bone were superimposed using the best-fit alignment method, adopting the cortical bone as the anatomical reference. After this, the MRI-segmentation containing only artifacts was matched to the one containing the cortical bone. Since this segmentation delineated the artifact borders better than the one containing the cortical bone, it was used for analysis (Figure 2).
Figure 2.
Superimposition of STL files. Micro-CT images (blue) of bone samples without dental implants were matched to MR images (gray) of cortical bone and dental implants. (A). Titanium implants. (B). Zirconia implants.
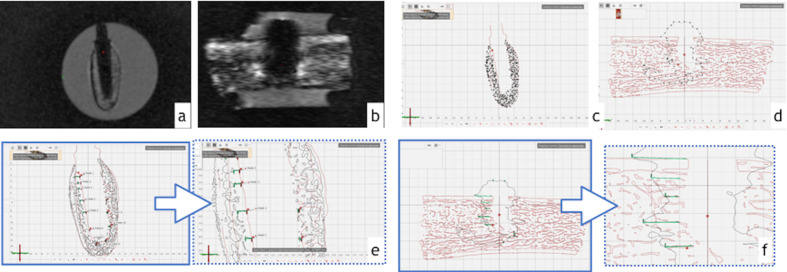
Coronal and sagittal sectional planes were created in the midpoint of dental implant bed preparation. As shown in Figure 3, measurement points were equally distributed along these sectional planes to delineate the surfaces of interest. The extensions of artifacts were determined by measuring the linear distance (mm) between implant preparation surface (µCT) and artifact borders (MRI). These measurements were performed along the implant at the following sites: vestibular-lingual (VL), mesial-distal (MD), and apex (A). Afterwards, a mean arithmetical value was calculated for each measurement site (VL, MD, A). In order to control the intrarater variability, measurements were repeated three times by the same examiner.
Figure 3.
Assessment of artifacts. (A,B) Cross-sectional images of (A) zirconia and (B) titanium dental implants. (C,D) The segmented three-dimensional images were sectioned in the midpoint of implant bed preparation for (C) zirconia and (D) titanium implants. (E, F) Distance between artifact and dental implant preparation borders were measured for (E) zirconia and (F) titanium dental implants.
Statistical analysis
Statistical analysis was performed with the software SPSS v.22.0 (IBM). Data distribution and homogeneity of variance were assessed by Shapiro-Wilk and Levene tests. Additionally, Mauchly´s test was used to evaluate the sphericity assumption. Intra-rater variability was determined by Conbrach’s alpha.
Within-ANOVA was performed to evaluate the interaction between materials (titanium and zirconia) according to the measurement sites (vestibular-lingual, mesio-distal, and apex). Implant design (3.3×8 mm; 4.1×8 mm; 4.1×14 mm) was considered a co-variant factor (p ≤ 0.05).
Results
According to adherence to the Gaussian distribution, data were described as mean ± standard deviation. Violation of sphericity was corrected by using the Greenhouse-Geisser method. Intra-rater variability was high (0.92).
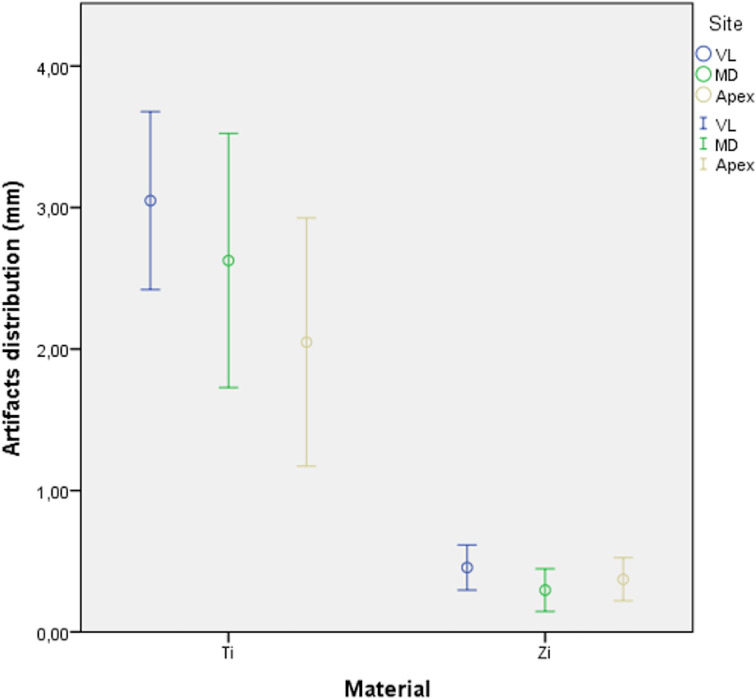
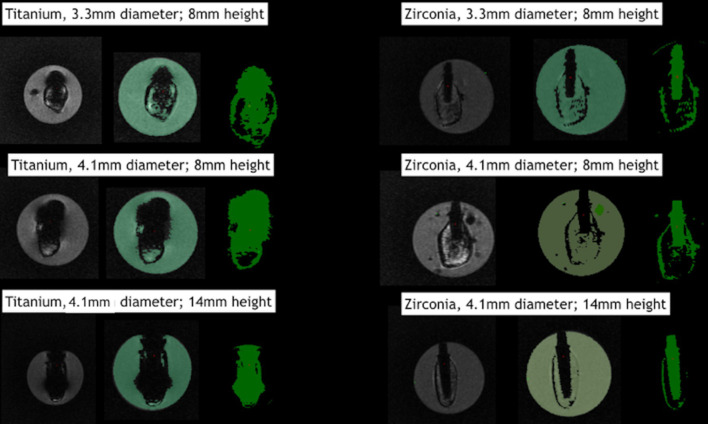
Tables 1–3 describe the artifact measurements and statistical analysis. Overall, the mean deviation was 2.57 ± 1.09 mm for titanium artifacts and 0.37 ± 0.20 mm for zirconia artifacts (Figure 4). Although statistical difference was found between dental implant materials (p<0.01), artifacts were similarly distributed among different sites (p=0.73). Additionally, dental implant geometry did not influence the extension of artifacts (p=0.43). Figure 5 shows an overview of the pattern of artifacts according to the dental implants evaluated.
Table 1.
Descriptive data (mm) for Ti and Zi dental implants with different design
| Vestibulo-lingual | Apex | Mesio-distal | |
|---|---|---|---|
| Titanium | |||
| A | 3.00 ± 1.31 | 2.33 ± 0.76 | 2.95 ± 0.86 |
| B | 2.67 ± 0.80 | 2.79 ± 0.51 | 1.60 ± 1.40 |
| C | 3.47 ± 0.68 | 1.02 ± 1.35 | 3.31 ± 0.55 |
| Zirconia | |||
| A | 0.38 ± 0.27 | 0.58 ± 0.09 | 0.29 ± 0.19 |
| B | 0.62 ± 0.14 | 0.17 ± 0.13 | 0.48 ± 0.14 |
| C | 0.35 ± 0.10 | 0.35 ± 0.04 | 0.30 ± 0.16 |
Table 2.
Statistical analysis.
| Sum of Squares | DF | Mean square | Z | p-value | |
|---|---|---|---|---|---|
| Intercept | 15,922 | 1 | 15,922 | 27,702 | <0.01 |
| Implant Design | 0,067 | 1 | 0,067 | 0,116 | 0.73 |
| Implant Material | 73,011 | 1 | 73,011 | 127,023 | <0.01 |
| Error | 8,622 | 15 | 0,575 |
DF, degree of freedom.
Table 3.
Comparison between zirconia and titanium dental implants
| Material | Mean difference | Standard error | p-value | 95% Confidence Interval | |
| Inferior | Superior | ||||
| 2.32a | 0.2 | 0 | 1.88 | 2.76 | |
statistical difference at p=0.05.
Figure 4.
Box plots showing distribution of artifacts for titanium and zirconia dental implants. Bars represent 95% CI, and circles represent mean values (mm).
Figure 5.
Artifacts distribution according to different dental implant geometries.
Discussion
The findings of this study suggested that although the artifacts overextended dental implant size in MRI images, their dimension had no influence on the extension of artifacts. In a similar manner, Ganapathi et al (2002)17 assessed the influence of titanium screws used for fixing scaphoid fractures, on susceptibility artifacts in MRI. Contrary to the findings of our study, the authors showed that longer screw lengths produced longer artifacts. Possibly, this statement is true for larger sized materials, since the height of the screws in the present study ranged from 16 to 22 mm. As the size of dental implants tends to be smaller, their influence on artifacts may not be clinically significant.
Furthermore, artifacts were similarly distributed among different sectional planes. Duttenhoefer et al. (2015)12 showed an overestimation of 36.9% in the transversal plane and 29.7 % in the longitudinal plane for titanium implants. As has been reported in previous studies,18,19 the “clover-like” pattern was related to the scanning direction. Many factors, such as the MRI sequence, parallelism between dental implants and scanner, for example, the phase-encoding direction, can influence the severity of artifacts. Thus, in a clinical situation, the artifact pattern would be possibly different according to the MRI protocol.
With regard to dental implant material, the magnitude of MRI artifacts was greater for titanium dental implants in comparison with zirconia implants. These findings are in agreement with those in the previous literature. Demirtuk Kocasarac et al. (2019)14 reported how titanium, zirconium, and titanium–zirconia dental implants generated artifacts in MRI and CBCT. The authors showed greater signal voids for dental implants containing titanium in their composition. Accordingly, our study showed that zirconia dental implants were well-depicted in MRI images, whereas titanium implants distorted peri-implant tissues surrounding dental implants to an extension of up to 3.55 mm.
Nonetheless, titanium artifacts are limited to the implant site and were more severe around the implants, thus preventing visualization of the adjacent bone.18 Although there is no evidence to support the hypothesis that dental implants affect medical diagnosis in head and neck region, it is presumed that they limit the assessment of hard and soft tissues surrounding dental implants. Hence, in cases in which MRI is required, distortions at the implant site should be taken into consideration. Conversely, zirconia implants appeared with minor distortions in MRI. Thus, the assessment of peri-implant defects around zirconia implant may be considered.13
The present study was performed by means of a T1W turbo spin echo sequence. Reports have stated that artifacts are smaller for the T1W sequence in comparison with the T2W sequence. In addition, turbo spin echo is able to provide a better image quality in comparison with gradient echo. Nonetheless, the use of a 1.5T instead of 3T-MRI, and metal artifact reduction techniques, could be beneficial to ensure that smaller artifacts would be produced.1
Artifacts were assessed in standard tesselation language (STL) files using an Inspection software. Three-dimensional analysis allows models to be matched and positioned on the same coordinate axis. As these files had common points along the surface, they could be superimposed by using a best-fit alignment method. This method is well-accepted in the literature for the assessment of three-dimensional deviation between two objects. Accordingly, superimposition of the MRI and µCT files by adopting the cortical bone surface as reference, ensured that artifact extension was measured in the same cross-sectional plane.
A limitation of this study was the need to rely on the manual selection and visual inspection of MR-threshold values. Future studies should focus on simple and accurate measurements of the distribution of artifacts, such as intraoral periapical radiograph, used as control. Furthermore, inter-rater variability would reduce the bias shown in this methodology. In addition, assessment of mixed alloys containing titanium and zirconia, such as implant-supported restorations, should be analyzed.
In summary, the findings of this study suggested that dental implant geometry did not influence the distribution of artifacts, probably due to the small size of dental implants. While zirconia implants were well-depicted in MRI images, titanium implant artifacts were limited to circular or “clover-like” patterns surrounding dental implants. The understanding of how these artifacts influence the assessment of hard and soft tissues during MRI diagnosis is beyond the scope of this study and requires further analyses.
Conclusion
Within the limitations of this study, artifacts for titanium were larger than those for zirconia dental implants. However, the distribution of artifacts was not influenced by dental implant geometry.
Footnotes
Acknowledgment: The authors express their gratitude to Straumann (Basel, Switzerland) for their support by providing the materials used on this study.
REFERENCES
- 1.Eley KA, Watt-Smith SR, Golding SJ. "Black bone" MRI: a potential alternative to CT when imaging the head and neck: report of eight clinical cases and review of the Oxford experience. Br J Radiol 2012; 85: 1457–64. doi: 10.1259/bjr/16830245 [DOI] [PMC free article] [PubMed] [Google Scholar]
- 2.Demirturk Kocasarac H, Geha H, Gaalaas LR, Nixdorf DR. Mri for dental applications. Dent Clin North Am 2018; 62: 467–80. doi: 10.1016/j.cden.2018.03.006 [DOI] [PubMed] [Google Scholar]
- 3.Flügge T, Hövener J-B, Ludwig U, Eisenbeiss A-K, Spittau B, Hennig J, et al. Magnetic resonance imaging of intraoral hard and soft tissues using an intraoral coil and flash sequences. Eur Radiol 2016; 26: 4616–23. doi: 10.1007/s00330-016-4254-1 [DOI] [PMC free article] [PubMed] [Google Scholar]
- 4.Graves MJ, Mitchell DG. Body MRI artifacts in clinical practice: a physicist's and radiologist's perspective. J. Magn. Reson. Imaging 2013; 38: 269–87. doi: 10.1002/jmri.24288 [DOI] [PubMed] [Google Scholar]
- 5.Blankenstein FH, Asbach P, Beuer F, Glienke J, Mayer S, Zachriat C. Magnetic permeability as a predictor of the artefact size caused by orthodontic appliances at 1.5 T magnetic resonance imaging. Clin Oral Investig 2017; 21: 281–9. doi: 10.1007/s00784-016-1788-1 [DOI] [PubMed] [Google Scholar]
- 6.Bryll A, Urbanik A, Chrzan R, Jurczak A, Kwapińska H, Sobiecka B. Mri disturbances caused by dental materials. Neuroradiol J 2007; 20: 9–17. doi: 10.1177/197140090702000101 [DOI] [PubMed] [Google Scholar]
- 7.Klinke T, Daboul A, Maron J, Gredes T, Puls R, Jaghsi A, et al. Artifacts in magnetic resonance imaging and computed tomography caused by dental materials. PLoS One 2012; 7: e31766. doi: 10.1371/journal.pone.0031766 [DOI] [PMC free article] [PubMed] [Google Scholar]
- 8.Blankenstein F, Truong BT, Thomas A, Thieme N, Zachriat C. Predictability of magnetic susceptibility artifacts from metallic orthodontic appliances in magnetic resonance imaging. J Orofac Orthop 2015; 76: 14–29. doi: 10.1007/s00056-014-0258-0 [DOI] [PubMed] [Google Scholar]
- 9.Chockattu SJ, Suryakant DB, Thakur S. Unwanted effects due to interactions between dental materials and magnetic resonance imaging: a review of the literature. Restor Dent Endod 2018; 43: e39: e39. doi: 10.5395/rde.2018.43.e39 [DOI] [PMC free article] [PubMed] [Google Scholar]
- 10.Imai H, Tanaka Y, Nomura N, Tsutsumi Y, Doi H, Kanno Z, et al. Three-Dimensional quantification of susceptibility artifacts from various metals in magnetic resonance images. Acta Biomater 2013; 9: 8433–9. doi: 10.1016/j.actbio.2013.05.017 [DOI] [PubMed] [Google Scholar]
- 11.Smeets R, Schöllchen M, Gauer T, Aarabi G, Assaf AT, Rendenbach C, et al. Artefacts in multimodal imaging of titanium, zirconium and binary titanium–zirconium alloy dental implants: an in vitro study. Dentomaxillofac Radiol 2017; 46: 20160267. doi: 10.1259/dmfr.20160267 [DOI] [PMC free article] [PubMed] [Google Scholar]
- 12.Duttenhoefer F, Mertens ME, Vizkelety J, Gremse F, Stadelmann VA, Sauerbier S. Magnetic resonance imaging in zirconia-based dental implantology. Clin Oral Implants Res 2015; 26: 1195–202. doi: 10.1111/clr.12430 [DOI] [PubMed] [Google Scholar]
- 13.Hilgenfeld T, Prager M, Schwindling FS, Heil A, Kuchenbecker S, Rammelsberg P, et al. Artefacts of implant-supported single crowns - Impact of material composition on artefact volume on dental MRI. Eur J Oral Implantol 2016; 9: 301. [PubMed] [Google Scholar]
- 14.Demirturk Kocasarac H, Ustaoglu G, Bayrak S, Katkar R, Geha H, Deahl ST, et al. Evaluation of artifacts generated by titanium, zirconium, and titanium-zirconium alloy dental implants on MRI, CT, and CBCT images: a phantom study. Oral Surg Oral Med Oral Pathol Oral Radiol 2019; 127: 535–44. doi: 10.1016/j.oooo.2019.01.074 [DOI] [PubMed] [Google Scholar]
- 15.Faul F, Erdfelder E, Lang A-G, Buchner A. G*Power 3: a flexible statistical power analysis program for the social, behavioral, and biomedical sciences. Behav Res Methods 2007; 39: 175–91. doi: 10.3758/BF03193146 [DOI] [PubMed] [Google Scholar]
- 16.Gremse F, Stärk M, Ehling J, Menzel JR, Lammers T, Kiessling F. Imalytics preclinical: interactive analysis of biomedical volume data. Theranostics 2016; 6: 328–41. doi: 10.7150/thno.13624 [DOI] [PMC free article] [PubMed] [Google Scholar]
- 17.Ganapathi M, Joseph G, Savage R, Jones AR, Timms B, Lyons K. Mri susceptibility artefacts related to scaphoid screws: the effect of screw type, screw orientation and imaging parameters. J Hand Surg Br 2002; 27: 165–70. doi: 10.1054/JHSB.2001.0717 [DOI] [PubMed] [Google Scholar]
- 18.Jungmann PM, Agten CA, Pfirrmann CW, Sutter R. Advances in MRI around metal. J Magn Reson Imaging 2017; 46: 972–91. doi: 10.1002/jmri.25708 [DOI] [PubMed] [Google Scholar]
- 19.Murakami S, Verdonschot RG, Kataoka M, Kakimoto N, Shimamoto H, Kreiborg S. A standardized evaluation of artefacts from metallic compounds during fast MR imaging. Dentomaxillofac Radiol 2016; 45: 20160094. doi: 10.1259/dmfr.20160094 [DOI] [PMC free article] [PubMed] [Google Scholar]


