

Abstract
Objectives
To examine the joint associations of accelerometer-measured physical activity and sedentary time with all-cause mortality.
Methods
We conducted a harmonised meta-analysis including nine prospective cohort studies from four countries. 44 370 men and women were followed for 4.0 to 14.5 years during which 3451 participants died (7.8% mortality rate). Associations between different combinations of moderate-to-vigorous intensity physical activity (MVPA) and sedentary time were analysed at study level using Cox proportional hazards regression analysis and summarised using random effects meta-analysis.
Results
Across cohorts, the average time spent sedentary ranged from 8.5 hours/day to 10.5 hours/day and 8 min/day to 35 min/day for MVPA. Compared with the referent group (highest physical activity/lowest sedentary time), the risk of death increased with lower levels of MVPA and greater amounts of sedentary time. Among those in the highest third of MVPA, the risk of death was not statistically different from the referent for those in the middle (16%; 95% CI 0.87% to 1.54%) and highest (40%; 95% CI 0.87% to 2.26%) thirds of sedentary time. Those in the lowest third of MVPA had a greater risk of death in all combinations with sedentary time; 65% (95% CI 1.25% to 2.19%), 65% (95% CI 1.24% to 2.21%) and 263% (95% CI 1.93% to 3.57%), respectively.
Conclusion
Higher sedentary time is associated with higher mortality in less active individuals when measured by accelerometry. About 30–40 min of MVPA per day attenuate the association between sedentary time and risk of death, which is lower than previous estimates from self-reported data.
Keywords: accelerometer, sedentary, meta-analysis, death
Introduction
Low levels of physical activity and high amounts of sedentary time are associated with higher risks for morbidity and mortality.1–6 Some previous meta-analyses concluded that the associations between sedentary behaviours and morbidity and mortality are independent of physical activity.2 3 In contrast, other large-scale, meta-analyses and cohort studies examining the joint associations between physical activity and sedentary behaviours suggest that high levels of physical activity attenuate or even eliminate the associations between sitting time with all-cause and cardiovascular disease mortality.4–6 However, the amount of time in moderate-to-vigorous-intensity physical activity (MVPA) that was needed to eliminate the risk of mortality associated with sitting time varied between studies.4 6
Previous studies relied on self-reported exposure data for assessing the joint associations between physical activity and sedentary behaviours with mortality.4–6 Self-reported assessment of physical activity and sedentary behaviours is prone to misclassification and socialdesirability bias, likely underestimates sedentary time, and has limited validity for estimating both light-intensity and total amount of physical activity.7 8 Furthermore, the potential impact of these biases may be compounded when combining information from two self-reported behaviours. For example, a previous meta-analysis comprising more than one million adults suggested that 60–75 min of daily MVPA was needed to eliminate the increased risk of death associated with sitting time,4 whereas others concluded that physical activity equivalent to meeting the current recommendations of 150–300 min of MVPA per week effectively attenuated the association between sitting and risk of death.6 Thus, the amount of physical activity needed to attenuate or even eliminate the higher risk of death associated with sedentary behaviours remains unclear.
The aim of this study was to examine the associations between different combinations (nine mutually exclusive groups) of physical activity and sedentary time with all-cause mortality using more precise accelerometer-derived measures. First, we examined the joint associations of total physical activity or time spent in MVPA (min/day) and different combinations of sedentary time with all-cause mortality. As a secondary aim, we examined whether the association between sedentary time and all-cause mortality differed across strata of total physical activity or time spent in MVPA, to understand whether the associations between sedentary time and mortality differ by levels of physical activity. We used data from nine prospective cohort studies from four countries that were harmonised at study level and thereafter meta-analysed.
Methods
Studies
Nine studies identified from a systematic review were included (see online supplemental materials). Study selection, data extraction and bias assessment are described in online supplemental materials. Details of participants, case ascertainment, accelerometer device and covariates of the included studies are described in online supplemental table 1.9–17 Three of the studies were nationally representative samples of adults in Norway,17 Sweden12 and USA.15 Since our previous publication,1 where we examined the associations between sedentary time and different intensities of physical activity and mortality separately, we have updated mortality data from the National Health and Nutrition Examination Survey (NHANES) providing a median follow-up period of 10.5 years, during which 1065 participants died (previously, 6.5 years and 492 deaths). The sample weights and the complex survey design of the NHANES were accounted for prior to analyses.15
bjsports-2020-103270supp001.pdf (706.5KB, pdf)
Harmonisation of exposure data
When combining data across different studies, data harmonisation enhances the validity of findings since different studies used different research methods (eg, assessment of what constitutes valid wear; determination of physical activity intensity, etc). The harmonisation process included reprocessing all individual accelerometer data and thereafter reanalysing individual study data according to a standardised protocol (available on request) by the participating study teams. Seven studies assessed physical activity and sedentary time with a version of the Actigraph accelerometer9 10 12–14 17 18 and two with an Actical accelerometer.10 16 We extracted data from the vertical axis in 60 s epochs for harmonisation purposes. Non-wear time was defined as ≥90 consecutive minutes of zero counts per minute (CPM), allowing for up to 2 min of non-zero counts if the interruption was preceded or followed by ≥30 min of zero CPM.18 We included all participants who recorded at least 10 hours of wear time per day for four or more days. Total physical activity was defined by total counts per day/wear time per day in minutes (CPM). Sedentary time was defined as time spent at ≤100 CPM19 20 and MVPA as ≥1952 CPM21 and ≥153522 for studies using the Actigraph and Actical accelerometers, respectively.
Analyses
All participating studies first categorised their participants into thirds for total physical activity (CPM), time spent in MVPA and sedentary time. To control for individual differences in wear time, sedentary time and time spent in MVPA were expressed as a percentage of total daily wear time before creating the tertiles. Individual studies thereafter performed joint analyses of total physical activity (CPM) combined with daily sedentary time expressed as percentage of wear time, and daily MVPA (% wear time) combined with daily sedentary time (% wear time) in relation to all-cause mortality. Participants who were both most physically active (ie, top third) and least sedentary (ie, bottom third) formed the referent group. Effect sizes were estimated using Cox proportional hazards regression analyses with 95% CIs. Analyses were restricted to those aged ≥40 years. Study specific analyses were harmonised according to various levels of adjustment. Model 1 (crude model) was adjusted for age and sex (when applicable); model 2 (model 1+ adjustment for socioeconomic status and body mass index (BMI)) and model 3 (model 2+ adjustment for covariates included in each study’s published final multivariable-adjusted model (all cohorts, except one,10 adjusted for smoking and presence of prevalent diseases or self-reported poor health; see online supplemental table 1 for details). In our final model (model 4), we excluded all deaths within the first 2 years of follow-up and analysed the data with the same adjustment as for model 3.
In stratified analyses (stratification by total physical activity and MVPA), we assessed whether the dose–response association between sedentary time and all-cause mortality differed between groups with different levels of physical activity, always using those least sedentary (bottom third) as the referent. These analyses were performed using the same models (1–4) of adjustment as described above for the joint association analyses.
Individual study summary data were meta-analysed with a DerSimonian and Laird random effects model yielding eight pooled HRs with 95% CIs for joint association analyses. We assessed heterogeneity by I2 statistics.
Participant and study-level characteristics may modify associations between physical activity, sedentary time and mortality. As analyses were performed separately for each study, we were only able to examine study-level characteristics. To examine the generalisability, we conducted subgroup analyses repeating the multivariable adjusted, joint analyses by categorising individual studies into studies based on national samples (Activity Behaviour Change (ABC), Sweden; Norwegian National Physical Activity Survey (NNPAS), Norway; NHANES, USA) and non-national samples (British Regional Heart Study, UK; European Prospective Investigation into Cancer and Nutrition, Norfolk, UK; Framingham Heart Study, USA; The REasons for Geographic and Racial Differences in Stroke, US; Walking Away from Type 2 Diabetes, UK; Women’s Health Study, USA).
In sensitivity analysis, we excluded one study at a time and repeated all analyses; the findings were unchanged (data not shown). We also reanalysed our data and estimated summary HRs across studies with the fixed effects inverse variance method, and the main findings were unchanged (data not shown). Further, we examined whether unmeasured or residual confounding may have biased or ‘explained away’ our findings by estimating the E-value for the joint association between sedentary time, MVPA and mortality23 according to model 4.
Patient and public involvement
No patients were involved in the planning, design or research idea for this systematic review. Nor were they involved in the analyses or data collection for the work. We did not evaluate whether the individual studies included in the review had any patient involvement.
Results
In total, 44 370 participants (69.7% women; mean age 65.8 years, SD 8.6 years) were available for meta-analysis of the joint and stratified associations between physical activity and sedentary time with all-cause mortality. They were followed for 4.0–14.5 years (median 6.0 years; 266 220 person years), during which 3451 (7.8%) participants died.
Table 1 summarises the characteristics of the participants by study. Participants from the three nationally representative samples (ABC, NHANES and NNPAS) were younger and generally more active and spent less time sedentary compared with participants from the remaining studies. Across all cohorts, time spent sedentary, expressed as percentage of daily wear time varied between 57.5% and 82.0% in the least and most sedentary cohorts, respectively. Time spent in MVPA (% of daily wear time) varied fourfold between cohorts from 0.8% to 3.9%. Online supplemental table 2 shows the study specific medians (IQR) of total physical activity, sedentary time and MVPA by tertiles.
Table 1.
Descriptive characteristics of participants
| Study | WAT2D | REGARDS | ABC | BRHS | |||
| Men (n=411) |
Women (n=243) |
Men (n=3580) |
Women (n=4282) |
Men (n=371) |
Women (n=463) |
Men (n=1412) |
|
| Age (year) | 64.4 (7.0) | 62.3 (8.8) | 69.9 (8.4) | 68.2 (8.7) | 53.1 (10.5) | 52.6 (10.1) | 78.4 (4.6) |
| Height (m) | 1.74 (0.07) | 1.60 (0.06) | 1.78 (0.07) | 1.63 (0.07) | 1.79 (0.06) | 1.66 (0.06) | 1.71 (0.07) |
| Weight (kg) | 93.6 (16.2) | 87.0 (17.0) | 89.6 (16.5) | 77.1 (17.8) | 83.3 (10.6) | 69.8 (11.7) | 79.7 (12.6) |
| BMI (kg/m2) | 30.8 (4.7) | 34.0 (5.8) | 28.3 (4.7) | 28.9 (6.3) | 25.9 (3.0) | 25.4 (3.9) | 27.1 (3.8) |
| Normal-weight (%) | 7.3 | 3.7 | 23.7 | 29 | 41.4 | 55.2 | 29 |
| Overweight (%) | 40.4 | 21.4 | 47.1 | 33.9 | 49.7 | 32.3 | 51.2 |
| Obese (%) | 52.3 | 74.9 | 29.2 | 37.1 | 8.8 | 12.5 | 19.8 |
| Wear time (min/day) | 852 (216) | 843 (209) | 850 (282) | 846 (268) | 909 (211) | 881 (213) | 844 (246) |
| Mean counts (CPM) | 318 (147) | 258 (116) | 103 (78) | 84 (64) | 358 (89) | 341 (211) | 186 (80) |
| Sedentary (hours/day) | 9.6 (1.5) | 8.7 (1.5) | 11.5 (1.4) | 11.6 (1.4) | 8.7 (1.7) | 8.4 (1.6) | 10.2 (1.4) |
| Sedentary (%) | 63 | 62 | 81.2 | 82 | 57.6 | 57.5 | 72.3 |
| MVPA (min/day) | 32.0 (26.6) | 19.1 (17.3) | 9.8 (14.9) | 6.6 (11.6) | 35.5 (30.0) | 30.5 (30.6) | 15.6 (17.6) |
| MVPA (%) | 3.8 | 2.2 | 1.1 | 0.8 | 3.9 | 3.5 | 1.8 |
| Study | WHS | FHS | NHANES | NNPAS | EPIC-NORFOLK | ||||
| Women (n=16 738) |
Men (n=1225) |
Women (n=1396) |
Men (n=1977) |
Women (n=2001) |
Men (n=1243) |
Women (n=1371) |
Men (n=3432) | Women (n=4225) |
|
| Age (year) | 72.0 (5.7) | 64.7 (9.6) | 64.6 (9.1) | 57.1 (12.5) | 58.3 (12.2) | 57.2 (10.8) | 55.8 (11.0) | 71.1 (7.6) | 69.7 (7.5) |
| Height (m) | 1.64 (0.1) | 1.75 (0.07) | 1.61 (0.06) | 1.76 (0.08) | 1.62 (0.07) | 1.79 (0.06) | 1.66 (0.06) | 1.74 (0.07) | 1.61 (0.06) |
| Weight (kg) | 70.7 (14.2) | 88.7 (15.7) | 71.2 (15.8) | 88.8 (18.8) | 75.4 (18.6) | 84.8 (12.4) | 69.6 (12.0) | 82.1 (12.7) | 68.8 (12.7) |
| BMI | 26.2 (5.0) | 29.0 (4.6) | 27.6 (5.8) | 28.6 (5.5) | 28.7 (6.7) | 26.3 (3.4) | 25.1 (4.2) | 27.2 (3.7) | 26.7 (4.7) |
| Normal weight (%) | 46.3 | 16.9 | 35.7 | 22.3 | 25.5 | 28.5 | 56.4 | 27.9 | 40.6 |
| Overweight (%) | 34.2 | 47.7 | 35.9 | 44.7 | 31.1 | 48.9 | 32.2 | 53.1 | 39.4 |
| Obese (%) | 19.5 | 35.4 | 28.4 | 33 | 34.4 | 12.6 | 11.4 | 18.9 | 20 |
| Wear time (min/day) | 900 (260) | 884 (288) | 875 (290) | 864 (232) | 850 (231) | 910 (247) | 905 (239) | 856 (61) | 843 (58) |
| Mean counts (CPM) | 198 (95) | 148 (144) | 129 (106) | 309 (162) | 259 (123) | 330 (150) | 325 (136) | 247 (127) | 237 (108) |
| Sedentary (hours/day) | 9.9 (1.6) | 11.2 (1.5) | 11.3 (1.4) | 8.5 (2.1) | 8.4 (1.8) | 9.6 (1.5) | 9.1 (1.4) | 9.7 (1.3) | 9.2 (1.3) |
| Sedentary (%) | 65.8 | 76.3 | 77.6 | 59.2 | 59 | 63.4 | 60.4 | 68 | 65.2 |
| MVPA (min/day) | 14.8 (16.8) | 16.9 (23.3) | 13.9 (19.7) | 25.6 (24.7) | 15.5 (16.6) | 36.9 (26.4) | 33.5 (23.5) | 33.7 (26.9) | 27.3 (21.7) |
| MVPA (%) | 1.6 | 1.9 | 1.6 | 3 | 1.8 | 4.1 | 3.7 | 3.9 | 3.2 |
Data are mean (SD).
BMI, body mass index; BRHS, British Regional Heart Study; CPM, counts per minute; EPIC, European Prospective Investigation into Cancer; FHS, Framingham Heart Study; MVPA, moderate-to-vigorous intensity physical activity; NHANES, National Health and Nutrition Examination Survey; NNPAS, Norwegian National Physical Activity Survey; REGARDS, The REasons for Geographic and Racial Differences in Stroke; WAT2D, Walking Away from Type 2 Diabetes; WHS, Women’s Health Study.
Joint associations: total physical activity and sedentary time
In multivariable-adjusted models (age, sex when applicable, socioeconomic position, BMI, smoking, presence of prevalent diseases or self-reported poor health, and other putative confounding factors displayed in online supplemental table 1) and excluding deaths within the first 2 years (figure 1) we observed that compared with the referent group (highest total physical activity/lowest sedentary time), the risk of all-cause mortality increased with lower levels of physical activity and greater amounts of sedentary time. Among those in the highest tertile of total activity, those in the middle and lowest tertiles of sedentary time experienced a 20% (95% CI 0.94% to 1.53%) and 88% (95% CI 0.92% to 3.84%) greater risk of death, compared with the referent group. However, these joint associations were not statistically different from the referent. As level of total physical activity decreased, the risk of death associated with greater amounts of sedentary time increased significantly. In the middle tertile of physical activity, the relative risks of mortality were 38% (95% CI 1.13% to 1.70%), 34% (95% CI 1.06% to 1.70%) and 44% (95% CI% 0.99 to 2.10%) greater across increasing tertiles of sedentary time. In the least active third, the risks were 260% (1.46% to 4.63%), 148% (95% CI 1.21% to 1.81%) and 240% (95% CI 1.85% to 3.13%) greater, respectively, across tertiles of sedentary time. Some effect estimates for extreme groups (eg, low total physical activity in combination with low sedentary time) had wide 95% CI due to small numbers. The HRs for the crude association and other less adjusted models (models 1–3) are shown in online supplemental figures 1–3.
Figure 1.
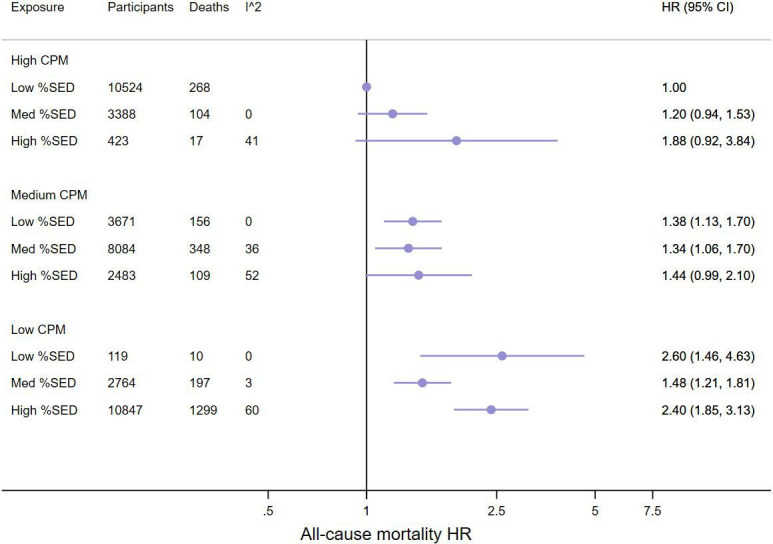
The joint association between total physical activity and sedentary time and all-cause mortality. Analyses are adjusted for age, sex when applicable, socioeconomic position, BMI, smoking, presence of prevalent diseases or self-reported poor health, and other putative confounding factors displayed in online supplemental table 1, and additionally excluding deaths within 2 years (n=42 203; 2508 deaths). Data are HRs and 95% CIs. Sedentary time is expressed as percentage of daily wear time. The median amount of total physical activity (CPM), and time (min/day) spent sedentary across tertiles were 138 CPM, 251 CPM and 396 CPM; and 8.5, 9.4 and 10.7 hours/day, respectively (see online supplemental table 2 for additional information). BMI, body mass index; CPM, counts per minute.
Joint associations: MVPA and sedentary time
In multivariable-adjusted models (age, sex when applicable, socioeconomic position, BMI, smoking, presence of prevalent diseases or self-reported poor health and other putative confounding factors displayed in online supplemental table 1) and excluding deaths within the first 2 years (model 4; figure 2) we observed similar patterns of associations as for total physical activity. Among those in the highest tertile of MVPA, the risk of death was not statistically different from the referent for those in the middle (16%; 95% CI 0.87% to 1.54%) and highest (40%; 95% CI 0.87% to 2.26%) tertiles of sedentary time. Similarly, as levels of MVPA decreased the risk of death increased. In the middle tertile of MVPA, the relative risks of death were 5% (95% CI 0.83% to 1.33%), 31% (95% CI 1.02% to 1.67%) and 68% (95% CI 1.22% to 2.30%) greater across increasing tertiles of sedentary time compared with the referent. Those in the lowest third of MVPA had an increased risk of death in all combinations with sedentary time; 65% (95% CI 1.25% to 2.19%), 65% (95% CI 1.24% to 2.21%) and 263% (95% CI 1.93% to 3.57%), respectively. The HRs for the crude association and other less adjusted models (models 1–3) are shown in online supplemental figures 4–6.
Figure 2.
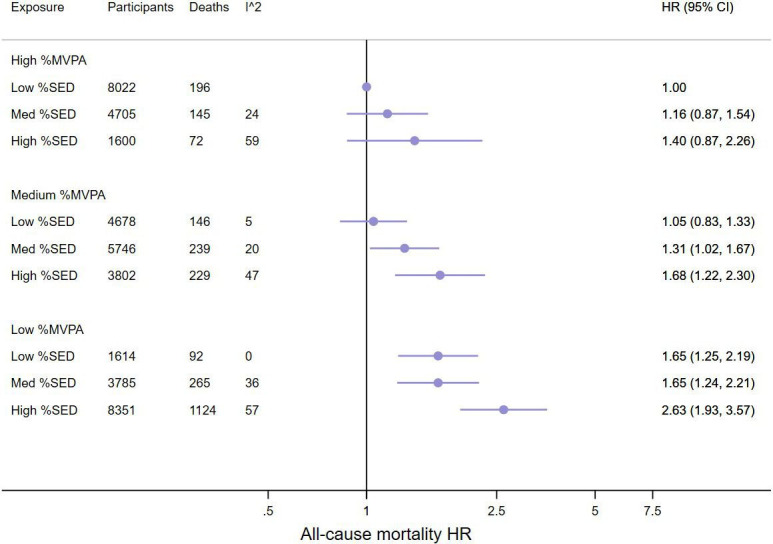
The joint association between moderate-to-vigorous-intensity physical activity (MVPA) and sedentary time and all-cause mortality. Analyses are adjusted for age, sex when applicable, socioeconomic position, BMI, smoking, presence of prevalent diseases or self-reported poor health, other putative confounding factors displayed in online supplemental table 1, and additionally excluding deaths within 2 years (n=42 203; 2508 deaths). Data are HRs and 95% CIs. sedentary time and MVPA are expressed as percentage of daily wear time. The median amount of time (min/d) spent sedentary and in mvpA (min/day) across tertiles were 8.5, 9.5 and 10.7 hours/day; and 2.3, 11.2 and 34.3 min/day, respectively (see online supplemental table 2 for additional information). BMI, body mass index.
In subgroup analyses, we examined the joint associations between time in MVPA and sedentary time with all-cause mortality separately in the nationally representative samples (n=5977, 933 deaths) and in the remaining non-national cohorts (n=36 226, 2141 deaths) (figure 3A, B). In both sub-groups, the shape of the dose–response patterns was similar to our primary analyses. However, in the nationally representative cohorts, the 95% CI overlapped 1 for all combinations between MVPA and sedentary time in the two most active tertiles and the risk of death was only statistically significantly higher for those in the lowest tertile of MVPA (figure 3A).
Figure 3.
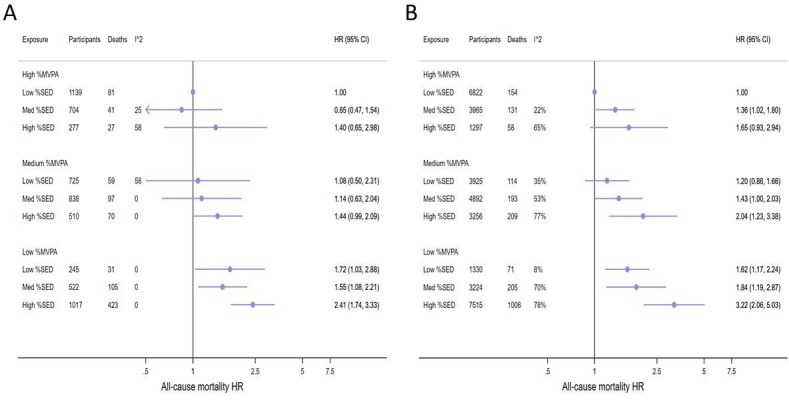
The joint association between moderate-to-vigorous-intensity physical activity (MVPA) and sedentary time (SED) and all-cause mortality categorised by national (A) and non-national cohorts (B). Data are adjusted for age, sex, BMI, socioeconomic position, smoking, presence of prevalent diseases or self-reported poor health and other putative confounding factors according to online supplemental table 1. Data are HRs and 95% CIs. Sedentary time and MVPA are expressed as percentage of daily wear time. The median amount of time (min/day) spent sedentary and in mvpA (min/day) across tertiles were 7.1, 8.6 and 10.2 hours/day; and 10.6, 27.0 and 52.2, min/day, respectively for the National cohorts (figure 3a) and 8.9, 10.1 and 11.3 hours/day; and 1.4, 9.5 and 29.7 min/day, respectively, for the non-national cohorts (figure 3B) (see online supplemental table 2 for additional information). BMI, body mass index.
Stratified analyses physical activity and sedentary time
We thereafter examined the associations between sedentary time and all-cause mortality in strata of total physical activity or time spent in MVPA using the low sedentary third as the referent to examine whether the association between sedentary time and mortality was different in different strata of physical activity (table 2). The direction of results mirrored those of the joint analysis but with all confidence intervals crossing unity for total physical activity (CPM) combined with sedentary time, an observation consistent in crude and multivariable-adjusted models. However, the highest tertile of sedentary time was consistently associated with higher risk of death within each stratum of time spent in MVPA (min/day) and HRs were similar across strata. In the final model (model 4) the risk of death was not statistically different across sedentary tertiles in the high MVPA tertile despite similar effect sizes as those from models 1–3. In some of these groups, including the referent groups, numbers of participants and of cases were low.
Table 2.
Meta-analysis for the associations between sedentary time (% of daily wear time) and all-cause mortality by levels of total physical activity (CPM) and time spent in moderate-to-vigorous-intensity physical activity (MVPA; % of daily wear time) (n=44 370; 3451 (model 1); n=42 420; 3137 (model 2); n=42 203; 3074 (model 3); n=42 303; 2508 (model 4)) (n in each cell refers to number of participants and deaths)
| Low sedentary | Medium sedentary | High sedentary | |
| Model 1* | |||
| Total PA (CPM) | |||
| Low PA | 1 (Ref) (n=122; 10) | 0.65 (0.36 to 1.18) (n=2890; 252) | 1.02 (0.58 to 1.78) (n=11 719; 1906) |
| Medium PA | 1 (Ref) (n=3810; 186) | 0.97 (0.95 to 1.26) (n=8413; 457) | 1.10 (0.71 to 1.70) (n=2589; 145) |
| High PA | 1 (Ref) (n=10 889; 348) | 1.13 (0.90 to 1.41) (n=3509; 128) | 1.55 (0.86 to 2.77) (n=429; 19) |
| MVPA | |||
| Low PA | 1 (Ref) (n=1666; 109) | 0.91 (0.73 to 1.14) (n=3973; 345) | 1.73 (1.32 to 2.27) (n=9102; 1669) |
| Medium PA | 1 (Ref) (n=4860; 184) | 1.08 (0.90 to 1.29) (n=5970; 309) | 1.50 (1.24 to 1.82) (n=3979; 304) |
| High PA | 1 (Ref) (n=8295; 251) | 1.18 (0.90 to 1.56) (n=4869; 183) | 1.61 (1.05 to 2.46) (n=1656; 97) |
| Model 2† | |||
| Total PA (CPM) | |||
| Low PA | 1 (Ref) (n=113; 10) | 0.65 (0.36 to 1.18) (n=2738; 231) | 1.04 (0.58 to 1.85) (n=11 102; 1689) |
| Medium PA | 1 (Ref) (n=3645; 175) | 1.00 (0.74 to 1.34) (n=8100; 430) | 1.08 (0.84 to 1.38) (n=2466; 132) |
| High PA | 1 (Ref) (n=10 484; 329) | 1.20 (0.94 to 1.53) (n=3368; 125) | 1.71 (0.94 to 3.10) (n=404; 16) |
| MVPA | |||
| Low PA | 1 (Ref) (n=1582; 103) | 0.98 (0.78 to 1.23) (n=3774; 319) | 1.86 (1.44 to 2.39) (n=8606; 1471) |
| Medium PA | 1 (Ref) (n=4671; 174) | 1.18 (0.95 to 1.45) (n=5751; 293) | 1.57 (1.28 to 1.91) (n=3787; 281) |
| High PA | 1 (Ref) (n=7989; 237) | 1.31 (1.03 to 1.65) (n=4678; 174) | 1.71 (1.14 to 2.59) (n=1579; 85) |
| Model 3‡ | |||
| Total PA (CPM) | |||
| Low PA | 1 (Ref) (n=112; 10) | 0.69 (0.37 to 1.26) (n=2719; 225) | 1.01 (0.56 to 1.85) (n=11 012; 1644) |
| Medium PA | 1 (Ref) (n=3628; 173) | 1.06 (0.78 to 1.46) (8068; 424) | 1.21 (0.86 to 1.72) (2456; 132) |
| High PA | 1 (Ref) (n=10 446; 327) | 1.19 (0.94 to 1.52) (n=3358; 123) | 1.80 (0.87 to 3.74) (n=404; 16) |
| MVPA | |||
| Low PA | 1 (Ref) (n=1575; 102) | 0.98 (0.77 to 1.25) (n=3746; 310) | 1.72 (1.29 to 2.29) (n=8532; 1428) |
| Medium PA | 1 (Ref) (n=4650; 173) | 1.15 (0.89 to 1.49) (n=5730; 290) | 1.51 (1.23 to 1.86) (n=3766; 279) |
| High PA | 1 (Ref) (n=7961; 235) | 1.20 (0.85 to 1.69) (n=4669; 172) | 1.75 (1.07 to 2.87) (n=1574; 85) |
| Model 4§ | |||
| Total PA (CPM) | |||
| Low PA | 1 (Ref) (n=119; 10) | 0.58 (0.33 to 1.01) (n=2764; 197) | 1.13 (0.68 to 1.94) (n=10 847; 1299) |
| Medium PA | 1 (Ref) (n=3671; 156) | 0.99 (0.72 to 1.35) (n=8084; 348) | 1.05 (0.75 to 1.47) (n=2483; 109) |
| High PA | 1 (Ref) (n=10 524; 268) | 1.22 (0.93 to 1.58) (n=3388; 104) | 2.27 (0.91 to 5.67) (n=423; 17) |
| MVPA | |||
| Low PA | 1 (Ref) (n=1614; 92) | 0.92 (0.70 to 1.20) (n=3785; 265) | 1.56 (1.09 to 2.21) (n=8351; 1129) |
| Medium PA | 1 (Ref) (n=4678; n=146) | 1.19 (0.85 to 1.66) (n=5746; 239) | 1.49 (1.14 to 1.94) (n=3675; 229) |
| High PA | 1 (Ref) (n=8022; 196) | 1.17 (0.83 to 1.65) (n=4705; 145) | 1.67 (0.98 to 2.84) (n=1600; 72) |
*Adjusted for age and sex (when applicable).
†Adjusted for age, sex (when applicable), socioeconomic status and BMI.
‡Adjusted for adjusted for age, sex (when applicable), socioeconomic status, BMI and additional covariates described in online supplemental table 1.
§Model three and excluding deaths within 2 years; boldface indicates significant association (p<0.05).
BMI, body mass index; CPM, counts per minute; MVPA, moderate-to-vigorous intensity physical activity; PA, physical activity.
Online supplemental table 3 shows the calculated E-values for all combinations for the joint association between MVPA and sedentary time and all-cause mortality, which were >2 for all combinations with the lowest tertile for MVPA or highest tertile for sedentary time. This suggests that any uncontrolled or residual confounding would have to at least double the risk of mortality to fully explain our observed associations for any combination of low MVPA or high sedentary time compared with the referent.
Discussion
Our results, obtained from a harmonised meta-analysis of accelerometer measured physical activity and sedentary time in more than 44 000 middle-aged and older men and women, indicate that physical activity and sedentary time can be combined differently to reduce the risk of premature death. The association between sedentary time and higher risk of death appears attenuated, although not completely eliminated, in those in the highest third of time spent in MVPA. In contrast, those with low physical activity (lowest third) had a higher risk of premature death, with the greatest risk of death occurring in those with the highest sedentary time. In stratified analyses, the risk of death was higher by increasing levels of time spent sedentary across strata for time in MVPA, whereas the role of total physical activity in modulating risk of death with high sedentary time was less clear.
Comparison with previous studies
These results provide a unique contribution because previous studies examining the joint associations between physical activity and sedentary time and mortality have assessed physical activity and sedentary behaviours by self-report.4 6 A previous meta-analysis suggested that between 60 and 75 min per day of leisure time physical activity of moderate intensity was needed to eliminate the risk of mortality associated with sitting time.4 While the pattern of associations is generally similar when comparing our findings with self-report,4–6 we were able to quantify the amount of time spent in MVPA needed to attenuate the risk of premature death associated with sedentary time.
Our joint analysis results suggest that about 30–40 min (median of medians=34 min; IQR: 26–48 min) of MVPA per day (online supplemental table 2) attenuated the risk of death in our most conservative model. Those with as little as 11 min per day of MVPA in combination with ‘low’ sedentary time (ie, <8.5 hours per day) did not differ in risk compared with the referent group (ie, highest third of MVPA in combination with lowest third for sedentary time). This finding may suggest that relatively low levels of MVPA, lower than the current recommendations,24–26 reduces the risk of death if combined with low levels of sedentary time. In contrast, in the lowest third of MVPA comprising those who accumulated about 2 min of MVPA per day on average, all combinations with sedentary time (ie, 8.5–10.7 hours per day) were associated with a higher risk of premature death with point estimates all higher than all combinations of sedentary time in the high MVPA category.
Subgroup analyses that categorised studies into national (ABC, NHANES, NNPAS) and non-national samples indicated that sedentary time was associated with higher risk of death in the low active third, (average MVPA of about 11 min per day of MVPA) in the national cohorts only. Compared with the non-national cohorts that accumulated about 2 min of MVPA in the least active third, the national cohorts included younger and more active individuals with a longer period of follow-up. How these characteristics may modulate the association between sedentary time and mortality requires further scrutiny when longer follow-up data are available.
Our results also indicate that the amount of MVPA needed to attenuate the risk associated with sedentary time may be lower than previously suggested using self-reported data.4 However, this is likely explained in part by differences between self-reported and accelerometer measured physical activity and sedentary behaviour. Self-reported physical activity usually only assesses specific domains, such as leisure time and recreational physical activity accumulated in bouts or categorised into specific time blocks (self-report studies typically ask about activities that last at least 10 min in duration, in keeping with previous physical activity guidelines; this 10 min minimum duration has now been removed in the most recent guidelines,24–26) whereas accelerometer measures capture more movement across multiple domains.
The recently updated physical activity guidelines from the UK, the USA and WHO24–26 recommend that adults should participate in physical activity for 150–300 minutes of at least moderate intensity every week. They also state that people should move more and sit less throughout the day and that any activity is better than none.24–26 The new guidelines from WHO26 also acknowledge the emerging evidence on the interaction between sedentary behaviour and MVPA and states that adults should aim to do more than recommended levels of MVPA to reduce the detrimental effects of high sedentary time.26 The results from this study, where physical activity and sedentary time were measured by accelerometry, suggest that accumulating time in MVPA equivalent to the upper level of the 150–300 min per week recommendation may be sufficient to attenuate the detrimental association between sedentary time and risk of premature death. Evidence is also accumulating on the beneficial effect of total physical activity1 9 27 and light intensity physical activity for longevity.1 28 In joint analyses of sedentary time and total physical activity (which includes light, moderate and vigorous intensities), we observed a higher risk of death for higher amounts of time spent sedentary in all combinations with total physical activity. However, the risk was not statistically different from the referent in the most active third of total physical activity (figure 1). In line with current physical activity recommendations,24–26 reducing sedentary time must increase total physical activity (since time in a day is finite) and thus likely reduce the risk of premature death. However, because of uncertainty in effect estimates for some cross-combinations of total activity and sedentary time, more work is needed to determine the interplay between total activity and sedentary time in relation to mortality.
The cohorts included in our meta-analyses accumulated approximately 16 min in MVPA per day. Although not directly comparable, this is lower than population-based estimates in Swedish and Norwegian men and women aged 60–85 years16 29 and comparable to US men, but higher than in US women aged 60–75 years.29 Further, time spent sedentary was almost 10 hours per day and considerably higher than comparable population-based estimates from the USA with a younger age structure.30 Thus, the associations observed between combinations of physical activity and sedentary time with mortality may not be generalisable to younger and more active populations, nor to low-income and middle-income countries.
Strengths and limitations
To our knowledge, this is the first meta-analysis examining the joint associations between physical activity, sedentary time and all-cause mortality using accelerometer measured exposure variables. Accelerometer measured physical activity has higher precision which reduces random error as compared with self-report and, importantly, minimises bias due to correlated cognitive biases in self-reported physical activity and sedentary behaviours. Additional strengths of this study include harmonisation of exposure data and study specific analyses according to a standardised protocol reducing heterogeneity due to different data reduction and data cleaning procedures. We were able to control for many potential confounders in our final model and estimated the E-value as an indicator of the potential impact of unmeasured or residual confounding.23 An uncontrolled confounder must be associated with both the exposure combination (physical activity and sedentary time) and mortality in the order of at least two to bias or negate the observed associations for those combinations including either the lowest third of MVPA or highest third of sedentary time (E-values between 2.1 and 4.63; lower CI 1.61 to 3.2; online supplemental table 3). To put this in context, the HR for all-cause mortality comparing never vs current smokers was 2.26 and 1.34 in the NHANES and NNPAS data sets, respectively. While we cannot rule out residual confounding, uncontrolled confounding would have to be as large in magnitude as smoking to distort our results. Finally, in our most conservative model, we excluded deaths within the first 2 years to reduce the risk of reverse causation bias. However, follow-up time was short (median 5.5 years) in some of the cohorts which may have a substantial impact on observed associations.31 32
Limitations of our study include its observational design. We cannot rule out reverse causation bias from prevalent medical conditions or subclinical disease despite the results excluding deaths within the first 2 years supporting our conclusion. We adjusted our analyses for several covariates including smoking and pre-existing illness or self-reported poor health in our final model but cannot exclude the possibility of residual or unmeasured confounding or other biases. Our sample included middle-aged and older individuals who were at least 40 years at baseline, and it is unclear if the results are generalisable to younger populations. Some of the groups in our analyses had low numbers of individuals and deaths making the point estimates uncertain. Low number of individuals and cases in some of the referent groups in our stratified analyses for total physical activity also makes these associations less reliable. Two different accelerometers were used by the included cohorts and these have only moderate agreement on total sedentary time for the applied cut-points,33 suggesting they assess sedentary time slightly differently. We reanalysed our data excluding one study at a time to examine if the results were influenced by a specific study and the results were not materially altered. Sedentary time estimated from movement-based cut-points may include non-sedentary behaviours such as standing. However, in the older participants, when movement was not registered over long periods, they were likely to be sedentary rather than standing with little movement. Errors in estimating MVPA and sedentary time are not completely uncorrelated as they are measured from the same device, for instance, failure to correctly identify non-wear time would increase sedentary time and subsequently lower our measure of total physical activity and MVPA in percent of wear-time. Finally, exposure variables were only measured once and change in behaviours between baseline and follow-up may have affected our results. However, accelerometer measured physical activity and sedentary time show good stability (Intra-class correlation 0.70–0.83) over two to 3 years in a 70-year-old women.34
Conclusion
Higher sedentary time is associated with higher mortality in less active individuals when measured by accelerometry. About 30–40 min of MVPA per day attenuate the association between sedentary time and risk of death, which is lower than previous estimates from self-reported data.
Key messages.
What are the findings?
Moderate-to-vigorous-intensity physical activity and sedentary time as measured by accelerometry can be combined differently to reduce the risk of premature death.
High amounts of sedentary time (>10.7 hours per day) is associated with higher risk of mortality, especially in those with low or very low levels of moderate-to-vigorous intensity physical activity.
In active individuals doing about 30–40 min of moderate-to-vigorous-intensity physical activity, the association between high sedentary time and risk of death is not significantly different from those with low amounts sedentary time.
How might it impact on clinical practice in the future?
Our work may inform the development of future recommendations for physical activity and sedentary time by WHO and other public health authorities.
Individuals who currently must spend large amounts of time sedentary due to work and transportation should aim to achieve the upper recommended level of 150–300 min of moderate-to-vigorous-intensity physical activity per week.
Acknowledgments
The authors thank all investigators, staff and participants from the individual cohorts contributing to this harmonised meta-analysis.
Footnotes
Twitter: @Ulf_Ekelund, @PARG3
Contributors: UE led the work of the writing group (JT, MWF, JSJ, BHH, SAA and I-ML) and wrote the manuscript. MWF and JT analysed the data. MWF, JT and UE had full access to study level data from all contributing studies. All authors contributed to the design of the study, interpreted the data and critically reviewed the report.
Funding: The individual studies contributing to this harmonised meta-analysis were funded from the following sources: The ABC-study was funded by Stockholm County Council, the Swedish National Centre for Research in Sports and the project ALPHA, which received funding from the European Union in the framework of the Public Health Programme and Folksam Research Foundation, Sweden; The British Regional Heart Study was funded by project and programme grants from the British Heart Foundation (PG/13/86/30546 and RG/13/16/30528); The EPIC Norfolk study has received funding from the UK Medical Research Council (MR/N003284/1), Cancer Research UK (C864/A14136), and the NIHR Biomedical Research Centre in Cambridge (IS-BRC-1215–20014); PCD is supported by a National Health and Medical Research Council of Australia research fellowship (#1142685) and PCD and KW by the UK Medical Research Council (MC_UU_12015/3); the latter grant and the NIHR Biomedical Research Centre in Cambridge (IS-BRC-1215–20014) supported Kate Westgate for processing the EPIC Norfolk data. The Framingham Heart Study’s data collection and analysis was funded by the National Institutes of Health, National Heart, Lung, and Blood Institute (NHLBI)-N01-HC25195; Health and Human Services (HHS) N268201500001I; R01-AG047645; R01-HL131029; and the American Heart Association (15GPSGC24800006); The Norwegian National Physical Activity Surveillance Study was supported by the Norwegian Directorate for Public Health and the Norwegian School of Sport Sciences. JT is funded by the Research Council of Norway (249932/F20); The REGARDS study was supported by a cooperative agreement U01-NS041588 and investigator-initiated grant R01-NS061846 from the National Institute of Neurological Disorders and Stroke of the National Institutes of Health. Additional funding was provided by an unrestricted research grant from The Coca-Cola Company; The Walking Away from type 2 Diabetes study was supported by the National Institute for Health Research (NIHR) Collaboration for Leadership in Applied Health Research and Care East Midlands; The Women’s Health Study was funded by the National Institutes of Health (NIH) grants; CA154647, CA047988, CA182913, HL043851, HL080467, and HL099355. This research has been funded in part by the intramural research programme of the National Institute on Aging (USA).
Competing interests: None declared.
Patient and public involvement: Patients and/or the public were not involved in the design, or conduct, or reporting, or dissemination plans of this research.
Patient consent for publication: Not required.
Ethics approval: Ethical approval has been granted for all individual studies but was not required for this meta-analysis.
Provenance and peer review: Not commissioned; externally peer reviewed.
Data availability statement: Data are available on reasonable request. The study-specific summary data included in the meta-analyses can be obtained from the corresponding author; ulf.ekelund@nih.no.
References
- 1. Ekelund U, Tarp J, Steene-Johannessen J, et al. Dose-Response associations between accelerometry measured physical activity and sedentary time and all cause mortality: systematic review and harmonised meta-analysis. BMJ 2019;366:l4570. 10.1136/bmj.l4570 [DOI] [PMC free article] [PubMed] [Google Scholar]
- 2. Biswas A, Oh PI, Faulkner GE, et al. Sedentary time and its association with risk for disease incidence, mortality, and hospitalization in adults: a systematic review and meta-analysis. Ann Intern Med 2015;162:123–32. 10.7326/M14-1651 [DOI] [PubMed] [Google Scholar]
- 3. Patterson R, McNamara E, Tainio M, et al. Sedentary behaviour and risk of all-cause, cardiovascular and cancer mortality, and incident type 2 diabetes: a systematic review and dose response meta-analysis. Eur J Epidemiol 2018;33:811–29. 10.1007/s10654-018-0380-1 [DOI] [PMC free article] [PubMed] [Google Scholar]
- 4. Ekelund U, Steene-Johannessen J, Brown WJ, et al. Does physical activity attenuate, or even eliminate, the detrimental association of sitting time with mortality? A harmonised meta-analysis of data from more than 1 million men and women. The Lancet 2016;388:1302–10. 10.1016/S0140-6736(16)30370-1 [DOI] [PubMed] [Google Scholar]
- 5. Ekelund U, Brown WJ, Steene-Johannessen J, et al. Do the associations of sedentary behaviour with cardiovascular disease mortality and cancer mortality differ by physical activity level? A systematic review and harmonised meta-analysis of data from 850 060 participants. Br J Sports Med 2019;53:886–94. 10.1136/bjsports-2017-098963 [DOI] [PubMed] [Google Scholar]
- 6. Stamatakis E, Gale J, Bauman A, et al. Sitting Time, Physical Activity, and Risk of Mortality in Adults. J Am Coll Cardiol 2019;73:2062–72. 10.1016/j.jacc.2019.02.031 [DOI] [PubMed] [Google Scholar]
- 7. Prince SA, Adamo KB, Hamel ME, et al. A comparison of direct versus self-report measures for assessing physical activity in adults: a systematic review. Int J Behav Nutr Phys Act 2008;5:56. 10.1186/1479-5868-5-56 [DOI] [PMC free article] [PubMed] [Google Scholar]
- 8. Warren JM, Ekelund U, Besson H, et al. Assessment of physical activity - a review of methodologies with reference to epidemiological research: a report of the exercise physiology section of the European Association of Cardiovascular Prevention and Rehabilitation. Eur J Cardiovasc Prev Rehabil 2010;17:127–39. 10.1097/HJR.0b013e32832ed875 [DOI] [PubMed] [Google Scholar]
- 9. Dempsey PC, Strain T, Khaw K-T, et al. Prospective associations of accelerometer-measured physical activity and sedentary time with incident cardiovascular disease, cancer, and all-cause mortality. Circulation 2020;141:1113–5. 10.1161/CIRCULATIONAHA.119.043030 [DOI] [PubMed] [Google Scholar]
- 10. Bakrania K, Edwardson CL, Khunti K, et al. Associations of objectively measured moderate-to-vigorous-intensity physical activity and sedentary time with all-cause mortality in a population of adults at high risk of type 2 diabetes mellitus. Prev Med Rep 2017;5:285–8. 10.1016/j.pmedr.2017.01.013 [DOI] [PMC free article] [PubMed] [Google Scholar]
- 11. Diaz KM, Howard VJ, Hutto B, et al. Patterns of sedentary behavior and mortality in U.S. middle-aged and older adults: a national cohort study. Ann Intern Med 2017;167:465–75. 10.7326/M17-0212 [DOI] [PMC free article] [PubMed] [Google Scholar]
- 12. Dohrn I-M, Sjöström M, Kwak L, et al. Accelerometer-measured sedentary time and physical activity-A 15 year follow-up of mortality in a Swedish population-based cohort. J Sci Med Sport 2018;21:702–7. 10.1016/j.jsams.2017.10.035 [DOI] [PubMed] [Google Scholar]
- 13. Jefferis BJ, Parsons TJ, Sartini C, et al. Objectively measured physical activity, sedentary behaviour and all-cause mortality in older men: does volume of activity matter more than pattern of accumulation? Br J Sports Med 2019;53:098733 10.1136/bjsports-2017-098733 [DOI] [PMC free article] [PubMed] [Google Scholar]
- 14. Lee I-M, Shiroma EJ, Evenson KR, et al. Accelerometer-Measured physical activity and sedentary behavior in relation to all-cause mortality: the women's health study. Circulation 2018;137:203–5. 10.1161/CIRCULATIONAHA.117.031300 [DOI] [PMC free article] [PubMed] [Google Scholar]
- 15. Johnson CL, Paulose-Ram R, Ogden CL, et al. National health and nutrition examination survey: Analytic guidelines, 1999–2010. National center for health statistics. Vital Health Stat 2013;2. [PubMed] [Google Scholar]
- 16. Spartano NL, Lyass A, Larson MG, et al. Objective physical activity and physical performance in middle-aged and older adults. Exp Gerontol 2019;119:203–11. 10.1016/j.exger.2019.02.003 [DOI] [PMC free article] [PubMed] [Google Scholar]
- 17. Hansen BH, Kolle E, Dyrstad SM, et al. Accelerometer-determined physical activity in adults and older people. Med Sci Sports Exerc 2012;44:266–72. 10.1249/MSS.0b013e31822cb354 [DOI] [PubMed] [Google Scholar]
- 18. Evenson KR, Wen F, Herring AH. Associations of Accelerometry-Assessed and self-reported physical activity and sedentary behavior with all-cause and cardiovascular mortality among US adults. Am J Epidemiol 2016;184:621–32. 10.1093/aje/kww070 [DOI] [PMC free article] [PubMed] [Google Scholar]
- 19. Matthews CE, Keadle SK, Troiano RP, et al. Accelerometer-measured dose-response for physical activity, sedentary time, and mortality in US adults. Am J Clin Nutr 2016;104:1424–32. 10.3945/ajcn.116.135129 [DOI] [PMC free article] [PubMed] [Google Scholar]
- 20. Wong SL, Colley R, Connor Gorber S, et al. Actical accelerometer sedentary activity thresholds for adults. J Phys Act Health 2011;8:587–91. 10.1123/jpah.8.4.587 [DOI] [PubMed] [Google Scholar]
- 21. Freedson PS, Melanson E, Sirard J. Calibration of the computer science and applications, Inc. accelerometer. Med Sci Sports Exerc 1998;30:777–81. 10.1097/00005768-199805000-00021 [DOI] [PubMed] [Google Scholar]
- 22. Colley RC, Tremblay MS. Moderate and vigorous physical activity intensity cut-points for the Actical accelerometer. J Sports Sci 2011;29:783–9. 10.1080/02640414.2011.557744 [DOI] [PubMed] [Google Scholar]
- 23. Haneuse S, VanderWeele TJ, Arterburn D. Using the E-value to assess the potential effect of unmeasured confounding in observational studies. JAMA 2019;321:602–3. 10.1001/jama.2018.21554 [DOI] [PubMed] [Google Scholar]
- 24. Piercy KL, Troiano RP, Ballard RM, et al. The physical activity guidelines for Americans. JAMA 2018;320:2020–8. 10.1001/jama.2018.14854 [DOI] [PMC free article] [PubMed] [Google Scholar]
- 25. UK Chief Medical Officers’ Physical Activity Guidelines, 2019. Available: https://assets.publishing.service.gov.uk/government/uploads/system/uploads/attachment_data/file/832868/uk-chief-medical-officers-physical-activity-guidelines.pd [Accessed 25 Nov 2019].
- 26. Bull FC, Al-Ansari S, Biddle S, et al. World Health organization 2020 guidelines on physical activity and sedentary behaviour. Br J Sports Med. [DOI] [PMC free article] [PubMed] [Google Scholar]
- 27. Lee I-M, Shiroma EJ, Kamada M, et al. Association of step volume and intensity with all-cause mortality in older women. JAMA Intern Med 2019;179:1105–12. 10.1001/jamainternmed.2019.0899 [DOI] [PMC free article] [PubMed] [Google Scholar]
- 28. Chastin SFM, De Craemer M, De Cocker K, et al. How does Light-intensity physical activity associated with adult cardiometabolic health and mortality? systematic review with meta-analysis of experimental and observational studies. Br J Sports Med 2018:097563. [DOI] [PMC free article] [PubMed] [Google Scholar]
- 29. Hagströmer M, Troiano RP, Sjöström M, et al. Levels and patterns of objectively assessed physical activity--a comparison between Sweden and the United States. Am J Epidemiol 2010;171:1055–64. 10.1093/aje/kwq069 [DOI] [PubMed] [Google Scholar]
- 30. Matthews CE, Chen KY, Freedson PS, et al. Amount of time spent in sedentary behaviors in the United States, 2003-2004. Am J Epidemiol 2008;167:875–81. 10.1093/aje/kwm390 [DOI] [PMC free article] [PubMed] [Google Scholar]
- 31. Strain T, Wijndaele K, Sharp SJ, et al. Impact of follow-up time and analytical approaches to account for reverse causality on the association between physical activity and health outcomes in UK Biobank. Int J Epidemiol 2020;49:162–72. 10.1093/ije/dyz212 [DOI] [PMC free article] [PubMed] [Google Scholar]
- 32. Tarp J, Hansen BH, Fagerland MW, et al. Accelerometer-measured physical activity and sedentary time in a cohort of US adults followed for up to 13 years: the influence of removing early follow-up on associations with mortality. Int J Behav Nutr Phys Act 2020;17:39. 10.1186/s12966-020-00945-4 [DOI] [PMC free article] [PubMed] [Google Scholar]
- 33. Duncan S, Stewart T, Bo Schneller M, et al. Convergent validity of ActiGraph and Actical accelerometers for estimating physical activity in adults. PLoS One 2018;13:e0198587. 10.1371/journal.pone.0198587 [DOI] [PMC free article] [PubMed] [Google Scholar]
- 34. Keadle SK, Shiroma EJ, Kamada M, et al. Reproducibility of accelerometer-assessed physical activity and sedentary time. Am J Prev Med 2017;52:541–8. 10.1016/j.amepre.2016.11.010 [DOI] [PMC free article] [PubMed] [Google Scholar]
Associated Data
This section collects any data citations, data availability statements, or supplementary materials included in this article.
Supplementary Materials
bjsports-2020-103270supp001.pdf (706.5KB, pdf)