Abstract
Outside sleep laboratory settings, peripheral arterial tonometry (PAT, eg, WatchPat) represents a validated modality for diagnosing obstructive sleep apnea (OSA). We have shown before that the accuracy of home sleep apnea testing by WatchPat 200 devices in diagnosing OSA is suboptimal (50%–70%). In order to improve its diagnostic performance, we built several models that predict the main functional parameter of polysomnography (PSG), Apnea Hypopnea Index (AHI). Participants were recruited in our Sleep Center and underwent concurrent in-laboratory PSG and PAT recordings. Statistical models were then developed to predict AHI by using robust functional parameters from PAT-based testing, in concert with available demographic and anthropometric data, and their performance was confirmed in a random validation subgroup of the cohort. Five hundred synchronous PSG and WatchPat sets were analyzed. Mean diagnostic accuracy of PAT was improved to 67%, 81% and 85% in mild, moderate-severe or no OSA, respectively, by several models that included participants’ age, gender, neck circumference, body mass index and the number of 4% desaturations/hour. WatchPat had an overall accuracy of 85.7% and a positive predictive value of 87.3% in diagnosing OSA (by predicted AHI above 5). In this large cohort of patients with high pretest probability of OSA, we built several models based on 4% oxygen desaturations, neck circumference, body mass index and several other variables. These simple models can be used at the point-of-care, in order to improve the diagnostic accuracy of the PAT-based testing, thus ameliorating the high rates of misclassification for OSA presence or disease severity.
Keywords: sleep apnea, obstructive; polysomnography
Significance of this study.
What is already known about this subject?
Peripheral arterial tonometry (PAT)-based technology (eg, WatchPat 200 device) is an available and validated modality for the diagnosis of obstructive sleep apnea (OSA).
We have shown before that the accuracy of the WatchPat 200 studies in diagnosing and stratifying OSA severity is suboptimal.
What does this study add?
In this study, we assess the use of PAT-based signals in concert with available demographic and anthropometric data to predict the main functional parameter of polysomnography, Apnea Hypopnea Index (AHI).
Up to 73% of the AHI variability was explained in our models by participants’ age, gender, body mass index or neck circumference together with collected WatchPat 200 signals such as pODI4% or hypoxic burden.
How might these results change the focus of research or clinical practice?
Some of these simple models can help improve the diagnostic precision when using PAT-based out-of-center sleep testing.
Introduction
Obstructive sleep apnea (OSA) is a very common disorder, affecting approximately 1 billion people worldwide. The disease is associated with a plethora of neurocognitive, metabolic and major cardiovascular consequences.1 Despite its high prevalence in the general population, significant undiagnosed disease burden remains, and simple, widely available and cost-effective diagnostic capabilities are imperatively needed.2
Polysomnography (PSG), the ‘gold standard’ diagnostic procedure for diagnosing OSA, is scarce, complex, costly and resource intensive. The advent of home sleep apnea testing (HSAT), also known as portable monitoring,3 out-of-center testing4 or oligosomnography,5 introduces a simple technical solution for the diagnosis of OSA, with greater accessibility, lower cost and reasonable accuracy in subjects without other sleep or medical comorbidities. Most HSAT devices use airflow and effort monitoring for the definition of respiratory events (apneas and hypopneas), while sleep or sleep stages are typically not assessed. Other technologies such as WatchPat 200 devices (Itamar Medical, Caesarea, Israel) quantify respiratory abnormalities and sleep stages by proprietary algorithms and scoring systems that incorporate peripheral arterial tonometry (PAT) variability as a surrogate marker of changes in sympathetic autonomic tone.
We have shown recently in the Peripheal Arterial Tonometry Evaluation of Reliability (PATER) study6 that WatchPat 200 devices used without manual scoring have the potential to significantly misdiagnose the presence or the OSA severity. In this article, we explore several models that use signals from PAT recordings, demographic and anthropometric data to predict Apnea Hypopnea Index (AHI)—as determined by synchronous in-laboratory PSG recordings and the presence of OSA.
Methods
As described elsewhere,6 the study included 500 subjects evaluated in the Atlanta Veteran Affairs Sleep Medicine Center, who underwent PSG and concurrent wrist-worn PAT-based device (WatchPat 200) testing during prespecified periods of time between 08/01/2018 and 02/10/2020.
Definitions and criteria used in PSG interpretation were based on the International Classification of Sleep Disorders third edition (ICSD-3) and the American Academy of Sleep Medicine (AASM) practice parameters.7–10 Per AASM standard recommendations for PSG,7 nasal pressure transducer, oronasal thermistor and respiratory impedance plethysmography effort belts were used in all patients. Apnea was defined as near-complete cessation of airflow (>90% reduction from baseline) lasting at least 10 s. Hypopnea was defined in PSG as airflow or respiratory effort amplitude reductions of 30%–90% from baseline, lasting 10 s or longer and associated with either a >3% oxygen desaturation or an arousal. The WatchPat 200 devices define respiratory events by pulse oximetry desaturations (we analyzed both 3% and 4% thresholds) and sympathetic discharges, the latter being defined by a PAT amplitude reduction and concomitant increases in heart rate. We used the proprietary and validated automated Itamar’s scoring and reporting, systems, that is, without any manual rescoring. The interpretation of all studies was blinded and done by experienced board-certified sleep physicians. Neck circumference (NC) was measured with non-stretchable measuring tape at the level of the cricoid cartilage, roughly 1 cm below the thyroid cartilage (Adam’s apple). Participants were positioned upright or standing, and they looked straight ahead.11
Descriptive analyses of the study variables were performed. Categorical variables were presented as frequencies or percentages. Continuous variables were described as medians, 25–75th IQR and ranges (R, whenever relevant). Distribution normality fitting was evaluated using Shapiro-Wilk and Anderson-Darling tests. Student’s t test and analysis of variance were used to compare mean values, while categorical variables were compared using χ2 (likelihood ratio) test. Tukey-Kramer HSD and Games-Howell (Tukey-Kramer HSD with Welch’s correction)12 tests were used to compare groups when variances were similar or dissimilar, respectively. Agreement between results derived from PAT and PSG was determined by Pearson’s correlation coefficients and by the Bland-Altman method.13 OSA severity classifications (absent, mild, moderate or severe) were evaluated using contingency tables and per cent agreement.
Univariate, simple linear and nominal logistic regressions were performed first. We used available demographic characteristics (age, gender, race), anthropometric features (body mass index, BMI; NC), clinical data (Epworth Sleepiness Scale, ESS; Insomnia Severity Scale, ISI as a continuous parameter or presence of insomnia as a nominal factor; Berlin Questionnaire, BQ as a binary variable) and PAT-based functional parameters (pODI4%, pAHI4%, pRDI4%, pAHI3%, pRDI3%, hypoxic burden or per cent of total sleep time with SpO2<90%, nadir, mean and maximum values for pulse and SpO2). These factors were correlated with the PSG-based AHI, which is the standard indicator for the presence (>5 events/hour) and severity stratification of sleep disordered breathing (5–14 mild, 15–29 moderate and >30 severe OSA). The variables with a p value less than 0.10 were then selected and used in subsequent multivariate regression models. All models were developed on a random derivation set (75% of the entire cohort) and their performance verified on the remaining 25% of the cohort (validation set). Internal validation of the logistic regression model was also done by simple bootstrapping with 2500 samples. All variables included in the model demonstrated robust results, with small 95% bootstrapped CIs around the original coefficients.14 Variables were included in the models together and then successively eliminated one-by-one, based on the highest two to three p values (in several pruning variations), until all remaining factors met the predefined threshold of statistical significance of 0.05, and the models’ adjusted R2 values in the validation set were maximized. In order to assess for possible collinearities, variance inflation factors were computed (accepted level: <3) and factorial analyses performed for interactions between parameters used in the final models. We also assessed the relative importance of the factors used in each model, that is, the contribution of the predictive variables in a way that is independent of the model type and the fitting method. This type of report estimates the variability in the predicted response based on a range of variation for each factor; if the factor’s variation causes a high variability in the response, then that effect is important relative to the model. We used the dependent resampled inputs method, by which factor values are constructed from observed combinations using a k-nearest neighbors’ approach,15 16 in order to account for correlation (this method is preferred when one believes that the factors such as gender, age, BMI, pODI4% and hypoxic burden may be correlated). Analyses were performed using JMP Pro15 statistical software (SAS Institute, Cary, North Carolina, USA).
Institutional research approvals were obtained to conduct the study (Emory University IRB 00049576; VA R&D 0002).
Results
Study participants (n=500) underwent PSG testing performed in the sleep laboratory with concurrent wrist-worn WatchPat 200 device monitoring. Baseline characteristics of the study participants are shown in table 1. Median (IQR; R) age was 53 (42–63; 24–92) years. Eighty per cent of these military veteran participants were males and 20% were females. Approximately 26% were self-identified White or Caucasian; 72% Black or African American;<1% as Hispanic, Latino or of Other extraction. Overall, participants were very symptomatic: 71% of them had complaints of excessive daytime sleepiness, that is, an ESS >10. Approximately three quarters of the participants had difficulty initiating or maintaining sleep, as suggested by an ISI>8; among those, nearly half had ISI-defined subthreshold insomnia, and the other half had moderate or severe insomnia. The BQ was classified as ‘positive’ when two of its three categories were categorized as ‘positive’, suggesting a high index of suspicion for OSA; this was found in 95% of the participants. The PSG-based diagnosis of OSA was present in 85%, while OSA syndrome (OSA and ESS >10) was found in 7 out of 10 subjects (table 1). The median (IQR; R) AHI and nadir SpO2 were 18 (8-37; 0.4–146) events per hour and 83 (76–88; 51–95)%, respectively; central apnea index was 0.2 (0–0.8; 0–53). Based on the standard cut-offs, approximately 27%, 27% and 31% of the subjects had mild, moderate and severe OSA, respectively. Table 1 also shows the main PAT-based functional parameters.
Table 1.
Baseline characteristics of the study group
| Category | Characteristic | Measurement | Results (n=500) |
| Demographic and clinical data | Age (years) | Median (IQR) | 52.5 (41.8–62.5) |
| Gender | Male (%) | 80 | |
| Race | White or Caucasian (%) | 26 | |
| Black or African American (%) | 72 | ||
| BMI (kg/m2) | Median (IQR) | 31.6 (28.0–35.9) | |
| NC (cm) | Median (IQR) | 41.5 (38.5–43.9) | |
| ESS | Median (IQR) | 13 (9–17) | |
| ISI | Median (IQR) | 20 (15–25) | |
| BQ | Positive (%) | 95 | |
| Polysomnographic data | OSA (%) | Present | 85 |
| OSA syndrome (%) | Present | 70 | |
| TST (min) | Median (IQR) | 327 (278–361) | |
| AHI | Median (IQR) | 18.4 (7.6–36.7) | |
| REM AHI | Median (IQR) | 26.0 (9.0–54.0) | |
| ODI3% | Median (IQR) | 2.5 (0.4–10.2) | |
| ODI4% | Median (IQR) | 0.5 (0.1–4.0) | |
| Hypoxic burden (PSG) | Median (IQR) | 2 (0–10) | |
| Pulse arterial tonometry data | OSA (%) | Present | 92 |
| OSA syndrome (%) | Present | 73 | |
| pTST (min) | Median (IQR) | 348 (309–378) | |
| pAHI3% | Median (IQR) | 25.3 (11.9–46.2) | |
| pAHI4% | Median (IQR) | 13.7 (3.6–29.6) | |
| pODI4% | Median (IQR) | 10.8 (3.2–23.6) | |
| Hypoxic burden (PAT) | Median (IQR) | 0.2 (0–2) |
AHI, Apnea Hypopnea Index; AUROC, area under the receiving operating characteristic curve; BMI, body mass index; BQ, Berlin Questionnaire; ESS, Epworth Sleepiness Scale; HSD, honestly significant difference; ISI, Insomnia Severity Scale; NC, neck circumference; ODI, oxygen desaturation index; OSA, obstructive sleep apnea; PAT, peripheral arterial tonometry; pODI, peripheral arterial tonometry-based oxygen desaturation index; pRDI, peripheral arterial tonometry-based respiratory distress index; PSG, polysomnography; pTST, peripheral arterial tonometry-based total sleep time; REM, rapid eye movement; TST, total sleep time.
Thirty research participants (6%) had a pre-existing diagnosis of congestive heart failure—14 (45%) with systolic dysfunction (last median (IQR) echocardiographic left ventricular ejection fraction of 40 (30–60) %) and 17 (55%) with isolated diastolic dysfunction. The ECG monitoring during PSG showed sinus rhythm in 98% of the subjects; atrial fibrillation was found in 2% of participants (89% characterized as permanent or persistent arrhythmia), all in the moderate-severe OSA. Only 3% of the participants had Central Apnea Index >10, while periodic breathing was found in eight individuals (1.6%). Other significant comorbidities or concurrent treatments in our study participants were: asthma (4.6%), chronic obstructive pulmonary disease (5%), alpha (16.3%) and beta (17.3%) blocker medication use. Twenty-eight subjects (5.6%) were on at least one narcotic medication at the time of the study. None of these associated comorbidities (including congestive heart failure and atrial fibrillation) or pharmacological therapies influenced the performance of the PAT-based testing.
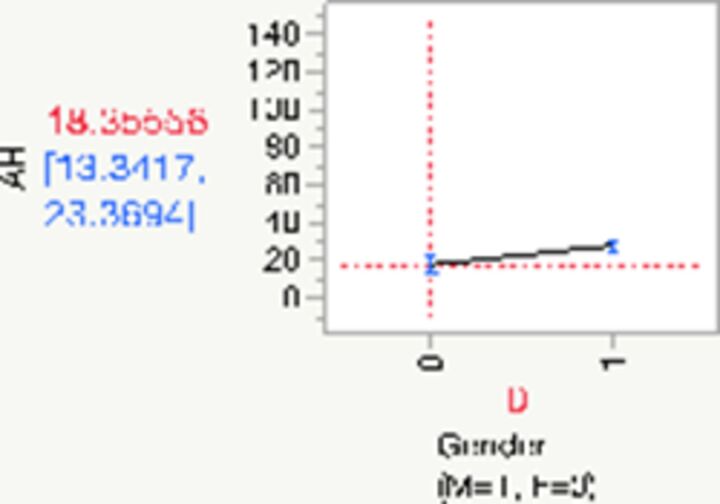
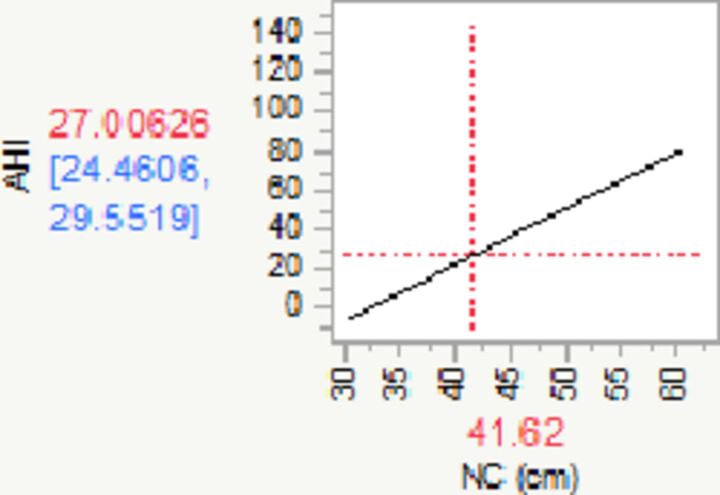
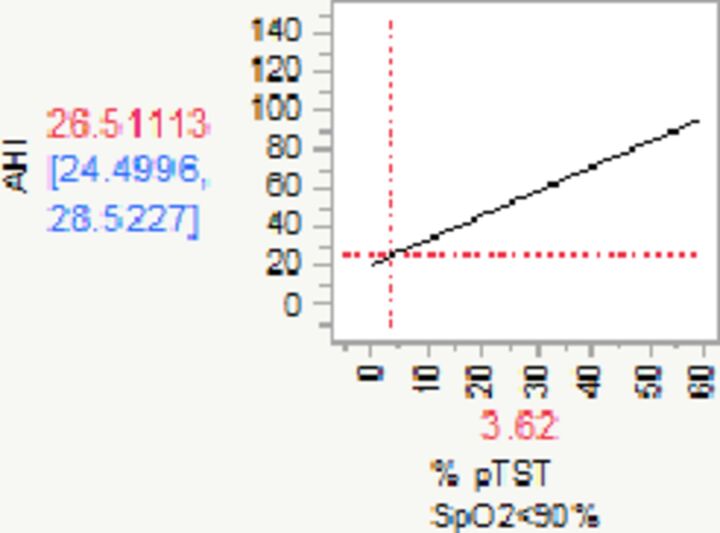
When we performed various bivariate analyses of the factors listed in the Methods section versus the PSG-based AHI, we found that the most significant portion of the AHI variance was explained by pODI4%, NC, BMI and Hypoxic burden (% pTST spent with SpO2<90%) (table 2). Demographic variables that were found relevant to our predictive models were: gender (with added risk for men and reduced risk for women), and subjects’ age (table 2).
Table 2.
Univariate analyses for PSG-based AHI using patient characteristics such as age, BMI, gender, NC
| Univariate regression models (n=500) | Parameter estimates | Lower 95% | Upper 95% | SE | T ratio | Main effect | P value | Plot |
| Intercept | 6.39 | 4.70 | 8.09 | 0.86 | 7.41 | <0.0001 |

|
|
| Change in pODI4%* | 1.13 | 1.07 | 1.19 | 0.03 | 34.06 | 1.00 | <0.0001 | |
| R2=0.68 | ||||||||
| Intercept | −2.99 | −11.59 | 5.60 | 4.38 | −0.69 | 0.4934 |
|
|
| Change in age† | 0.57 | 0.41 | 0.74 | 0.08 | 6.96 | 1.00 | <0.0001 | |
| R2=0.09 | ||||||||
| Intercept | −24.75 | −35.46 | −14.05 | 5.45 | −4.54 | <0.0001 |
|
|
| Change in BMI‡ | 1.58 | 1.26 | 1.91 | 0.16 | 9.59 | 1.00 | <0.0001 | |
| R2=0.16 | ||||||||
| Intercept | 23.44 | 20.64 | 26.24 | 1.42 | 16.45 | <0.0001 |
|
|
| Gender (F)§ | −5.08 | −7.88 | −2.28 | 1.42 | −3.57 | 1.00 | 0.0004 | |
| R2=0.02 | ||||||||
| Intercept | −91.57 | −114.54 | −68.60 | 11.68 | −7.84 | <0.0001 |
|
|
| Change in NC¶ | 2.85 | 2.30 | 3.40 | 0.28 | 10.25 | 1.00 | <0.0001 | |
| R2=0.24 | ||||||||
| Intercept | 21.94 | 19.78 | 24.10 | 1.10 | 19.96 | <0.0001 |
|
|
| Change in Hypoxic burden** | 1.26 | 1.04 | 1.48 | 0.11 | 11.41 | 1.00 | <0.0001 | |
| R2=0.21 |
PAT-based pODI4% and Hypoxic burden (in red: p<0.05). The diagram in the Plot column shows the relationship between AHI (means—in red, 95% CIs—in blue) and the respective parameters.
*For every unit (desaturation per hour) increase in pODI4%, AHI increases by 1.13 (95% CI 1.07 to 1.19).
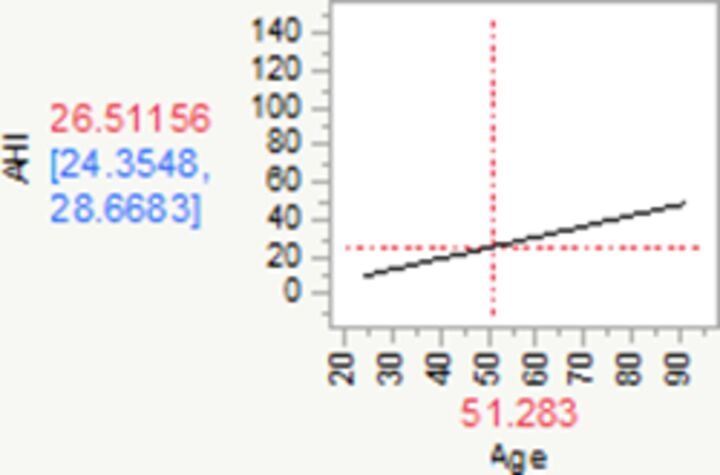
†For every year increase in age, AHI increases by 0.57 (95% CI 0.41 to 0.74).
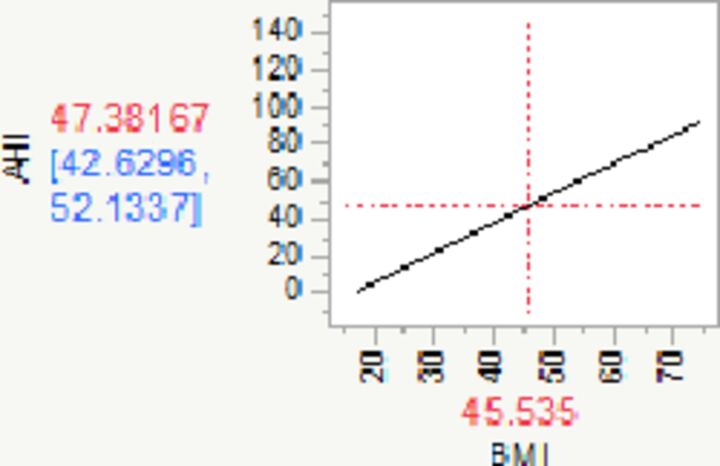
‡For every unit (kg/m2) increase in BMI, AHI increases by 1.58 (95% CI 1.26 to 1.91).
§For females, AHI is reduced by −5.08 (95% CI −7.88 to −2.28).
¶For every unit (cm) increase in NC, AHI increases by 2.85 (95% CI 2.30 to 3.40).
**For every unit (%) increase in Hypoxic burden, AHI increases by 1.26 (95% CI 1.04 to 1.48) events per hour.
AHI, Apnea Hypopnea Index; BMI, body mass index; NC, neck circumference; PSG, polysomnography.
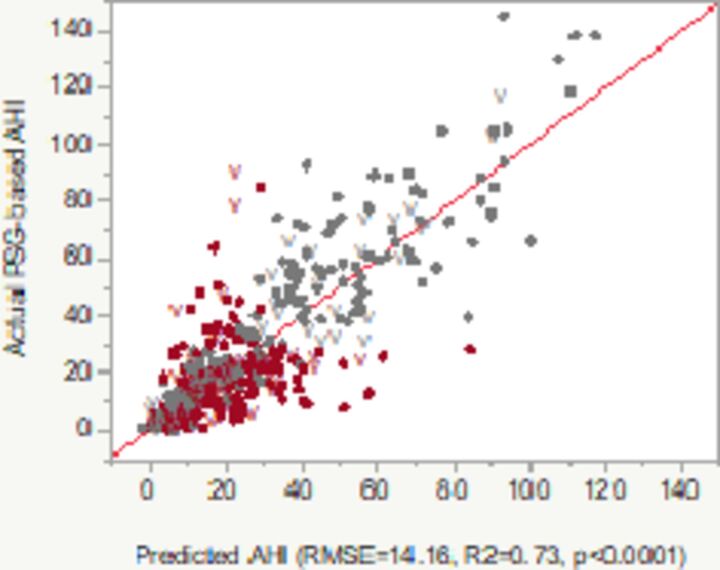
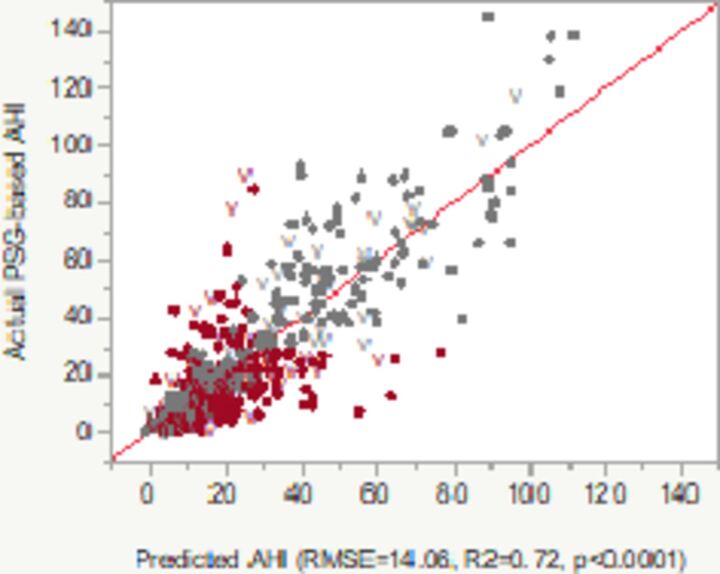
In multivariate analyses that included the factors listed in table 2, we developed three potentially useful models, which aimed to predict PSG-generated AHI based on parameters such as pODI4%, NC, BMI, age, gender and/or Hypoxic burden (table 3). Almost three quarters of the AHI’s variability was explained by these models. Model 1 included pODI4%, participants’ age, gender and BMI (all significant, model R2 in the validation set: 0.69). In model 2, we introduced the same factors as in model 1 plus Hypoxic burden and a factorial analysis exploring the interaction between the latter and pODI4%. Neither the Hypoxic burden, nor the interaction between pODI4% and Hypoxic burden were statistically significant, that is, they did not have additional contribution to the performance of the model. We included model 2 in the results section and in table 3 mostly to clarify the lack of contribution from the Hypoxic burden and the interaction between the latter and pODI4%. Similarly, models that included both BMI and NC (and their factorial analysis for interaction) did not provide additional yield (data not shown). Last, in model 3, we simplified the predictive equation by including only pODI4% and subjects’ NC. This achieved comparable adjusted R2 (or percentage of the AHI’s variance), that is, 0.67. The performance of models 1 and 3 was so similar, that we describe further only results based on model 3, as it was found to be both simple and very robust. Based on a very simple logistic model that predicts AHI using as input variables NC and ODI4% (model 3) and using a more conservative AHI threshold for OSA diagnosis (>15), the positive predictive value of the test was improved to 98.5%, while the overall test accuracy for OSA-No OSA dichotomization went down to 75% in the derivation set and to 73% in the internal validation set. The best accuracy by diagnostic categories was obtained in the No OSA (AUROC 0.87–0.86) and in the severe OSA (AUROC 0.88–0.87) groups. Mild OSA category had AUROC values of 0.74–0.72, while moderate OSA seemed to be the least precise disease categorization (AUROC 0.66–0.64, ranges illustrating the dyads in the derivation and validation sets).
Table 3.
Multivariate (adjusted) regression modes developed for PSG-based AHI using patient characteristics such as age, gender, BMI, NC
| Multivariate regression models (n=500) | Parameter estimates | Lower 95% | Upper 95% | SE | T ratio | Main effect* | P value | Plot |
| Model 1 |
|
|||||||
| Intercept | −8.63 | −18.16 | 0.90 | 4.85 | −1.78 | 0.0757 | ||
| Change in age† | 0.13 | 0.02 | 0.24 | 0.06 | 2.30 | 0.08 | 0.0222 | |
| Change in pODI4%‡ | 1.07 | 0.98 | 1.15 | 0.04 | 25.27 | 0.42 | <0.0001 | |
| Gender (F)§ | −1.78 | −3.63 | −0.10 | 0.90 | −2.08 | 0.42 | 0.0485 | |
| Change in BMI¶ | 0.26 | 0.02 | 0.50 | 0.12 | 2.15 | 0.09 | 0.0338 | |
| R2 adj=0.72 derivation set R2 adj=0.69 validation set (V) |
Predicted AHI=−8.6323 + 0.1306*Age+1.0668*pODI4%+Match (Gender(F, M))(F: −1.7751; M:+1.7751)+0.2569*BMI | |||||||
| Model 2 |
|
|||||||
| Intercept | −9.40 | −19.09 | 0.29 | 4.93 | −1.91 | 0.0572 | ||
| Change in age** | 0.14 | 0.02 | 0.25 | 0.06 | 2.37 | 0.06 | 0.0183 | |
| Gender (F)†† | −1.88 | −3.64 | −0.12 | 0.90 | −2.10 | 0.34 | 0.0366 | |
| Change in BMI‡‡ | 0.26 | 0.02 | 0.50 | 0.12 | 2.14 | 0.07 | 0.0334 | |
| Change in pODI4%§§ | 1.12 | 1.02 | 1.23 | 0.05 | 21.05 | 0.34 | <0.0001 | |
| Change in Hypoxic burden¶¶ | −0.19 | −0.44 | 0.06 | 0.13 | −1.48 | 0.18 | 0.1402 | |
| (pODI4%−17.67)*(Hypoxic burden-3.61)*** | 0.00005 | −0.006 | 0.006 | 0.003 | 0.20 | 0.00 | 0.8428 | |
| R2 adj=0.72 derivation set R2 adj=0.69 validation set (V) |
Predicted AHI=−9.3989 + 0.1382*Age+Match (Gender(F, M))(F: −1.8797; M:+1.8797)+0.2588*BMI+1.1206*pODI4% - 0.1871*Hypoxic burden +(pODI4% - 17.6669)*(Hypoxic burden – 3.6053)*0.00005 | |||||||
| Model 3 |

|
|||||||
| Intercept | −27.50 | −42.23 | −12.78 | 7.49 | −3.67 | 0.0003 | ||
| Change in pODI4%††† | 1.05 | 0.97 | 1.14 | 0.04 | 24.28 | 0.72 | <0.0001 | |
| Change in NC‡‡‡ | 0.84 | 0.48 | 1.21 | 0.19 | 4.54 | 0.28 | <0.0001 | |
| R2 adj=0.73 derivation set R2 adj=0.67 validation set (V) |
Predicted AHI=−27.5026 + 1.0514*pODI4%+0.8441*NC | |||||||
PAT-based pODI4% and Hypoxic burden, the latter defined as per cent of the total sleep time with SpO2 <90% (in red: p<0.05). The diagram in the Plot column shows the relationship between PSG-based AHI (Y axis) versus predicted AHI of the model. Color codes: grey/light—concordant, red/dark—discordant diagnoses of absent, mild, moderate or severe OSA.
*Variable importance computed in the multivariate models as dependent resampled inputs; main effect: reflects the relative contribution of the factor alone, not in combination with the other factors; V: internal validation set points.
†For every year increase in age, AHI increases by 0.13 (95% CI 0.02 to 0.24) respiratory events per hour (holding pODI4%, gender and BMI constant).
‡For every unit (desaturation per hour) increase in pODI4%, AHI increases by 1.07 (95% CI 0.98 to 1.15) events per hour (holding age, gender and BMI constant).
§For females, AHI is reduced by −1.78 (95% CI −3.63 to −0.10); similarly, for males, AHI is increased by +1.78 (95% CI 0.10 to 3.63) events per hour (holding age, pODI4% and BMI constant).
¶For every unit (kg/m2) increase in BMI, AHI increases by 0.26 (95% CI 0.02 to 0.50) events per hour (holding age, pODI4% and gender constant).
**For every year increase in age, AHI increases by 0.14 (95% CI 0.02 to 0.25) respiratory events per hour (holding gender, BMI, pODI4% and Hypoxic burden constant)
††For females, AHI is reduced by −1.88 (95% CI −3.64 to −0.12); similarly, for males, AHI is increased by+1.88 (95% CI 0.12 to 3.64) events per hour (holding age, BMI, pODI4% and Hypoxic burden constant).
‡‡For every unit (kg/m2) increase in BMI, AHI increases by 0.26 (95% CI: 0.02 to 0.50) events per hour (holding age, pODI4%, gender and Hypoxic burden constant).
§§For every unit (desaturation per hour) increase in pODI4%, AHI increases by 1.12 (95% CI 1.02 to 1.23) events per hour (holding age, gender, BMI and Hypoxic burden constant)
¶¶For every unit increase in Hypoxic burden (%), AHI decreases by 0.19 (95% CI −0.44 to 0.06) events per hour (holding age, gender, BMI and pODI4% constant, p=0.1402), indicating no significant impact on the model.
***For every unit increase in (pODI4%−17.67)*(Hypoxic burden-3.61), AHI increases by 0.00005 (95% CI −0.006 to 0.006) events per hour (holding age, gender, BMI, pODI4% and Hypoxic burden constant, p=0.8428), indicating that there is no significant interaction.
†††For every unit (desaturation per hour) increase in pODI4%, AHI increases by 1.05 (95% CI 0.97 to 1.14) events per hour (holding NC constant).
‡‡‡For every unit (cm) increase in NC, AHI increases by 0.84 (95% CI: 0.48 to 1.21) events per hour (holding pODI4%constant).
AHI, Apnea Hypopnea Index; BMI, body mass index; NC, neck circumference; OSA, obstructive sleep apnea; PAT, peripheral arterial tonometry; PSG, polysomnography.
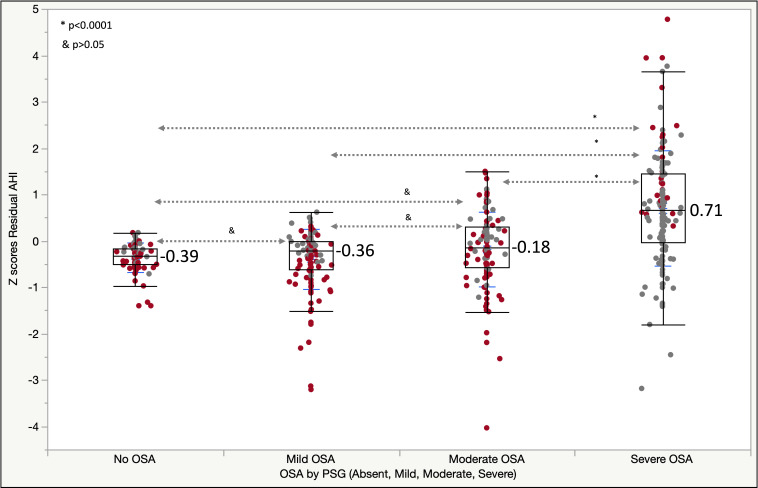
Figure 1 illustrates box plots of the AHI residuals’ Z scores by OSA severity when using the model 3, which predicts AHI based on pODI4% and NC. Cases with discordant diagnoses of OSA (absent, mild, moderate and severe) between PSG and PAT-based testing are shown in red/dark color. We found that 67% of individuals without OSA had mild disease by WatchPat and 8% of those with actual mild OSA had no OSA by PAT. Additionally, among those with predicted severe OSA, there were no cases without OSA (0%) and only 6% had mild OSA by PSG; among subjects with model 3-predicted moderate disease, 3% and 26% had no OSA or mild disease, respectively.
Figure 1.
Box plots of residual AHI Z scores versus OSA, as diagnosed by PSG (Absent, Mild, Moderate, Severe; p values: Games-Howell test). Next to the box plots (in blue) are shown the mean Z scores for each category. Codes—red/dark color: discordant diagnoses; grey/light color: concordant diagnoses between PAT and PSG-based diagnoses. AHI, Apnea Hypopnea Index; OSA, obstructive sleep apnea; PAT, peripheral arterial tonometry; PSG, polysomnogram; residual AHI, predicted AHI – actual AHI; Z score, (x – SD)/mean.
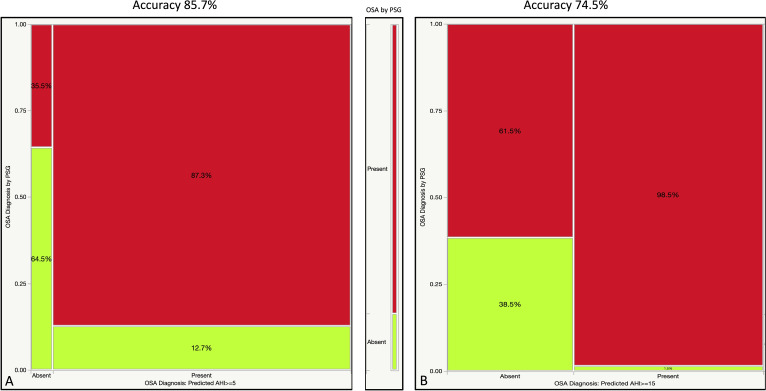
Establishing a diagnosis of OSA by using predicted AHI >5 or >15 events/hour as threshold had an overall accuracy of 85.7% and 74.5% (equivalent to the C statistic or AUROC values, figure 2), while the positive predictive value of the test went up from 87.3% to 98.5%, respectively. When broken down by disease strata, AUROC was 0.86/0.85 for the No OSA category, 0.85/0.81 for moderate-severe OSA group, and only 0.69/0.67 in the mild OSA category in the derivation/validation sets, respectively.
Figure 2.
Contingency analyses (shown as mosaic plots) illustrating the percentages of study participants with OSA by PSG (red/dark color: present; green/bright color: absent) among those with and without a diagnosis of the disease based on predicted AHI (using pODI4% and NC)>5 (panel A) and >15 (panel B). Diagnostic accuracy (concordant diagnoses) was found in 85.7% and 74.5% of partitions shown in panels A and B, respectively. AHI, Apnea Hypopnea Index; NC, neck circumference; OSA, obstructive sleep apnea; PSG, polysomnography.
Discussion
In this study, we explored several models of prediction for OSA diagnosis by its main defining and disease severity stratifying measurement (AHI), based on demographic, anthropometric and functional WatchPat 200 data. These models were able to improve the diagnostic uncertainty linked to the inherent limitation of the testing tool used (PAT-based device), suggesting that simpler evaluations relying, for example, on pODI4% and NC alone could be useful.
Several prior studies had evaluated the reliability of WatchPat 200 testing, showing correlations up to 0.90 between PSG AHI and PAT-based AHI (pAHI), while the practical implications of the large dispersion had been occasionally ignored or deemed negligible.17–27 Recently, in a point-of-care investigation, we have shown that automatically scored WatchPat 200 tests could lead to significant misclassification rates (30%–50%) in the diagnosis of OSA and its severity against ‘gold standard’ PSG.6 In these new analyses of the same 500 participants evaluated with synchronous PSG and PAT-based HSAT devices, we found that the WatchPat 200-derived ODI4% and Hypoxic burden, in concert with various demographic (age, gender) or anthropometric (BMI, NC) data, can improve the diagnostic accuracy and severity classification of this disease up to 85%–86%.
The central tendency deviation and dispersion, large or small, may or may not impact the correct nosologic categorization (mild, moderate, severe OSA). To illustrate the point, we color-coded each marker in figure 1: red/dark—discordant and grey/light color—concordant diagnoses of no OSA, mild, moderate or severe OSA. While the Z values ((x – mean)/SD) of the residuals were statistically higher in the severe OSA group versus the other categories, significant misclassification remained in all groups. The red/dark markers (diagnostic discordance) in the severe OSA group are represented mostly by cases of misclassification from severe to moderate OSA (23.5%) and only 2.2% from severe to mild (none from severe to no OSA). One could argue that the severe to moderate OSA reclassification does not have significant therapeutic implications, that is, both categories may end up being treated the same. When compared with our prior analyses of disease definitions based on pAHI,6 we have been able to ‘reduce’ the Z scores of the AHI residuals, that is, predicted AHI minus actual AHI, by disease category.
We found significant differences between automated pODI4% and postartifact processing, manually adjudicated PSG-based ODI4% (table 1), which may in fact explain the diagnostic inaccuracies resulting from HSAT with WatchPat200 devices, and the performance of the various models that are trying to predict PSG AHI from PAT signals.
Based on our previous analyses, we recommended that, if PAT devices find less than moderate OSA (no OSA or mild disease) in high pretest probability individuals, repeat testing with ‘gold standard’ PSG should be employed. Despite our present models’ performance and improved diagnostic accuracy, it is our opinion that the recommendation still stands, even when the ‘conservative’ 4% desaturation threshold is used in defining the respiratory events.
Other groups also recognized the potential limitations of PAT-based sleep testing technology (such as PAT amplitude changes and heart rate changes independent of each other, arousals potentially leading to both or only one of them, the potential need to use different SpO2 thresholds in REM versus non-REM sleep, possible pulse oximetry biases such as motion artifacts or “penumbra effects,” and so on) and proposed “corrective” strategies for use in manual scoring.28 In this analysis and in our previous investigation, we did not resort to manual rescoring of the WatchPat studies, as we were trying to optimize technological outputs without human factor intervention. While the AASM clinical guidelines3 clearly recommend sleep testing interpretation to be based on manual scoring and review, there is a growing, concurrent trend—that is, developing novel artificial intelligence-based capabilities to reduce the labor intensity and error propensity of our standard testing and interpretation process, including that of an imperfect measurement (AHI).29 As such, and in order to further help the interpretation of the PAT reports, we tried to build different models of AHI determination by PAT-based parameters. We found that pODI4%, hypoxic burden, pRDI or pAHI explain at best up to two thirds of the general AHI variability. Additional variables such as age, gender, BMI and NC may add slightly more to the diagnostic precision when added into the models, that is, up to 0.08 additional R2.
One main finding of this study was that simple models based on anthropometric measurements (eg, NC) and number of 4% desaturations per hour of recording (such as in model 3) could predict with reasonable accuracy the presence and severity of OSA. It is important to recognize that this does not necessarily lead to the conclusion that pulse oximetry (even if ODI4% was universally available as a standard oximeter measurement) could replace the WatchPat device monitoring. The mean reason is the following: we noticed significant discrepancies between PSG-based and PAT-based pulse oximetry data; hence, an assertion that pulse oximetry data may substitute PAT tests cannot be made without further exploration of the causes, possible artifacts and further validation.
Another important point (perhaps less known to the device users, but discovered by our group during analyses and confirmed by Itamar’s representatives) is that WatchPat 200 devices do not calculate pODI3% (ie, based on 3% threshold), but only pODI4%, despite the fact the one can create distinct reports using the two desaturation thresholds; as such, pAHI and pRDI are calculated according to the predetermined desaturation level, while pODI will always be represented in the current, most up-to-date software, by pODI4%.
Our study has several strengths. First, the investigation is part of a large point-of-care, clinic-based study which evaluated systematically, without significant missingness and with blinded interpretations, synchronous PSG and PAT-based testing (without any night-to-night variability). Second, our cohort is much better represented by minority individuals of Black or African American extraction than other published investigations. Third, we assessed several robust, simple, internally validated statistical models that can be easily deployed at the point-of-care setting. Fourth, our investigation purposefully targeted functional measurements likely available on pulse oximetry, potentially expanding the use of the models when overnight pulse oximetry monitoring is employed. Potential weaknesses of our investigation are related to the single center and observational nature of the study, on mostly male military veterans with high comorbid burden, including prevalent complaints of insomnia, and lack of manual scoring and readjudication of the respiratory events or of the sleep stages, as generated by the WatchPat 200 software.
Conclusion
We evaluated a large point-of-care, clinic-based cohort of participants with various sleep complaints, high pretest probability of OSA and with very high disease prevalence, by synchronous overnight PSG and WatchPat 200 devices. In these analyses, we built several, simple models based on 4% oxygen desaturations, NC, BMI and several other variables. We cross-validated these models in internal subsets of our cohort. If confirmed in other sleep clinic patient populations, these tools provide hope that they can improve the diagnostic accuracy of the PAT-based testing, ameliorating the previously reported high rates of diagnostic misclassification of OSA presence or disease severity.
Acknowledgments
The authors want to thank Dr Faisal Zahiruddin and Dr Aditya Chada for their help in collecting some of the study data.
Footnotes
Contributors: AS, JSA, BG, MM-C, NA, NAC, OCI, SAD, SBV and RE contributed towards the writing of this article. OCI contributed with data analyses. NA, AS and MM-C contributed with data collection.
Funding: The authors have not declared a specific grant for this research from any funding agency in the public, commercial or not-for-profit sectors.
Competing interests: None declared.
Patient consent for publication: Not required.
Provenance and peer review: Not commissioned; externally peer reviewed.
Data availability statement: No data are available.
References
- 1. Benjafield AV, Ayas NT, Eastwood PR, et al. Estimation of the global prevalence and burden of obstructive sleep apnoea: a literature-based analysis. Lancet Respir Med 2019;7:687–98. 10.1016/S2213-2600(19)30198-5 [DOI] [PMC free article] [PubMed] [Google Scholar]
- 2. Kundel V, Shah N. Impact of portable sleep testing. Sleep Med Clin 2017;12:137–47. 10.10/j.jsmc.2016.10.006 [DOI] [PMC free article] [PubMed] [Google Scholar]
- 3. Collop NA, Anderson WM, Boehlecke B, et al. Clinical guidelines for the use of unattended portable monitors in the diagnosis of obstructive sleep apnea in adult patients. Portable monitoring Task force of the American Academy of sleep medicine. J Clin Sleep Med 2007;3:737–47. [PMC free article] [PubMed] [Google Scholar]
- 4. Collop NA, Tracy SL, Kapur V, et al. Obstructive sleep apnea devices for out-of-center (OOC) testing: technology evaluation. J Clin Sleep Med 2011;7:531–48. 10.5664/JCSM.1328 [DOI] [PMC free article] [PubMed] [Google Scholar]
- 5. Ioachimescu OC, Collop NA. Sleep-disordered breathing. Neurol Clin 2012;30:1095–136. 10.1016/j.ncl.2012.08.003 [DOI] [PubMed] [Google Scholar]
- 6. Ioachimescu OC, Allam JS, Samarghandi A, et al. Performance of peripheral arterial tonometry based testing for the diagnosis of obstructive sleep apnea in a large sleep clinic cohort. J Clin Sleep Med 2020. 10.5664/jcsm.8620 [DOI] [PMC free article] [PubMed] [Google Scholar]
- 7. Berry RB, Brooks R, Gamaldo CE, et al. The AASM manual for the scoring of sleep and associated events: rules, terminology and technical specifications. Darie, IL: American Academy of Sleep Medicine, 2016. [Google Scholar]
- 8. International classification of sleep disorders Diagnostic and coding manual. 3rd edn Darien, Illinois: American Academy of Sleep Medicine, 2014. [Google Scholar]
- 9. Morgenthaler TI, Aurora RN, Brown T, et al. Practice parameters for the use of autotitrating continuous positive airway pressure devices for titrating pressures and treating adult patients with obstructive sleep apnea syndrome: an update for 2007. An American Academy of sleep medicine report. Sleep 2008;31:141–7. 10.1093/sleep/31.1.141 [DOI] [PMC free article] [PubMed] [Google Scholar]
- 10. Kushida CA, Littner MR, Morgenthaler T, et al. Practice parameters for the indications for polysomnography and related procedures: an update for 2005. Sleep 2005;28:499–523. 10.1093/sleep/28.4.499 [DOI] [PubMed] [Google Scholar]
- 11. Aswathappa J, Garg S, Kutty K, et al. Neck circumference as an anthropometric measure of obesity in diabetics. N Am J Med Sci 2013;5:28–31. 10.4103/1947-2714.106188 [DOI] [PMC free article] [PubMed] [Google Scholar]
- 12. Games PA, Howell JF. Pairwise multiple comparison procedures with unequal n’s and/or variances: a Monte Carlo study. J Educ Behav Stat 1976;1.2:113–25. [Google Scholar]
- 13. Bland JM, Altman DG. Statistical methods for assessing agreement between two methods of clinical measurement. Lancet 1986;1:307–10. [PubMed] [Google Scholar]
- 14. Efron B. Nonparametric standard errors and confidence intervals. Can J Stat 1981;9:139–58. 10.2307/3314608 [DOI] [Google Scholar]
- 15. Sobol IM. Sensitivity estimates for nonlinear mathematical models. MMCE 1993;1.4:407–14. [Google Scholar]
- 16. Saltelli A. Making best use of model evaluations to compute sensitivity indices. Comput Phys Commun 2002;145:280–97. 10.1016/S0010-4655(02)00280-1 [DOI] [Google Scholar]
- 17. Weimin L, Rongguang W, Dongyan H, et al. Assessment of a portable monitoring device WatchPAT 200 in the diagnosis of obstructive sleep apnea. Eur Arch Otorhinolaryngol 2013;270:3099–105. 10.1007/s00405-013-2555-4 [DOI] [PubMed] [Google Scholar]
- 18. Pang KP, Gourin CG, Terris DJ. A comparison of polysomnography and the WatchPAT in the diagnosis of obstructive sleep apnea. Otolaryngol Head Neck Surg 2007;137:665–8. 10.1016/j.otohns.2007.03.015 [DOI] [PubMed] [Google Scholar]
- 19. Jen R, Orr JE, Li Y, et al. Accuracy of WatchPAT for the diagnosis of obstructive sleep apnea in patients with chronic obstructive pulmonary disease. COPD 2020;17:34–9. 10.1080/15412555.2019.1707789 [DOI] [PMC free article] [PubMed] [Google Scholar]
- 20. Gan YJ, Lim L, Chong YK. Validation study of WatchPAT 200 for diagnosis of OSA in an Asian cohort. Eur Arch Otorhinolaryngol 2017;274:1741–5. 10.1007/s00405-016-4351-4 [DOI] [PubMed] [Google Scholar]
- 21. Hedner J, White DP, Malhotra A, et al. Sleep staging based on autonomic signals: a multi-center validation study. J Clin Sleep Med 2011;7:301–6. 10.5664/JCSM.1078 [DOI] [PMC free article] [PubMed] [Google Scholar]
- 22. White DP, Gibb TJ, Wall JM, et al. Assessment of accuracy and analysis time of a novel device to monitor sleep and breathing in the home. Sleep 1995;18:115–26. 10.1093/sleep/18.2.115 [DOI] [PubMed] [Google Scholar]
- 23. Ayas NT, Pittman S, MacDonald M, et al. Assessment of a wrist-worn device in the detection of obstructive sleep apnea. Sleep Med 2003;4:435–42. 10.1016/S1389-9457(03)00111-4 [DOI] [PubMed] [Google Scholar]
- 24. Zou D, Grote L, Peker Y, et al. Validation a portable monitoring device for sleep apnea diagnosis in a population based cohort using synchronized home polysomnography. Sleep 2006;29:367–74. 10.1093/sleep/29.3.367 [DOI] [PubMed] [Google Scholar]
- 25. O'Brien LM, Bullough AS, Shelgikar AV, et al. Validation of Watch-PAT-200 against polysomnography during pregnancy. J Clin Sleep Med 2012;8:287–94. 10.5664/jcsm.1916 [DOI] [PMC free article] [PubMed] [Google Scholar]
- 26. Park CY, Hong JH, Lee JH, et al. Clinical usefulness of watch-PAT for assessing the surgical results of obstructive sleep apnea syndrome. J Clin Sleep Med 2014;10:43–7. 10.5664/jcsm.3356 [DOI] [PMC free article] [PubMed] [Google Scholar]
- 27. Yalamanchali S, Farajian V, Hamilton C, et al. Diagnosis of obstructive sleep apnea by peripheral arterial tonometry: meta-analysis. JAMA Otolaryngol Head Neck Surg 2013;139:1343–50. 10.1001/jamaoto.2013.5338 [DOI] [PubMed] [Google Scholar]
- 28. Zhang Z, Sowho M, Otvos T, et al. A comparison of automated and manual sleep staging and respiratory event recognition in a portable sleep diagnostic device with in-lab sleep study. J Clin Sleep Med 2020. [DOI] [PMC free article] [PubMed] [Google Scholar]
- 29. Goldstein CA, Berry RB, Kent DT, et al. Artificial intelligence in sleep medicine: an American Academy of sleep medicine position statement. J Clin Sleep Med 2020;16:605–7. 10.5664/jcsm.8288 [DOI] [PMC free article] [PubMed] [Google Scholar]


