Abstract
Background
Hepatocellular carcinoma (HCC) is a malignancy with high incidence and mortality rates worldwide. Alcohol dehydrogenases (ADHs) are huge family of dehydrogenase enzymes and associated with the prognosis of various cancers. However, comprehensive analysis of prognostic implications related to ADHs in HCC is still lacking and largely unknown.
Methods
The expression profiles and corresponding clinical information of HCC were obtained from The Cancer Genome Atlas (TCGA). Wilcoxon signed-rank test was employed to evaluate the expression of ADHs. Cox regression and Kaplan-Meier analyses were used to investigate the association between clinicopathological characteristics and survival. GO (Gene Ontology) and KEGG (Kyoto Encyclopedia of Genes and Genomes) enrichment analyses were performed and visualized using R/BiocManager package.
Results
We found that the expression of ADH1A, ADH1B, ADH1C, ADH4, and ADH6 was significantly downregulated in HCC samples compared to normal liver samples. Our univariate and multivariate Cox regression analyses results showed that high expression of ADH1A, ADH1B, ADH1C, ADH4, and ADH6 was considered as an independent factor with an improved prognosis for the survival of HCC patients. Moreover, our Kaplan-Meier analysis results also revealed that high expression of AHD1A, ADH1B, ADH1C, ADH4, and ADH6 was significantly associated with good survival rate in HCC patients. In addition, GO, KEGG, and GSEA analyses unveiled several oncogenic signaling pathways were negatively associated high expression of ADHs in HCC.
Conclusion
In the present study, our results provide the potential prognostic biomarkers or molecular targets for the patients with HCC.
Keywords: Alcohol dehydrogenase, Hepatocellular carcinoma, Overall survival, Recurrence free survival, Expression level, Prognostic value
Background
Liver cancer is the sixth most common diagnosed cancer and the fourth most common cause of cancer-related deaths, which leads to about 841,080 (4.7%) new cases diagnosed and 781,631 (8.2%) deaths according to global cancer statistics 2018 [1]. Hepatocellular carcinoma (HCC) is the primary liver cancers, and accounts for approximately 75–85% of liver cancers worldwide [1]. Over the past few decades, considerable molecules have been developed to diagnose and treat HCC; where these molecules have been applied and shown their efficacy in detection and treatment of the disease [2, 3]. However, most of HCC patients are diagnosed at advanced stages resulting in the increasing mortality and poor prognosis in many parts of the world [4]. Therefore, identification of novel diagnostic biomarkers for early diagnosis of HCC is urgently needed.
Increasing evidence revealed that hepatitis B and C virus infection drove most of the global burden of HCC and accounted for 80% of HCC cases [5]. Moreover, it has been well documented the association between liver cirrhosis and the development of HCC [6]. In Europe and USA, alcoholic cirrhosis is considered as the second most important risk factor for HCC [7]. Therefore, alcohol is recognized as a primary cause or cofactor for the development of HCC in the patients who are heavy alcoholic [8, 9]. In liver, alcohol is primarily metabolized into acetaldehyde, which is also carcinogenic, through alcohol dehydrogenases [10]. Several studies have demonstrated that ADHs are the major rate-limiting factors in the process of alcohol metabolism [11].
Alcohol dehydrogenases (ADHs) are super family of dehydrogenase enzymes located on chromosome 4q22-q24, including class I (ADH1A, ADH1B, and ADH1C), class II (ADH4), class III (ADH5), class IV (ADH6), and class V (ADH7) [12]. ADH family members are widely expressed in several human tissues; interestingly, ADH7 is the only one which is not expressed in human liver [12, 13]. Previous studies have reported that members of ADH gene family are associated with various cancers [14, 15], and the genetic variation of ADHs also affects the risk of cancer for alcohol dependent individuals [16–18]. Recent investigations have shown the prognostic values of ADH family members for non-small cell lung cancer and gastric cancer [19, 20]. However, to the best of our knowledge, the prognostic value of ADH family members in HCC is still unclear. Therefore, the aim of our present study was to explore the potential prognostic value of ADH genes for HCC patients.
Methods
Data acquisition
The transcriptomic profiles and clinicopathological information of Liver Hepatocellular Carcinoma in TCGA (The Cancer Genome Atlas) were obtained from GDC (Genomic Data Commons Data Portal) website (https://portal.gdc.cancer.gov/). For transcriptomic data, FPKM (Fragments Per Kilobase of transcript per Million mapped reads) was used as a unit representing the gene expression levels. Tumor samples, which have full clinicopathological characteristics including age, gender, histologic grade, pathologic T stage, vital status, OS (overall survival), alcohol consumption status, recurrence status (new tumor event after initial treatment) and days to new tumor event after initial treatment, were selected for further analyses, resulting in 269 samples. RFS (recurrence free survival) was calculated depending on recurrence status and days to new tumor event after initial treatment. GSEA (Gene Set Enrichment Analysis) was performed with the JAVA program GSEA 4.0 and annotated gene set database including KEGG “c2.cp.kegg.v7.0.symbols.gmt” and PID “c2.cp.pid.v7.0.symbols.gmt” were chosen as the reference gene sets (minimal set size = 15, maximal set size = 500) [21]. The results were shown in the form of multiple-GSEA using R packages including plyr, ggplot2, grid, and gridExtra.
Statistical analysis
Wilcoxon signed-rank test was employed to compare the statistical significance of ADHs’ expression in different samples. Cases were categorized into high and low expression subgroups based on Youden index calculation according to ADHs’ expression levels [22]. Survival analysis of cases was performed on Kaplan-Meier method with a log-rank test. The association between clinicopathological characteristics and survival was carried out by univariate Cox regression and multivariate Cox regression analyses with HR (Hazard Ratio) and 95% CI (Confidence Intervals). GO (Gene Ontology) and KEGG (Kyoto Encyclopedia of Genes and Genomes) enrichment analyses were performed and visualized using R/BiocManager package [23, 24]. Analyses were performed with R version 3.6.2 [25] and Graphpad Prism 5.0 (GraphPad Software, Inc., USA). All statistical analyses with a p-value < 0.05 were considered to be significant, and GSEA gene sets with p-value < 0.05 and a false discovery rate (FDR) < 0.25 were considered as a significantly enrichment.
Results
Gene expression signatures of ADHs across different HCC samples
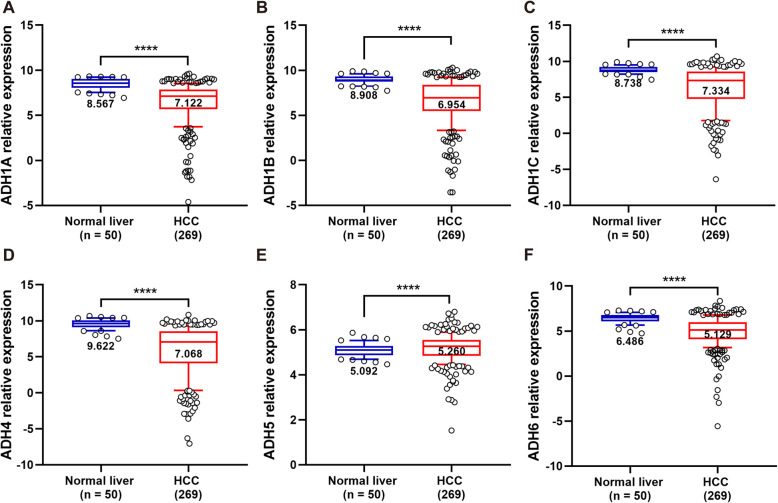
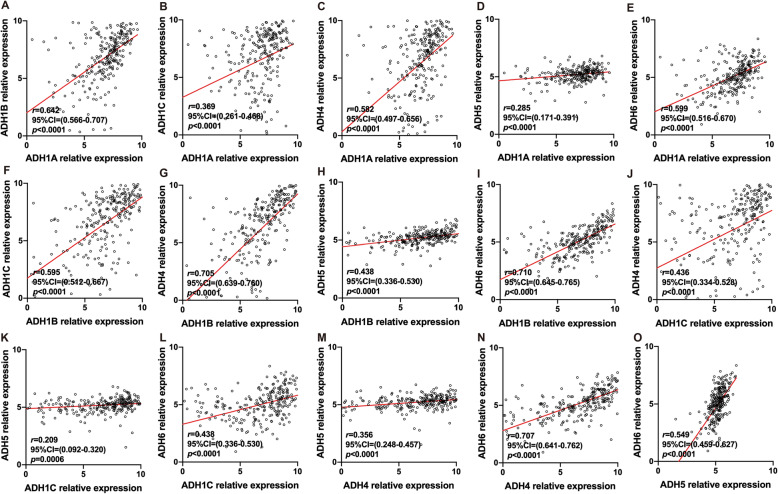
In order to distinguish the expression levels of ADHs between normal and tumor liver tissues, the transcriptome of 50 normal liver and 269 HCC samples was identified. As shown in Fig. 1, the expression level of ADH1A, ADH1B, ADH1C, ADH4, and ADH6 was significantly downregulated in HCC samples compared to normal liver samples. Interestingly, the expression level of ADH5 was slightly but significantly upregulated in HCC samples (Fig. 1e). Furthermore, all the ADH genes showed a positive correlation with each other (Fig. 2).
Fig. 1.
Gene expression level of ADHs in normal liver and HCC tissues. The gene expression level of ADH1A (a), AHD1B (b), ADH1C (c), ADH4 (d), ADH5 (e), and ADH6 (f) in normal liver (n = 50) and HCC (n = 269) tissue samples. The relative expression level of ADHs in each sample was shown as log2FPKM, all data were collected from TCGA. Data shown represent box and whisker plots (whiskers = 10–90 percentile). The significant difference was calculated with Wilcoxon signed-rank test for gene expression in normal liver and HCC tissue samples, p < 0.05 was recognized as significant difference, and the significant differences were denoted by **** for p < 0.0001
Fig. 2.
Co-expression of ADHs in HCC patients. Pearson correlation analysis was performed to characterize the co-expression of ADHs in HCC patients (n = 269). The relative expression level of ADHs in each sample was shown as log2FPKM, all data were collected from TCGA. p < 0.05 was recognized as significant difference
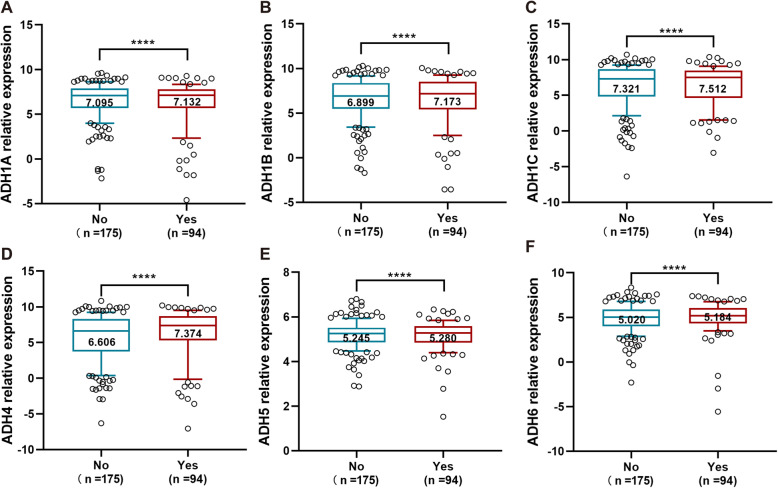
Alcohol consumption increases the risk for liver cancer, and is also considered as a primary cause of HCC through the development of cirrhosis [26]. In the present study, our data showed that the expression level of ADH family members including ADH1A-ADH6 was significantly increased in alcohol consumption HCC patients compared to non-alcohol consumption ones (Fig. 3). Obviously, the expression of ADH1B and ADH4 was strongly upregulated (Fig. 3b and d).
Fig. 3.
Gene expression level of ADHs in HCC patients with alcohol consumption and non-alcohol consumption. The gene expression level of ADH1A (a), AHD1B (b), ADH1C (c), ADH4 (d), ADH5 (e), and ADH6 (f) in non-alcohol consumption HCC patients (No, n = 175) and alcohol consumption HCC patients (Yes, n = 94). The relative expression level of ADHs in each sample was shown as log2FPKM, all data were collected from TCGA. Data shown represent box and whisker plots (whiskers = 10–90 percentile). The significant difference was calculated with Wilcoxon signed-rank test for gene expression in non- and alcohol consumption HCC patients, p < 0.05 was recognized as significant difference, and the significant differences were denoted by **** for p < 0.0001
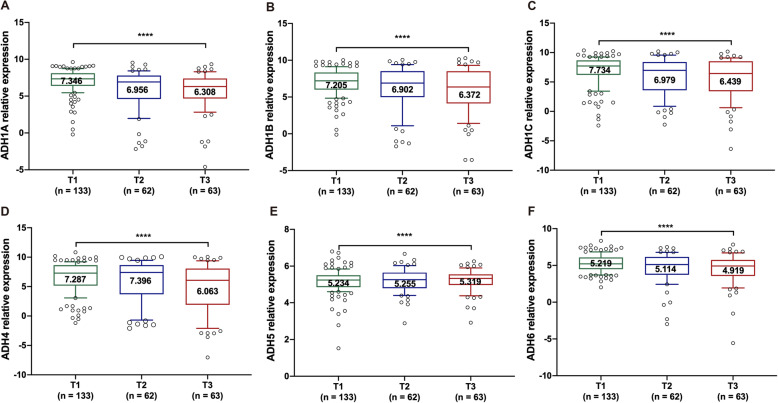
In order to characterize the correlation between ADHs and tumor stages, the expression level of ADHs was identified in HCC samples with different pathologic T stages. Our results showed that the expression level of ADHs including ADH1A, ADH1B, ADH1C, and ADH6 was obviously decreased with the progression of tumor malignancy (Fig. 4a-c and f). And the expression level of ADH4 was higher in HCC patients with T2 pathologic stage than T1 and T3 pathologic stage, but it was lowest in HCC samples with T3 pathologic stage (Fig. 4d). While the expression level of ADH5 was remarkably increased with the progression of tumor malignancy (Fig. 4e).
Fig. 4.
Gene expression level of ADHs in HCC patients with different pathologic T stage. The gene expression level of ADH1A (a), AHD1B (b), ADH1C (c), ADH4 (d), ADH5 (e), and ADH6 (f) in HCC patients with pathologic T1 (n = 133), T2 (n = 62) and T3 (n = 63) stage. The relative expression level of ADHs in each sample was shown as log2FPKM, all data were collected from TCGA. Data shown represent box and whisker plots (whiskers = 10–90 percentile). The significant difference was calculated with Wilcoxon signed-rank test for gene expression in different pathologic T stage HCC tissue samples, p < 0.05 was recognized as significant difference, and the significant differences were denoted by **** for p < 0.0001
Association between ADHs expression and survival time of HCC patients
In order to explore the prognostic value of ADHs expression level in the patients with HCC, all the patients were categorized into high and low expression groups based on the expression level of ADHs as described above. Primarily, the association of ADHs expression and clinicopathological characteristics was determined with two-sided Fisher’s exact tests. Our results showed that the expression of ADH1B, ADH4, and ADH5 was significantly associated with age. Moreover, the expression of ADH1A, ADH1B, and ADH4 was significantly associated with histologic grade. In addition, ADH1A, ADH1B and ADH4 expressions were significantly associated with pathologic T stage (Table 1).
Table 1.
Association analysis between ADHs expression and clinicopathological variables in 269 HCC patients
| Variables | ADH1A | ADH1B | ADH1C | ADH4 | ADH5 | ADH6 | ||||||||||||
|---|---|---|---|---|---|---|---|---|---|---|---|---|---|---|---|---|---|---|
| High | Low | p | High | Low | p | High | Low | p | High | Low | p | High | Low | p | High | Low | p | |
| All patients | 112 | 157 | 174 | 95 | 87 | 182 | 186 | 83 | 114 | 155 | 143 | 126 | ||||||
| Gender | 0.685 | 0.261 | 0.391 | 0.029 | 0.105 | 0.003 | ||||||||||||
| Males | 78 | 113 | 128 | 63 | 65 | 126 | 140 | 51 | 87 | 104 | 113 | 78 | ||||||
| Females | 34 | 44 | 46 | 32 | 22 | 56 | 46 | 32 | 27 | 51 | 30 | 48 | ||||||
| Age (years) | 0.216 | 0.015 | 0.050 | 0.018 | 0.007 | 0.462 | ||||||||||||
| < 60 | 46 | 77 | 70 | 53 | 32 | 91 | 76 | 47 | 41 | 82 | 62 | 61 | ||||||
| ≥ 60 | 66 | 80 | 104 | 42 | 55 | 91 | 110 | 36 | 73 | 73 | 81 | 65 | ||||||
| Histologic grade | 0.005 | 0.0009 | 0.060 | 0.001 | 0.800 | 0.165 | ||||||||||||
| Low (Grade 1 + 2) | 82 | 88 | 123 | 47 | 62 | 108 | 130 | 40 | 71 | 99 | 96 | 74 | ||||||
| High (Grade 3 + 4) | 30 | 69 | 51 | 48 | 25 | 74 | 56 | 43 | 43 | 56 | 47 | 52 | ||||||
| Pathologic T stage | 0.004 | 0.032 | 0.466 | 0.039 | 0.680 | 0.274 | ||||||||||||
| Low (T 1 + 2) | 92 | 103 | 134 | 61 | 66 | 129 | 142 | 53 | 81 | 114 | 108 | 87 | ||||||
| High (T 3 + 4) | 20 | 54 | 40 | 34 | 21 | 53 | 44 | 30 | 33 | 41 | 35 | 39 | ||||||
| Alcohol consumption | > 0.999 | 0.790 | 0.785 | 0.054 | 0.439 | |||||||||||||
| Yes | 39 | 55 | 62 | 32 | 29 | 65 | 72 | 22 | 43 | 51 | 52 | 42 | 0.611 | |||||
| No | 73 | 102 | 112 | 63 | 58 | 117 | 114 | 61 | 71 | 104 | 91 | 84 | ||||||
| Tumor recurrence | 0.269 | 0.899 | 0.118 | 0.088 | 0.805 | 0.903 | ||||||||||||
| Yes | 50 | 81 | 84 | 47 | 36 | 95 | 84 | 47 | 57 | 74 | 69 | 62 | ||||||
| No | 62 | 76 | 90 | 48 | 51 | 87 | 102 | 36 | 57 | 81 | 74 | 64 | ||||||
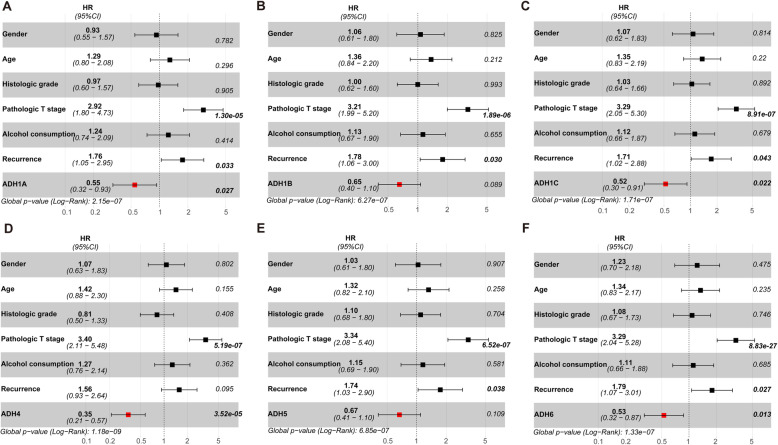
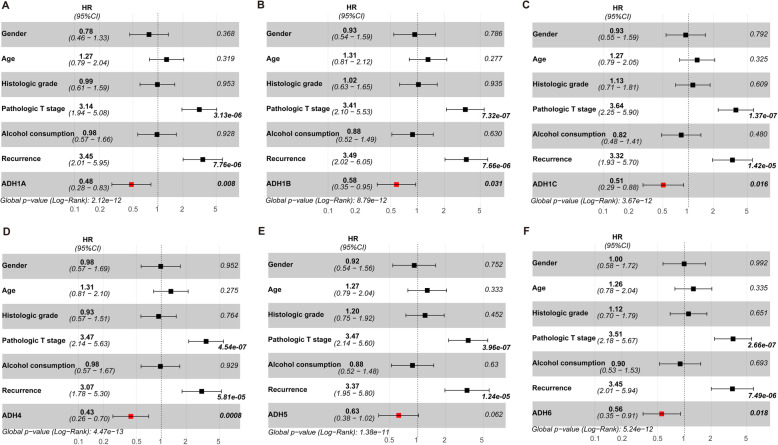
Furthermore, univariate and multivariate Cox regression analyses were also performed to assess the prognostic value of ADHs expression and clinicopathological characteristics. As shown in Table 2, univariate Cox regression analysis results presented that high pathologic T stage, alcohol consumption, tumor recurrence were significantly associated with poor OS for HCC patients. Moreover, higher pathologic T stage and tumor recurrence were also significantly associated with poor RFS. Interestingly, high expression of ADH1A, ADH1C, ADH4, and ADH6 was considered as an independent factor with an improved prognosis for OS and RFS. While high expression of ADH1B was only considered as an independent factor with an improved prognosis for RFS (Table 2). In addition, our multivariate Cox regression analysis results showed that higher pathologic T stage and tumor recurrence were also significantly associated with poor OS and RFS (Figs. 5 and 6). Interestingly, high expression of ADH1A, ADH1C, ADH4, and ADH6 was also considered as an independent factor with an improved prognosis for OS (Fig. 5). And high expression of ADHs without ADH5 was considered as an independent factor with an improved prognosis for RFS (Fig. 6).
Table 2.
Univariate analysis of the expression of ADHs expression with OS and RFS in 269 patients with HCC
| Variables | OS | RFS | ||
|---|---|---|---|---|
| HR (95%CI) | p value | HR (95%CI) | p value | |
| Gender (males vs. females) | 0.904 (0.560–1.458) | 0.678 | 0.798 (0.495–1.288) | 0.356 |
| Age (≤ 60 vs. > 60 years) | 1.361 (0.856–2.162) | 0.193 | 1.314 (0.827–2.089) | 0.247 |
|
Histologic grade Low (Grade 1 + 2) vs. High (Grade 3 + 4) |
1.051 (0.660–1.674) | 0.833 | 1.144 (0.719–1.821) | 0.571 |
|
Pathologic T stage Low (T1 + 2) vs. High (T3 + 4) |
3.819 (2.419–6.030) | 8.86e-09 | 4.386 (2.766–6.952) | 3.21e-10 |
| Alcohol consumption (yes vs. no) | 1.279 (0.795–2.058) | 3.10e-01 | 1.036 (0.646–1.662) | 0.884 |
| Tumor recurrence (yes vs. no) | 2.279 (1.383–3.755) | 0.001 | 4.201 (2.507–7.039) | 5.06e-08 |
| ADH1A expression (high vs. low) | 0.436 (0.261–0.727) | 0.001 | 0.415 (0.248–0.693) | 0.0008 |
| ADH1B expression (high vs. low) | 0.641 (0.405–1.015) | 0.058 | 0.609 (0.385–0.964) | 0.034 |
| ADH1C expression (high vs. low) | 0.516 (0.300–0.888) | 0.017 | 0.518 (0.301–0.892) | 0.018 |
| ADH4 expression (high vs. low) | 0.380 (0.240–0.600) | 3.41e-05 | 0.386 (0.245–0.609) | 4.17e-05 |
| ADH5 expression (high vs. low) | 0.708 (0.436–1.148) | 0.161 | 0.677 (0.418–1.096) | 0.112 |
| ADH6 expression (high vs. low) | 0.544 (0.342–0.864) | 0.009 | 0.558 (0.351–0.886) | 0.013 |
Fig. 5.
Multivariate Cox regression analysis for overall survival in HCC patients. Forest-plot showing the hazard ratio (HR) with 95% confidence index (CI) and p value for overall survival (OS) in patients with HCC (n = 269) based on high versus low expression of ADH family members, including ADH1A (a), AHD1B (b), ADH1C (c), ADH4 (d), ADH5 (e), and ADH6 (f). p < 0.05 was considered as significant difference
Fig. 6.
Multivariate Cox regression analysis for recurrence free survival in HCC patients. Forest-plot showing the HR with 95%CI and p value for recurrence free survival (RFS) in patients with HCC (n = 269) based on high versus low expression of ADH family members, including ADH1A (a), AHD1B (b), ADH1C (c), ADH4 (d), ADH5 (e), and ADH6 (f). p < 0.05 was considered as significant difference
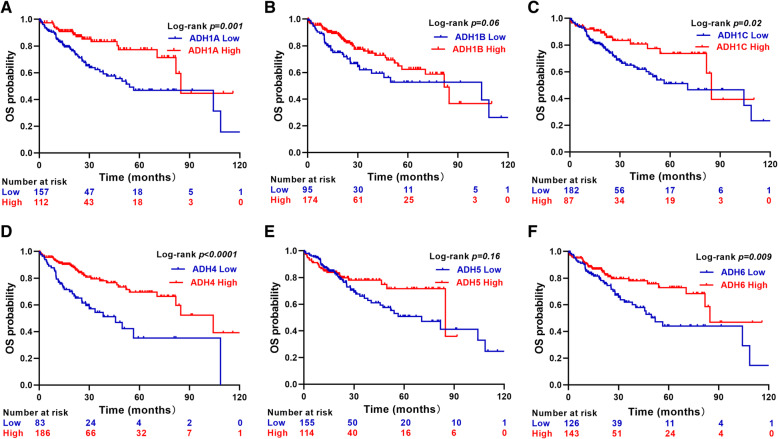
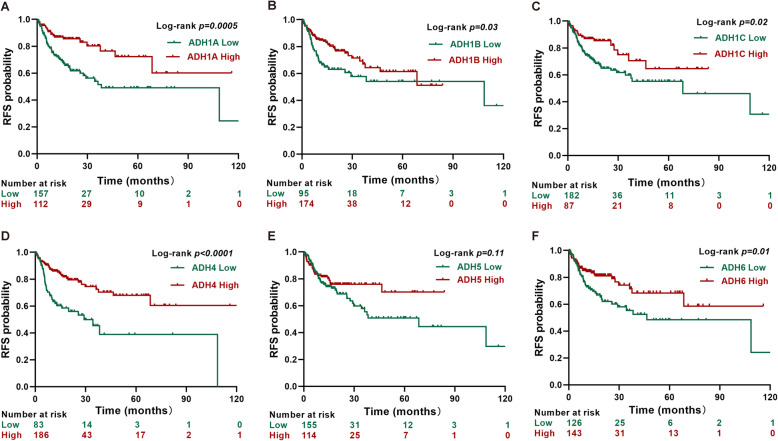
Next, the correlation between ADHs expression and OS/RFS was evaluated with Kaplan-Meier analysis and log-rank test. Our results showed that high expression of AHD1A, ADH1C, ADH4, and ADH6 was significantly associated with good OS and RFS in HCC patients (Figs. 7 and 8). Interestingly, the RFS rate of HCC patients with high ADH1B expression was significantly better than that of patients with low ADH1B expression (Fig. 8b).
Fig. 7.
Overall survival analysis in HCC patients. Kaplan-Meier survival plots representing the probability of OS for HCC patients (n = 269) according to the expression level of ADH family members, including ADH1A (a), AHD1B (b), ADH1C (c), ADH4 (d), ADH5 (e), and ADH6 (f). p < 0.05 was considered as significant difference
Fig. 8.
Recurrence free survival analysis in HCC patients. Kaplan-Meier survival plots representing the probability of RFS for HCC patients (n = 269) according to the expression level of ADH family members, including ADH1A (a), AHD1B (b), ADH1C (c), ADH4 (d), ADH5 (e), and ADH6 (f). p < 0.05 was considered as significant difference
Identification of involved pathways related to ADHs expression in HCC
In order to identify the potential biological functions of ADHs, GO terms and KEGG pathways enrichment analysis was performed with R project as above description. GO terms enrichment analysis revealed that plenty of pathways were well enriched, and 9 of them including ethanol oxidation, ethanol metabolic process, primary alcohol metabolic process, retinoid metabolic process, diterpenoid metabolic process, terpenoid metabolic process, isoprenoid metabolic process, antibiotic metabolic process, and alcohol metabolic process were enriched for all the members of ADHs family (Fig. 9a and Table S1). Moreover, KEGG pathways enrichment analysis results showed that 7 pathways were significantly enriched, including tyrosine metabolism, fatty acid degradation, retinol metabolism, glycolysis/gluconeogenesis, drug metabolism-cytochrome P450, metabolism of xenobiotics by cytochrome P450, chemical carcinogenesis (Fig. 9b and Table S2).
Fig. 9.
Functional enrichment analysis of ADH family members. a Dot-plot showing the significant enrichment terms (p < 0.05) in the Gene Ontology of ADH family members. b Dot-plot showing the significant enrichment pathways (p < 0.05) in the KEGG pathway of ADH family members
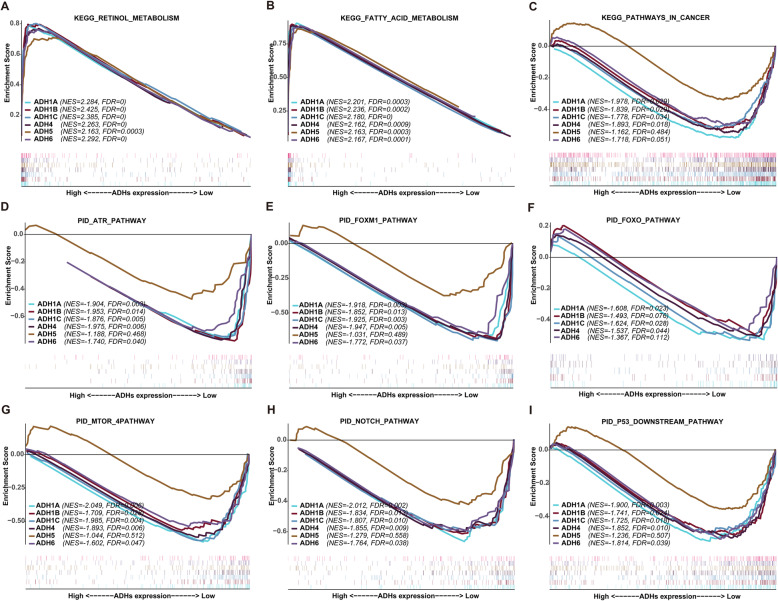
In order to investigate the role of ADHs in the pathogenesis of HCC, GSEA was performed between datasets with ADHs high expression and low expression. Our results unveiled that ADHs were enriched in serval signaling pathways (Table S3 and S4). Based on the enrichment with KEGG database, the high expression group of ADHs was positively associated with retinol metabolism, and fatty acid metabolism with the significant difference (Fig. 10a and b). And the low expression group of ADHs family members not including ADH5 was significantly but negatively associated with pathways in cancer (Fig. 10c). Furthermore, we utilized GSEA to enrich in cancer related pathways based on pathway interaction database (PID). As can be seen from Fig. 10d-i, low expression group of ADHs family members without ADH5 was significantly enriched in several cancer related pathways, including ATR, FOXM1, FOXO, MTOR, NOTCH, and P53 downstream pathway.
Fig. 10.
Gene set enrichment analysis of ADHs in HCC patients. Representative multi-GSEA plots showing ADHs high and low expression group in KEGG retinol metabolism (a), KEGG fatty acid metabolism (b), KEGG pathways in cancer (c), PID ATR pathway (d), PID FOXM1 pathway (e), PID FOXO pathway (f), PID MTOR 4pathway (g), PID NOTCH pathway (h), and PID P53 downstream pathway (i). GSEA gene sets with p < 0.05 and FDR < 0.25 were considered as a significant difference
Discussion
HCC is a malignant tumor with high incidence and mortality rates worldwide [27]. The occurrence and progression of HCC are complex process, which is modulated through various numbers of oncogenes and anti-tumor genes. ADHs are huge family covering 7 members that are mainly involved in the conversion between alcohol and acetaldehyde, and also correlated to several hepatic diseases [14, 28]. However, the prognostic value of ADHs in the patients with HCC is still unclear. In the present study, we performed comprehensive analysis to investigate ADH genes association with the progression and prognosis of the patients with HCC, and to explore a series of diagnostic biomarkers of HCC.
The ADH family members are widely expressed in human liver without ADH7 [12, 13]. Therefore, ADH1A-ADH6 were selected to evaluate the prognostic value of ADHs in the patients with HCC. Primarily, our results revealed that the expression levels of ADH1A-ADH4, and ADH6 were significantly decreased in HCC tissues compared to normal liver tissues (Fig. 1), which were similar to their expression in non-small cell lung cancer (NSCLC) and pancreatic adenocarcinoma [19, 29]. Therefore, we speculate that ADH1A-ADH4, and ADH6 may serve as tumor suppressors in HCC. Whereas, the expression of ADH5 were significantly upregulated in HCC tissues compared to normal liver tissues (Fig. 1e), consistent with what is already known in NSCLC, gastric cancer, and pancreatic adenocarcinoma [19, 20, 29]. In addition, previous studies have reported the positive correlation of ADHs with each other in numerous cancers [19, 20]; here, our results also confirmed that in HCC (Fig. 2).
Smoking is an important risk factor for lung cancer, a recent study reported that the expression levels of ADHs without ADH1A were significantly associated with smoking status of the NSCLC patients [19]. Interestingly, alcohol consumption status is considered as a primary cause for HCC; here, our results revealed that the expression levels of ADH1A-ADH6 were obviously increased in alcohol consumption HCC patients (Fig. 3). Moreover, accumulating evidences have demonstrated that ADH family members were correlated with clinical stages, pathological grades, and TNM classifications in several cancers [19, 29, 30]. In our present study, it showed that the expression levels of ADH1A-ADH1C, and ADH6 were remarkably downregulated according to the pathologic T stage progression of HCC (Fig. 4). In addition, the expression of ADH1A, ADH1B and ADH4 was significantly associated with pathologic T stage (Table 1). Altogether, ADH family members play an important role in the development process of HCC. It is meaningful to evaluate the prognostic value for HCC patients.
In recent years, large numbers of investigations have reported that gene polymorphism of ADHs was correlated with cancer risk [15, 17, 18, 31, 32] . Moreover, the activity of ADH isoenzymes was significantly higher in liver cancer tissues than in healthy tissues [33], suggested the diagnostic value of ADH for the patients with liver cancer. However, rare studies have been performed to evaluate the prognostic value of ADHs mRNA expression in HCC. In the present study, our univariate and multivariate Cox regression analyses results indicated that high ADH1A, ADH1C, ADH4, and ADH6 levels independently predicted improved OS and RFS in HCC patients; whereas, high ADH1B levels independently predicted improved RFS in HCC patients (Table 2, Figs. 5 and 6). Furthermore, our Kaplan-Meier analysis data also revealed that high ADH1A, ADH1C, ADH4, and ADH6 levels predicted good OS and RFS in HCC patients; while, high ADH1B only predicted good RFS in HCC patients (Figs. 7 and 8). Recently, the expression of ADH1A was measured by using MS/MS and TMA in CHCC-HBV patients, which indicated the robust prognostic value of ADH1A for potential clinical application [34]. Moreover, Chen Q, et al also reported that high expression of ADH1C was associated with a good prognosis for HCC patients by using the TCGA internal and three GEO (GSE76427, GSE15654, and GSE14520) external validation cohorts [35]. In addition, the prognostic value of ADH4 was also confirmed by immunohistochemical analysis with 91 paraffin-embedded HCC specimens [36]. Although, a recent study reported that decreased ADH5 expression in HBV-related HCC tumor tissue predicted earlier recurrence [30]. Surprisingly, ADH5 expression could not play a significant role in prediction of OS and RFS in HCC patients depending on our present data. Therefore, our data supposed that ADH family members without ADH5 might serve as the potential biomarkers for the patients with HCC.
ADHs play a pivotal role in the metabolic process of ethanol [26]. Our GO enrichment analysis showed that ADHs were contributed to ethanol metabolism, such as ethanol oxidation, ethanol metabolic process, and primary alcohol metabolic process. Moreover, KEGG enrichment analysis indicated that ADHs were involved in fatty acid degradation, retinol metabolism, and so on (Fig. 9), constitute with what is investigated using GSEA (Fig. 10a and b). In addition, our GSEA results also showed that high expression group of ADHs was significantly and negatively associated with pathways in cancer without ADH5 (Fig. 10c), which suggested that high expression of ADHs could inhibit cancer related pathways and ADHs presented the tumor suppressor role. Increasing evidences indicated that various numbers of signaling pathways participated in the progression of HCC [37]. In order to determine the signaling pathways related to ADHs in HCC patients, GSEA was performed based on PID dataset [38]. Our results showed that low expression group of ADHs without ADH5 was positively related to various pathways (Fig. 10, Table S3 and S4). Interestingly, most of the signaling pathways contributed to promote tumorigenesis, such as ATR pathway [39], FOXM1 and FOXO pathways [40, 41], MTOR pathway [42], NOTCH pathway [43], and P53 downstream pathway [44]. Accordingly, high expression of ADHs could inhibit the malignant process of HCC, which promote the OS and RFS probability of HCC patients. Although low expression group of ADH5 was positively related to oncogenic signaling pathways, such as ATR, FOXM1, MTOR, NOTCH, and P53 downstream pathways, the statistic difference was not significant. Interestingly, low expression group of ADH5 was not positively related to FOXO signaling pathway, which may be associated with the high expression of ADH5 in HCC. By summarizing all the points, ADHs without ADH5 might act as the tumor suppressor via inhibiting oncogenic signaling pathway in HCC.
There were some limitations in our present study, which should be known. Primarily, the clinicopathological information of HCC patients from TCGA website, such as tumor size, hepatitis virus infection, α-fetoprotein, non-alcoholic fatty liver and cirrhosis, was not comprehensive or lost. Secondly, our present study investigates the prognostic value of ADHs for HCC patients at mRNA levels, which is not consummate. Therefore, their prognostic value for HCC patients at protein levels should be further evaluated in our future studies. Thirdly, ADH1A, ADH1B, ADH1C, ADH4, and ADH6 were all associated with the prognosis of HCC patients. In the future, the in vitro and in vivo experiments should be performed to investigate their roles in the progress of HCC, then the best one of them could be selected as diagnostic and prognostic biomarkers for HCC patients. In addition, further effort is also needed to elucidate the mechanisms, which ADHs contribute to the progress of HCC in the future.
Conclusions
In the present study, our results were to explore the expression levels of ADHs in different grouping HCC patients, and also evaluated the correlation between prognosis of HCC and the expression patterns of ADHs. We found that the expression of ADH1A, ADH1B, ADH1C, ADH4, and ADH6 was significantly downregulated in HCC samples compared to normal liver samples; but upregulated in alcohol consumption HCC patients. Moreover, high expression of ADH1A, ADH1B, ADH1C, ADH4, and ADH6 was associated with good prognosis for HCC patients. Therefore, our results provide the potential prognostic biomarkers or molecular targets for the patients with HCC.
Supplementary Information
Additional file 1: Table S1. Enrichment analysis of GO terms for ADHs.
Additional file 2: Table S2. Enrichment analysis of KEGG pathways for ADHs.
Additional file 3: Table S3. Signaling pathways enriched in HCC samples corresponding ADHs expression by GSEA based on KEGG.
Additional file 4: Table S4. Signaling pathways enriched in HCC samples corresponding ADHs expression by GSEA based on PID.
Acknowledgments
The authors thank the contributions of the members of TCGA who provided samples and data used in the present study.
Abbreviations
- ADHs
Alcohol dehydrogenases
- ATR
Ataxia telangiectasia and rad3-related
- CHCC-HBV
Chinese HCC patients with HBV infection
- CI
Confidence interval
- FOX
Forkhead box
- GO
Gene ontology
- GSEA
Gene set enrichment analysis
- HCC
Hepatocellular carcinoma
- HR
Hazard ratio
- KEGG
Kyoto encyclopedia of genes and genomes
- MS
Mass spectrometry
- MTOR
Mammalian target of rapamycin
- NSCLC
Non-small cell lung cancer
- OS
Overall survival
- PID
Pathway interaction database
- RFS
Recurrence-free survival
- TCGA
The Cancer Genome Atlas
- TMA
Tissue microarray
Authors’ contributions
XYL, TTL, DLK, and RXT conceived and designed the experiments. XYL, DLK, and TTL analyzed the data. XYL, TTL, DLK, HJY, FYK and RXT contributed materials and analysis tools. XYL, TTL, DLK, HJY, FYK, and RXT wrote and reviewed the paper. The authors read and approved the final version of the manuscript.
Funding
This work was supported by the National Natural Science Foundation of China (Grant No. 81802389), Qinglan Project in Jiangsu Province, and A Project Funded by the Priority Academic Program Development of Jiangsu Higher Education Institutions (PAPD). The funders have played no role in the research design, data collection and analysis, or writing of the manuscript.
Availability of data and materials
The datasets analyzed in the current study are available in the TCGA repository (https://portal.gdc.cancer.gov/repository).
Ethics approval and consent to participate
No ethics approval was required for the present study. The datasets analyzed in the present study are publicly available.
Consent for publication
Not applicable.
Competing interests
The authors declare that they have no competing interests.
Footnotes
Publisher’s Note
Springer Nature remains neutral with regard to jurisdictional claims in published maps and institutional affiliations.
Xiangye Liu and Tingting Li contributed equally to this work.
Contributor Information
Xiangye Liu, Email: liuxy83@xzhmu.edu.cn.
Renxian Tang, Email: tangrenxian-t@163.com.
Supplementary Information
The online version contains supplementary material available at 10.1186/s12885-020-07689-1.
References
- 1.Bray F, Ferlay J, Soerjomataram I, Siegel RL, Torre LA, Jemal A. Global cancer statistics 2018: GLOBOCAN estimates of incidence and mortality worldwide for 36 cancers in 185 countries. CA Cancer J Clin. 2018;68(6):394–424. doi: 10.3322/caac.21492. [DOI] [PubMed] [Google Scholar]
- 2.Yang JD, Hainaut P, Gores GJ, Amadou A, Plymoth A, Roberts LR. A global view of hepatocellular carcinoma: trends, risk, prevention and management. Nat Rev Gastroenterol Hepatol. 2019;16(10):589–604. doi: 10.1038/s41575-019-0186-y. [DOI] [PMC free article] [PubMed] [Google Scholar]
- 3.Singh AK, Kumar R, Pandey AK. Hepatocellular carcinoma: causes, mechanism of progression and biomarkers. Curr Chem Genom Transl Med. 2018;12:9–26. doi: 10.2174/2213988501812010009. [DOI] [PMC free article] [PubMed] [Google Scholar]
- 4.Kulik L, El-Serag HB. Epidemiology and management of hepatocellular carcinoma. Gastroenterology. 2019;156(2):477–91 e1. [DOI] [PMC free article] [PubMed]
- 5.Yang JD, Roberts LR. Hepatocellular carcinoma: a global view. Nat Rev Gastroenterol Hepatol. 2010;7(8):448–458. doi: 10.1038/nrgastro.2010.100. [DOI] [PMC free article] [PubMed] [Google Scholar]
- 6.Kanda T, Goto T, Hirotsu Y, Moriyama M, Omata M. Molecular mechanisms driving progression of liver cirrhosis towards hepatocellular carcinoma in chronic hepatitis B and C infections: a review. Int J Mol Sci. 2019;20(6):1358. doi: 10.3390/ijms20061358. [DOI] [PMC free article] [PubMed] [Google Scholar]
- 7.Park JW, Chen M, Colombo M, Roberts LR, Schwartz M, Chen PJ, et al. Global patterns of hepatocellular carcinoma management from diagnosis to death: the BRIDGE study. Liver Int. 2015;35(9):2155–2166. doi: 10.1111/liv.12818. [DOI] [PMC free article] [PubMed] [Google Scholar]
- 8.Morgan TR, Mandayam S, Jamal MM. Alcohol and hepatocellular carcinoma. Gastroenterology. 2004;127(5 Suppl 1):S87–S96. doi: 10.1053/j.gastro.2004.09.020. [DOI] [PubMed] [Google Scholar]
- 9.Testino G, Leone S, Borro P. Alcohol and hepatocellular carcinoma: a review and a point of view. World J Gastroenterol. 2014;20(43):15943–15954. doi: 10.3748/wjg.v20.i43.15943. [DOI] [PMC free article] [PubMed] [Google Scholar]
- 10.Seitz HK, Stickel F. Acetaldehyde as an underestimated risk factor for cancer development: role of genetics in ethanol metabolism. Genes Nutr. 2010;5(2):121–128. doi: 10.1007/s12263-009-0154-1. [DOI] [PMC free article] [PubMed] [Google Scholar]
- 11.Cederbaum AI. Alcohol metabolism. Clin Liver Dis. 2012;16(4):667–685. doi: 10.1016/j.cld.2012.08.002. [DOI] [PMC free article] [PubMed] [Google Scholar]
- 12.Edenberg HJ, McClintick JN. Alcohol dehydrogenases, aldehyde dehydrogenases, and alcohol use disorders: a critical review. Alcohol Clin Exp Res. 2018;42(12):2281–2297. doi: 10.1111/acer.13904. [DOI] [PMC free article] [PubMed] [Google Scholar]
- 13.Jairam S, Edenberg HJ. Single-nucleotide polymorphisms interact to affect ADH7 transcription. Alcohol Clin Exp Res. 2014;38(4):921–929. doi: 10.1111/acer.12340. [DOI] [PMC free article] [PubMed] [Google Scholar]
- 14.Jelski W, Zalewski B, Szmitkowski M. Alcohol dehydrogenase (ADH) isoenzymes and aldehyde dehydrogenase (ALDH) activity in the sera of patients with liver cancer. J Clin Lab Anal. 2008;22(3):204–209. doi: 10.1002/jcla.20241. [DOI] [PMC free article] [PubMed] [Google Scholar]
- 15.Hashibe M, Mckay JD, Curado MP, Oliveira JC, Koifman S, Koifman R, et al. Multiple ADH genes are associated with upper aerodigestive cancers. Nat Genet. 2008;40(6):707–709. doi: 10.1038/ng.151. [DOI] [PubMed] [Google Scholar]
- 16.Ding J, Li S, Wu J, Gao C, Zhou J, Cao H, et al. Alcohol dehydrogenase-2 and aldehyde dehydrogenase-2 genotypes, alcohol drinking and the risk of primary hepatocellular carcinoma in a Chinese population. Asian Pac J Cancer Prev. 2008;9(1):31–35. [PubMed] [Google Scholar]
- 17.Abe H, Aida Y, Seki N, Sugita T, Tomita Y, Nagano T, et al. Aldehyde dehydrogenase 2 polymorphism for development to hepatocellular carcinoma in east Asian alcoholic liver cirrhosis. J Gastroenterol Hepatol. 2015;30(9):1376–1383. doi: 10.1111/jgh.12948. [DOI] [PubMed] [Google Scholar]
- 18.Homann N, Stickel F, Konig IR, Jacobs A, Junghanns K, Benesova M, et al. Alcohol dehydrogenase 1C*1 allele is a genetic marker for alcohol-associated cancer in heavy drinkers. Int J Cancer. 2006;118(8):1998–2002. doi: 10.1002/ijc.21583. [DOI] [PubMed] [Google Scholar]
- 19.Wang P, Zhang L, Huang C, Huang P, Zhang J. Distinct prognostic values of alcohol dehydrogenase family members for non-small cell lung cancer. Med Sci Monit. 2018;24:3578–3590. doi: 10.12659/MSM.910026. [DOI] [PMC free article] [PubMed] [Google Scholar]
- 20.Guo E, Wei H, Liao X, Xu Y, Li S, Zeng X. Prognostic value of alcohol dehydrogenase mRNA expression in gastric cancer. Oncol Lett. 2018;15(4):5505–5516. doi: 10.3892/ol.2018.8007. [DOI] [PMC free article] [PubMed] [Google Scholar]
- 21.Subramanian A, Tamayo P, Mootha VK, Mukherjee S, Ebert BL, Gillette MA, et al. Gene set enrichment analysis: a knowledge-based approach for interpreting genome-wide expression profiles. Proc Natl Acad Sci U S A. 2005;102(43):15545–15550. doi: 10.1073/pnas.0506580102. [DOI] [PMC free article] [PubMed] [Google Scholar]
- 22.Cao H, Chu X, Wang Z, Guo C, Shao S, Xiao J, et al. High FOXK1 expression correlates with poor outcomes in hepatocellular carcinoma and regulates stemness of hepatocellular carcinoma cells. Life Sci. 2019;228:128–134. doi: 10.1016/j.lfs.2019.04.068. [DOI] [PubMed] [Google Scholar]
- 23.Carlson M. GO.db: A set of annotation maps describing the entire Gene Ontology. R package version 3.8.2. 2019.
- 24.Carlson M. KEGG. db: a set of annotation maps for KEGG. R package version 3.1.2. 2016.
- 25.Team RC . R: a language and environment for statistical computing. 2013. [Google Scholar]
- 26.Seitz HK, Becker P. Alcohol metabolism and cancer risk. Alcohol Res Health. 2007;30(1):38–41. [PMC free article] [PubMed] [Google Scholar]
- 27.Jemal A, Center MM, DeSantis C, Ward EM. Global patterns of cancer incidence and mortality rates and trends. Cancer Epidemiol Biomarkers Prev. 2010;19(8):1893–1907. doi: 10.1158/1055-9965.EPI-10-0437. [DOI] [PubMed] [Google Scholar]
- 28.Gao N, Li J, Li MR, Qi B, Wang Z, Wang GJ, et al. Higher activity of alcohol dehydrogenase is correlated with hepatic fibrogenesis. J Pharmacol Exp Ther. 2018;367(3):473–482. doi: 10.1124/jpet.118.249425. [DOI] [PubMed] [Google Scholar]
- 29.Liao X, Huang R, Liu X, Han C, Yu L, Wang S, et al. Distinct prognostic values of alcohol dehydrogenase mRNA expression in pancreatic adenocarcinoma. Onco Targets Ther. 2017;10:3719–3732. doi: 10.2147/OTT.S140221. [DOI] [PMC free article] [PubMed] [Google Scholar]
- 30.Shang L, Zhu G, Su H, Chen B, Ye X, Chen X, et al. Identification of alcohol dehydrogenase as a potential prognostic marker in HBV-related hepatocellular carcinoma. Int J Clin Exp Med. 2017;10(3):4457–4472. [Google Scholar]
- 31.Mohelnikova-Duchonova B, Vrana D, Holcatova I, Ryska M, Smerhovsky Z, Soucek P. CYP2A13, ADH1B, and ADH1C gene polymorphisms and pancreatic cancer risk. Pancreas. 2010;39(2):144–148. doi: 10.1097/MPA.0b013e3181bab6c2. [DOI] [PubMed] [Google Scholar]
- 32.Ghosh S, Bankura B, Ghosh S, Saha ML, Pattanayak AK, Ghatak S, et al. Polymorphisms in ADH1B and ALDH2 genes associated with the increased risk of gastric cancer in West Bengal, India. BMC Cancer. 2017;17(1):782. doi: 10.1186/s12885-017-3713-7. [DOI] [PMC free article] [PubMed] [Google Scholar]
- 33.Jelski W, Zalewski B, Szmitkowski M. The activity of class I, II, III, and IV alcohol dehydrogenase (ADH) isoenzymes and aldehyde dehydrogenase (ALDH) in liver cancer. Dig Dis Sci. 2008;53(9):2550–2555. doi: 10.1007/s10620-007-0153-2. [DOI] [PubMed] [Google Scholar]
- 34.Gao Q, Zhu H, Dong L, Shi W, Chen R, Song Z, et al. Integrated proteogenomic characterization of HBV-related hepatocellular carcinoma. Cell. 2019;179(2):561–77 e22. [DOI] [PubMed]
- 35.Chen Q, Li F, Gao Y, Xu G, Liang L, Xu J. Identification of energy metabolism genes for the prediction of survival in hepatocellular carcinoma. Front Oncol. 2020;10:1210. doi: 10.3389/fonc.2020.01210. [DOI] [PMC free article] [PubMed] [Google Scholar]
- 36.Wei RR, Zhang MY, Rao HL, Pu HY, Zhang HZ, Wang HY. Identification of ADH4 as a novel and potential prognostic marker in hepatocellular carcinoma. Med Oncol. 2012;29(4):2737–2743. doi: 10.1007/s12032-011-0126-3. [DOI] [PubMed] [Google Scholar]
- 37.Blagotinsek K, Rozman D. Targeting signalling pathways in hepatocellular carcinoma. Curr Pharm Des. 2017;23(1):170–175. doi: 10.2174/1381612822666161006160005. [DOI] [PubMed] [Google Scholar]
- 38.Schaefer CF, Anthony K, Krupa S, Buchoff J, Day M, Hannay T, et al. PID: the pathway interaction database. Nucleic Acids Res. 2009;37(Database issue):D674–D679. doi: 10.1093/nar/gkn653. [DOI] [PMC free article] [PubMed] [Google Scholar]
- 39.Karnitz LM, Zou L. Molecular pathways: targeting ATR in cancer therapy. Clin Cancer Res. 2015;21(21):4780–4785. doi: 10.1158/1078-0432.CCR-15-0479. [DOI] [PMC free article] [PubMed] [Google Scholar]
- 40.Raychaudhuri P, Park HJ. FoxM1: a master regulator of tumor metastasis. Cancer Res. 2011;71(13):4329–4333. doi: 10.1158/0008-5472.CAN-11-0640. [DOI] [PMC free article] [PubMed] [Google Scholar]
- 41.Lu M, Hartmann D, Braren R, Gupta A, Wang B, Wang Y, et al. Oncogenic Akt-FOXO3 loop favors tumor-promoting modes and enhances oxidative damage-associated hepatocellular carcinogenesis. BMC Cancer. 2019;19(1):887. doi: 10.1186/s12885-019-6110-6. [DOI] [PMC free article] [PubMed] [Google Scholar]
- 42.Zahid KR, Yao S, Khan ARR, Raza U, Gou D. mTOR/HDAC1 crosstalk mediated suppression of ADH1A and ALDH2 links alcohol metabolism to hepatocellular carcinoma onset and progression in silico. Front Oncol. 2019;9:1000. doi: 10.3389/fonc.2019.01000. [DOI] [PMC free article] [PubMed] [Google Scholar]
- 43.Huang Q, Li J, Zheng J, Wei A. The carcinogenic role of the Notch signaling pathway in the development of hepatocellular carcinoma. J Cancer. 2019;10(6):1570–1579. doi: 10.7150/jca.26847. [DOI] [PMC free article] [PubMed] [Google Scholar]
- 44.Tang Q, Su Z, Gu W, Rustgi AK. Mutant p53 on the path to metastasis. Trends Cancer. 2020;6(1):62–73. doi: 10.1016/j.trecan.2019.11.004. [DOI] [PMC free article] [PubMed] [Google Scholar]
Associated Data
This section collects any data citations, data availability statements, or supplementary materials included in this article.
Supplementary Materials
Additional file 1: Table S1. Enrichment analysis of GO terms for ADHs.
Additional file 2: Table S2. Enrichment analysis of KEGG pathways for ADHs.
Additional file 3: Table S3. Signaling pathways enriched in HCC samples corresponding ADHs expression by GSEA based on KEGG.
Additional file 4: Table S4. Signaling pathways enriched in HCC samples corresponding ADHs expression by GSEA based on PID.
Data Availability Statement
The datasets analyzed in the current study are available in the TCGA repository (https://portal.gdc.cancer.gov/repository).


