
Figure 1.
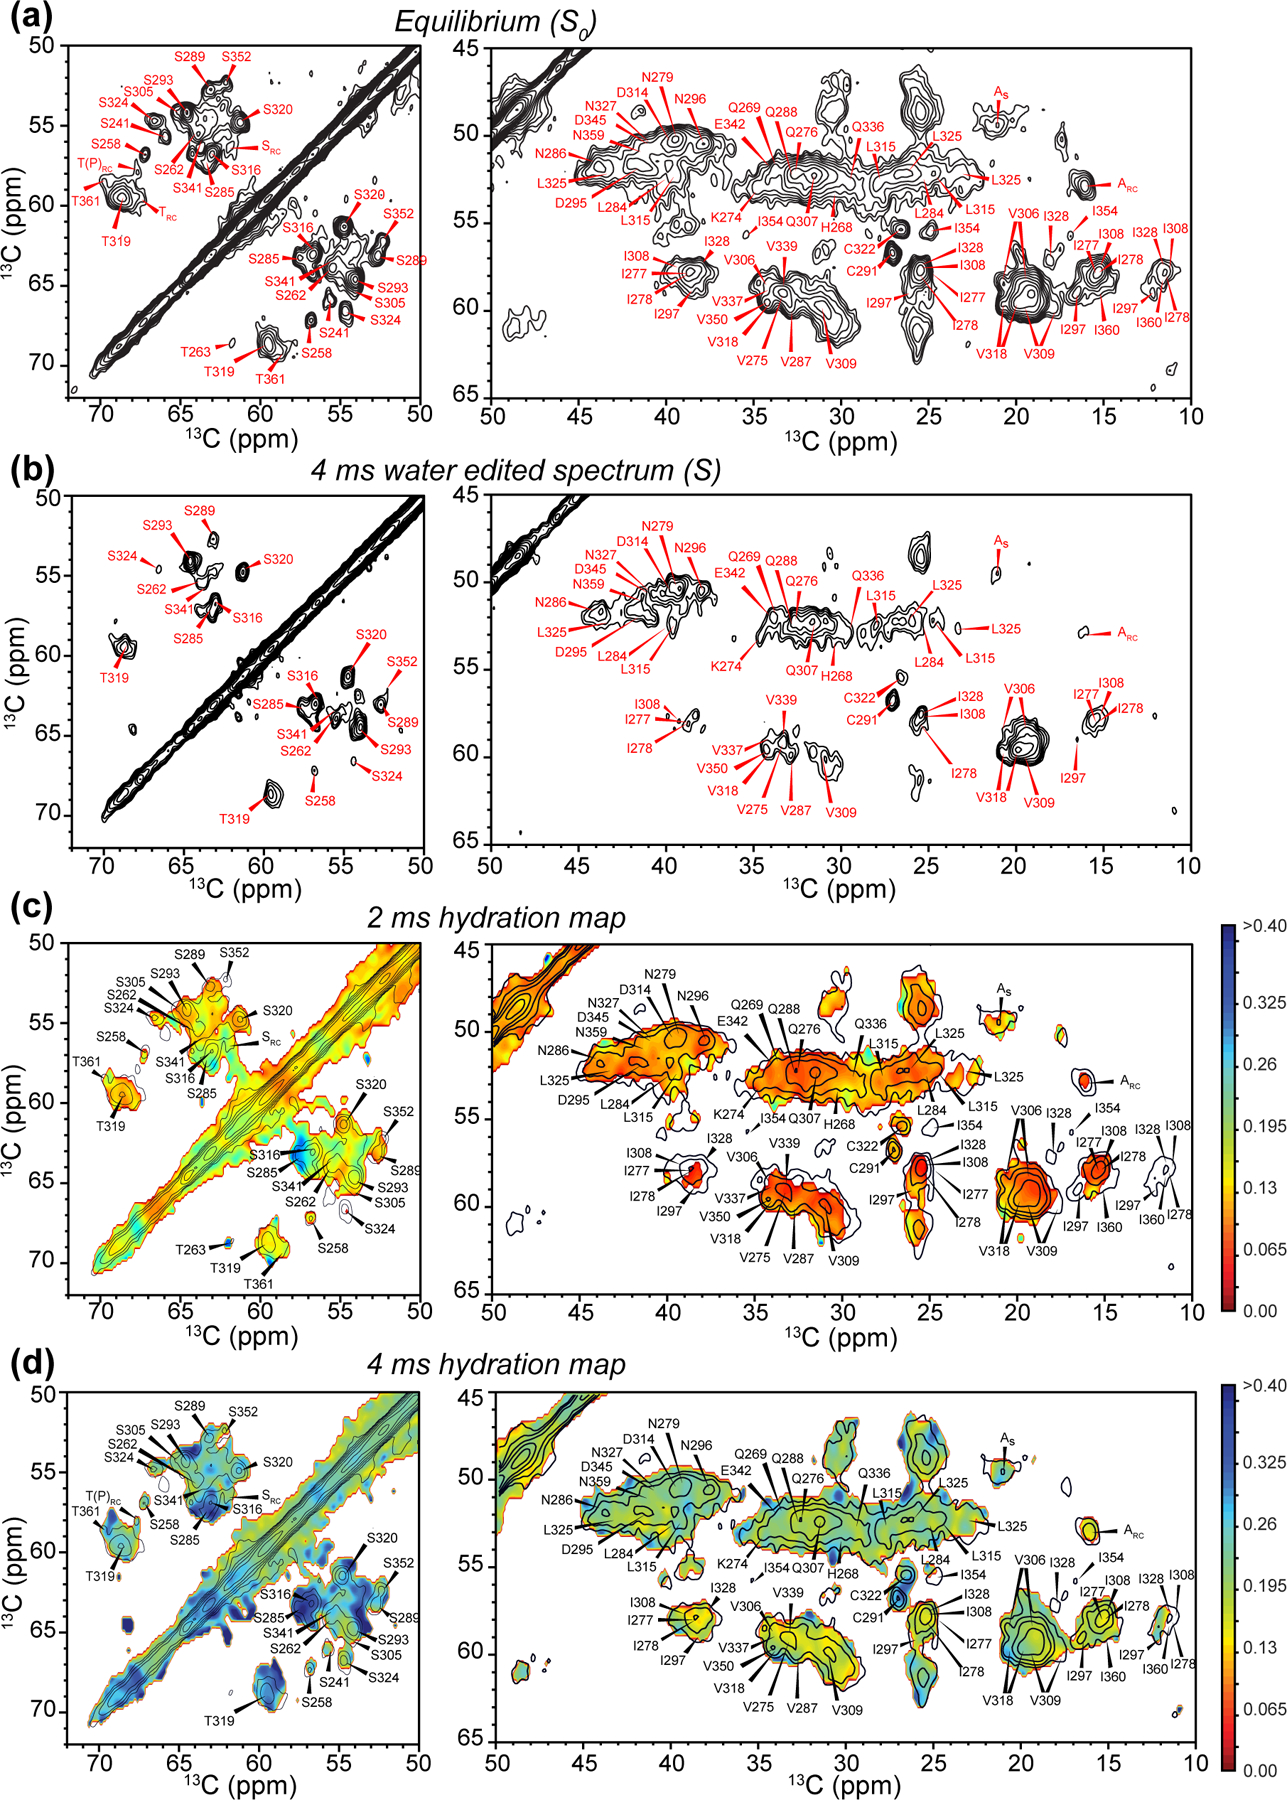
Water-edited 2D 13C-13C correlation spectra for investigating site-specific hydration. (a) Equilibrium 2D spectrum, measured with CP without water selection. The Ser/Thr region and the rest of the Cα-CX aliphatic region are shown. Assignments are based on previous 3D NCC correlation spectra.19 (b) 4 ms water-edited 2D spectrum. (c) Hydration map (pointwise S/S0 values) for the 2 ms water-edited spectrum, overlaid with the equilibrium spectrum, which is plotted with half the number of contour levels as in (a) for clarity. (d) Hydration map for the 4 ms water-edited spectrum. The same color scale as (c) is used to show the increased water polarization transfer compared to 2 ms mixing.