

Supplemental Digital Content is available in the text.
Keywords: cardiovascular disease, hypertension, mean arterial pressure, mortality, oscillometry
Abstract
Major adverse cardiovascular events are closely associated with 24-hour blood pressure (BP). We determined outcome-driven thresholds for 24-hour mean arterial pressure (MAP), a BP index estimated by oscillometric devices. We assessed the association of major adverse cardiovascular events with 24-hour MAP, systolic BP (SBP), and diastolic BP (DBP) in a population-based cohort (n=11 596). Statistics included multivariable Cox regression and the generalized R2 statistic to test model fit. Baseline office and 24-hour MAP averaged 97.4 and 90.4 mm Hg. Over 13.6 years (median), 2034 major adverse cardiovascular events occurred. Twenty-four-hour MAP levels of <90 (normotension, n=6183), 90 to <92 (elevated MAP, n=909), 92 to <96 (stage-1 hypertension, n=1544), and ≥96 (stage-2 hypertension, n=2960) mm Hg yielded equivalent 10-year major adverse cardiovascular events risks as office MAP categorized using 2017 American thresholds for office SBP and DBP. Compared with 24-hour MAP normotension, hazard ratios were 0.96 (95% CI, 0.80–1.16), 1.32 (1.15–1.51), and 1.77 (1.59–1.97), for elevated and stage-1 and stage-2 hypertensive MAP. On top of 24-hour MAP, higher 24-hour SBP increased, whereas higher 24-hour DBP attenuated risk (P<0.001). Considering the 24-hour measurements, R2 statistics were similar for SBP (1.34) and MAP (1.28), lower for DBP than for MAP (0.47), and reduced to null, if the base model included SBP and DBP; if the ambulatory BP indexes were dichotomized according to the 2017 American guideline and the proposed 92 mm Hg for MAP, the R2 values were 0.71, 0.89, 0.32, and 0.10, respectively. In conclusion, the clinical application of 24-hour MAP thresholds in conjunction with SBP and DBP refines risk estimates.
The Global Burden of Disease Study 2010 reported that high blood pressure (BP) is the major modifiable cardiovascular risk factor, causing 9.4 million deaths annually, that is, more than half of cardiovascular mortality.1 Prevention of the cardiovascular complications associated with hypertension requires that BP be accurately measured,2 preferably by 24-hour ambulatory monitoring.3,4 Because mercury is being phased out, oscillometry is replacing the auscultatory Korotkoff approach in use since 1910.5 The proprietary software implemented in automated oscillometric devices draws an envelope around the pressure oscillations in the brachial cuff and estimates mean arterial pressure (MAP) as the cuff pressure at the point of maximal oscillations (Figure S1 in the Data Supplement). From the so estimated MAP, the software then computes systolic and diastolic BP.6,7 For validated devices, the fault tolerance around the calculated systolic and diastolic BP is ±5 mm Hg.8 Furthermore, MAP is similar throughout the arterial tree,9 thereby avoiding the dilemma as to whether central compared with brachial BP confers higher cardiovascular risk.10 In addition, MAP captures risk-related information associated with both systolic and diastolic BP.11 In an individual participant meta-analysis of 1 million people, office MAP was a better predictor of vascular mortality than systolic or diastolic BP or pulse pressure.12 However, to our knowledge, hypertension guidelines do not propose how MAP should be used for risk stratification.3,4 We recently demonstrated that of all in-office and ambulatory BP indexes the association of mortality and cardiovascular complications was closest with the 24-hour ambulatory BP.13 Given the clinical underuse of MAP and the predictive superiority of 24-hour BP,13 we established in a population-based cohort of 11 596 adults, recruited in Europe, Asia, and South America, outcome-driven thresholds for 24-hour MAP that might guide clinical practice and we assessed the strength of its associations with fatal and nonfatal cardiovascular end points.
Methods
The International Database on Ambulatory Blood Pressure in Relation to Cardiovascular Outcome data and the SAS programs written for the present analysis will not be made available to other researchers because participant-level data sharing was not covered by the informed consent and because this option is not in compliance with the General Data Protection Act (EU Directive 2016/680). However, any scientifically motivated request, submitted to the study coordinator (J.A. Staessen), to run additional analyses on the data set used in the current article, will be implemented if only summary statistics are requested.
Study Participants
All population studies included in the International Database on Ambulatory Blood Pressure in Relation to Cardiovascular Outcome13,14 received ethical approval from the Institutional Review Boards in their country of origin and adhered to the principles of the Declaration of Helsinki.15 Participants provided informed written consent. The International Database on Ambulatory Blood Pressure in Relation to Cardiovascular Outcome database, constructed and maintained in Leuven, did not include any data allowing identification of individuals. In line with national regulations, Review Boards either waived or provided ethical clearance for the secondary use of data to be included in the International Database on Ambulatory Blood Pressure in Relation to Cardiovascular Outcome resource. Population studies qualified for inclusion, if office and ambulatory BP and cardiovascular risk factors had been measured at baseline and if follow-up included both fatal and nonfatal outcomes. Across all studies, enrollment took place from August 1985 until May 2010 (Table S1). Baseline refers to the date of the first BP measurement, ranging across cohorts from May 1985 until May 2010; the last follow-up data were collected from August 2007 to October 2016. Table S2 provides the literature sources describing the design characteristics of the 13 studies (references 1–25 in the Data Supplement).
BP Measurements
Nurses or physicians measured office BP with a standard mercury sphygmomanometer or with validated auscultatory or oscillometric devices. The office BP was the average of 2 consecutive readings. MAP on office measurement was diastolic BP plus one-third of pulse pressure (the difference between systolic and diastolic BP) and categorized according to the 2017 American guidelines for systolic and diastolic pressure,3 rounded to the closest integer. The cut off points were <93 mm Hg for normotension ([80+0.33]×[120–80]) mm Hg; 93 to <97 mm Hg for elevated BP; 97 to <107 mm Hg for stage-1 hypertension, ≥107 mm Hg for stage-2 hypertension combined with severe hypertension. Hypertension was an office BP of ≥130 mm Hg systolic or ≥80 mm Hg diastolic or use of antihypertensive drugs.3
For ambulatory monitoring (Table S3), portable oscillometric monitors were programmed to obtain readings at 30-minute intervals throughout the whole day or at intervals of 15 to 30 minutes during daytime and at intervals ranging from 20 to 60 minutes during nighttime. Ambulatory recordings had to include at least 6 daytime and 3 nighttime readings.16
Ascertainment of End Points
We ascertained vital status and the incidence of fatal and nonfatal end points from the appropriate sources in each country. Prespecified end points were coded according to the International Classification of Diseases (Table S4). The primary end point was a composite cardiovascular outcome consisting of cardiovascular mortality, including sudden death, nonfatal coronary events, coronary revascularization, heart failure, and stroke. Secondary end points included total mortality, cardiovascular mortality, fatal and nonfatal coronary end points, and fatal and nonfatal stroke excluding transient ischemic attack. The diagnosis of heart failure required hospitalization in the 2 Scandinavian cohorts (Table S4). In the other cohorts, it was a clinical diagnosis or the diagnosis on the death certificate. All end points were validated against hospital files or medical records held by primary care physicians, specialists, or hospitals. In all outcome analyses, only the first event within each category was considered. Participants free of events were censored at last follow-up.
Statistical Analysis
For database management and statistical analysis, we used SAS software, version 9.4, maintenance level 5. We applied the Kolmogorov-Smirnov test for assessing the normality of distributions. For between-group comparison of means and proportions, we applied the large-sample z-test and Fisher exact test, respectively. After stratification for cohort and sex, we interpolated missing values of body mass index and total serum cholesterol from the regression slopes on age. In participants with unknown status of smoking, drinking, diabetes, or history of cardiovascular disease, we set the indicator (dummy) variable to the cohort- and sex-specific mean of the codes (0, 1).
In multivariable-adjusted Cox regression, we accounted for cohort (random effect), sex, and baseline characteristics including age, body mass index, smoking and drinking, serum cholesterol, antihypertensive drug intake, history of cardiovascular disease, and diabetes. To adjust for cohort, we pooled participants recruited in the framework of the European Project on Genes in Hypertension (Gdańsk, Kraków, Novosibirsk, Padova, and Pilsen; Table S1). We checked the proportional hazards assumption by the Kolmogorov-type supremum test and by testing the interaction between BP and follow-up time.
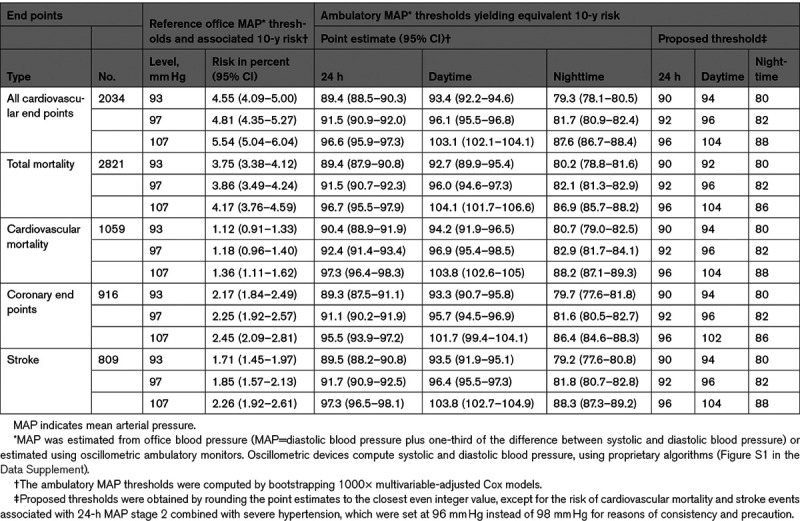
We obtained operational thresholds for MAP by ambulatory monitoring in 5 steps.14 First, we computed the 10-year incidence rates of end points associated with office MAP, using as thresholds 93, 97, and 107 mm Hg. Second, we computed the 10-year risk of end points associated with ambulatory MAP ranging from the 10th up to the 90th percentile, using intervals of 2 mm Hg. In a third step, we selected the ambulatory MAP levels that were associated with similar 10-year risks as the office MAP thresholds. Next, we calculated the bootstrap distribution of the so obtained ambulatory MAP thresholds by randomly resampling the study population 1000× with replacement. For each new sample, we repeated the first 3 steps, while accounting for tied event times. Finally, we calculated the bootstrap point estimates and 95% CIs of the ambulatory MAP thresholds as the mean±1.96 SEs of the bootstrap distribution.
Based on the thresholds for the 24-hour MAP obtained by the bootstrap procedure, we computed incidence rates and multivariable-adjusted hazard ratios as metrics of absolute and relative risk, respectively. Rates were standardized by the direct method for cohort, sex and age (<40, 40 to <60, and ≥60 years) and 95% CIs were computed as  where R and N are the rate and the number of individuals used to compute the rate. We constructed heat maps to visualize the contribution of 24-hour systolic, diastolic, and 24-hour MAP to the association with the primary end point. Improvement in the fit of nested Cox models was assessed by the log likelihood ratio and the generalized R2 statistic.17 Statistical significance was a 2-tailed α-level of 0.05 or less.
Results
Baseline Characteristics
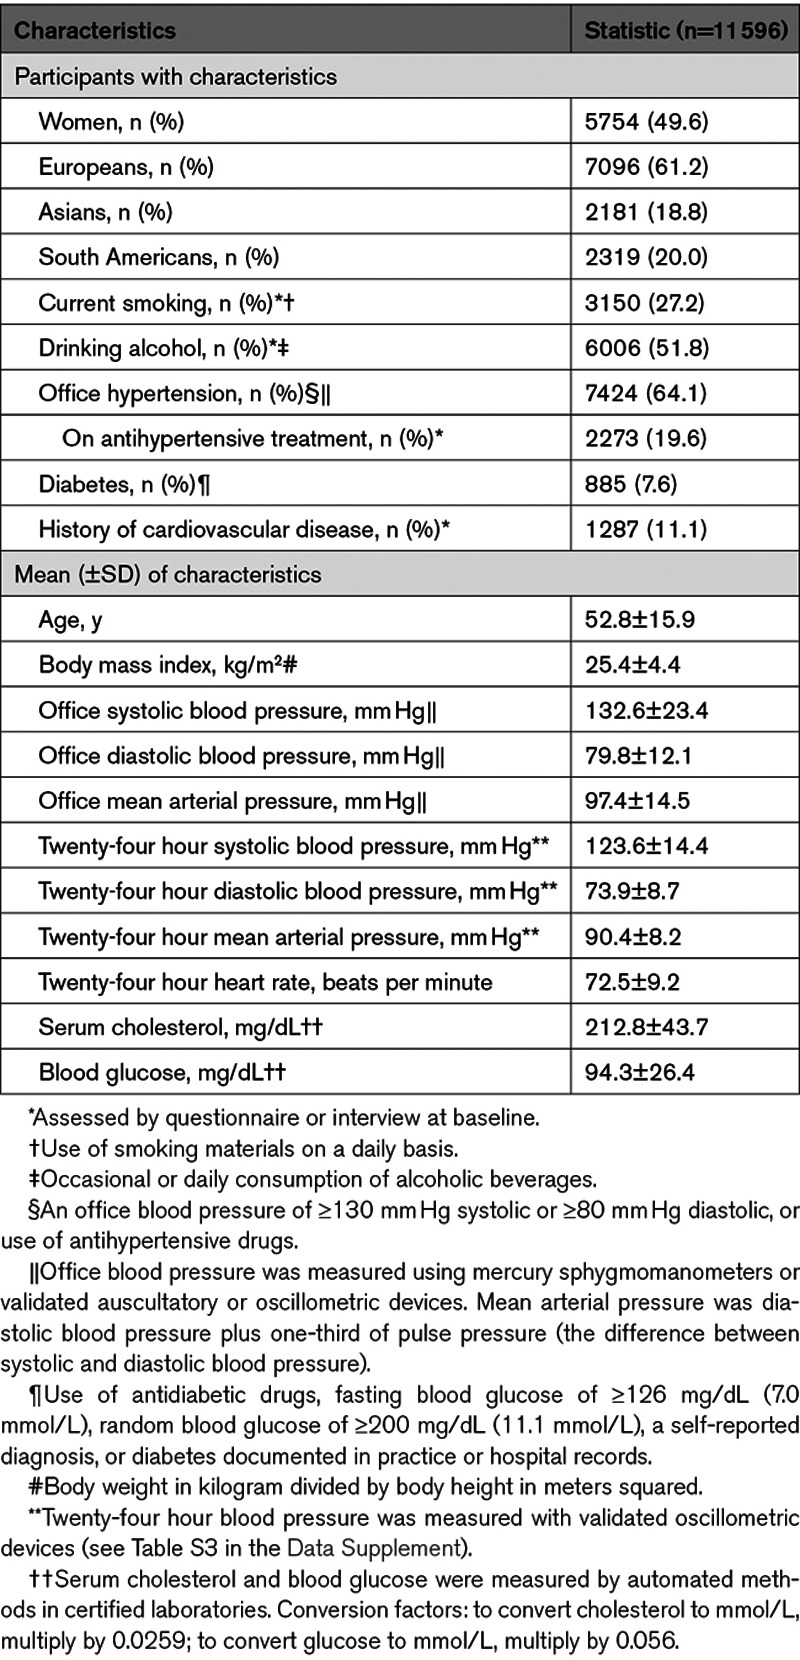
Of 13 728 people included in the database, we excluded 2132, because they were adolescents younger than 18 years (n=317), because their office BP or use of antihypertensive drugs had not been recorded at baseline (n=255), or because their ambulatory BP recording included fewer readings than required (n=1560). This left 11 596 individuals for statistical analysis (Table 1). Missing values of body mass index (n=34), serum cholesterol (n=903), smoking (n=96), diabetes (n=5), and history of cardiovascular disease (n=1) were interpolated or set to the cohort- and sex-specific means. Table 1 lists the baseline characteristics of the participants. Mean age at enrollment was 52.8 years. Across increasing fourths (quartiles) of the 24-hour MAP distribution (Table S5), the percentage of women decreased while the prevalence of hypertension and diabetes increased as well as the average levels of office and 24-hour BP, body mass index, serum cholesterol, and blood glucose (P value for linear trend <0.001).
Table 1.
Baseline Characteristics of Participants
Office and Ambulatory BP
On office measurement, systolic/diastolic BP averaged 132.6/79.8 mm Hg, and MAP 97.4 mm Hg (Table 1). The median number of ambulatory readings recorded over 24-hour was 55 (5th–95th percentile interval, 33–82), ranging across cohorts (Table S3) from 37 (5th–95th percentile interval, 26–42) to 80 (5th–95th percentile interval, 67–83). On 24-hour monitoring, systolic/diastolic BP averaged 123.6/73.9 mm Hg, and MAP 90.4 mm Hg (Table 1). All BP measurements were highly correlated (Table S6; P<0.0001).
24-Hour MAP Thresholds
In all Cox regression models that follow, the proportional hazard assumption was met. The number of person-years of follow-up totaled 158 431 in 11 596 participants. Over a median follow-up of 13.6 years (5th–95th percentile interval, 3.6–26.0), 2034 primary end points occurred, including 916 (45.0%) coronary end points, and 809 (39.8%) strokes. Over the same time span, 2821 participants died, 1059 (37.5%) of cardiovascular disease (Table S4). Using the bootstrap procedure (Table 2), we obtained as thresholds for 24-hour MAP: <90 mm Hg (normotension); 90 to <92 mm Hg (elevated MAP); 92 to <96 mm Hg (stage-1 hypertension), and ≥96 mm Hg (stage-2 combined with severe hypertension; henceforth referred to as stage-2 hypertension). The corresponding thresholds for daytime and nighttime MAP were 94/80 mm Hg, 96/82 mm Hg, and 104/88 mm Hg for elevated, stage 1 and stage 2 hypertension, respectively. The thresholds based on the full data set were similar to the means of the bootstraps. In sensitivity analyses, rounded thresholds were 2 mm Hg lower in women than in men, and among participants with a previous history of cardiovascular diseases (Table S7). However, the thresholds remained largely consistent using 16/6 or 11/5 for the number of daytime/nighttime readings, in participants untreated or treated for hypertension at baseline, in patients with or without diabetes at baseline (Table S7), after excluding one cohort at a time (Table S8), and in Europeans compared with Asians and South Americans (Table S9).
Table 2.
Ambulatory MAP Thresholds Yielding Equivalent 10-y Risk Compared With the Reference Thresholds of Office MAP in 11 596 Participants
Absolute Risk Associated With 24-Hour MAP
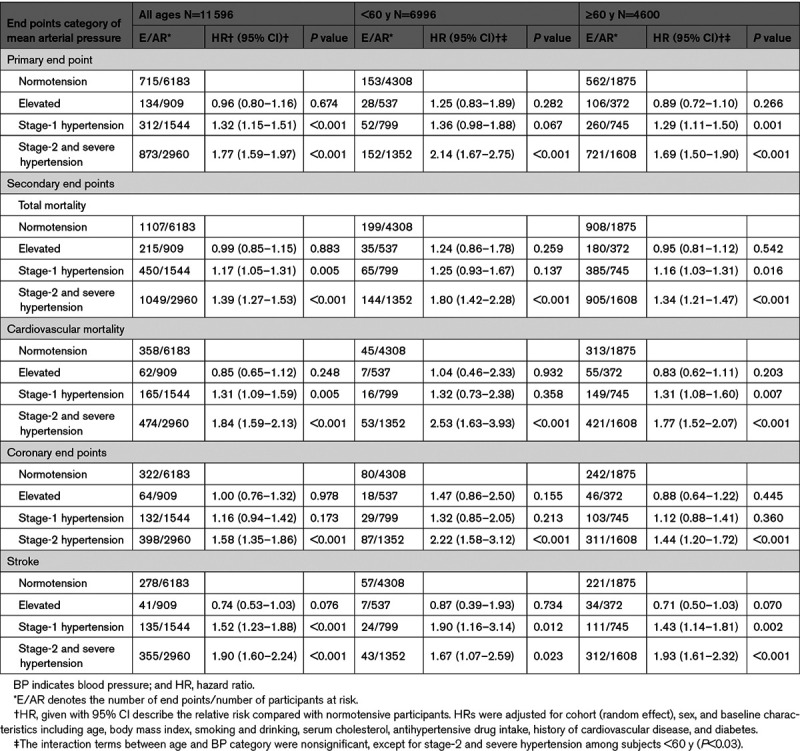
Based on the aforementioned MAP thresholds, the primary end point occurred in 715 of 6183 normotensive participants (11.6%; rate per 1000 person-years, 11.9 [95% CI, 11.1–13.2]); in 134 of 909 people with elevated BP (14.7%; 11.3 [9.5–13.6]); in 312 of 1544 participants with stage-1 hypertension (20.2%; 15.2 [13.5–17.2]); and in 873 of 2960 stage-2 hypertensive patients (29.5%; 21.5 [20.0–23.3]). The increase in absolute risk across higher MAP categories was highly significant (P<0.001). This was also the case for the secondary end points (Table S10).
Relative Risk Associated With 24-Hour MAP
Compared with the normotensive reference group (Table 3), the relative risk of a primary end point associated with 24-hour MAP was 32% higher in patients with stage-1 hypertension and 77% higher in those with stage-2 hypertension (P<0.001). For the secondary end points, the corresponding risk estimates ranged from 16% to 52% for stage-1 hypertension (P≤0.173 to <0.010) and from 39% to 90% for stage-2 hypertension (P<0.001). These findings were direction wise consistent in 6996 participants younger than 60 years and in 4600 patients aged 60 years or more (Table 3), albeit that in the younger age group the relative risk of cardiovascular mortality and coronary end points was formally significant only in patients with stage-2 hypertension (P<0.001). The interaction terms between age and the 24-hour MAP categories were nonsignificant (Table 3).
Table 3.
Association of End Points With 24-h Mean Arterial Pressure Categories
Association of the Primary End point With MAP, Systolic and Diastolic BP
We stratified the analysis of 24-hour MAP by the median of the MAP distribution (90 mm Hg). In 2-mm Hg steps, hazard ratios were computed for lower and higher MAP levels with as reference group participants with levels of 90 mm Hg or more or <90 mm Hg, respectively. In line with the data in Table 2, the risk of the primary end point (Figure 1A) increased above unity at a level of ≈92 mm Hg. Using the American College of Cardiology/American Heart Association thresholds for 24-hour systolic/diastolic BP (<125/<75 versus ≥125/≥75 mm Hg) and the presently obtained thresholds for 24-hour MAP (<92 versus ≥92 mm Hg; Table 2), the 11 596 participants were subdivided in 4 groups. For systolic combined with MAP, 6284 people (54.2%) were normotensive for both BP indexes (group A), 808 (7.0%) had high systolic BP but normal MAP (group B), 585 (5.0%) had normal systolic BP but elevated MAP (group C), and 3919 (33.8%) had both elevated systolic BP and MAP (group D). For cross-classification with diastolic BP, these numbers were 6427 (55.4%), 665 (5.7%), 518 (4.5%), and 3986 (34.4%), respectively. In multivariable-adjusted analyses with group A as reference, the relative risk was similar in systolic/diastolic groups B (+8%/−8%; P≥0.317; Figure 1B and 1C) but elevated in group C (+34%/+46%; P≤0.027) and in group D (+71%/+64%; P<0.001).
Figure 1.
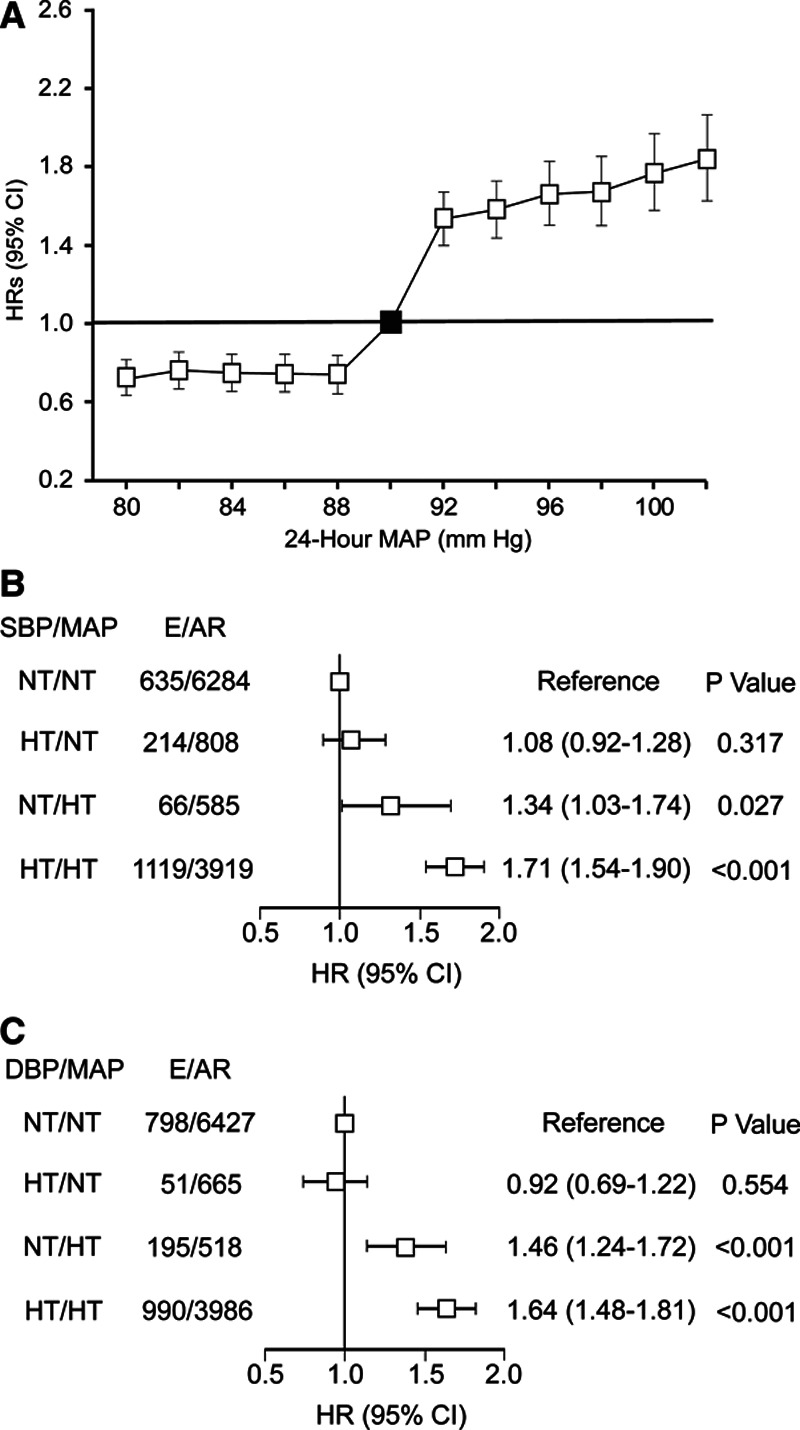
Multivariable-adjusted hazard ratios (HRs; 95% CI) for the primary end point in relation to 24-h blood pressure (BP). A, The analysis was stratified by the median (90 mm Hg) of mean arterial pressure (MAP). HRs were computed comparing participants with MAP ≤80, ≤82, ≤84, ≤86, or ≤88 with those with MAP >90 mm Hg and comparing participants with MAP ≥92, ≥94, ≥96, ≥98, ≥100, or ≥102 with those with MAP <90 mm Hg. Hazard ratios were adjusted for cohort (random effect), sex, and baseline characteristics including age, body mass index, smoking and drinking, serum cholesterol, antihypertensive drug intake, history of cardiovascular disease, and diabetes. Vertical bars denote 95% CIs. This plot confirmed the increase in risk when MAP was ≥92 mm Hg. B and C, The 11 596 participants were subdivided according the American College of Cardiology/American Heart Association thresholds for 24-h systolic BP (SBP) and diastolic BP (DBP) and the calculated 24-h MAP thresholds (Table 2). The multivariable-adjusted HRs, given with 95% CI, represent the risk of a primary end point with normotension for SBP and MAP (B) or normotension for diastolic and MAP (C) as reference. E/AR indicates number of participants with a primary end point/number of participants at risk; and NT/HT, normotension/hypertension, and E/AR number of participants with a primary endpoint/number of participants at risk.
Heat maps combining 24-hour systolic, diastolic and MAP (Figure 2) showed along the horizontal axis that the 10-year risks of the primary end point increased with higher MAP (P<0.001). Along the vertical axis, higher systolic BP (Figure 2C; P<0.001) added to the risk conferred by MAP, whereas higher diastolic BP attenuated the risk (Figure 2D; P<0.001). Combined with MAP, 24-hour pulse pressure added to the risk conferred by MAP (Figure S2), replicating the results for systolic BP (Figure 2C). Finally, we assessed the log likelihood ratios and generalized R2 statistics across nested models. The associations of the primary end point with MAP and systolic BP, both analyzed as continuous variables, were similar if the base model included the covariables accounted for in adjusted analyses (R2, 1.34 and 1.28, respectively; Table S11). For MAP added to the covariables and diastolic BP, the R2 was 0.47. If the base model included the covariables and both systolic and diastolic BP, continuous MAP did not add to the model fit (Table S11). If MAP and systolic and diastolic BP were dichotomized as in Figure 1B, the corresponding R2 values were 0.71, 0.89 0.32, and 0.10, respectively (Table S12).
Figure 2.
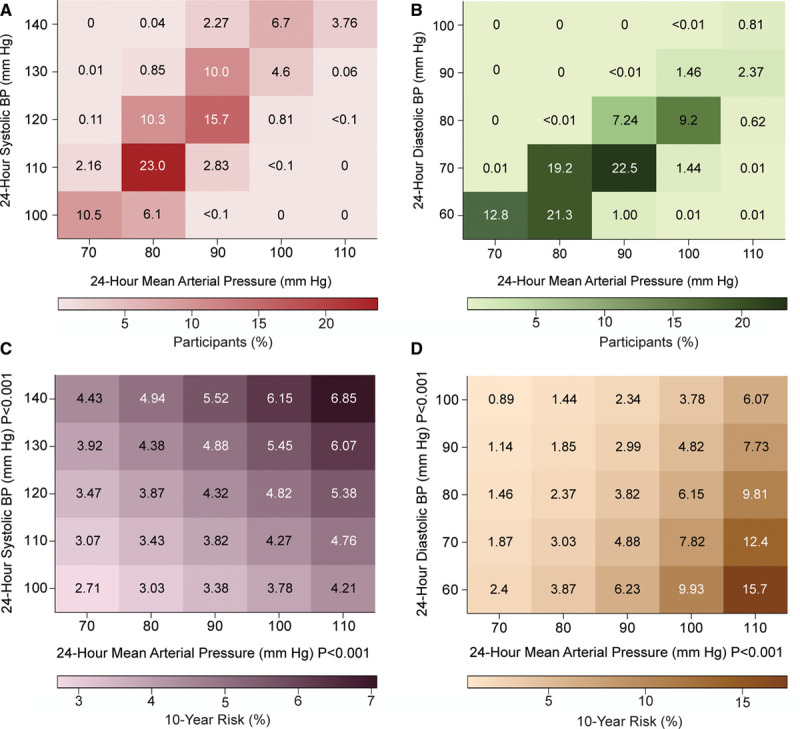
Heat maps depicting the 10-y risk of a primary end point in relation to 24-h mean arterial, systolic and diastolic BP in 11 596 participants. Numbers in the (A) and (B) grids represent the percentage of participants within each BP cross-classification category; numbers in (C) and (D) represent the 10-y risks. Heat maps were derived by Cox proportional hazards regression with systolic BP (C) or diastolic BP (D) plotted along the vertical axis and mean arterial pressure (MAP) along the horizontal axis. Estimates of the 10-y risk were standardized to the average of the distributions in the whole study population (mean or ratio) of all covariables. Higher MAP consistently conferred greater risk (P<0.001) with an additional contribution of systolic BP (P<0.001 [C]), whereas higher diastolic BP attenuated the risk (P<0.001 [D]).
Discussion
Using a composite cardiovascular end point as primary outcome, statistical methods published before,14 and the 10-year risks associated with the 2017 ACC/AHA thresholds for office BP as reference,3 we computed thresholds for 24-hour MAP. We focused on 24-hour ambulatory BP derived thresholds because we recently demonstrated that of all in-office and ambulatory BP indexes, mortality and fatal combined with nonfatal cardiovascular end points were closely associated with the 24-hour BP level.13 Levels of 24-hour MAP of <90, 90 to <92, 92 to<96, and ≥96 mm Hg delineated normotension, elevated 24-hour MAP, stage-1 hypertension, and stage-2 combined with severe hypertension, respectively. With higher 24-hour MAP categories, both the absolute and relative risks of adverse events increased, as captured by the incidence and hazard ratios, respectively. These observations withstood multiple sensitivity analyses and held true for the primary and secondary end points. Combined with 24-hour systolic and diastolic BP, 24-hour MAP kept its prognostic accuracy in categorical and continuous analyses of BP.
The fit of the associations of the primary end point with MAP and systolic BP, both analyzed as continuous variables, were similar if the base model included only the covariables accounted for in adjusted analyses, but if the base model also included systolic and diastolic BP, continuous MAP did no longer add to the model fit (Table S11). These observations are in line with the concept that diastolic BP is the main determinant of MAP and that MAP captures information related to both systolic and diastolic BP. If the BP indexes were dichotomized, using the ACC/AHA thresholds for systolic (125 mm Hg) and diastolic (75 mm Hg) BP and the outcome-driven MAP threshold derived in this article (92 mm Hg), MAP did add to a model including covariables and both systolic and diastolic BP thresholds. The log likelihood ratios and generalized R2 statistics only evaluate model fit but not the strength of the association of an end point with a BP index, as shown in Figure 2. As demonstrated by numerous placebo and actively controlled trials18 and long-term cohort studies of populations13 and patients,19 BP is the overriding modifiable cardiovascular risk factor. Small increments in R2 challenge this concept. However, major irreversible risk factors, such as sex and age, on their own already generate an R2 of 23.94%. Consequently, adding BP to multivariable-adjusted models that already account for sex, age, and other risk factors cannot substantially augment R2. Under such conditions, many researchers share the opinion that markers of model fit are imprecise and that clinical relevance is of greater importance than the improvement of the model fit.20
From a physiological point of view, BP and blood flow can be broken down into a pulsatile component with systolic and diastolic BP representing the extremes of the BP oscillations around MAP, which drives organ perfusion.21 When peripheral resistance increases by rarefaction or remodeling of arterioles, MAP rises with parallel increments in systolic and diastolic BP. However, when there is an additional reduction of arterial compliance, as occurs with stiffening of the large arteries, both systolic BP and MAP increase¸ whereas diastolic BP decreases.22 Figure 2 illustrates these concepts, showing that the 10-year risk of the primary end point was consistently greater with higher MAP with an additional contribution of systolic BP, whereas higher diastolic BP attenuated the risk. Diastolic BP is within 2 mm Hg similar throughout the arterial system.9 Pulse pressure is the difference between systolic and diastolic BP. These hemodynamic principles explain why adding systolic BP (Figure 2C) or pulse pressure (Figure S2), which both reflect the pulsatile component of BP, produced similar results.
The clinical relevance of our study pertains to the consideration of MAP for identifying hypertension and categorizing individuals according to their risk for adverse health outcomes. As reported before,1,23 relative risk was higher at young than older age, whereas absolute followed the opposite trend (Table 3). Our observations have implications for hypertension management and the use and validation of oscillometric BP measuring devices. Treatment wise, targeting lower systolic BP goals24 is likely to reduce risk, but only when MAP and diastolic BP are not lowered below levels required for the perfusion of the cerebrovascular,25 coronary,26 and renal24 vascular beds. Oscillometric BP measuring devices should include MAP in the reports they generate, as this information might carry clinical information.
Strengths and Limitations
Generalizability is among the strengths of our study. Participants were randomly recruited from populations in 12 countries and 3 continents. End points were collected over a median of 13.6 years of follow-up and encompassed both fatal and nonfatal events all adjudicated against the source documents available in each country. Notwithstanding these strengths, our study must also be interpreted within the context of its possible limitations. Asians and South Americans were under-represented. We had no information on Black people of African descent or Black people born and living in Africa, who generally are more susceptible to the complications of hypertension.27 Our findings were obtained in participants aged 18 years without upper age limit. They are obviously not applicable in children and young adolescents. Finally, we assessed model performance by the R2 statistic (Table S12). BP is the major modifiable risk factor. The R2 statistic is not a very sensitive metric, when the base model, as was the case in the current study, performed already well.
Perspectives
When using oscillometric devices for 24-hour BP monitoring, <90, 90 to <92, 92 to<96, and ≥96 mm Hg are the outcome-driven thresholds for 24-hour MAP, delineating normotension, elevated BP and stage-1, and stage-2 combined with severe hypertension. Adopting 24-hour MAP in clinical practice in conjunction with 24-hour systolic and diastolic BP might refine risk estimates (Figure 2) and increase awareness that overtreatment of BP potentially confers risk, if the perfusion pressure of vital organs is lowered too much.24–26
Acknowledgments
We gratefully acknowledge the clerical assistance of Vera De Leebeeck and Renilde Wolfs at the Studies Coordinating Center in Leuven, Belgium.
Sources of Funding
The funding sources had no role in the design and conduct of the study; collection, management, analysis, and interpretation of the data; preparation, review, or approval of the article; and decision to submit the article for publication. Belgium: European Union (HEALTH-F7-305507 HOMAGE), European Research Council (Advanced Researcher Grant 2011-294713-EPLORE and Proof-of-Concept Grant 713601-uPROPHET), European Research Area Net for Cardiovascular Diseases (JTC2017-046-PROACT), and Research Foundation Flanders, Ministry of the Flemish Community, Brussels, Belgium (G.0881.13); China: The National Natural Science Foundation of China (grants 81470533, 91639203 and 81770455), the Ministry of Science and Technology (2015AA020105-06, 2016YFC1300100 and 2018YFC1704902), Beijing, China, and by the Shanghai Commissions of Science and Technology (grants 14ZR1436200 and 15XD1503200) and the Shanghai Bureau of Health (15GWZK0802, 2017BR025 and a Grant for Leading Academics); The Czech Republic: European Union (grants LSHM-CT-2006–037093 and HEALTH-F4-2007–201550) and Charles University Research Fund (project P36); Denmark: Danish Heart Foundation (grant 01-2-9-9A-22914) and Lundbeck Fonden (grant R32-A2740); Ireland: the Irish Allied Bank; Italy: European Union (grants LSHM-CT-2006–037093 and HEALTH-F4-2007–201550); Japan: Ministry of Culture, Sports, Science and Technology (16H05243, 16H05263, 16K09472, 16K11850, 16K15359, 17H04126, 17H06533, 17K15853, 17K19930, 18K09674, 18K09904, and 18K17396), Grant-in-Aid for Young Scientists of Showa Pharmaceutical University (H28-4), Japan Atherosclerosis Prevention Fund (Comprehensive Research on Cardiovascular and Lifestyle Related Diseases), Ministry of Health, Labor and Welfare (H26-Junkankitou [Seisaku]-Ippan-001 and H29–Junkankitou–Ippan–003), Ministry of Agriculture, Forestry and Fisheries (NouEi 2-02), academic contributions from Pfizer Japan, Inc, and scholarship donations from Chugai Pharmaceutical Company and Daiichi Sankyo Company; Poland (Gdańsk): European Union (grants LSHM-CT-2006–037093 and HEALTH-F4-2007–201550); Poland (Kraków): European Union (grants LSHM-CT-2006–037093 and HEALTH-F4-2007–201550) and Foundation for Polish Science; The Russian Federation: European Union (grants LSHM-CT-2006–037093 and HEALTH-F4-2007–201550); Uruguay: Asociación Española Primera en Salud; Venezuela: The National Institute of Aging and the Fogarty International Center (grant 1-R01AG036469 A1), the National Institutes of Health and National Institute of Aging (grant 1 R03 AG054186-01), FONACIT, Caracas (grant G-97000726), and FundaConCiencia, Maracaibo (grant LOCTI/008-2008). The Research Institute Alliance for the Promotion of Preventive Medicine (APPREMED), Mechelen, Belgium received a nonbinding grant from OMRON Healthcare, Co, Ltd, Kyoto, Japan.
Disclosures
None.
Supplementary Material
Appendix
IDACO Investigators; Belgium, Noordkempen: S. Janssens, J.A. Staessen, L. Thijs, T. Vanassche, P. Verhamme, F.F. Wei, Z.Y. Zhang, and W.Y. Yang; China, JingNing: Y. Li, Q.F. Huang, and J.G. Wang; Czech Republic, Pilsen: J. Filipovský, J. Seidlerová, and M. Tichá; Denmark, Copenhagen: T.W. Hansen, H. Ibsen, J. Jeppesen, S. Rasmussen, and C. Torp-Pedersen; Ireland, Dublin: E. Dolan and E. O’Brien; Italy, Padova: E. Casiglia, A. Pizzioli, and V. Tikhonoff; Japan, Ohasama: K. Asayama, J. Hashimoto, H. Hoshi, Y. Imai, R. Inoue, M. Kikuya, H. Metoki, T. Obara, T. Ohkubo, H. Satoh, and K. Totsune; Poland, Gdańsk: N. Gilis-Malinowska, K. Narkiewicz; Poland, Kraków: A. Adamkiewicz-Piejko, M. Cwynar, J. Gąsowski, T. Grodzicki, K. Kawecka-Jaszcz, W. Lubaszewski, A. Olszanecka, K. Stolarz-Skrzypek, B. Wizner, W. Wojciechowska, and J. Zyczkowska; Russian Federation, Novosibirsk: S. Malyutina, Y. Nikitin, E. Pello, G. Simonova, and M. Voevoda; Sweden, Uppsala: B. Andrén, L. Berglund, K. Björklund-Bodegård, L. Lind, and B. Zethelius; Uruguay, Montevideo: M. Bianchi, J. Boggia, V. Moreira, E. Sandoya, C. Schettini, E. Schwedt, and H. Senra; Venezuela, Maracaibo: J.D. Melgarejo, G.E. Maestre.
Nonstandard Abbreviations and Acronyms
- BP
- blood pressure
- DBP
- diastolic BP
- MAP
- mean arterial pressure
- SBP
- systolic BP
This manuscript was sent to Marc L. De Buyzere, Guest Editor, for review by expert referees, editorial decision, and final disposition.
The Data Supplement is available with this article at https://www.ahajournals.org/doi/suppl/10.1161/HYPERTENSIONAHA.120.14929.
A list of International Database on Ambulatory Blood Pressure in Relation to Cardiovascular Outcome Investigators is given in the Appendix.
For Sources of Funding and Disclosures, see page 47.
Contributor Information
Jesus D. Melgarejo, Email: jesus.melgarejo@kuleuven.be.
Wen-Yi Yang, Email: etaloc@163.com.
Lutgarde Thijs, Email: lutgarde.thijs@kuleuven.be.
Yan Li, Email: liyanshcn@yahoo.com.
Kei Asayama, Email: kei@asayama.org.
Tine W. Hansen, Email: tine.willum.hansen@regionh.dk.
Fang-Fei Wei, Email: fangfeimuxiang@163.com.
Masahiro Kikuya, Email: kikuyam@med.teikyo-u.ac.jp.
Takayoshi Ohkubo, Email: tohkubo@med.teikyo-u.ac.jp.
Eamon Dolan, Email: eamon028@indigo.ie.
Katarzyna Stolarz-Skrzypek, Email: katarzyna_stolarz@poczta.onet.pl.
Qi-Fang Huang, Email: qifanghuang@hotmail.com.
Valérie Tikhonoff, Email: valerie.tikhonoff@unipd.it.
Sofia Malyutina, Email: smalyutina@hotmail.com.
Edoardo Casiglia, Email: edoardo.casiglia@unipd.it.
Lars Lind, Email: lars.lind@medsci.uu.se.
Edgardo Sandoya, Email: edgardo.sandoya@gmail.com.
Jan Filipovský, Email: filipovsky@fnplzen.cz.
Natasza Gilis-Malinowska, Email: n.gilis@gumed.edu.pl.
Krzysztof Narkiewicz, Email: knark@gumed.edu.pl.
Kalina Kawecka-Jaszcz, Email: mckaweck@cyf-kr.edu.pl.
José Boggia, Email: ppboggia@gmail.com.
Ji-Guang Wang, Email: jiguangw@163.com.
Yutaka Imai, Email: yutaka.imai.d6@tohoku.ac.jp.
Thomas Vanassche, Email: thomas.vanassche@uzleuven.be.
Peter Verhamme, Email: peter.verhamme@uzleuven.be.
Stefan Janssens, Email: stefan.janssens@uzleuven.be.
Eoin O’Brien, Email: profeobrien@icloud.com.
Gladys E. Maestre, Email: gladysmaestre@gmail.com.
Zhen-Yu Zhang, Email: zhenyu.zhang@kuleuven.be.
Novelty and Significance
What Is New?
We established in a population-based cohort of 11 596 adult people outcome-driven thresholds for 24-hour mean arterial pressure (MAP), and we assessed its associations with fatal and nonfatal cardiovascular end points.
What Is Relevant?
Using a composite cardiovascular end point as primary outcome and the 10-year risks associated with 2017 American College of Cardiology/American Heart Association thresholds for office blood pressure (BP) as reference, we established levels of 24-hour MAP of <90, ≥90 to <92, ≥92 to <96, and ≥96 mm Hg delineated normotension, elevated 24-hour MAP, stage 1 hypertension, and stage 2 combined with severe hypertension, respectively.
Combined with 24-hour systolic BP and diastolic BP, 24-hour MAP kept its prognostic accuracy in categorical and continuous analyses of BP.
Summary
Our observations have implications for hypertension management and the use and validation of oscillometric BP measuring devices. Oscillometric BP measuring devices should include MAP in the reports they generate. Considering 24-hour MAP in clinical practice in conjunction with 24-hour systolic BP and diastolic BP might refine risk estimates.
References
- 1.Lim SS, Vos T, Flaxman AD, Danaei G, Shibuya K, Adair-Rohani H, Amann M, Anderson HR, Andrews KG, Aryee M, et al. A comparative risk assessment of burden of disease and injury attributable to 67 risk factors and risk factor clusters in 21 regions, 1990-2010: a systematic analysis for the global burden of disease study 2010. Lancet. 2012;380:2224–2260. doi: 10.1016/S0140-6736(12)61766-8 [DOI] [PMC free article] [PubMed] [Google Scholar]
- 2.Olsen MH, Angell SY, Asma S, Boutouyrie P, Burger D, Chirinos JA, Damasceno A, Delles C, Gimenez-Roqueplo AP, Hering D, et al. A call to action and a lifecourse strategy to address the global burden of raised blood pressure on current and future generations: the lancet commission on hypertension. Lancet. 2016;388:2665–2712. doi: 10.1016/S0140-6736(16)31134-5 [DOI] [PubMed] [Google Scholar]
- 3.Whelton PK, Carey RM, Aronow WS, Casey DE, Jr, Collins KJ, Dennison Himmelfarb C, DePalma SM, Gidding S, Jamerson KA, Jones DW, et al. 2017 ACC/AHA/AAPA/ABC/ACPM/AGS/APhA/ASH/ASPC/NMA/PCNA Guideline for the prevention, detection, evaluation, and management of high blood pressure in adults: a report of the American College of Cardiology/American Heart Association Task Force on Clinical Practice Guidelines. J Am Coll Cardiol. 2018;71:e127–e248. doi: 10.1016/j.jacc.2017.11.006 [DOI] [PubMed] [Google Scholar]
- 4.Williams B, Mancia G, Spiering W, Agabiti Rosei E, Azizi M, Burnier M, Clement DL, Coca A, de Simone G, Dominiczak A, et al. ; Authors/Task Force Members:. 2018 ESC/ESH Guidelines for the management of arterial hypertension: the task Force for the management of arterial hypertension of the European Society of Cardiology and the European Society of Hypertension: the Task Force for the management of arterial hypertension of the European Society of Cardiology and the European Society of Hypertension. J Hypertens. 2018;36:1953–2041. doi: 10.1097/HJH.0000000000001940 [DOI] [PubMed] [Google Scholar]
- 5.Laher M, O’Brien E. In search of Korotkoff. Br Med J (Clin Res Ed). 1982;285:1796–1798. doi: 10.1136/bmj.285.6357.1796 [DOI] [PMC free article] [PubMed] [Google Scholar]
- 6.Forouzanfar M, Dajani HR, Groza VZ, Bolic M, Rajan S, Batkin I. Oscillometric blood pressure estimation: past, present, and future. IEEE Rev Biomed Eng. 2015;8:44–63. doi: 10.1109/RBME.2015.2434215 [DOI] [PubMed] [Google Scholar]
- 7.Babbs CF. Oscillometric measurement of systolic and diastolic blood pressures validated in a physiologic mathematical model. Biomed Eng Online. 2012;11:56 doi: 10.1186/1475-925X-11-56 [DOI] [PMC free article] [PubMed] [Google Scholar]
- 8.O’Brien E, Atkins N, Stergiou G, Karpettas N, Parati G, Asmar R, Imai Y, Wang J, Mengden T, Shennan A; Working Group on Blood Pressure Monitoring of the European Society of Hypertension. European society of hypertension International protocol revision 2010 for the validation of blood pressure measuring devices in adults. Blood Press Monit. 2010;15:23–38. doi: 10.1097/MBP.0b013e3283360e98 [DOI] [PubMed] [Google Scholar]
- 9.Boggia J, Luzardo L, Lujambio I, Sottolano M, Robaina S, Thijs L, Olascoaga A, Noboa O, Struijker-Boudier HA, Safar ME, et al. The diurnal profile of central hemodynamics in a general uruguayan population. Am J Hypertens. 2016;29:737–746. doi: 10.1093/ajh/hpv169 [DOI] [PubMed] [Google Scholar]
- 10.McEniery CM, Cockcroft JR, Roman MJ, Franklin SS, Wilkinson IB. Central blood pressure: current evidence and clinical importance. Eur Heart J. 2014;35:1719–1725. doi: 10.1093/eurheartj/eht565 [DOI] [PMC free article] [PubMed] [Google Scholar]
- 11.Flint AC, Conell C, Ren X, Banki NM, Chan SL, Rao VA, Melles RB, Bhatt DL. Effect of systolic and diastolic blood pressure on cardiovascular outcomes. N Engl J Med. 2019;381:243–251. doi: 10.1056/NEJMoa1803180 [DOI] [PubMed] [Google Scholar]
- 12.Lewington S, Clarke R, Qizilbash N, Peto R, Collins R; Prospective Studies Collaboration. Age-specific relevance of usual blood pressure to vascular mortality: a meta-analysis of individual data for one million adults in 61 prospective studies. Lancet. 2002;360:1903–1913. doi: 10.1016/s0140-6736(02)11911-8 [DOI] [PubMed] [Google Scholar]
- 13.Yang WY, Melgarejo JD, Thijs L, Zhang ZY, Boggia J, Wei FF, Hansen TW, Asayama K, Ohkubo T, Jeppesen J, et al. ; International Database on Ambulatory Blood Pressure in Relation to Cardiovascular Outcomes (IDACO) Investigators. Association of office and ambulatory blood pressure with mortality and cardiovascular outcomes. JAMA. 2019;322:409–420. doi: 10.1001/jama.2019.9811 [DOI] [PMC free article] [PubMed] [Google Scholar]
- 14.Kikuya M, Hansen TW, Thijs L, Björklund-Bodegård K, Kuznetsova T, Ohkubo T, Richart T, Torp-Pedersen C, Lind L, Ibsen H, et al. ; International Database on Ambulatory blood pressure monitoring in relation to Cardiovascular Outcomes Investigators. Diagnostic thresholds for ambulatory blood pressure monitoring based on 10-year cardiovascular risk. Circulation. 2007;115:2145–2152. doi: 10.1161/CIRCULATIONAHA.106.662254 [DOI] [PubMed] [Google Scholar]
- 15.World Medical Association. World medical association declaration of helsinki: ethical principles for medical research invovling human subjects. JAMA. 2013;310:2191–2194. doi: 10.1001/jama.2013.281053 [DOI] [PubMed] [Google Scholar]
- 16.Yang WY, Thijs L, Zhang ZY, Asayama K, Boggia J, Hansen TW, Ohkubo T, Jeppesen J, Stolarz-Skrzypek K, Malyutina S, et al. ; International Database; on Ambulatory blood pressure in relation to Cardiovascular Outcomes (IDACO) Investigators. Evidence-based proposal for the number of ambulatory readings required for assessing blood pressure level in research settings: an analysis of the IDACO database. Blood Press. 2018;27:341–350. doi: 10.1080/08037051.2018.1476057 [DOI] [PubMed] [Google Scholar]
- 17.Gillespie BW. Use of generalized R-squared in Cox regression. 2006. APHA Scientific Session and Event Listing; https://apha.confex.com/apha/134am/techprogram/paper_135906.htm [Google Scholar]
- 18.Staessen JA, Wang JG, Thijs L. Cardiovascular prevention and blood pressure reduction: a meta-analysis. Lancet. 2001;358:1305–1315 [DOI] [PubMed] [Google Scholar]
- 19.Banegas JR, Ruilope LM, de la Sierra A, Vinyoles E, Gorostidi M, de la Cruz JJ, Ruiz-Hurtado G, Segura J, Rodríguez-Artalejo F, Williams B. Relationship between clinic and ambulatory blood-pressure measurements and mortality. N Engl J Med. 2018;378:1509–1520. doi: 10.1056/NEJMoa1712231 [DOI] [PubMed] [Google Scholar]
- 20.Baker SG, Schuit E, Steyerberg EW, Pencina MJ, Vickers A, Vickers A, Moons KG, Mol BW, Lindeman KS. How to interpret a small increase in AUC with an additional risk prediction marker: decision analysis comes through. Stat Med. 2014;33:3946–3959. doi: 10.1002/sim.6195 [DOI] [PMC free article] [PubMed] [Google Scholar]
- 21.O’Rourke MF, Safar ME. Relationship between aortic stiffening and microvascular disease in brain and kidney: cause and logic of therapy. Hypertension. 2005;46:200–204. doi: 10.1161/01.HYP.0000168052.00426.65 [DOI] [PubMed] [Google Scholar]
- 22.Staessen J, Amery A, Fagard R. Isolated systolic hypertension in the elderly. J Hypertens. 1990;8:393–405. doi: 10.1097/00004872-199005000-00001 [DOI] [PubMed] [Google Scholar]
- 23.Li Y, Thijs L, Zhang ZY, Asayama K, Hansen TW, Boggia J, Björklund-Bodegård K, Yang WY, Niiranen TJ, Ntineri A, et al. ; International Database on Ambulatory and Home Blood Pressure in Relation to Cardiovascular Outcome Investigators. Opposing age-related trends in absolute and relative risk of adverse health outcomes associated with out-of-office blood pressure. Hypertension. 2019;74:1333–1342. doi: 10.1161/HYPERTENSIONAHA.119.12958 [DOI] [PMC free article] [PubMed] [Google Scholar]
- 24.Wright JT, Jr, Williamson JD, Whelton PK, Snyder JK, Sink KM, Rocco MV, Reboussin DM, Rahman M, Oparil S, et al. ; The SPRINT Research Group. A randomized trial of intensive versus standard blood pressure control. N Engl J Med. 2015;373:2103–2116. doi: 10.1056/NEJMoa1511939 [DOI] [PMC free article] [PubMed] [Google Scholar]
- 25.Spence DJ. Systolic pressure targets, diastolic J curve and cuff artefact in blood pressure measurement: a note of caution. Eur J Neurol. 2017;24:1323–1325 [DOI] [PubMed] [Google Scholar]
- 26.McEvoy JW, Chen Y, Rawlings A, Hoogeveen RC, Ballantyne CM, Blumenthal RS, Coresh J, Selvin E. Diastolic blood pressure, subclinical myocardial damage, and cardiac events: implications for blood pressure control. J Am Coll Cardiol. 2016;68:1713–1722. doi: 10.1016/j.jacc.2016.07.754 [DOI] [PMC free article] [PubMed] [Google Scholar]
- 27.Odili AN, Thijs L, Yang WY, Ogedengbe JO, Nwegbu MM, Jacobs L, Wei FF, Feng YM, Zhang ZY, Kuznetsova T, et al. Office and home blood pressures as determinants of electrocardiographic left ventricular hypertrophy among black nigerians compared with white flemish. Am J Hypertens. 2017;30:1083–1092. doi: 10.1093/ajh/hpx114 [DOI] [PMC free article] [PubMed] [Google Scholar]
Associated Data
This section collects any data citations, data availability statements, or supplementary materials included in this article.