Abstract
This study examined the post-thaw recovery of Jurkat cells cryopreserved in three combinations of five osmolytes including trehalose, sucrose, glycerol, mannitol, and creatine. Cellular response was characterized using low-temperature Raman spectroscopy, and variation of post-thaw recovery was analyzed using statistical modeling. Combinations of osmolytes displayed distinct trends of post-thaw recovery, and a nonlinear relationship between compositions and post-thaw recovery was observed, suggesting interactions not only between different solutes but also between solutes and cells. The post-thaw recovery for optimized cryoprotectants in different combinations of osmolytes at a cooling rate of 1°C/min was comparable to that measured with 10% dimethyl sulfoxide. Statistical modeling was used to understand the importance of individual osmolytes as well as interactions between osmolytes on post-thaw recovery. Both higher concentrations of glycerol and certain interactions between sugars and glycerol were found to typically increase the post-thaw recovery. Raman images showed the influence of osmolytes and combinations of osmolytes on ice crystal shape, which reflected the interactions between osmolytes and water. Differences in the composition also influenced the presence or absence of intracellular ice formation, which could also be detected by Raman. These studies help us understand the modes of action for cryoprotective agents in these osmolyte solutions.
Keywords: cryopreservation, DMSO-free cryoprotectant, Raman spectroscopy, T-cells
1 |. INTRODUCTION
Cell-based immunotherapies such as chimeric antigen receptor (CAR) T-cell therapy are increasingly becoming an important means of treating a number of cancers, including certain types of lymphoma and leukemia. In these treatments, immune cells are harvested from patients, genetically modified to better enable them to target cancer cells, and then reinfused into the patients (Piscopo et al., 2018). Effective preservation of these cells at each stage of the process is critical to clinical use as it enables transportation from the site of collection to the site of manufacture and to the site of use. It also allows for the coordination of the therapy with patient availability as well as proper safety and quality control testing.
Many clinical studies involving immunotherapy use dimethyl sulfoxide (DMSO) as a cryoprotective agent. Although DMSO has been used for cryoprotection for over half century (Lovelock & Bishop, 1959), it is toxic upon infusion to patients and can result in side effects, such as nausea, vomiting, cardiovascular complication, or even death (Windrum, Morris, Drake, Niederwieser, & Ruutu, 2005). Crucially, exposure of cells to DMSO can also result in loss of viability and function (Pollock, Yu et al., 2016). In general, the exposure time for hematopoietic cells is limited to half hour, which adds to the complexity of workflow related to the preservation of cells using DMSO.
Because of these drawbacks, there has been a long-standing interest in finding alternatives to DMSO for the preservation of T-cells (De Abreu Costa et al., 2017) including studying the use of osmolytes. These compounds are used in nature to stabilize biological systems subjected to environmental extremes (P. Yancey, Clark, Hand, Bowlus, & Somero, 1982). In previous studies, we demonstrated that various osmolytes can act in concert to improve cell viability during cryopreservation (Pi, Yu, Petersen, & Hubel, 2018; Pollock, Yu et al., 2016; Pollock et al., 2017; Pollock, Budenske, McKenna, Dosa, & Hubel, 2016; Yu, Yap, Pollock, & Hubel, 2017). We have shown that certain combinations of sugars, sugar alcohols and amino acids not only maintained post-thaw recovery but also resulted in cells that had improved function compared with those that were cryopreserved with DMSO. Interactions between sugars and sugar alcohols have also been observed by other groups, and they have discovered that these molecules interact with each other and water to form deep natural eutectic systems (Castro et al., 2018).
The objective of this investigation is to use statistical models to analyze how individual osmolytes and interactions between different combinations of osmolytes affect post-thaw recovery. Low-temperature Raman spectroscopy will be used to observe cell response for differences in composition. These studies using Jurkat cells, an immortalized line of T-cells, will help us understand the nature of action and interaction between the different molecules and its influence on post-thaw recovery as a key step in developing improved cryopreservation methods that can be used clinically.
2 |. MATERIALS AND METHODS
2.1 |. Cell culture
Jurkat cells (ATCC TIB-152), a T-cell line, were used in this study. The cell line identity was confirmed by short tandem repeat by the American Type Culture Collection. Cells were cultured in high-glucose RPMI 1640 (Life Technologies, Carlsbad, CA) with 10% fetal bovine serum (qualified; Life Technologies). Cultures were maintained at densities ranging between 1 × 10⁵ and 3 × 10⁶ cells/ml. Samples for Raman spectroscopy were prepared by washing and centrifuging cells twice in Dulbecco’s phosphate buffered saline at 125g for 10 min. Cells were then resuspended in the experimental solution of interest and frozen using a thermally controlled stage described below or cryopreserved in 96-well plates as described below.
2.2 |. Freezing experiments
Cells were frozen in 96-well plates (Corning, NY) for high-throughput freezing experiments. Test solutions were made at 2× of their final concentration in Normosol-R (Hospira, Lake Forest, IL). Cells were centrifuged and resuspended in Normosol-R and then combined 1:1 with the 2× solution, using a single-step addition in clear-bottom black 96-well plates to produce a 1× concentration of cryoprotectant solution with a total volume of 50 μl and a cell concentration of 300,000 cells/well (6 million cells/ml). Cells were frozen in 10% DMSO with culture media as a control. All experimental studies were performed in triplicate wells on each plate. The cells were incubated in the solutions of interest for 1 hr at room temperature under atmospheric conditions in the plates before being sealed with silicone round well covers (Laboratory Supply Distributors, Millville, NJ) to prevent desiccation during freezing and storage.
A controlled-rate freezer (Series III Kryo 10; Planer, Middlesex, UK) was used to cryopreserve all samples. The plates were placed in a plastic rack in a controlled-rate freezer, and frozen using the following profile: (a) start at 20°C, (b) −10°C/min to 0°C, (c) hold at 0°C for 15 min, (d) −1°C/min to −8°C, (e) −50°C/min to −45°C, (f) +15°C/min to −12°C, (g) −1°C/min to −60°C, and (h) −10°C/min to −100°C. The rapid cooling and rewarming (steps 5 and 6) is used to induce the nucleation in the extracellular solution. After the freezing procedure was completed, plates were stored on vapor phase liquid nitrogen for a minimum of 24 hr up to several days until thawed.
2.3 |. Thawing and post-thaw assessment
Thawing was performed in a 37°C water bath and was complete in less than 3 min. Calcein acetoxymethyl (Calcein-AM; Life Technologies) and propidium iodide (PI; Life Technologies) were used to determine the post-thaw recovery/viability. Calcein-AM/PI dye was added to each well at a 1:1 ratio between the dye and tested solution volume. After addition of the dye, the plates were wrapped in an aluminum foil to protect from light exposure and incubated for a half hour at 37°C and 5% CO2. The fluorescence of each plate was read at 530/590 and 485/528 nm (Synergy™ HT; BioTek Instruments, Winooski, VT). A control curve was obtained by reading plates with known numbers of live and dead cells in each well. The fluorescence readings for an experimental plate were compared with the control curve for correlating the amount of live and dead cells in each well. The post-thaw recovery was defined as the ratio of the number of live cells post-thaw to the number of seeded live cells.
2.4 |. Raman spectroscopy and thermally controlled stage
Raman spectroscopy measurements were conducted using a Confocal Raman Microscope System Alpha 300R (WITec, Ulm, Germany) with a UHTS300 spectrometer and DV401 CCD detector with 600/mm grating. The WITec spectrometer was calibrated with a mercury-argon lamp. A Nd:YAG laser (532 nm wavelength) was used as an excitation source. A 100× air objective (NA 0.90; Nikon Instrument, Melville, NY) was used for focusing the 532 nm excitation laser to the sample. The laser at the objective was 10 mW, as measured by an optical power meter (Thorlabs, Newton, NJ). The lateral resolution of the microscope was about 296 nm according to the Abbe’s diffraction formula. Cell samples were frozen using a four-stage Peltier (Thermonamic Electronics Corp, Jiangxi, China) and a series 800 temperature controller (Alpha Omega Instruments Corp, Lincoln, RI). About 1 to 3 μl of cell suspension was placed on the stage, covered with a piece of mica (TED PELLA, Redding, CA), and sealed with Kapton tape (Dupont, Wilmington, DE) to prevent sample evaporation/sublimation.
The temperature of the cooling stage was maintained at 1°C, and it took several seconds to cool the sample from 1°C to the seeding temperature of −6°C, at which point ice was nucleated in samples using a liquid nitrogen cooled needle, cooled at 1°C/min to a holding temperature of −50°C and held for 20 min before imaging.
2.5 |. Raman image/spectra analysis
Raman images were generated by integrating spectra at each pixel based on the characteristic wavelength of common intracellular and extracellular materials (Figure 1a). Raman signals and associated wavenumbers selected for these studies are given in Table 1. Amide I (mainly associated with the C=O stretching vibration) and Alkyl C=C stretches were used to generate the distribution of protein and lipid to define the area of frozen cells. Images of ice were generated with a background subtraction at both sides of the peak range to separate ice and water signals. The image size was 15 × 15 μm, and each image had 45 × 45 pixels with an integration time of 0.2 s for each pixel. The cell boundary was determined by applying the contour function on the Raman image of amide I in the WITec Project FOUR software (Figure 1b). Intracellular ice formation (IIF) was determined by the presence of an OH stretch peak at 3125 cm−1. Raman spectra of cell sections with IIF showed the presence of an OH stretch peak, whereas Raman spectra of cell section without IIF showed the absence of an OH stretch peak (Figure 1c,d). The ratio of cross-sectional area of IIF to the cross-sectional area of the cell was calculated in ImageJ and termed as area of ice-to-cell (AIC). Due to the partial overlap of Raman spectra of mannitol and sucrose, Raman images of mannitol were rendered based on a peak from which the contribution of sucrose was subtracted (Figure 1e). The ellipticity of ice crystals was defined as the ratio of the difference between the major axis and minor axis to the major axis (Figure 1f). The fitted ellipses of ice crystals were generated through MATLAB R2016b (MathWorks, Natick, MA). The boundary and corresponding area of ice crystal were generated through MATLAB R2016b.
FIGURE 1.
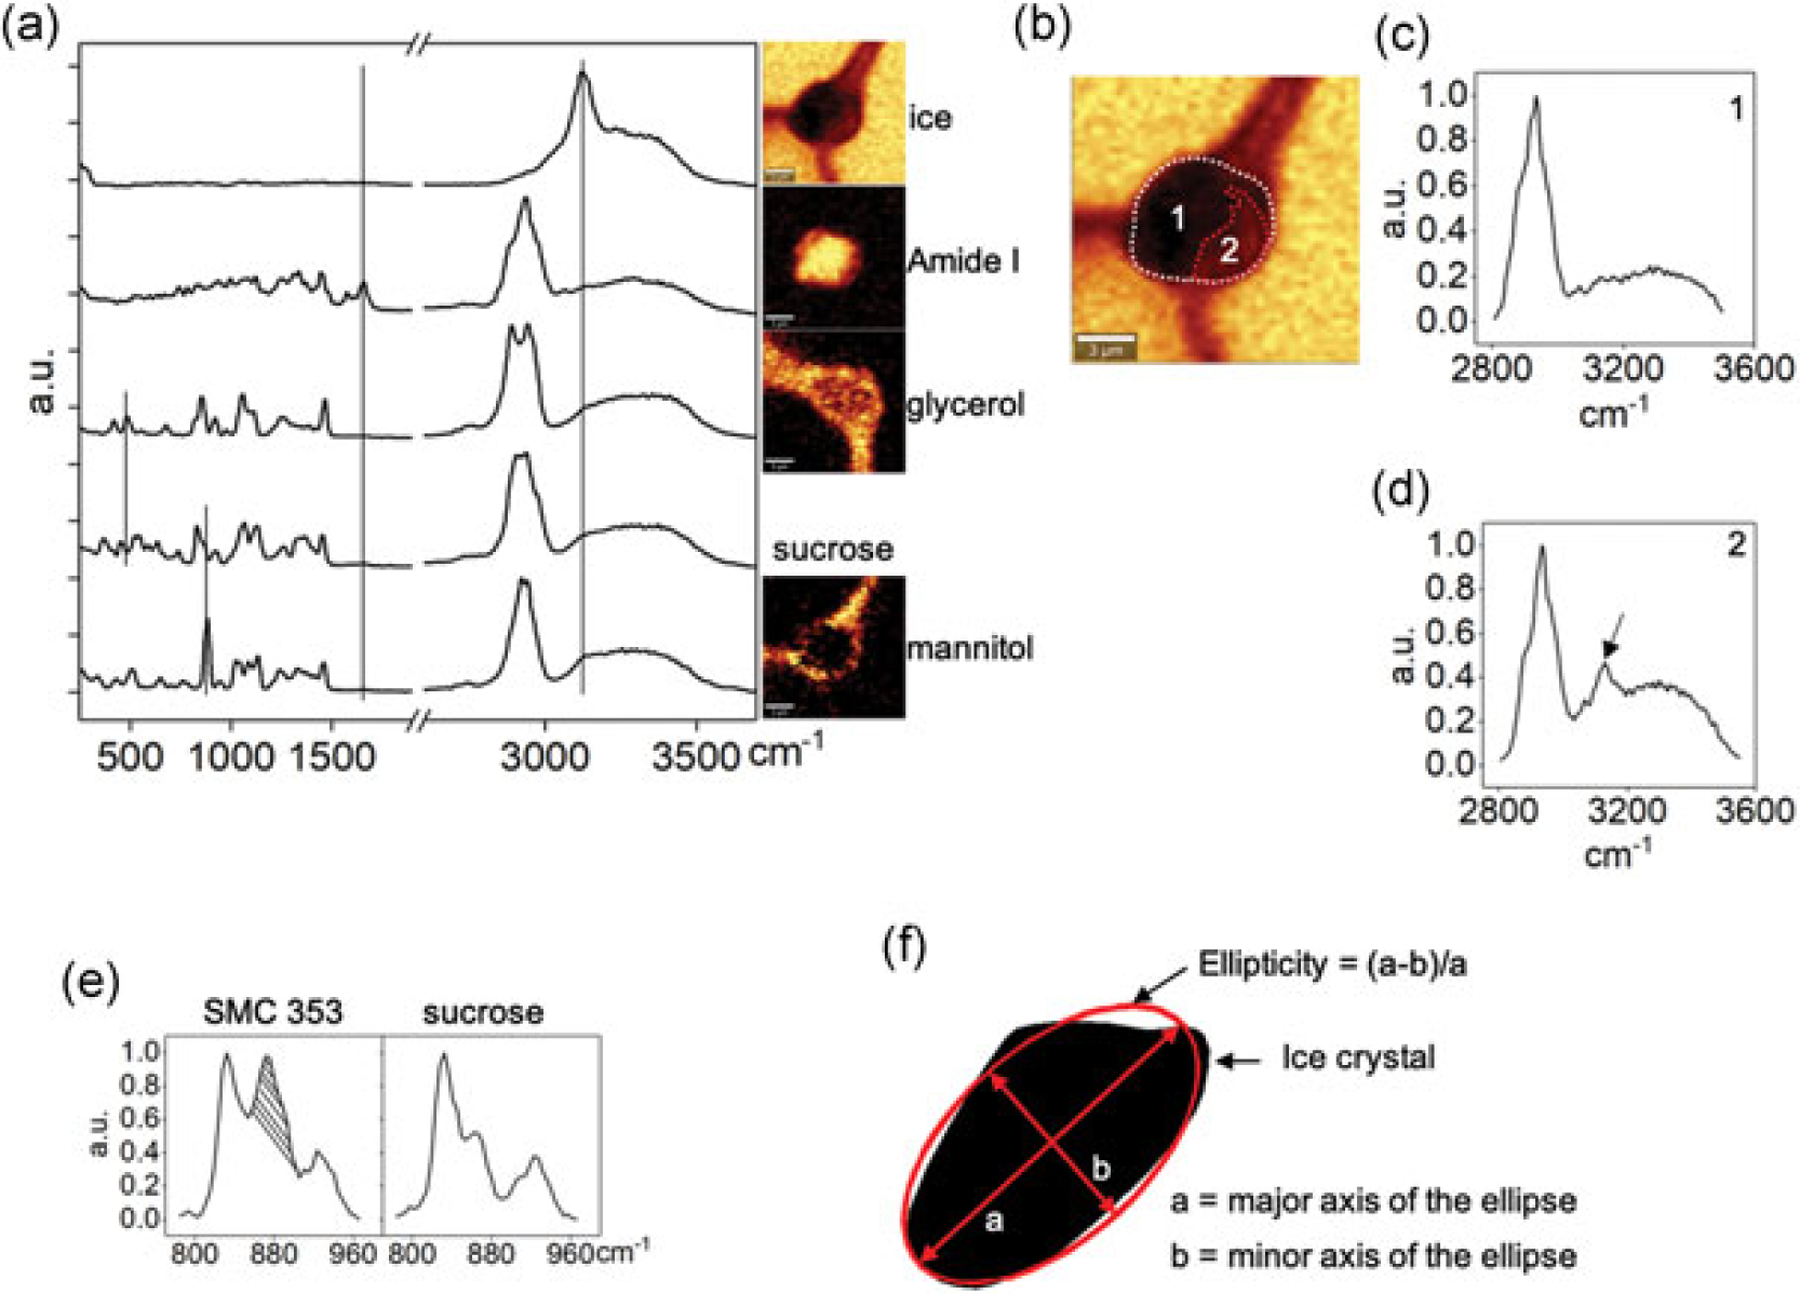
(a) Raman spectra and images of ice, amide I, sucrose, glycerol, and mannitol. Raman images were rendered based on the specific Raman signals indicated on the spectra. (b) Intracellular ice formation (IIF) and cell boundary for AIC calculation, IIF was determined by the presence of OH stretch peak at 3125 cm−1. (c) Raman spectra of cell section without IIF. (d) Raman spectra of cell section with IIF. The arrow indicates the Raman signal of ice. (e) Raman spectra of SMC353 and sucrose. The shadowed area was from mannitol and used to render Raman images. (f) The method of calculating ellipticity, where “a” is the major axis and “b” is the minor axis. Boundary and area of ice crystal are generated through MATLAB. AIC: area of ice-to-cell
TABLE 1.
Wavenumber assignments for Raman spectra
| Substance | Wavenumber cm−1 | Assignments Mendelovici et al. (2000), De Veij, Vandenabeele, De Beer, Remon, and Moens (2009), Yu et al. (2017) |
|---|---|---|
| Ice | 3125 | OH stretching |
| Protein and lipid (cell) | 1660 | Amide I and Alkyl C=C stretching |
| Glycerol | 480 | CCO rock |
| Mannitol | 880 | CCO stretching |
2.6 |. Statistical modeling and analysis
Statistical modeling was performed using R version 3.4.0 (https://www.R-project.org/) for Windows OS. The variation in post-thaw recovery with composition was modeled using a quasi-binomial model. Two models were fit: (a) the main effects model to quantify the influence of each osmolyte, on post-thaw recovery, and (b) a model with interactions to test for pairwise interactions between osmolytes. The main effects model included predictors for the concentration levels of sugars, sugar alcohols, and amino acids. The interaction model included the main effects plus the three pairwise interactions between sugars, sugar alcohols, and amino acids. In both models, the concentration level of sugars was modeled as a categorical variable to allow the possibility of a nonmonotonic relationship, as was previously observed that post-thaw recovery of single sugar varied nonmonotonically with concentration.
Mean plus/minus standard error was reported for all the measurements unless otherwise noted. Two-tailed Student’s t tests were performed for two sample comparisons to obtain p values.
3 |. RESULTS
To characterize the role of specific osmolytes as well as their interaction with other osmolytes, the concentration space of each component (sugar, sugar alcohol, and amino acid) was discretized to six levels with equal scale (Table 2) based on solubility of the component or levels that result in cell death (toxicity). Three combinations were tested: trehalose-glycerol-creatine (TGC), sucrose-glycerol-creatine (SGC), and sucrose-mannitol-creatine (SMC). For each three-component combination, a total of 216 formulations were tested. The specific composition was described using these levels. For example, SGC123 was the combination of level-one sucrose, level-two glycerol, and level-three creatine. The post-thaw recoveries of all combinations as a function of its composition were determined across all 216 formulations.
TABLE 2.
Definition of concentration level and corresponding absolute concentration for the tested components
| Sucrose (mM) | Trehalose (mM) | Glycerol (%) | Mannitol (mM) | Creatine (mM) | Isoleucine (mM) | |
|---|---|---|---|---|---|---|
| Level 0 | 0 | 0 | 0 | 0 | 0 | 0 |
| Level 1 | 146 | 60.66 | 2 | 8.66 | 3.33 | 8.67 |
| Level 2 | 292 | 121.33 | 4 | 17.33 | 6.66 | 17.33 |
| Level 3 | 438 | 182 | 6 | 26 | 10 | 26.00 |
| Level 4 | 584 | 242.66 | 8 | 34.66 | 13.33 | 34.67 |
| Level 5 | 730 | 303.33 | 10 | 43.33 | 16.66 | 43.33 |
3.1 |. Variation in response with the cooling rate
Cell survival can vary strongly with the cooling rate. As a result, the cooling rate selected is a critical parameter. An initial screening study was performed to determine the appropriate cooling rate to be used in the study. The screening was performed by measuring post-thaw recovery for eight formulations at the corners of the parameter space (Level 0 and Level 5 of a given component) and 10% DMSO as a control. Three different cooling rates (1°C/min, 3°C/min, and 10°C /min) were tested. The post-thaw recovery for the different compositions tested was typically highest at 1°C/min when compared to that observed at 3°C/min, and 10°C/min. As a result, a cooling rate of 1°C/min was used for all subsequent studies (Supporting Information Figure 1).
3.2 |. Post-thaw recovery of multicomponent solutions
Post-thaw recovery as a function of composition for a cooling rate of 1°C/min was determined for TGC, SGC, and SMC across the parameter space. The mean post-thaw recovery versus concentration of sugar alcohol with varying levels of sugar or amino acid is shown in Figure 2. The mean post-thaw recovery versus concentration of sucrose with varying levels of sugar alcohol and amino acid is also shown in Figure 3. The black dashed line represents the post-thaw recovery for the single component solution.
FIGURE 2.
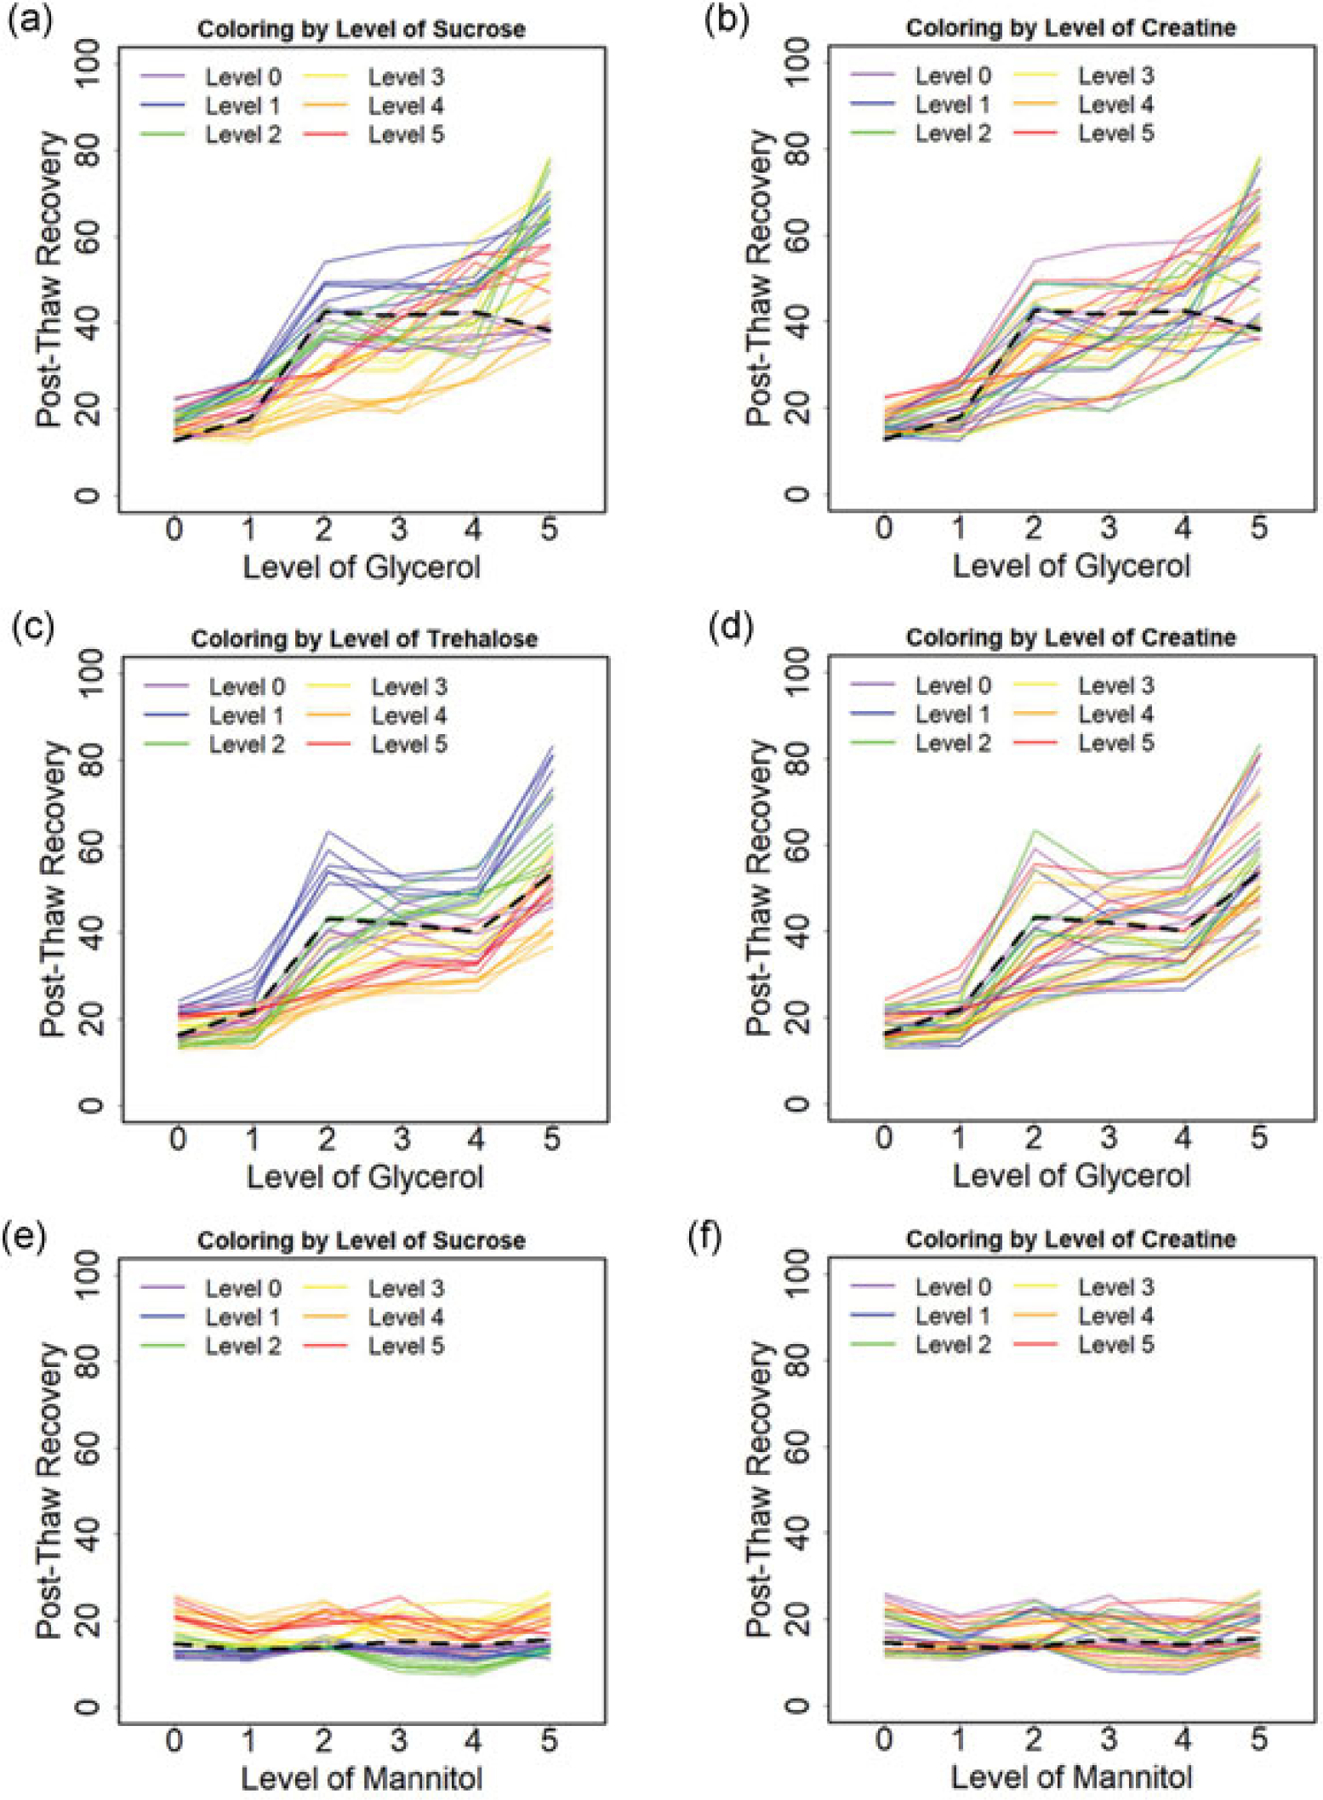
Post-thaw recoveries of Jurkat cells cryopreserved at a cooling rate of 1°C/min for varying solution compositions: (a) The effect of glycerol with coloring level of sucrose for SGC. (b) The effect of glycerol with coloring level of creatine for SGC. (c) The effect of glycerol with coloring level of trehalose for TGC. (d) The effect of glycerol with coloring level of creatine for TGC. (e) The effect of mannitol with coloring level of sucrose for SMC. (f) The effect of glycerol with coloring level of creatine for SMC. Each solid line demonstrates the effect of the x-axis osmolyte on post-thaw recovery for fixed levels of the other two osmolytes. Each color represents the level of the labeled compound with all six levels of the third component shown. The dashed lines indicate the post-thaw recoveries for the single component solutions
FIGURE 3.
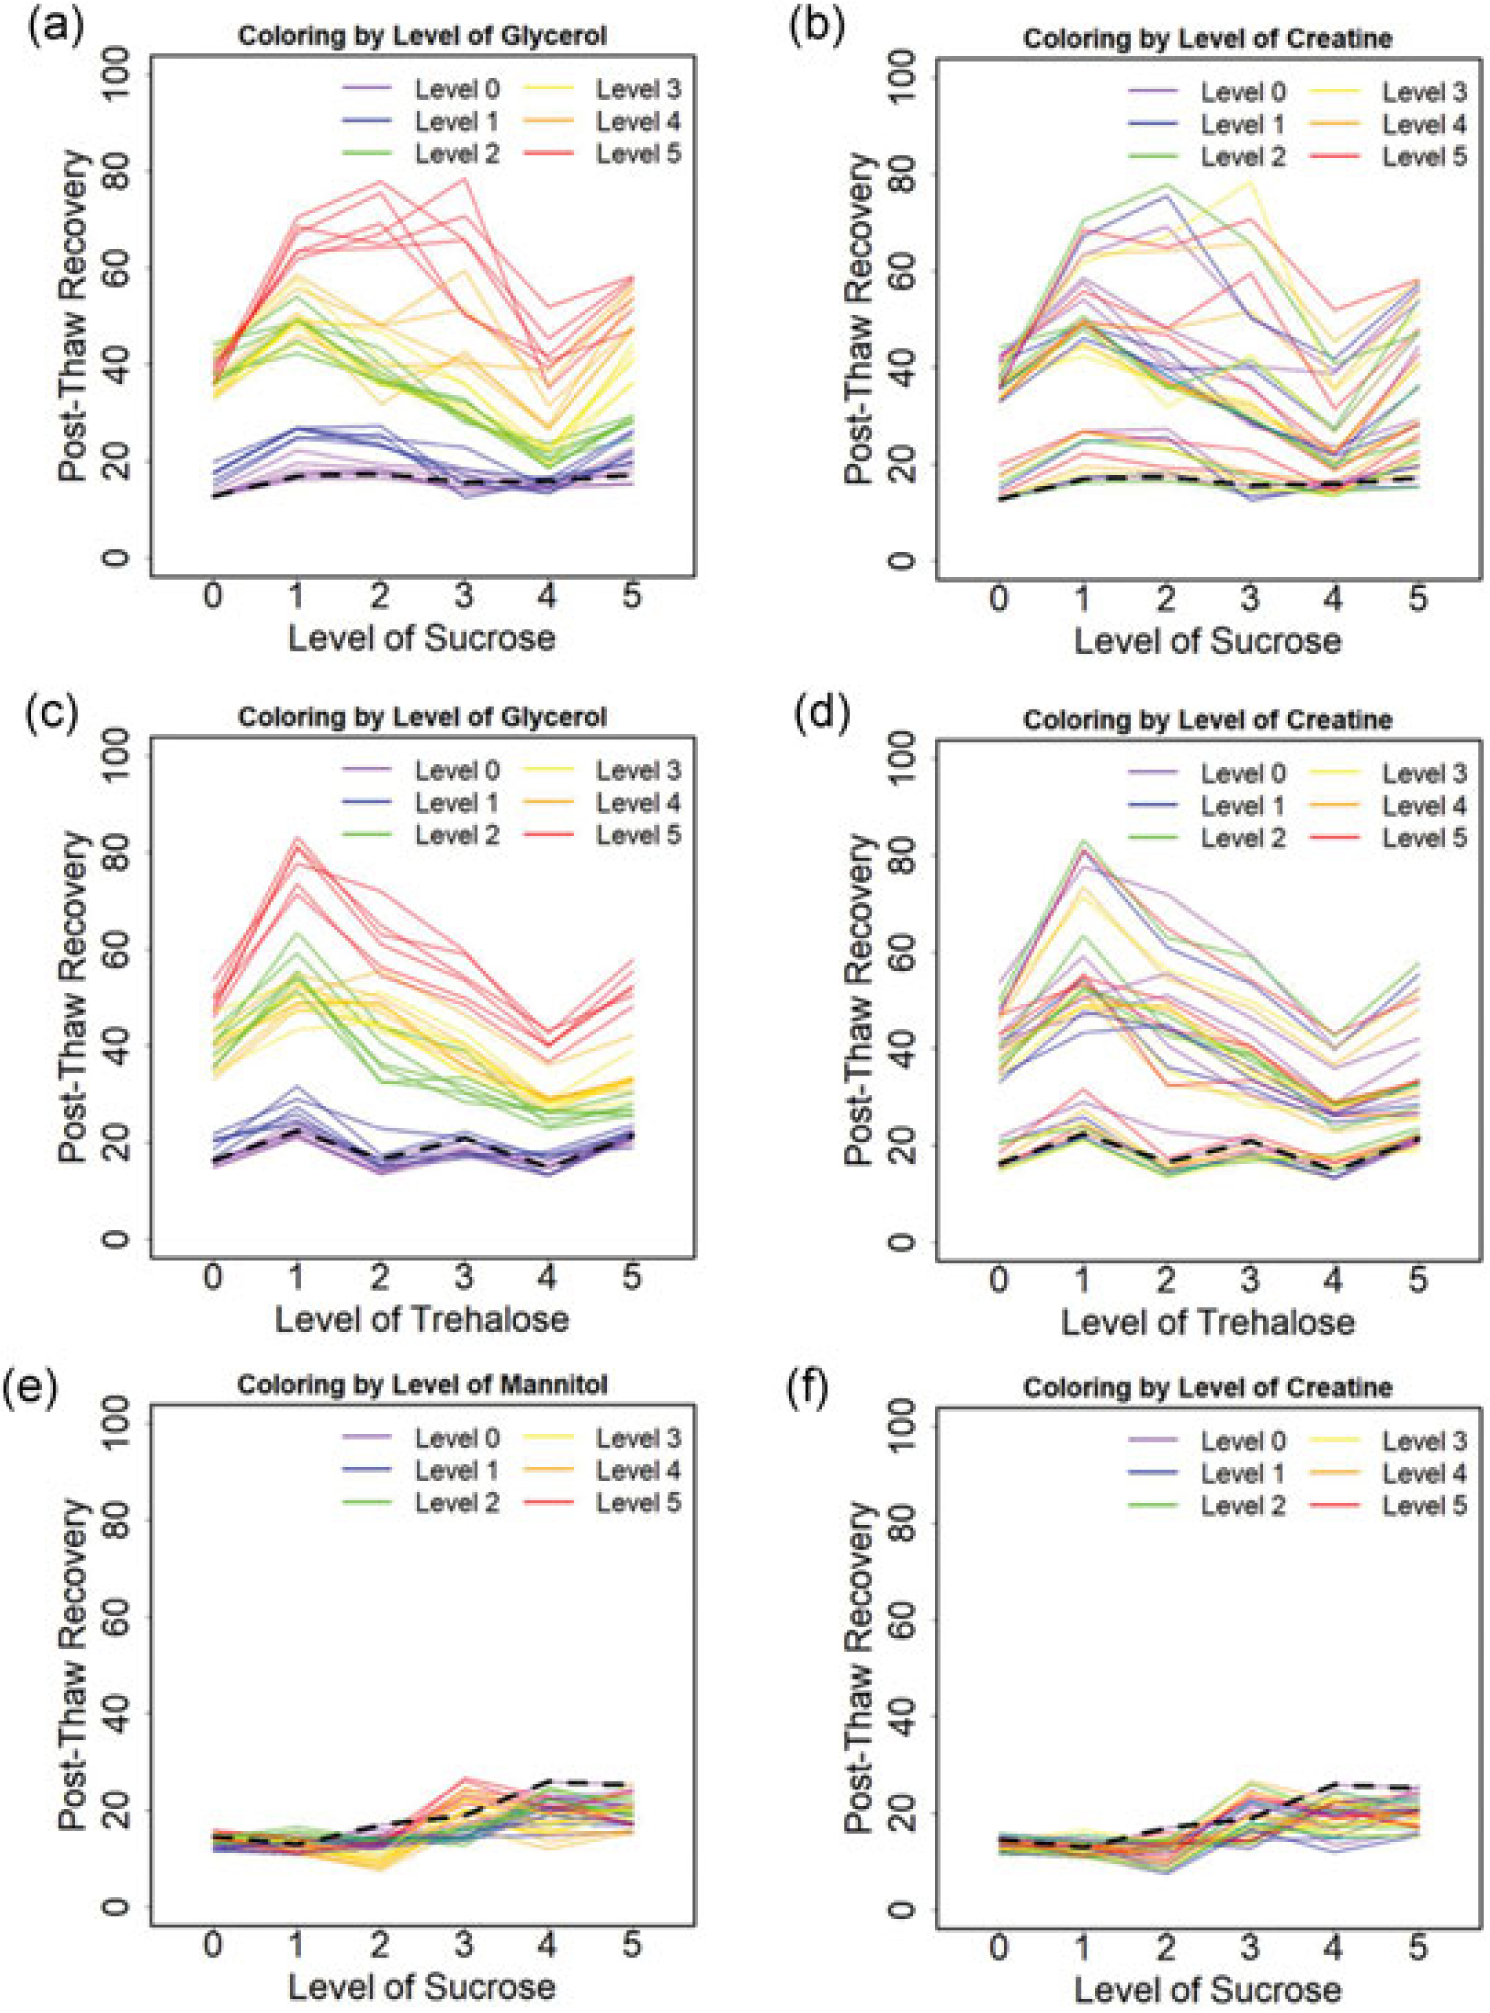
Post-thaw recoveries of Jurkat cells cryopreserved at a cooling rate of 1°C/min for varying solution compositions: (a) the effect of sucrose with the coloring level of glycerol for SGC. (b) The effect of sucrose with the coloring level of creatine for SGC. (c) The effect of trehalose with the coloring level of glycerol for TGC. (d) The effect of trehalose with the coloring level of creatine for TGC. (e) The effect of sucrose with the coloring level of mannitol for SMC. (f) The effect of sucrose with the coloring level of creatine for SMC. Each solid line demonstrates the effect of the x-axis osmolyte on post-thaw recovery for fixed levels of the other two osmolytes. Each color represents the level of the labeled compound with all six levels of the third component shown. The dashed lines indicate the post-thaw recoveries for the single component solutions. SGC: sucrose-glycerol-creatine; SMC: sucrose-mannitol-creatine; TGC: trehalose-glycerol-creatine
For most formulations tested in TGC and SGC, post-thaw recovery for the multicomponent solutions was higher than that observed for a single sugar solution. Data trends suggest that the overall post-thaw recovery was proportional to the concentration of glycerol for both SGC and TGC (Figure 2a,c). Post-thaw recovery increased then decreased as sugar concentration increased for both SGC and TGC (Figure 3a,c). Plots showed post-thaw recovery for each level of sugar strongly depended on the glycerol concentration and weakly depended upon creatine levels (Figure 3b,d). Two saddle nodes, defined as either a local maximum or a local minimum, were observed with variations in the sucrose level for a given concentration of glycerol (Figure 3a–d). Formulations of SMC uniformly performed poorly, with recoveries of <30% (Figure 2e,f and 3e,f). There were no clear trends in post-thaw recovery with creatine concentration observed (Figure 2b,d,f and 3b,d,f).
The nonlinear relationship between post-thaw recovery and composition for TGC and SGC as a function of the glycerol level suggests that there are interactions between the different osmolytes. The nature of those interactions will be described in more detail with the statistical model described below. It is noteworthy that some of the multicomponent compositions tested result in a lower post-thaw recovery than freezing in glycerol alone. This outcome suggests that more is not necessarily better. The formulations associated with the highest post-thaw recovery for TGC, SGC, and SMC were 152, 353, and 354 with 83 ± 5%, 79 ± 7%, and 27 ± 5%, respectively. The post-thaw recovery of 10% DMSO as control was 85 ± 5%. There is no significant difference (p > 0.05) between optimal TGC and SGC, but significant difference (p < 0.01) between TGC and SMC as well as SGC and SMC. The cell concentration and viability after thawing and 24 hr post-thawing for Jurkat cells cryopreserved in both optimal formulation and DMSO control were measured, and both cell concentration and viability were comparable between our formulation and DMSO control.
3.3 |. Statistical modeling of multicomponent solutions
Statistical models have been used previously to characterize the role and interactions between different components (Pi et al., 2018). Main effects models were used to describe the additive effects of each osmolyte without interactions, and these models were consistent with the experimental data. The main effects model results suggested that both SGC and TGC exhibited a strong dependence on glycerol concentration (Figure 4a,c), consistent with the experimental trends described above (Figure 2 and 3). Increasing glycerol by one level was associated with 36% and 34% higher odds of post-thaw recovery to SGC and TGC, respectively. There was a little dependence of post-thaw recovery on both mannitol and creatine (Figure 4b,d,e, and f). Increasing either mannitol or creatine by one level was associated with less than 3% higher odds of post-thaw recovery. These observations are statistically significant with p value smaller than 0.001 via F test.
FIGURE 4.
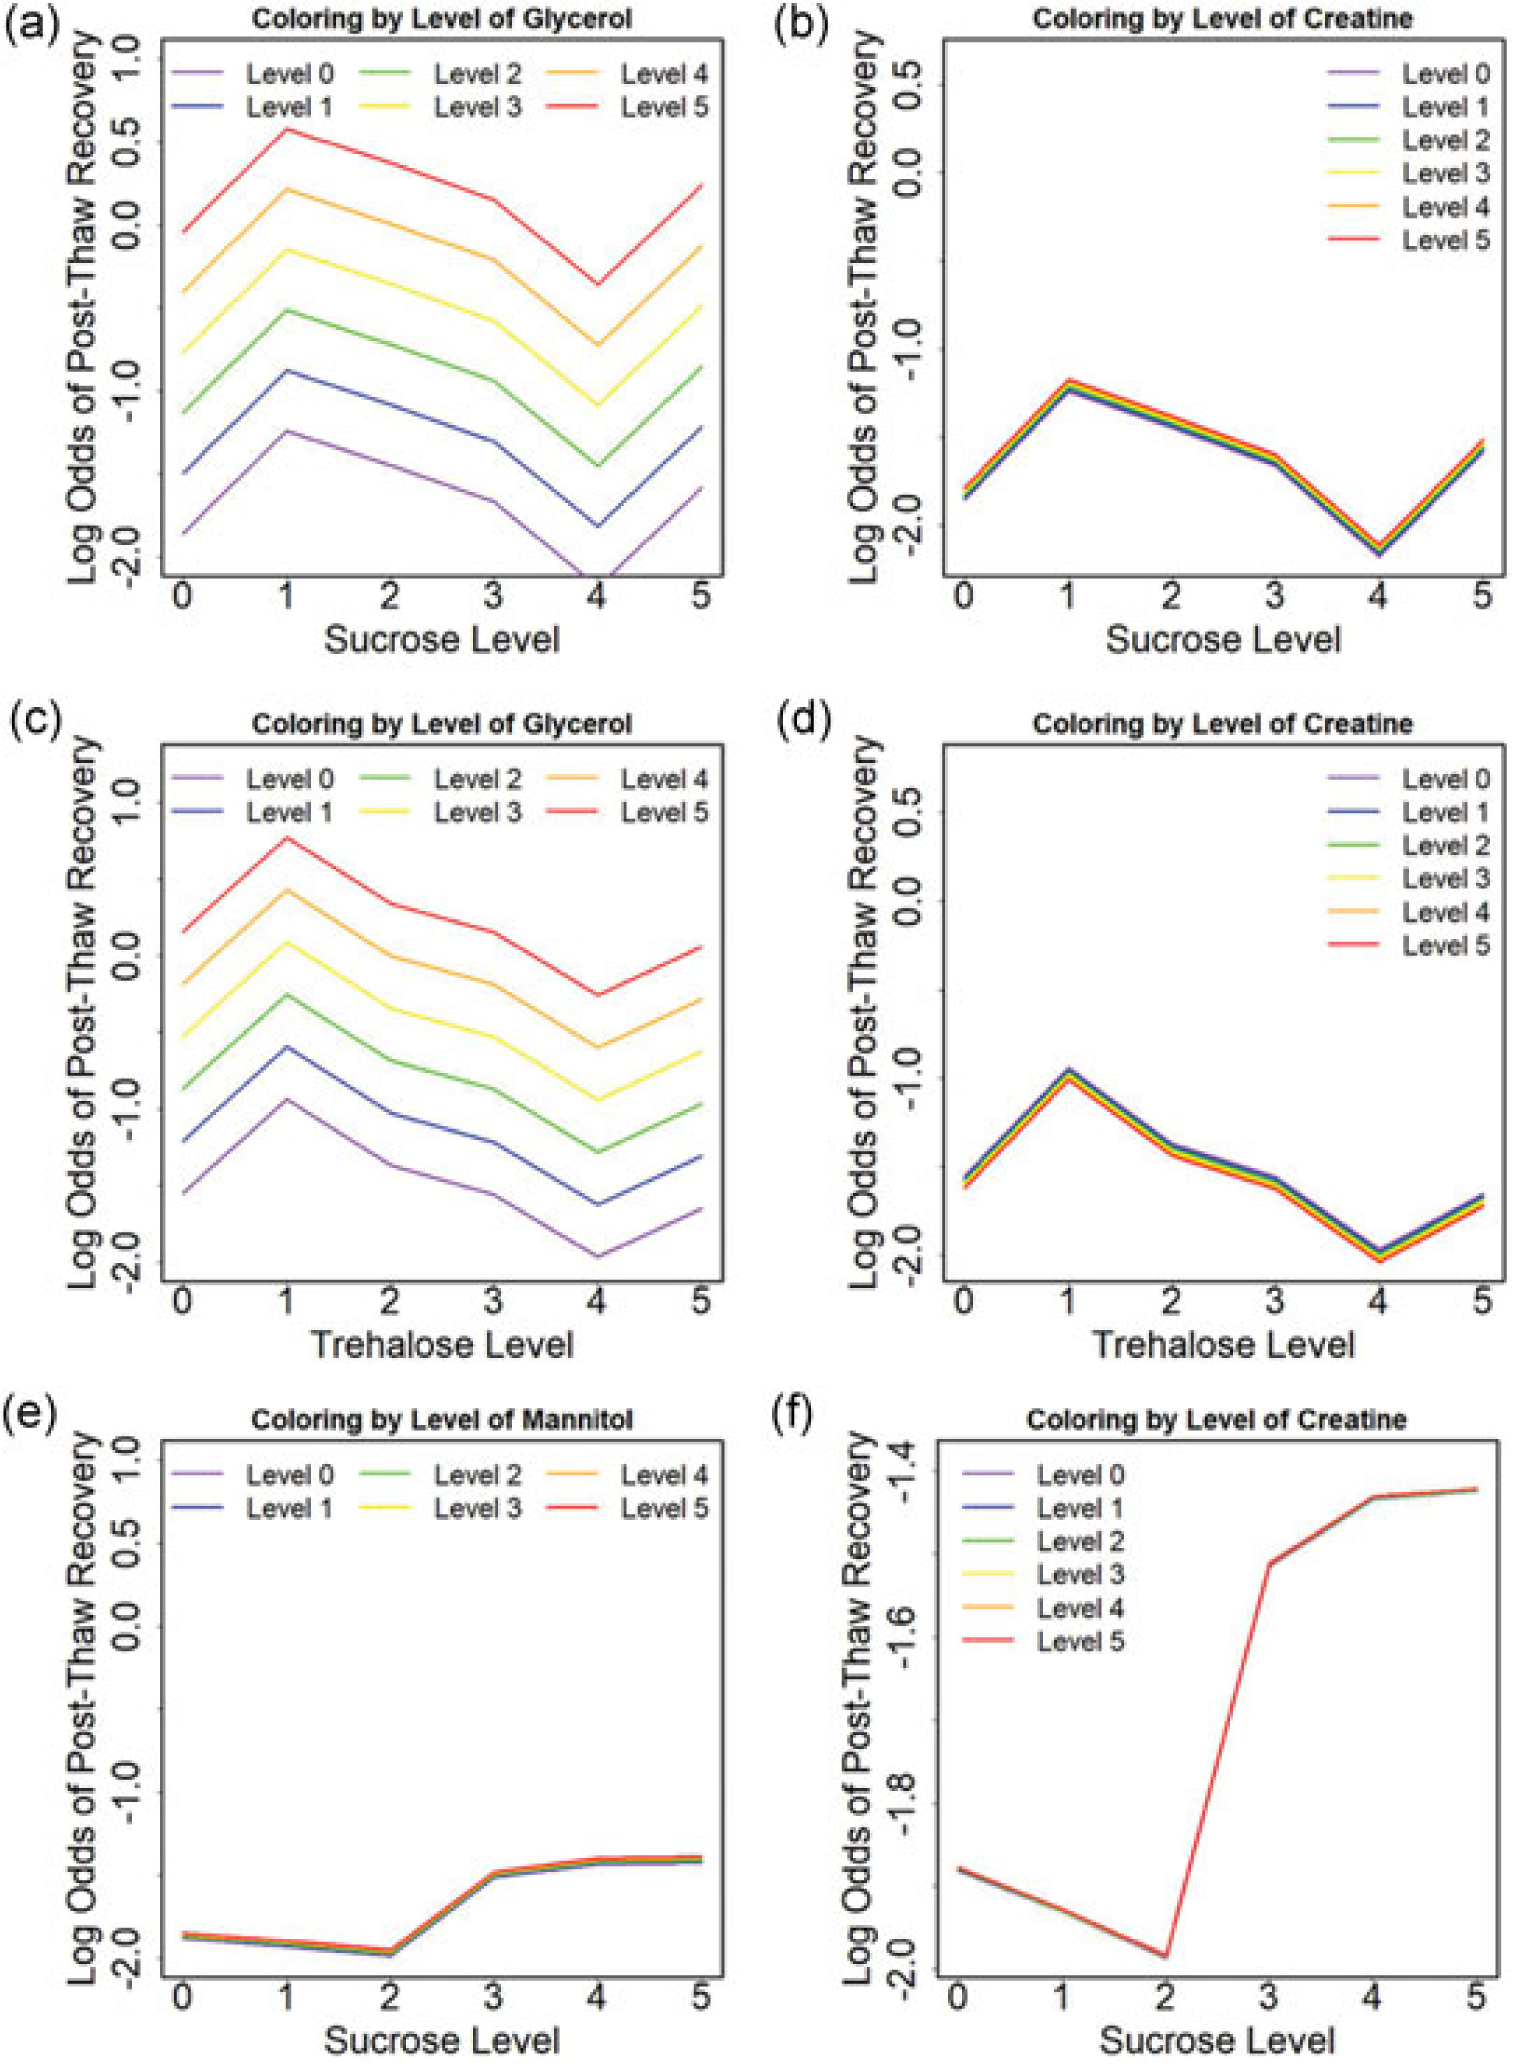
Estimated log odds of post-thaw recovery from the quasi-binomial model without interactions for (a) sucrose level coloring by the glycerol level for SGC, (b) sucrose level coloring by the creatine level for SGC, (c) trehalose level coloring by the glycerol level for TGC, (d) trehalose level coloring by the creatine level for TGC, (e) sucrose level coloring by the mannitol level for SMC, and (f) sucrose level coloring by the creatine level for SMC.
SGC: sucrose-glycerol-creatine;
SMC: sucrose-mannitol-creatine;
TGC: trehalose-glycerol-creatine
Potential interactions between osmolytes are also of interest and can be tested using an interaction model. Interaction models indicated that strong positive interactions between sugar and sugar alcohol were observed for sucrose and glycerol (p < 0.001) as well as trehalose and glycerol (p < 0.001). The interactions varied with the level of sugar, and not all interactions improved post-thaw recovery (Figure 5a,c). The statistical models indicated that sugars (sucrose and trehalose) interact with creatine (p < 0.05). The variation in log odds of post-thaw recovery at Level 3 of sucrose for all creatine levels in SGC (circled region in Figure 5b) reflects this interaction. A similar effect can be seen at Level 2 of trehalose (Figure 5d). It is noteworthy that the interaction between Level 3 sucrose and creatine is associated with a highest post-thaw recovery for this combination of molecules. Detailed information about both p values and coefficients are listed in Appendix Table 1. In contrast to what was observed with SGC and TGC, interactions between sucrose and mannitol act to reduce post-thaw recovery in SMC (Figure 5e,f).
FIGURE 5.
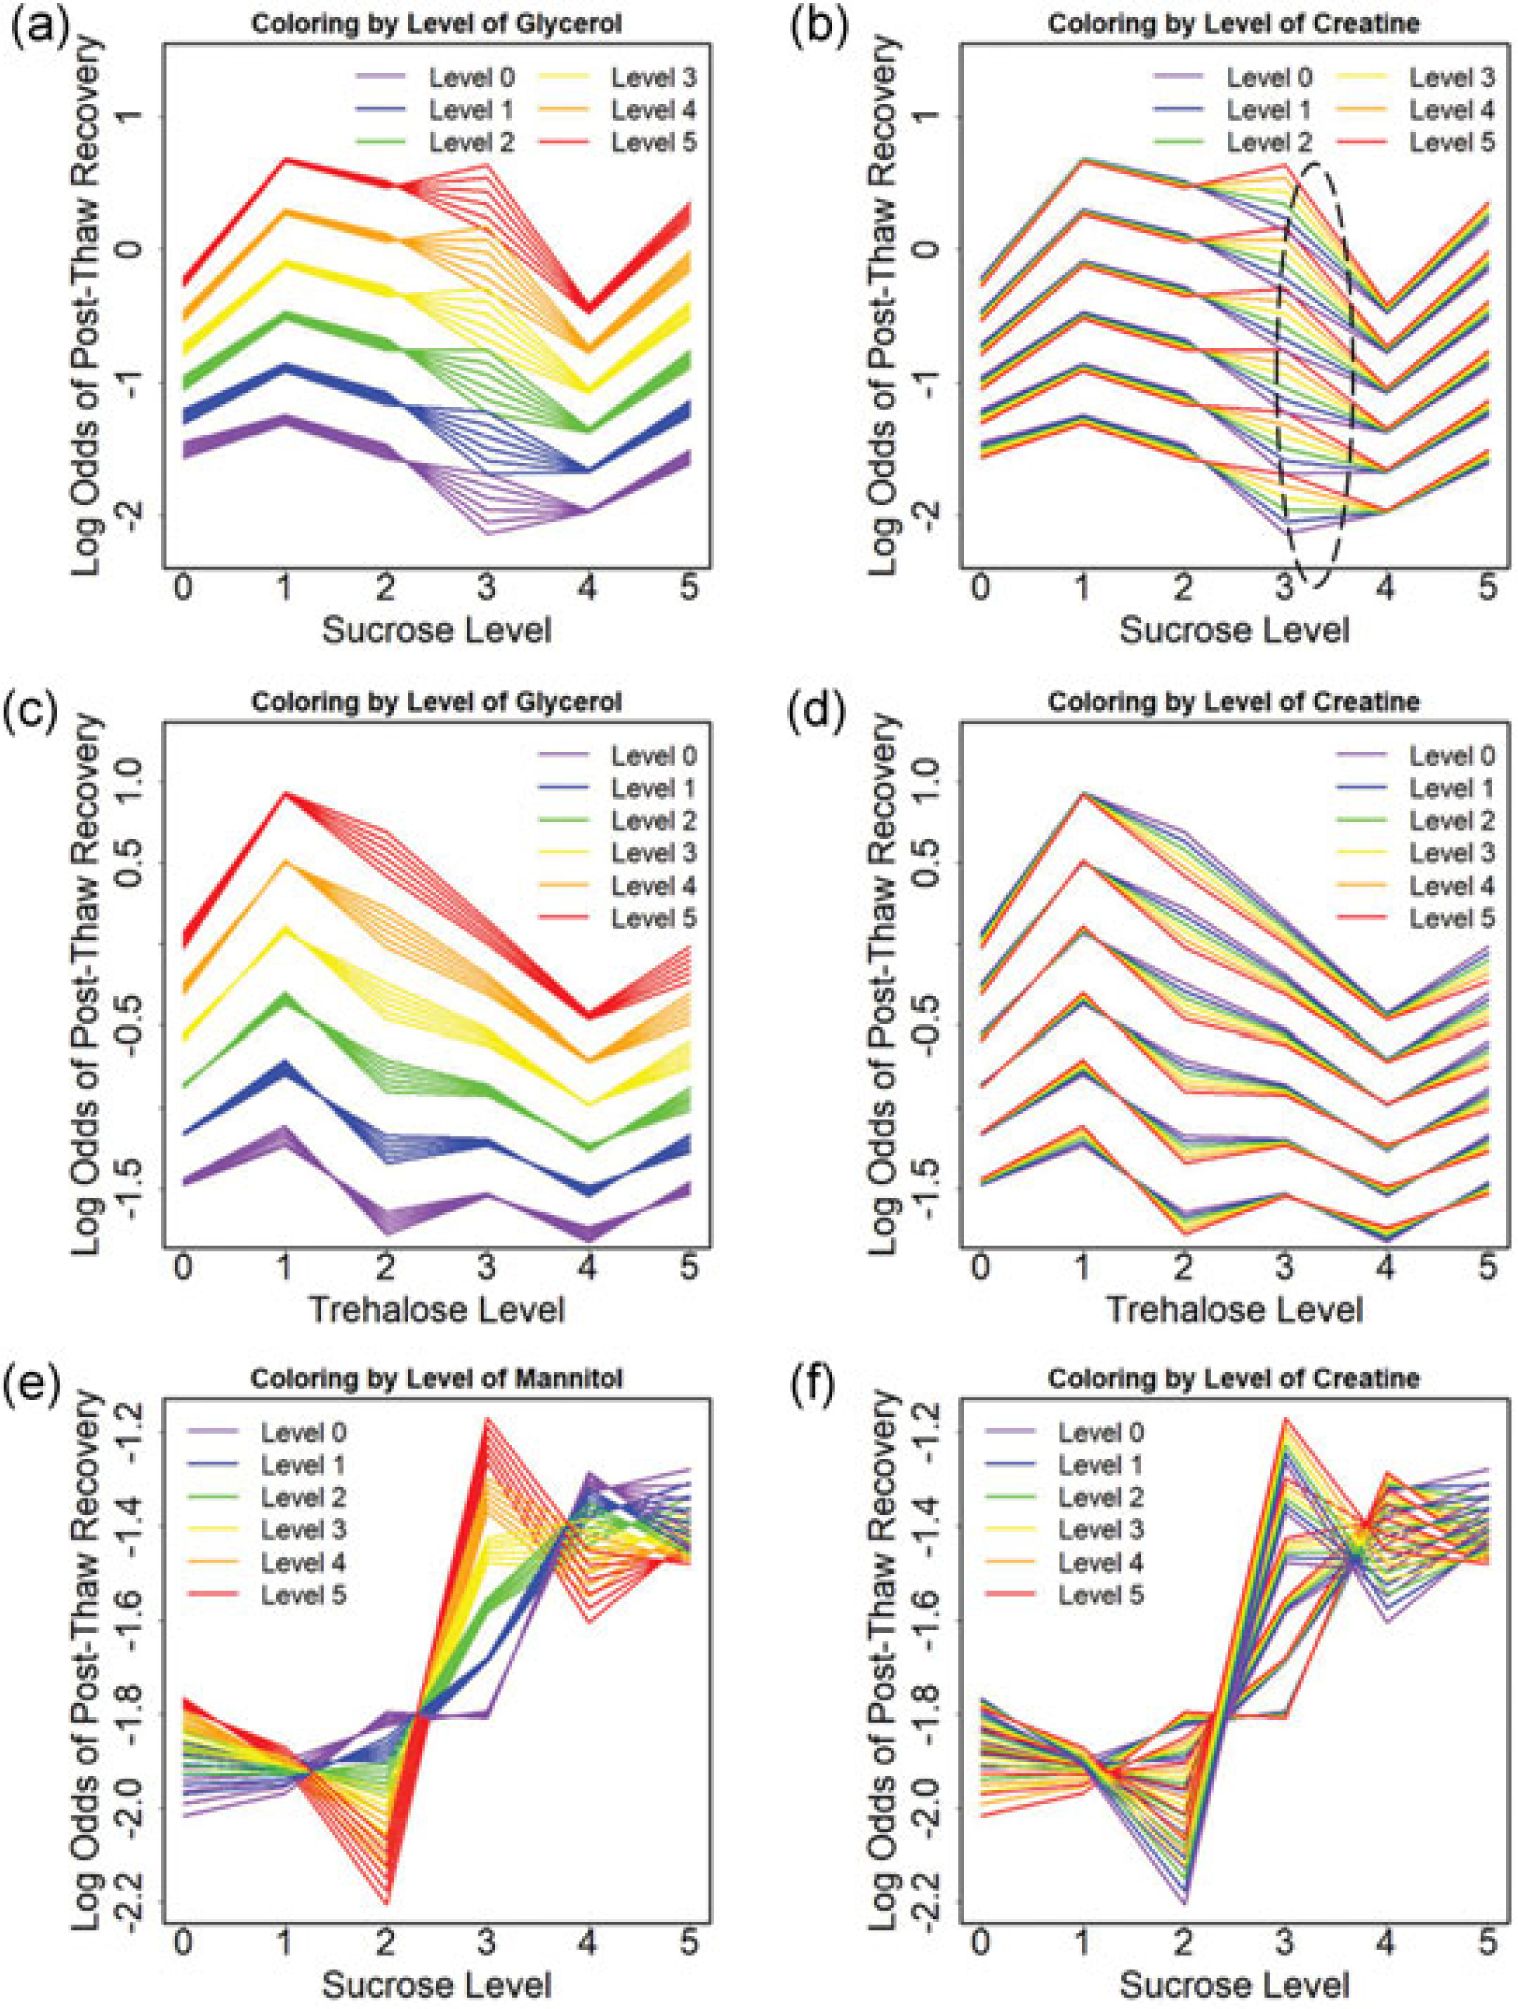
Estimated log odds of post-thaw recovery from the quasi-binomial model with interactions for (a) sucrose level coloring by the glycerol level for SGC, (b) sucrose level coloring by the creatine level for SGC, (c) trehalose level coloring by the glycerol level for TGC, (d) trehalose level coloring by the creatine level for TGC, (e) sucrose level coloring by the mannitol level for SMC, and (f) sucrose level coloring by creatine level for SMC. SGC: sucrose-glycerol-creatine; SMC: sucrose-mannitol-creatine; TGC: trehalose-glycerol-creatine
3.4 |. Raman spectroscopy of Jurkat cells cryopreserved in multicomponent solutions
The studies described above demonstrated relatively subtle changes in composition can result in distinctly different post-thaw recoveries. Raman spectroscopy was used to help us understand the role of specific components in stabilizing cells during freezing. For example, Raman microscopy was used to characterize the freezing responses of cells cryopreserved in SGC353, which resulted in highest post-thaw recovery (83%), and cells cryopreserved in SMC353, which exhibited a much lower post-thaw recovery (24%). Both compositions had the same concentration of sucrose and creatine, and the only difference was the sugar alcohol used (glycerol or mannitol). Typical Raman images were rendered based on the Raman signals of ice, amide I, glycerol, and mannitol (Figure 6a,b). A distinct difference in the amount of IIF was observed between the two compositions (Figure 6c) and AIC for SGC353 was much lower than that of SMC353 (p < 0.001). Normalized glycerol and mannitol concentration revealed that glycerol was present inside the cell, whereas little mannitol was detected inside the cell (Figure 6d,e).
FIGURE 6.
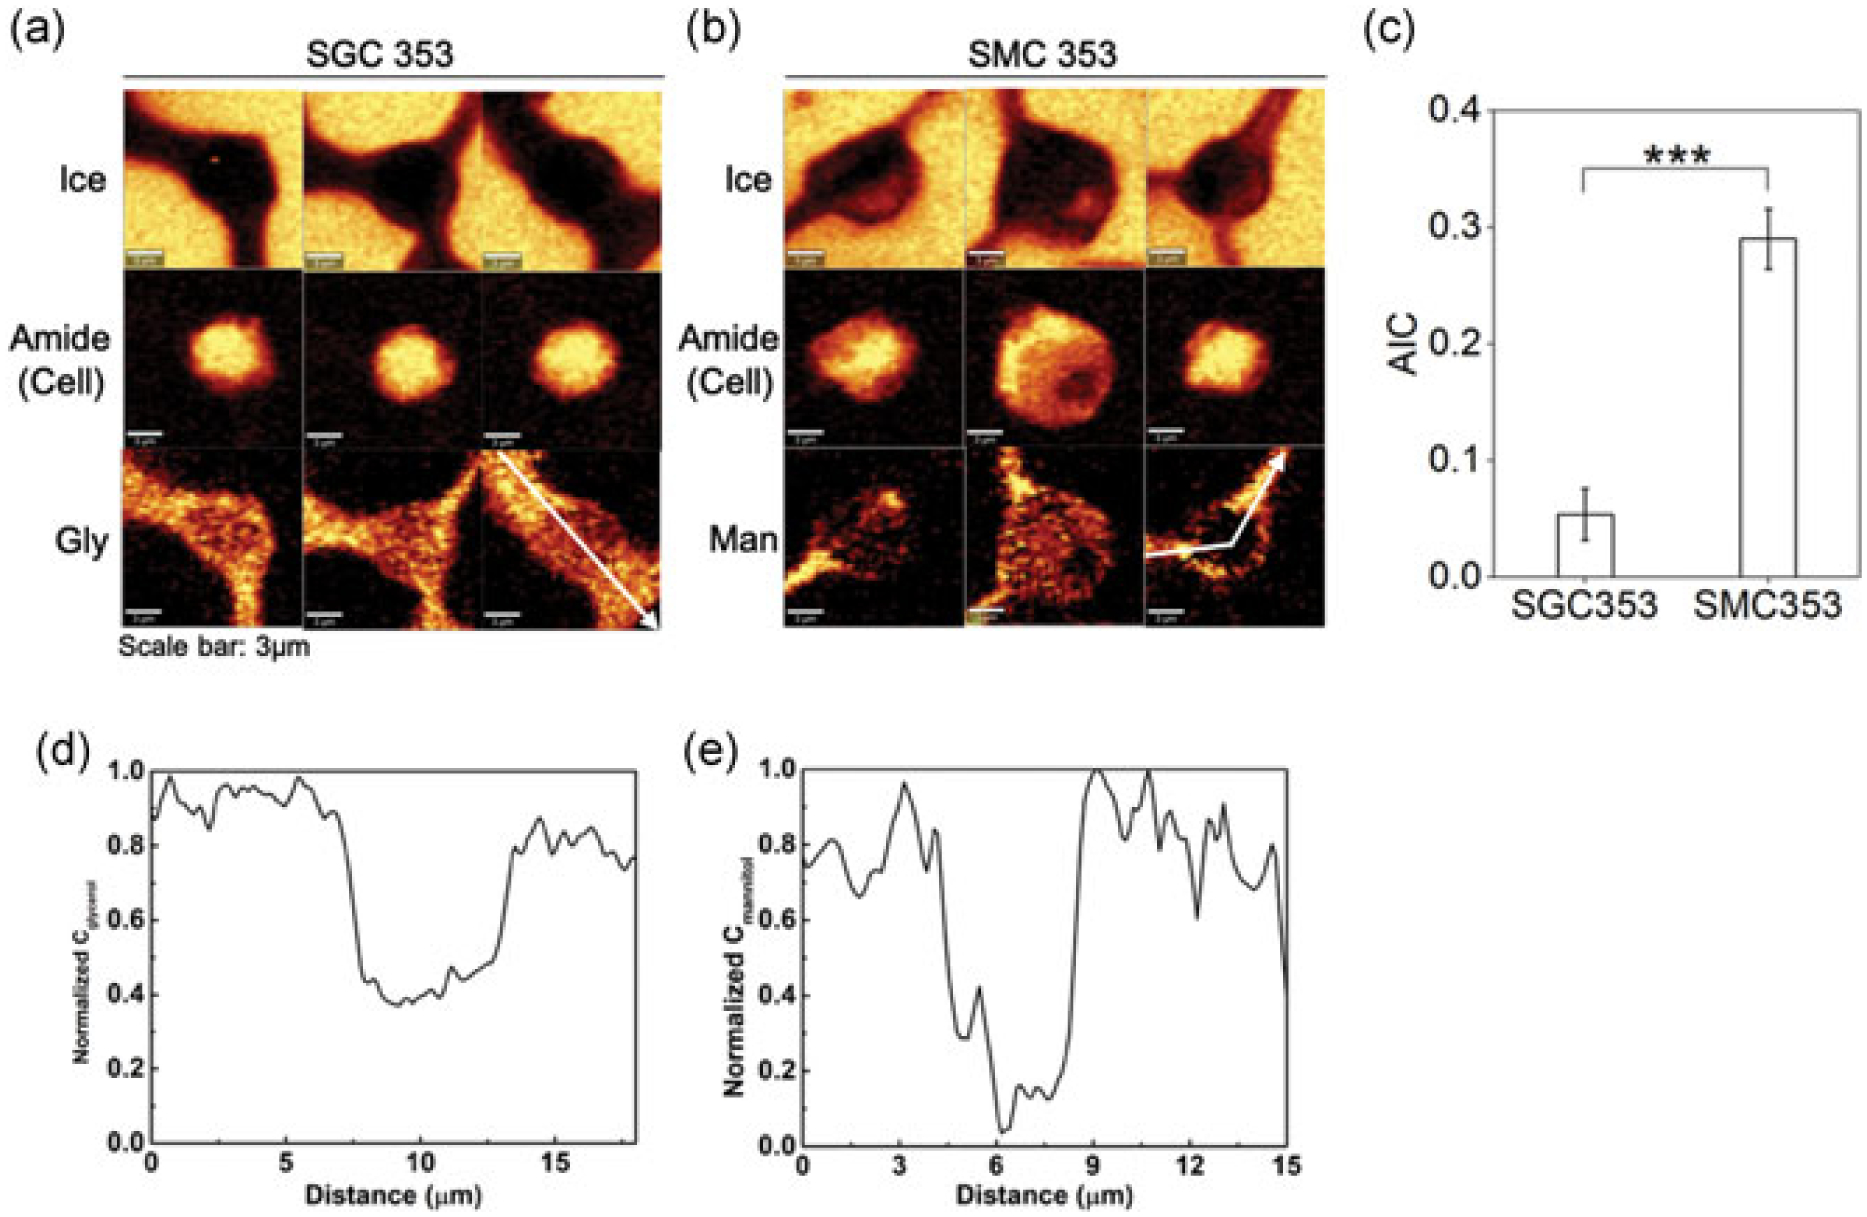
(a) Raman images rendered of the signal of ice, amide I, and glycerol of Jurkat cells cryopreserved in SGC353 solution. Regions of light color correspond to the areas of high concentration of the signal. (b) Raman images rendered of the signal of ice, amide I, and mannitol of cells cryopreserved in SMC353 solution. (c) AIC of cells cryopreserved in SGC353 and SMC353 solution (n = 8; p < 0.001). (d) A normalized concentration of glycerol along the white arrow in (a). (e) A normalized concentration of mannitol along the white arrow in (b). AIC: area of ice-to-cell; SGC: sucrose-glycerol-creatine; SMC: sucrose-mannitol-creatine
Sugar alcohols can also interact with water, and alteration of ice structure by osmolytes has been demonstrated to be influential in cryopreservation outcome (Bailey et al., 2015). To examine the interactions between osmolytes and water during freezing, Raman images of osmolyte solutions without cells cooled down to −50°C with cooling rate 1°C/min were obtained for SGI353 (sucrose-glycerol-isoleucine; Pi et al., 2018), SGC353, TGC353, and SMC353 solutions. At this temperature, both ice and unfrozen liquid were present, and distinct differences in the ice morphology were observed with the different solution compositions. The characterization of ice crystal morphology was analyzed in terms of area and ellipticity (Figure 7a–d).
FIGURE 7.
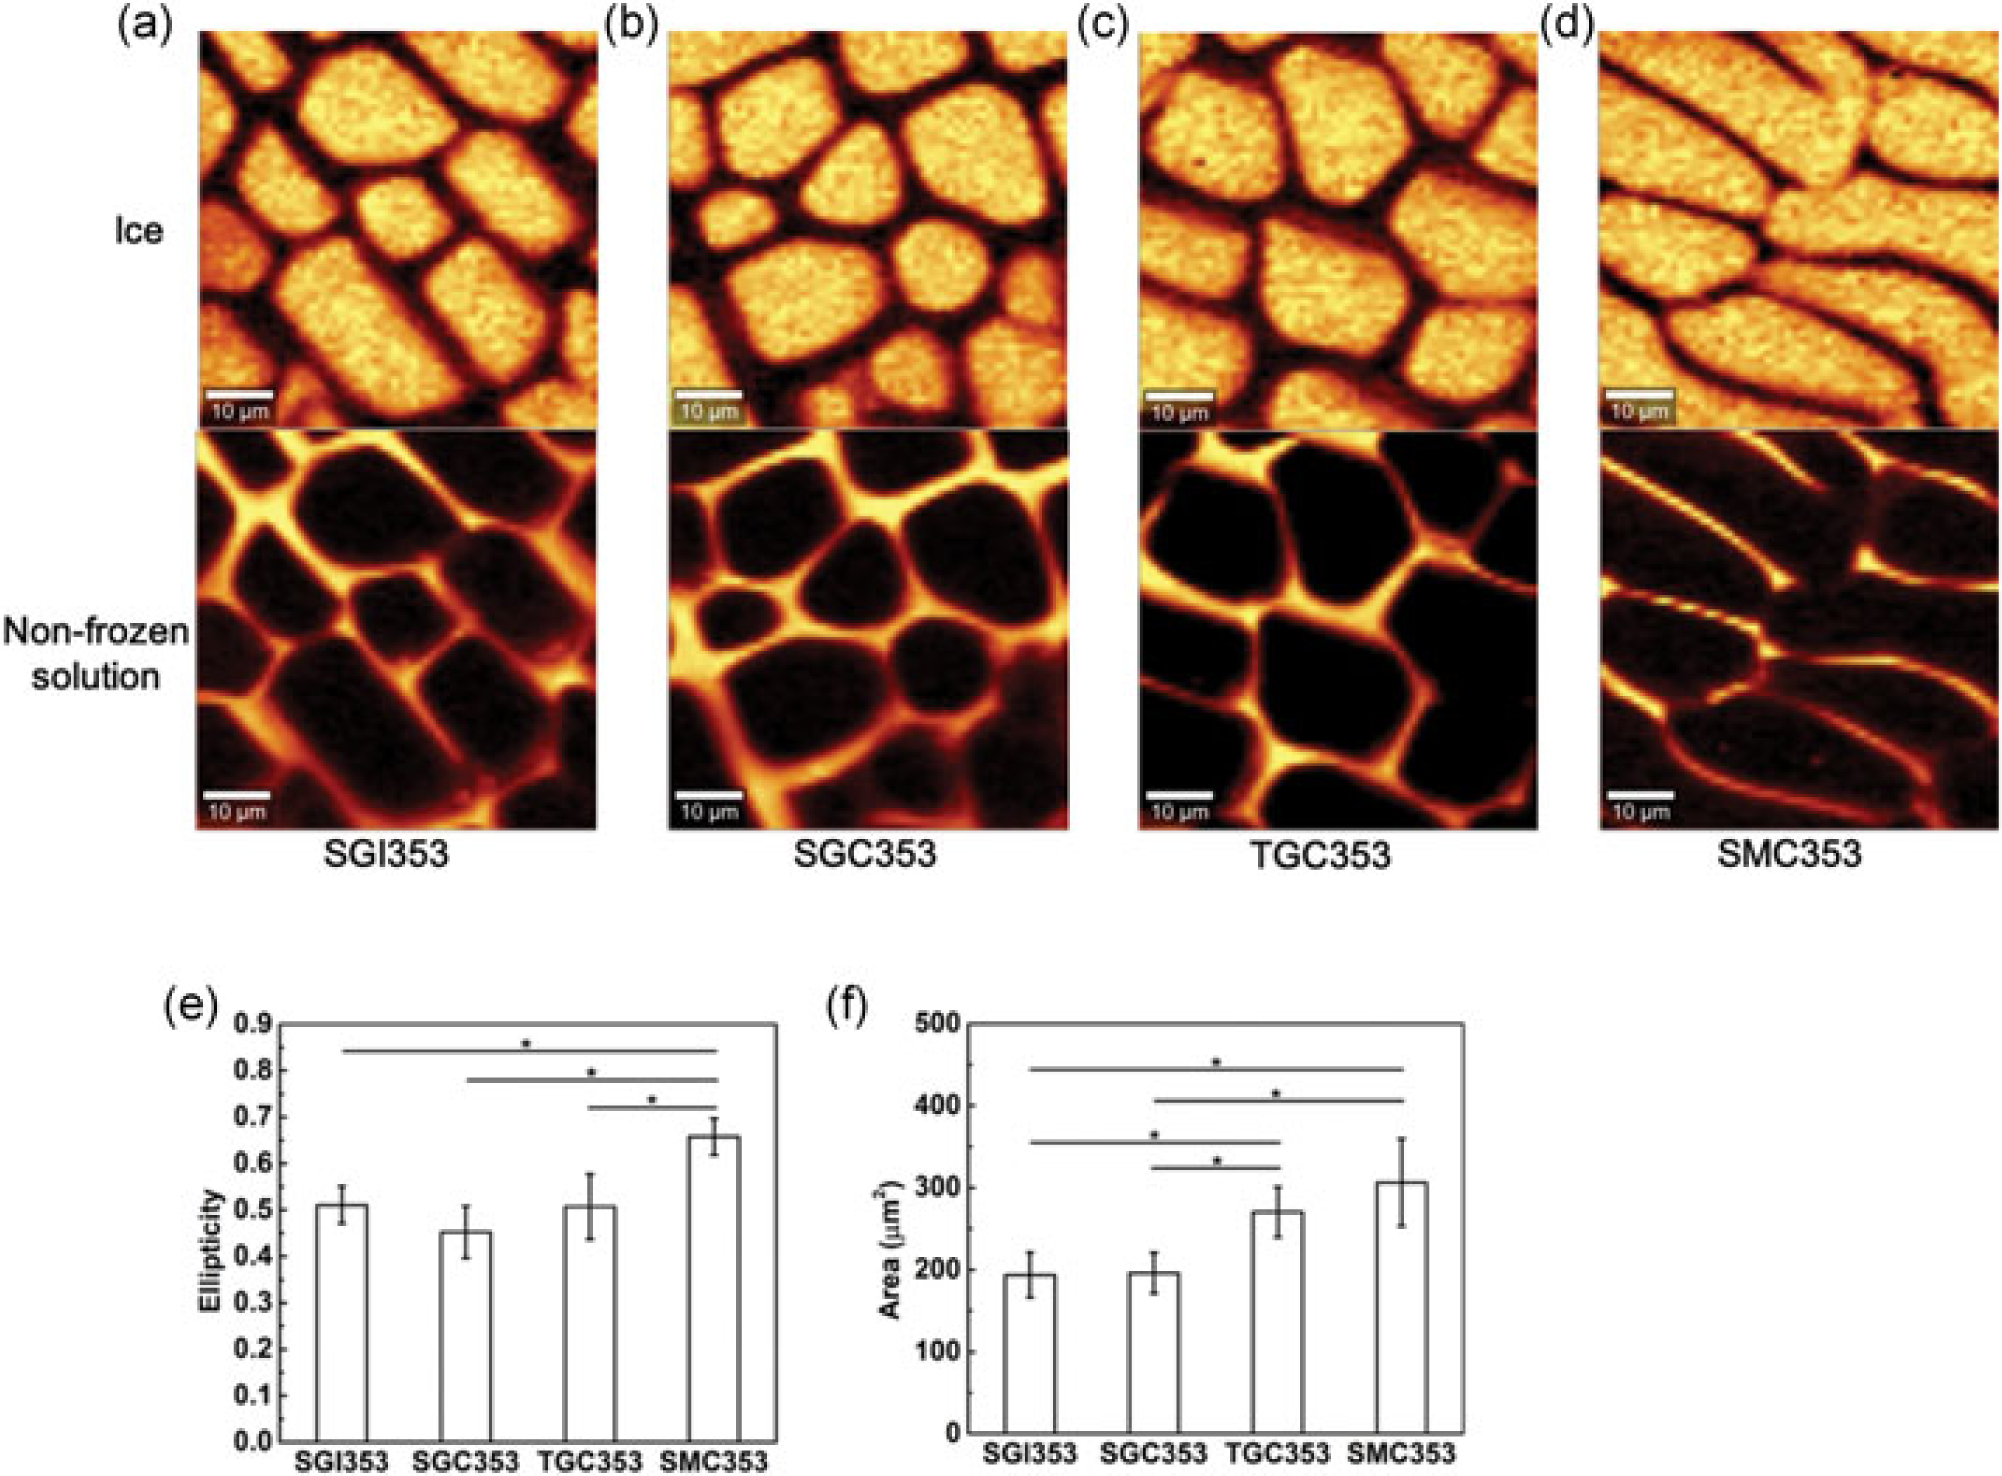
(a) Raman images of ice and nonfrozen solution of SGI353 at −50°C. (b) Raman images of ice and nonfrozen solution of SGC353 at −50°C. (c) Raman images of ice and nonfrozen solution of TGC353 at −50°C. (d) Raman images of ice and nonfrozen solution of SMCC353 at −50°C. (e) The ellipticity of ice crystals formed after freezing of solution compositions of SGI353, SGC353, TGC353, and SMC353 from (a), (b), (c), and (d), respectively (n = 10). (e) Area of ice crystal of SGI353, SGC353, TGC353, and SMC353 from (a), (b), (c), and (d), respectively (n = 10). SGC: sucrose-glycerol-creatine; SGI: sucrose-glycerol-isoleucine; SMC: sucrose-mannitol-creatine; TGC: trehalose-glycerol-creatine
Although both the area and ellipticity of SGC353 and SGI353 were similar, other combinations showed greater differences. With SGC353 and TGC353 (Figure 7b,c), similar ellipticity was observed (Figure 7e), but the area of TGC353 was significantly larger (Figure 7f). Most notably, the area and ellipticity of SMC353 were significantly different (p < 0.05) from that of SGI353, SGC353, and TGC353. This outcome and the differing amounts of IIF observed with the SGC353 and SMC353 compositions strongly suggest that glycerol is affecting the freezing behavior of water both inside and outside cells.
Subtle changes in the concentration of one component can also change post-thaw recovery. For example, the post-thaw recovery was 83% and 40% respectively for cells cryopreserved in SGC353 and SGC453 solution. To understand the difference, Raman images of ice and nonfrozen solution of SGC454 were obtained (Figure 8a) and compared with the images of SGC353 previously obtained (Figure 7b). The more effective SGC353 solution showed significantly (p < 0.05) less ice ellipticity (Figure 8b) and area (Figure 8c) than the SGC453 solution. Raman images also showed significantly (p < 0.01) higher IIF for Jurkat cells cryopreserved in SGC453 in comparison with SGC353 (Figure 8d,e).
FIGURE 8.
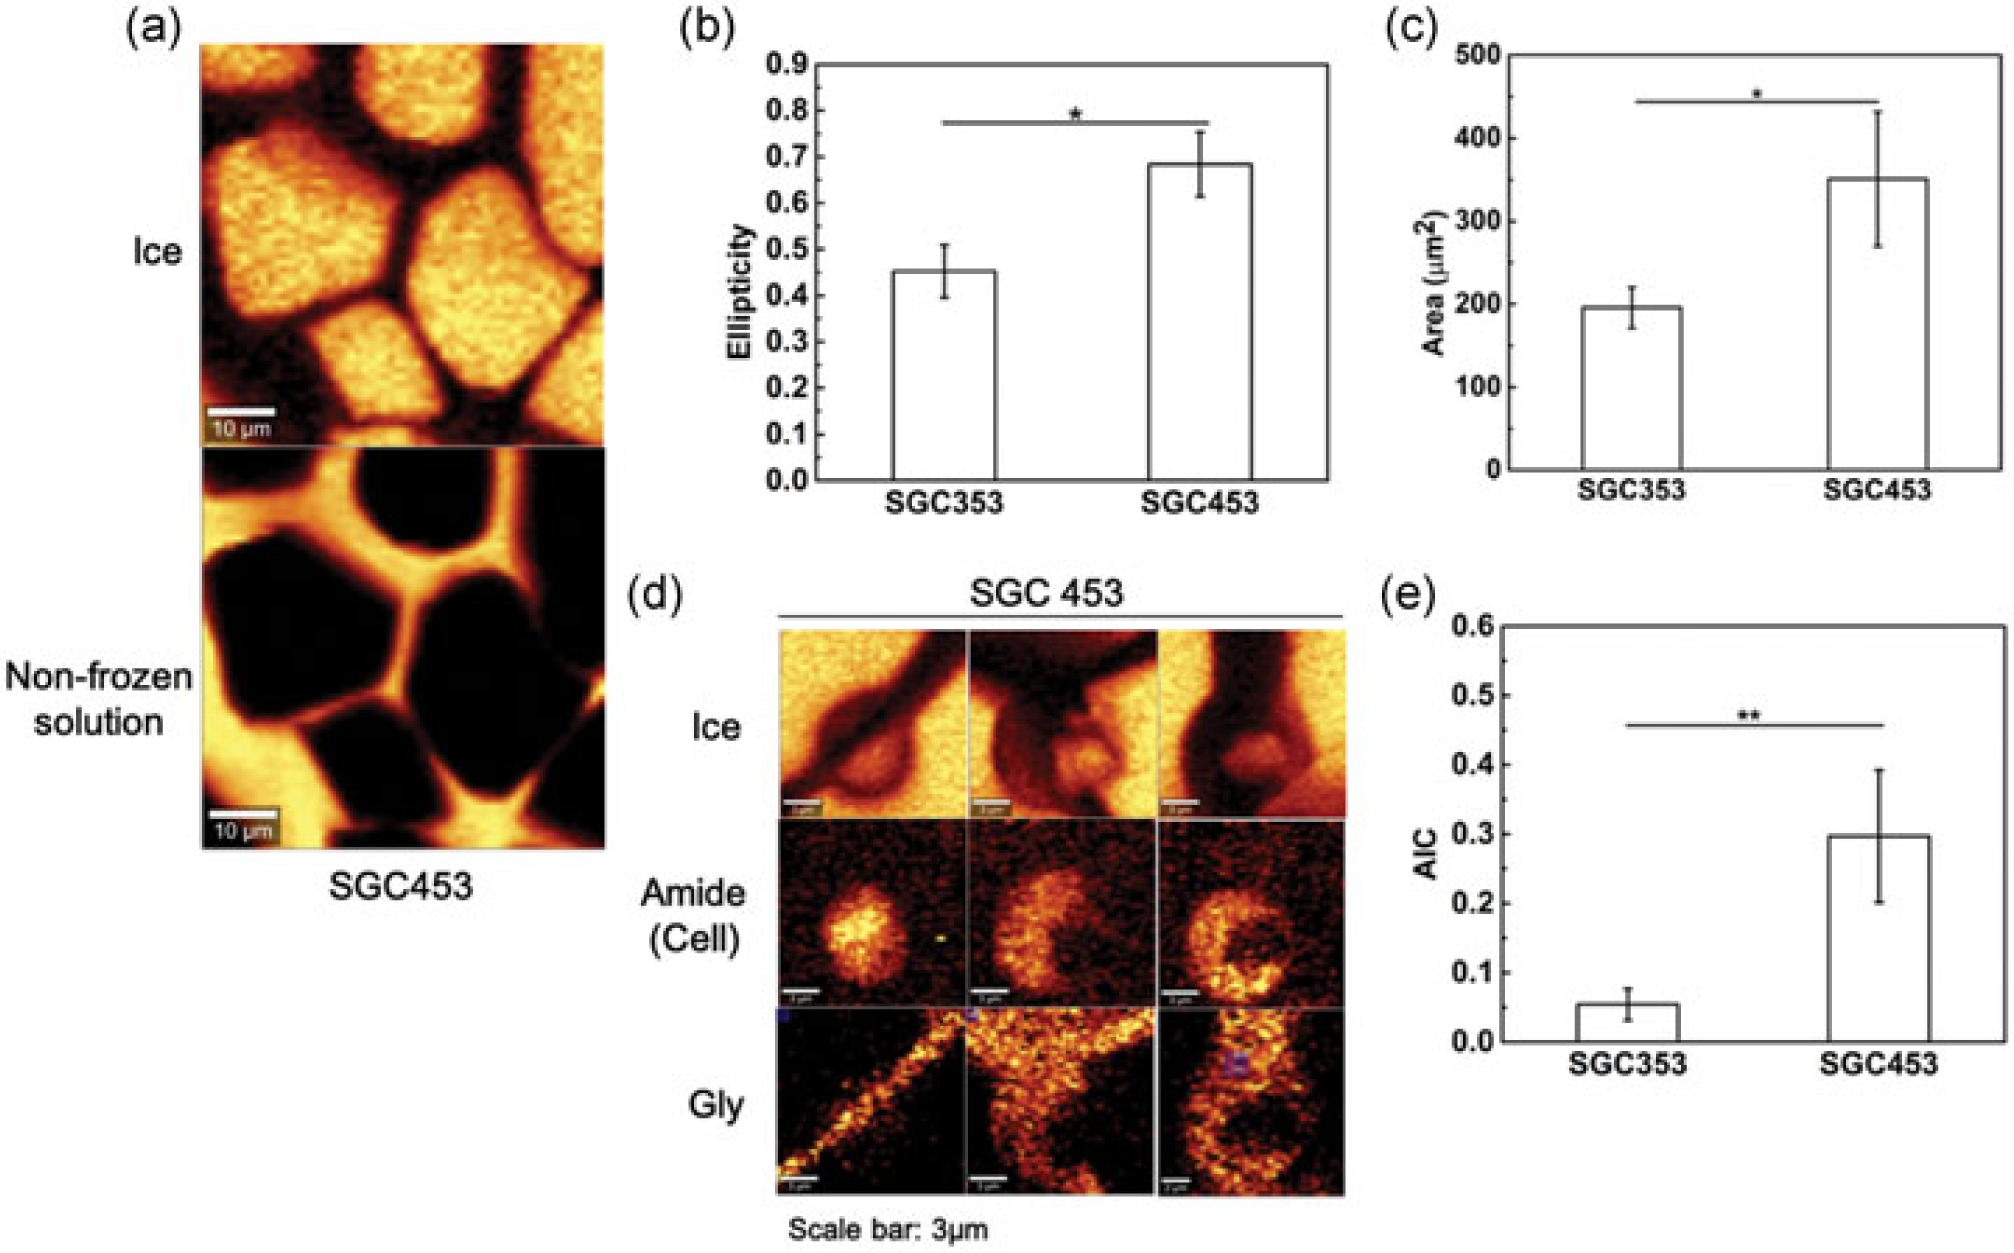
(a) Raman images of ice and nonfrozen solution of SGC453 at −50°C. (b) The ellipticity of ice crystals formed after freezing of solution compositions of SGC353 and SGC453 from Figure 7b and a, respectively (n = 10). (c) Area of ice crystal of SGC353 and SGC453 from Figure 7b and a, respectively (n = 10). (d) Raman images rendered of the signal of ice, amide I, and mannitol of Jurkat cells cryopreserved in SGC453 solution. (e) AIC of cells cryopreserved in SGC353 and SGC453 solution (n = 8; p < 0.01). AIC: area of ice-to-cell; SGC: sucrose-glycerol-creatine
4 |. DISCUSSION/CONCLUSION
The search for cryoprotectants that can serve as alternatives to DMSO has been ongoing for several decades. The conventional approach has been to look for a single molecule capable of replacing DMSO, and conventional wisdom has been that higher levels of cryoprotective agents are better than lower. Higher levels shift the phase diagram for the solution and promote vitrification (Cocks & Brower, 1974). This conventional wisdom ignores the strategy developed by nature to use multiple cryoprotective agents to stabilize biological systems against environmental extremes. In the human kidney, a mixture of five osmolytes is used to stabilize the cells (P. H. Yancey, 2005). The outcome of this investigation demonstrates that cryoprotective molecules can influence post-thaw recovery alone and can interact with each other to stabilize cells. The study also demonstrates that this is not a unique property; more than one combination (sucrose and glycerol as well as trehalose and glycerol) of molecules can interact to preserve cells. The long-term goal should be a molecular level understanding of cryoprotection where specific molecules interact with biological structures (such as the cell membrane) as well as each other and water to stabilize cells.
There is a growing body of literature that demonstrates the cryoprotective behavior of the osmolytes studied in this investigation. The cryoprotective benefits of sugars, especially trehalose and sucrose, have been studied extensively (Gläfke, Akhoondi, Oldenhof, Sieme, & Wolkers, 2012; Martinetti et al., 2017). Sugar alcohols such as glycerol have been used to cryopreserve platelets (Redmond, Bolin & Cheney, 1983) and red blood cells (Scott, Lecak, & Acker, 2005).
4.1 |. Sugars
Our models suggest that sugars improve the post-thaw recovery and that sugars interact with both sugar alcohols and amino acids to influence the post-thaw recovery. There appears to be a threshold level for the stabilizing effects of the sugars: the post-thaw recovery increases with an increasing level of sugar and then decreases for increasing level of sugar beyond the threshold level for both SGC and TGC. The outcome is consistent with that observed in our previous work (Pi et al., 2018).
It is noteworthy that the sugars tested do not readily penetrate the cell membrane. As a result, the molecule acts principally in the extracellular space. This outcome is consistent with a previous work in our lab (Yu, Li, & Hubel, 2018). Ice crystal formation in the extracellular space is also influenced by the presence of sugars. Trehalose and sucrose influenced both the shape and size of ice crystals in the extracellular space. This outcome is consistent with previous studies, which found that sugars suppressed the growth rate of ice crystals due to the strong hydrogen bonding of sugar with water molecules (Sei, Gonda, & Arima, 2002; Uchida, Nagayama, Shibayama, & Gohara, 2007). These results are also consistent with the findings of Bailey et al. (2015), who found that the addition of trehalose to DMSO changed the ice crystal patterns observed upon freezing.
The stabilizing effects of sugars also reflect the interaction with the cell membrane. Crowe et al. (1988) postulated that sugars replaced water in the cell membrane during freezing. A recent study (Yu et al., 2018) used low-temperature Raman spectroscopy to image interactions between sugars and the cell membrane. The molecular structure of the sugar influences the stabilizing effects. We have established previously that disaccharides are more effective than monosaccharides (Pollock, Yu et al., 2016) in improving the post-thaw recovery of cells. Disaccharides can reduce the free water due to hydration effect for proteins in the cell when compared with monosaccharides (Sei et al., 2002; Uchida et al., 2007), suggesting that disaccharides are more effective in stabilizing cell membrane proteins than monosaccharides.
4.2 |. Sugar alcohols
Our models suggest that glycerol plays a major role in cell survival and that glycerol interacts with sugars as well. The influence of glycerol on cell survival has been known for over 60 years (Lovelock, 1954). This small molecule penetrates the cell membrane. There is a significant difference in post-thaw recovery for cells frozen in SGC when compared with SMC, and this may come from not only the absolute concentrations used but also from the intrinsic molecular difference between glycerol and mannitol. The Raman images obtained suggest that the higher post-thaw recovery for cells cryopreserved in SGC results from the ability of the molecule to penetrate the cell membrane (Figure 6). The importance of penetrating cryoprotectants on post-thaw recovery has long been known (Mazur, 2004), but a recent study has found that nonpenetrating cryoprotectants can also provide protection (Liu et al., 2016). In addition, cell types may respond differently to the same formulation. For example, SMC showed a moderate post-thaw recovery to mesenchymal stem cells but low post-thaw recovery in this study (Pollock, Yu et al., 2016). Glycerol has long been associated with the stabilization of proteins (Timasheff, 1993). The ability of glycerol to penetrate the cell may result in the enhanced stability of intracellular proteins, which in turn results in improved post-thaw recovery.
As with sugars, the results in this study suggest that sugar alcohols act on water molecules. Raman images of ice formed in the presence of the solutions of interest demonstrated differences in shape and size of ice crystal with different compositions. This outcome is consistent with previous studies that have shown that the hydrogen bonding between glycerol and water plays a significant role to inhibit ice crystallization and the structure of ice crystals formed during freezing (Dashnau, Nucci, Sharp, & Vanderkooi, 2006; Mendelovici, Frost, & Kloprogge, 2000; Silverstein, Haymet, & Dill, 2000; Vanderkooi, Dashnau, & Zelent, 2005). Taken together, these studies demonstrate that molecular level interactions result in macroscale changes in ice growth.
4.3 |. Amino acids
Our models suggest that amino acids interact with sugars to alter post-thaw recovery. For example, SGC had more formulations with higher post-thaw recovery than TGC under the same combination of glycerol and creatine, and our interaction models suggest the interaction of creatine to sucrose is stronger than it to trehalose. Interactions between sugars and amino acids are consistent to the work by Wen et al. (2016) that specific proteins stabilize trehalose during freezing and inhibit ice formation (Hahn, Uhlig, Solomun, Smiatek, & Sturm, 2016), that amino acids strengthen the local interactions between water molecules.
4.4 |. Interactions between osmolytes
Our model suggests that sugar alcohols interact with sugars for a range of molecules and concentrations tested. Castro et al. (2018) observed a similar outcome when they determined that trehalose and glycerol formed a natural deep eutectic system when combined with water. Specifically, the combination of molecules exhibited a stronger than expected influence on the eutectic temperature of the solution. This outcome suggests that one potential explanation for the interaction of sugar and sugar alcohol could be the formation of a deep eutectic system that influences the solidification of water. Studies have observed that the stability of a protein is strongly influenced by the interactions between sugar and sugar alcohol (Jena, Suryanarayanan, & Aksan, 2016; Lu & Pikal, 2004). It is noteworthy that combinations of osmolytes have also been used to stabilize proteins, suggesting another potential method of action for combinations of osmolytes. Finally, recent studies began to clearly demonstrate the beneficial effect of combinations of osmolytes on post-thaw recovery (Pi et al., 2018; Pollock, Yu et al., 2016).
Supplementary Material
ACKNOWLEDGMENTS
This study was funded by the National Institutes of Health under R01EB023880. Parts of this study were carried out in the Characterization Facility, University of Minnesota, which received partial support from NSF through the MRSEC program.
Funding information
National Institute of Biomedical Imaging and Bioengineering, Grant/Award Number: R01EB023880
Footnotes
CONFLICTS OF INTEREST
The authors declare that there are no conflicts of interest.
SUPPORTING INFORMATION
Additional supporting information may be found online in the Supporting Information section at the end of the article.
REFERENCES
- De Abreu Costa L, Ottoni MHF, Dos Santos MG, Meireles AB, De Almeida VG, De Fátima Pereira W, … Brito-Melo GEA (2017). Dimethyl sulfoxide (DMSO) decreases cell proliferation and TNF-α, IFN-, and IL-2 cytokines production in cultures of peripheral blood lymphocytes. Molecules, 22, 1–10. [DOI] [PMC free article] [PubMed] [Google Scholar]
- Bailey TL, Wang M, Solocinski J, Nathan BP, Chakraborty N, & Menze MA (2015). Protective effects of osmolytes in cryopreserving adherent neuroblastoma (Neuro-2a) cells. Cryobiology, 71, 472–480. 10.1016/j.cryobiol.2015.08.015 [DOI] [PubMed] [Google Scholar]
- Redmond J 3rd, Bolin RB, & Cheney BA (1983). Glycerol-glucose cryopreservation of platelets: In vivo and in vitro observations. Transfusion, 23, 213–214. [DOI] [PubMed] [Google Scholar]
- Castro VIB, Craveiro R, Silva JM, Reis RL, Paiva A, & C. duarte AR (2018). Natural deep eutectic systems as alternative nontoxic cryoprotective agents. Cryobiology, 83, 15–26. 10.1016/j.cryobiol.2018.06.010 [DOI] [PubMed] [Google Scholar]
- Cocks FH, & Brower WE (1974). Phase diagram relationships in cryobiology. Cryobiology, 358, 340–358. [DOI] [PubMed] [Google Scholar]
- Crowe JH, Crowe LM, Carpenter JF, Rudolph AS, Wistrom CA, Spargo BJ, & Anchordoguy TJ (1988). Interactions of sugars with membranes. Biochimica et Biophysica Acta - Reviews on Biomembranes, 947, 367–384. [DOI] [PubMed] [Google Scholar]
- Dashnau JL, Nucci NV, Sharp KA, & Vanderkooi JM (2006). Hydrogen bonding and the cryoprotective properties of glycerol/water mixtures. Journal of Physical Chemistry B, 110, 13670–13677. [DOI] [PubMed] [Google Scholar]
- Gläfke C, Akhoondi M, Oldenhof H, Sieme H, & Wolkers WF (2012). Cryopreservation of platelets using trehalose: The role of membrane phase behavior during freezing. Biotechnology Progress, 28, 1347–1354. [DOI] [PubMed] [Google Scholar]
- Hahn MB, Uhlig F, Solomun T, Smiatek J, & Sturm H (2016). Combined influence of ectoine and salt: Spectroscopic and numerical evidence for compensating effects on aqueous solutions. Physical Chemistry Chemical Physics, 18, 28398–28402. [DOI] [PubMed] [Google Scholar]
- Jena S, Suryanarayanan R, & Aksan A (2016). Mutual influence of mannitol and trehalose on crystallization behavior in frozen solutions. Pharmaceutical Research, 33, 1413–1425. [DOI] [PubMed] [Google Scholar]
- Liu J, Tanrikut C, Wright DL, Lee GY, Toner M, Biggers JD, & Toth TL (2016). Cryopreservation of human spermatozoa with minimal non-permeable cryoprotectant. Cryobiology, 73, 162–167. 10.1016/j.cryobiol.2016.08.004 [DOI] [PMC free article] [PubMed] [Google Scholar]
- Lovelock JE (1954). The protective action of neutral solutes against haemolysis by freezing and thawing. Biochemical Journal, 56, 265–270. http://www.pubmedcentral.nih.gov/articlerender.fcgi?artid=1269611&tool=pmcentrez&rendertype=abstract [DOI] [PMC free article] [PubMed] [Google Scholar]
- Lovelock JE, & Bishop MWH (1959). Prevention of freezing damage to living cells by dimethyl sulphoxide. Nature, 183, 1394–1395. [DOI] [PubMed] [Google Scholar]
- Lu X, & Pikal MJ (2004). Freeze-drying of mannitol-trehalose-sodium chloride-based formulations: The impact of annealing on dry layer resistance to mass transfer and cake structure. Pharmaceutical Development and Technology, 9, 85–95. [DOI] [PubMed] [Google Scholar]
- Martinetti D, Colarossi C, Buccheri S, Denti G, Memeo L, & Vicari L (2017). Effect of trehalose on cryopreservation of pure peripheral blood stem cells. Biomed. Reports, 6, 314–318. http://www.spandidos-publications.com/10.3892/br.2017.859 [DOI] [PMC free article] [PubMed] [Google Scholar]
- Mazur P (2004). Fuller B, Lane N, & Benson E (Eds.), Life in the Frozen State (1st ed, pp. 3–66). Boca Raton, Florida: CRC Press. [Google Scholar]
- Mendelovici E, Frost RL, & Kloprogge T (2000). Cryogenic Raman spectroscopy of glycerol. Journal of Raman Spectroscopy, 31, 1121–1126. [Google Scholar]
- Pi C-H, Yu G, Petersen A, & Hubel A (2018). Characterizing the “sweet spot” for the preservation of a T-cell line using osmolytes. Scientific Reports, 8, 16223. [DOI] [PMC free article] [PubMed] [Google Scholar]
- Piscopo NJ, Mueller KP, Das A, Hematti P, Murphy WL, Palecek SP, … Saha K (2018). Bioengineering solutions for manufacturing challenges in CAR T cells. Biotechnology Journal, 13, 1–10. [DOI] [PMC free article] [PubMed] [Google Scholar]
- Pollock K, Budenske JW, McKenna DH, Dosa PI, & Hubel A (2016). Algorithm-driven optimization of cryopreservation protocols for transfusion model cell types including Jurkat cells and mesenchymal stem cells. Journal of tissue engineering and regenerative medicine, 11, 2806–2815. [DOI] [PMC free article] [PubMed] [Google Scholar]
- Pollock K, Samsonraj RM, Dudakovic A, Thaler R, Stumbras A, McKenna DH, … Hubel A (2017). Improved post-thaw function and epigenetic changes in mesenchymal stromal cells cryopreserved using multicomponent osmolyte solutions. Stem Cells Dev, 26, 828–842. [DOI] [PMC free article] [PubMed] [Google Scholar]
- Pollock K, Yu G, Moller-Trane R, Koran M, Dosa PI, McKenna DH, & Hubel A (2016). Combinations of osmolytes, including monosaccharides, disaccharides, and sugar alcohols act in concert during cryopreservation to improve mesenchymal stromal cell survival. Tissue engineering. Part C, Methods, 22, 999–1008. [DOI] [PMC free article] [PubMed] [Google Scholar]
- Scott KL, Lecak J, & Acker JP (2005). Biopreservation of red blood cells: Past, present, and future. Transfusion Medicine Reviews, 19, 127–142. [DOI] [PubMed] [Google Scholar]
- Sei T, Gonda T, & Arima Y (2002). Growth rate and morphology of ice crystals growing in a solution of trehalose and water. Journal of Crystal Growth, 240, 218–229. [Google Scholar]
- Silverstein KAT, Haymet ADJ, & Dill KA (2000). The strength of hydrogen bonds in liquid water and around nonpolar solutes. Journal of the American Chemical Society, 122, 8037–8041. [Google Scholar]
- Timasheff SN (1993). The control of protein stability and association by weak interactions with water: How do solvents affect these processes? Annual Review of Biophysics and Biomolecular Structure, 22, 67–97. [DOI] [PubMed] [Google Scholar]
- Uchida T, Nagayama M, Shibayama T, & Gohara K (2007). Morphological investigations of disaccharide molecules for growth inhibition of ice crystals. Journal of Crystal Growth, 299, 125–135. [Google Scholar]
- Vanderkooi JM, Dashnau JL, & Zelent B (2005). Temperature excursion infrared (TEIR) spectroscopy used to study hydrogen bonding between water and biomolecules. Biochimica et Biophysica Acta-Proteins and Proteomics, 1749, 214–233. [DOI] [PubMed] [Google Scholar]
- De Veij M, Vandenabeele P, De Beer T, Remon JP, & Moens L (2009). Reference database of Raman spectra of pharmaceutical excipients. Journal of Raman Spectroscopy, 40, 297–307. [Google Scholar]
- Wen X, Wang S, Duman JG, Arifin JF, Juwita V, Goddard WA, … Henling LM (2016). Antifreeze proteins govern the precipitation of trehalose in a freezing-avoiding insect at low temperature. Proceedings of the National Academy of Sciences of the USA, 113, 6683–6688. [DOI] [PMC free article] [PubMed] [Google Scholar]
- Windrum P, Morris TCM, Drake MB, Niederwieser D, & Ruutu T (2005). Variation in dimethyl sulfoxide use in stem cell transplantation: A survey of EBMT centres. Bone Marrow Transplantation (Basingstoke), 36, 601–603. [DOI] [PubMed] [Google Scholar]
- Yancey P, Clark M, Hand S, Bowlus R, & Somero G (1982). Living with water stress: Evolution of osmolyte systems. Science, 217(80), 1214–1222. [DOI] [PubMed] [Google Scholar]
- Yancey PH (2005). Organic osmolytes as compatible, metabolic and counteracting cytoprotectants in high osmolarity and other stresses. Journal of Experimental Biology, 208, 2819–2830. [DOI] [PubMed] [Google Scholar]
- Yu G, Li R, & Hubel A (2018). Interfacial interactions of sucrose during cryopreservation detected by Raman spectroscopy. Langmuir. 10.1021/acs.langmuir.8b01616 [DOI] [PMC free article] [PubMed] [Google Scholar]
- Yu G, Yap YRRR, Pollock K, & Hubel A (2017). Characterizing intracellular ice formation of lymphoblasts using low-temperature Raman spectroscopy. Biophysical Journal, 112, 2653–2663. [DOI] [PMC free article] [PubMed] [Google Scholar]
Associated Data
This section collects any data citations, data availability statements, or supplementary materials included in this article.


