

Abstract
Multispectral optoacoustic tomography (MSOT) is an emerging noninvasive imaging modality that can detect real-time dynamic information about the tumor microenvironment (TME) in humans and animals. Oxygen enhanced (OE)-MSOT can monitor tumor vasculature and oxygenation during disease development or therapy. Here we used MSOT and OE-MSOT to examine in mice the response of human non-small cell lung cancer (NSCLC) xenografts to a new class of anti-tumor drugs, heme-targeting agents heme-sequestering peptide 2 (HSP2) and cyclopamine tartrate (CycT). HSP2 inhibits heme uptake while CycT inhibits heme synthesis in NSCLC cells, where heme is essential for ATP generation via oxidative phosphorylation. HSP2 and CycT can inhibit ATP generation and thereby suppress NSCLC cell tumorigenic functions. MSOT showed that treatment of NSCLC tumors with HSP2 or CycT reduced total hemoglobin, increased oxygen saturation, and enhanced the amplitude of response to oxygen gas breathing challenge. HSP2 and CycT normalized tumor vasculature and improved tumor oxygenation, where levels of several hypoxia markers in NSCLC tumors were reduced by treatment with HSP2 or CycT. Furthermore, treatment with HSP2 or CycT reduced levels of angiogenic factor VEGFA, its receptor VEGFR1, and vascular marker CD34. Together, our data show that heme-targeting drugs HSP2 and CycT elicit multiple tumor-suppressing functions, such as inhibiting angiogenic function, normalizing tumor vasculature, alleviating tumor hypoxia, and inhibiting oxygen consumption and ATP generation.
Keywords: multispectral optoacoustic tomography, oxygen challenge, non-small cell lung cancer, heme sequestering peptide, cyclopamine tartrate
INTRODUCTION
The tumor microenvironment (TME) is a complex and continuously evolving ecosystem that influences tumor heterogeneity, invasion, and metastasis (1). TME is widely recognized as a major contributor to cancer progression and treatment resistance (2–5). One feature of the TME is tumor vasculature and oxygenation. The tumor vascular network consists of leaky and compressed vessels, which are inefficient and lead to impaired blood flow and oxygen delivery (4, 5). Thus, vascular function in tumors is often defective, causing tumor hypoxia. Tumor hypoxia promotes several processes critical for cancer progression, including angiogenesis, epithelial-mesenchymal transition (EMT), migration/invasion, metastasis, immune surveillance, and resistance to chemotherapy and radiotherapy (6–9). It is an independent marker of poor prognosis in many types of human cancer (10, 11). Thus, monitoring tumor hypoxia is important for understanding tumor progression, tumor responses to therapeutic treatments, and the development of therapeutic resistance. Substantial tumor hypoxia exists in NSCLC, even in early-stage tumors (12). Targeting hypoxia is crucial for improving therapeutic outcome for NSCLC and other drug-resistant cancers.
Optoacoustic tomography (OT) is an emerging modality that can be used both pre-clinically and clinically to noninvasively visualize the TME, particularly tumor vasculature, oxygenation and hypoxia (13–17). OT data acquired at multiple wavelengths allows the calculation of total hemoglobin concentrations (THb) and oxygenation (sO2) (17, 18). Thus, multispectral optoacoustic tomography (MSOT) has been used to monitor tumor vasculature during disease development and examine response to vascular-targeted therapies (18–22). Due to increased angiogenesis, THb tends to be high in tumors compared to normal tissue (23–25). However, MSOT often detects lower sO2 values in tumors compared to normal tissues (23–27), consistent with poor perfusion and/or tumor hypoxia due to high consumption of O2 from the blood. Oxygen enhanced (OE) MSOT allows the measurement of changes in hemoglobin oxygenation following a switch of respiratory gas from air to 100% oxygen. Contrary to the static measurement of oxygenation, the “dynamic” OE-MSOT measurements, including ΔsO2, have been shown to correlate with histopathologic analysis of tumor vascular function and provide more robust and reproducible data than the static measurements (28, 29). Thus, MSOT and OE-MSOT together can provide extensive real-time information about tumor vasculature and oxygenation in live animals.
Lung cancer is the leading cause of cancer-related death in the US (30). About 85-90% of cases are classified as non-small cell lung cancer (NSCLC) (31, 32). Despite the advent of targeted therapies and immunotherapies, an effective treatment or cure for lung cancer remains an unlikely outcome for most patients. The five-year survival rate remains 10-20%, lower than many other cancers, including breast (90%) and prostate (99%) cancers (33, 34). Notably, our recent studies demonstrated that elevated mitochondrial respiration/oxidative phosphorylation (OXPHOS) and heme function are a key feature of NSCLC cells (35). Heme is a central molecule in oxygen utilization and serves as a prosthetic group or cofactor for many proteins and enzymes, such as those acting in OXPHOS. Further, we discovered that two drugs, HSP2 (heme-sequestering peptide 2) and CycT (cyclopamine tartrate) that effectively inhibit OXPHOS in vitro and in vivo, suppress lung tumor growth and progression in human tumor xenograft mouse models (35, 36). CycT is a previously known inhibitor of Hedgehog signaling (37). Our studies have shown that CycT strongly inhibits heme synthesis and OXPHOS and suppresses subcutaneous and orthotopic NSCLC tumor xenografts in mice (36). HSP2 is generated based on the bacterial hemophore HasA from Y. pestis. Our studies have shown that HSP2 binds to heme strongly, inhibits heme uptake, decreases mitochondrial heme levels, and diminishes OXPHOS and ATP generation in NSCLC cells (35). HSP2 also significantly suppresses subcutaneous and orthotopic NSCLC tumor xenografts in mice (35).
To better understand the mechanisms by which heme-targeting drugs suppress tumor growth and progression, we applied MSOT and OE-MSOT to monitor changes in tumor vasculature and oxygenation in live animals using subcutaneous tumor xenograft models. We found that both HSP2 and CycT can normalize tumor vasculature and increase tumor oxygenation. These results are confirmed by using immunohistochemistry (IHC) analyses of tumor tissues. Further, we showed that HSP2 and CycT exert the same effect on tumor vasculature and oxygenation in orthotopic tumor xenograft models. Our results show that heme-targeting drugs that inhibit OXPHOS and oxygen consumption not only cause reduced ATP generation but also alleviate tumor hypoxia and normalize tumor vasculature. Reduced ATP generation inhibits tumorigenic functions of cancer cells while normalized tumor vasculature and improved perfusion can potentiate the anti-tumor efficacy of the drugs. Thus, heme-targeting drugs including HSP2 and CycT can be very effective at suppressing tumor growth and progression and can have potent anti-angiogenic effects like anti-angiogenic drugs, such as bevacizumab.
MATERIALS AND METHODS
Reagents
Cyclopamine tartrate (>99% purity) was provided by Logan Natural Products. D-Luciferin and the Opal 4 color IHC kit were purchased from PerkinElmer (USA). Antibodies were purchased from Novus Biologicals and Abcam. Pimonidazole Hydrochloride was purchased from Hypoxyprobe, Inc. HSP2 was expressed with the pET11a expression system and purified as described (35). Specifically, HSP2 was purified with a Q-Sepharose Fast Flow column (GE Healthcare), followed by size exclusion chromatography, as described (38). Iron staining was carried out using Sigma-Aldrich Iron Stain kit (Cat# HT20).
Cell culture
NSCLC cell lines, H1299 (ATCC Cat# CRL-5803, RRID: CVCL_0060) and A549 (ATCC Cat# CCL-185, RRID:CVCL_0023) were purchased from ATCC, maintained in RPMI medium, and supplemented with 5% heat-inactivated FBS. Cell lines expressing luciferase were generated by infection with lentiviral particles bearing the EF1a-Luciferase (firefly) gene (AMSBIO) (35). Cell lines were authenticated by Genetica and were found to be 96% identical to the standard (authentication requires >80%). Cell lines were tested for mycoplasma using a MycoFluor™ Mycoplasma Detection Kit (Molecular Probes) and the results were negative. Hypoxic treatment was performed in an O2-CO2 incubator with controls for O2 and CO2 (NAPCO; Winchester, VA).
Measurement of Oxygen Consumption and ATP Levels
Oxygen consumption was measured, exactly as described previously (39). An Oxygraph system (Hansatech Instruments), with a Clark-type electrode placed at the bottom of the respiratory chamber was employed. To measure oxygen consumption rates and ATP levels from freshly isolated tumors, subcutaneous tumors were surgically resected from mice and cut into small pieces. Tumors were weighed and homogenized immediately using a mechanical homogenizer to gain a homogenous cell suspension. Tissue debris was removed by gentle centrifugation. Cells were suspended in 400 μl of complete medium and oxygen consumption rates (OCR) were measured using a Clark-type electrode. ATP levels were measured with an ATP determination kit (Molecular probes). Liver cells were isolated and used to measure ATP levels in the same manner. All experiments were carried out in triplicate, and the background luminescence was subtracted from the measurement. ATP concentrations were calculated from the ATP standard curve and normalized with the numbers of cells used. Both OCR and ATP levels were normalized with protein amounts.
Animals
NOD/SCID mice (IMSR Cat# CRL:394, RRID:IMSR_CRL:394) were purchased from Charles River Laboratories. Mice were bred and cared for in a University of Texas at Dallas specific pathogen-free animal facility in accordance with NIH guidelines. All animal procedures were conducted under protocols approved by Institutional Animal Care and Use Committee (IACUC) at the University of Texas at Dallas (UTD) and the University of Texas Southwestern Medical Center (UTSW). Animals were regularly examined for any signs of stress and euthanized according to preset criteria.
Treatment of human xenograft lung tumors in NOD/SCID mice
For subcutaneous tumor models, 2×10⁶ H1299-luc or 1×10⁶ A549-luc cells in serum-free medium containing 50% Matrigel were injected subcutaneously into the left flank region of 4-6-week-old female NOD/SCID mice. Mice were randomized into treatment groups (n ≥ 6 for every group) that received saline (control), HSP2 (25 mg/kg every 3 days, in about 50 μl in saline by retro orbital IV injection), and CycT (I.V 7.5 mg/kg every 3 days, by retro-orbital IV injection) respectively. Body masses were recorded once every week. Treatments were started only after tumors were palpable, to ensure effective implantation. When the tumors in the control group reached 1 cm3, mice were euthanized by cervical dislocation. Tumors were excised and weighed.
To generate mice with NSCLC tumors in the lungs, 0.75×10⁶ H1299-luc cells (passages 3-5) in serum-free medium containing 50% Matrigel were implanted directly in the lung. Mice were anesthetized with 2.5% isoflurane and oxygen mixture. H1299-luc cells were injected about 1.5 cm above the lower left rib line through the intercostal region, as described previously (35). Mice were then placed on a heating pad and observed until they revived from anesthesia. Mice were randomized into three groups (n ≥ 6 per group) that received vehicle (for control) or HSP2 (25 mg/kg, I.V., every 3 days) or CycT (7.5 mg/kg, I.V., every 3 days). Treatments were started post cell implantation when bioluminescence (BLI) signal from lung tumors reached above 5×10⁶ photon/sec. Body weights were recorded once every week. Treatments were stopped, and mice were sacrificed after the untreated mice with tumors appeared moribund. For detecting the toxicity of HSP2 or CycT treatment on blood and liver functions, blood was obtained from these mice via the sub-mandibular vein before sacrifice and was collected in blood collection tubes (BD microtainer tubes Cat# 365963 and Cat# 365974 from Fischer scientific). Serum samples were prepared and then used for determining ALT levels (alanine transaminase levels) with an ALT activity assay kit from Sigma-Aldrich (MAK052-1KT). Whole blood samples were used for determining hemoglobin levels with a hemoglobin assay kit from Sigma – Aldrich (Cat# MAK115-1KT) and counting red blood cells (RBCs) using a hemocytometer. No morphological differences were observed in red cells from treated and untreated mice.
In vivo bioluminescence imaging (BLI)
Mice bearing lung tumor xenografts were imaged with an IVIS Lumina III (UTD) and IVIS Spectrum (UTSW) In Vivo Imaging System (Perkin Elmer). Briefly, mice were anesthetized in the isoflurane chamber (2% isoflurane and oxygen), and luciferin (potassium salt; Perkin Elmer; 80 μl of 40 mg/ml) was administered subcutaneously between the scapulae. A BLI time course was acquired over 30 mins (Exposure time: auto, F Stop: 1.2, Binning: medium). The images were quantified using Living Image software version 4.5.2 (Perkin Elmer). Regions of interest (ROIs) were selected, and bioluminescence signals integrated. The total bioluminescent signals (photon/sec) from ROIs of mice were calculated as specified by the manufacturer’s instructions.
Multispectral Optoacoustic Tomography (MSOT)
NOD/SCID mice implanted with subcutaneous H1299-Luc or A549-Luc xenografts and treated with HSP2 or CycT or control saline for 3 weeks were placed under anesthesia via inhalation of 2% isoflurane and air. BLI and MSOT were performed sequentially at the same time points. For every experiment, 6-10 mice were used for each treatment condition and monitored with caliper and BLI. Due to the limit on our MSOT capability, 3-5 mice were generally used for imaging for each treatment condition in every cohort. Data on a mouse were excluded if the mouse died during the procedure, before the MSOT procedure was finished and data collection was completed. Tumor sizes were calculated by using caliper measurements [V = (W2 × L)/2] and MSOT measurements [V = (4/3) × π × (L/2) × (L/2) × (D/2)]. The data shown for H1299 tumors were from two cohorts (mid-point and end-point). For tumor sizes, see Fig.S1A.
For MSOT, the animals were transferred from the induction chamber to the animal holder. A thin layer of ultrasound gel (Aquasonic Clear, Parker Labs) was applied around the tumor region to provide optical and acoustic coupling to the polyethylene membrane. In order to examine oxyhemoglobin and deoxyhemoglobin, mouse images were acquired in transaxial sections through the tumor region using seven wavelengths - 680, 715, 730, 768, 800, 850 and 900 nm with an MSOT InVision 256-TF device (iThera Medical, Munich, Germany). Briefly, a tunable optical parametric oscillator (OPO) pumped by an Nd:YAG laser provides excitation pulses with a duration of 9 ns at wavelengths from 680 nm to 980 nm at a repetition rate of 10 Hz with a wavelength tuning speed of 10 ms and a peak pulse energy of 90 mJ at 720 nm. Seven arms of a fiber bundle provide uniform illumination of a ring-shaped light strip of approximately 8mm width. For ultrasound detection, 256 toroidally focused ultrasound transducers with a center frequency of 5 MHz (60% bandwidth), organized in a concave array of 270 degree angular coverage and a radius of curvature of 4 cm, are used. A model-based reconstruction was used prior to multispectral processing. Twenty frames per wavelength were acquired and averaged. The animal was placed in the imaging chamber (34°C) for ten minutes to reach thermal equilibrium before imaging. Initially, the tumor region was imaged while breathing air. After a period of two minutes, we imaged the one slice of the tumor region with the biggest diameter while the inspired gas was changed to 100% oxygen. A single slice approximately in the middle of the tumor with the largest cross-section was imaged continuously during the dynamic gas challenge where the inspired air was changed from air to 100% oxygen. To allow the animal to reach equilibrium with the new gas, the animal remained in the imaging chamber for five minutes without imaging. After five minutes, the tumor region was imaged again using the same parameters.
Image reconstruction and data analysis were carried out with viewMSOT (Version 3.6 iThera Medical, GmbH, Munich, Germany), which is a software covering the full imaging chain: from data acquisition to image reconstruction, spectral unmixing, visualization and quantification. Images were reconstructed with a pixel size of 75 μm * 75 μm. We performed the analysis of the sO2 map with MATLAB 2016b (Math-works) using custom software and visualized the images with ImageJ (Release 1.52a, National Institutes Health, USA). ROIs were drawn around the entire tumor region from the largest cross-section in the middle of the tumor and a healthy, well-vascularized tissue region around the spine. No fluence correction was applied, although this could affect the apparent signal differences between tumors of different sizes. Percentage of hemoglobin saturation (%sO2) was calculated as %sO2 = [HbO2/ (HbO2+Hb)] *100. Pixels with a negative value for either deoxyhemoglobin or oxyhemoglobin were assigned a NaN value and discarded. Black patches represent areas lacking a detectable blood concentration. Average sO2MSOT was calculated in each pixel of ROIs for air and oxygen breathing periods and are presented as sO2MSOT (Air) and sO2MSOT (O2), respectively. The amplitude of response to the oxygen gas challenge ΔsO2MSOT = sO2MSOT (O2) - sO2MSOT (Air) was calculated for each pixel.
Hematoxylin and Eosin (H&E) staining
Following the final imaging, mice were sacrificed. Lung tumors were excised, and tumor tissues were prepared for histology. Paraffin embedding was performed at the JAR Molecular Pathology Core of UTSW Medical Center. The paraffin blocks were sectioned to obtain 5 μm sections, which were utilized for Hematoxylin and Eosin staining. For H&E staining, tumor tissues were fixed in 4% formaldehyde, embedded in paraffin and sectioned (5 μm). Then, sections were stained with H&E. Slides were scanned at 40X resolution with an Olympus VS120 slide scanner and quantified using Cell Sens software from Olympus.
Immunohistochemistry (IHC) and immunofluorescence staining
IHC and data analysis were carried out exactly as described (22, 35). The dilutions of primary antibodies were 1:200 for HIF1α (Novus biologicals Cat# NB100-449, RRID: AB_10001045), 1:200 for CA9 (Novus biologicals Cat# NB100-417, RRID:AB_10003398), 1:35 VEGFA (Abcam Cat# 9570, RRID:AB_308723), 1:50 for VEGFR1 (Abcam Cat# ab2350, RRID:AB_303000), 1:100 for Pimonidazole (Hypoxyprobe Cat# HPIXXX MAb1, RRID:AB_2811309), 1:200 Cleaved Caspase 3 (Cell Signaling Technology Cat# 9661, RRID:AB_2341188), 1:200 MKI67(Abcam Cat# ab16667, RRID:AB_302459) 2 μg/ml VDAC1 (Abcam Cat# ab14734, RRID:AB_443084),1:500 TOMM20 (Novus Cat# NBP1-81556, RRID:AB_11003249),and 1:200 TFRC (Novus Cat# NB100-92243, RRID;AB_1216384). Results from all antibodies were repeated at least twice. Microvessel density was calculated based on CD34-positive objects as described previously (40). Specifically, number of vessels in an ROI were counted using the “Object count” feature of the cellSens dimension software. Object counts from 10 ROIs were averaged for each tumor xenograft. At least 3 sets of tumor xenografts per treatment were quantified, and the averages were calculated and plotted.
For immunofluorescence staining of NSCLC cells, cells were fixed using 4% formaldehyde, washed with 2mg/ml BSA, blocked and permeabilized with 0.2% triton X-100 in 2mg/ml BSA, incubated with 1:500 diluted HIF1α overnight at 4°C, washed with 2mg/ml BSA in PBS, incubated with Goat anti-rabbit secondary antibody (Molecular Probes Cat# A-11072, RRID:AB_142057) for 1 hour at RT, washed, then stained with DAPI, and mounted using Vectashield. Images were acquired using Biotek Cytation 5 plate reader (40X objective) and quantified using ImageJ (NIH).
Statistical analyses of data
Data from different treatment groups of cells, mice, and tissues were compared, and statistical analysis was performed with a Welch 2-sample t-test. For calculating correlation coefficients, we used the Pearson formula for calculating correlation coefficient r and p-value.
RESULTS
Heme-targeting drugs, HSP2 and CycT, inhibit oxygen consumption and ATP generation and effectively suppress the growth of human tumor xenografts in mice
Our previous studies showed that HSP2 inhibits heme uptake in NSCLC cells while CycT inhibits heme synthesis and degradation, as well as OXPHOS directly (35, 36). Both can suppress tumor growth in mice. Here, we directly compared the effects of HSP2 and CycT using subcutaneously implanted human tumor xenografts in NOD/SCID mice (Fig. 1 & S1). We tested both drugs in the representative human NSCLC cell line H1299 (with mutations in Nras and p53). Detection of tumor growth and progression with BLI showed that both CycT and HSP2 significantly suppressed the growth and progression of subcutaneous human NSCLC xenograft tumors (Fig. 1A). The effects of drug treatments were confirmed by the sizes and masses of the excised tumors (Fig. 1B & C). The weights of treated and untreated mice were similar throughout the treatment period (Fig. 1D). The measurements of oxygen consumption rates (OCR) (Fig. 1E) and ATP levels (Fig. 1F) showed that both HSP2 and CycT substantially reduced OCR and ATP generation in NSCLC tumors. To verify the effects of HSP2, we used a second human NSCLC cell line A549 (with mutations in Kras and LKB1) (Fig. S1). HSP2 exerted the same effects on tumor growth, OCRs, and ATP levels in A549 tumors (Fig. S1B–F) as in H1299 tumors (Fig. 1A–F). The lowered oxygen consumption and ATP generation caused by lowered heme availability may contribute in part to the suppression of tumor growth by CycT and HSP2. Lowered ATP levels likely lead to the suppression of tumor cell proliferation, indicated by the reduced levels of Ki67 proliferation marker (Fig. 1G), as well as the induction of apoptosis (Fig. 1H). Additionally, HSP2 did not significantly affect red cell counts (Fig. S2A) and hemoglobin levels (Fig. S2B) in the blood, or liver function shown by alanine transaminase (ALT) activity (Fig. S2C) and liver cell ATP levels (Fig. S2D). While CycT and HSP2 clearly diminish OXPHOS and ATP generation, as shown in Fig. 1 and previous studies (35, 36), they did not affect mitochondrial markers such as TOMM20 (Fig. S3A) and VDAC1 (Fig. S3B). This is not surprising, as metformin, a well-studied anti-cancer agent and inhibitor of OXPHOS, does not reduce mitochondrial mass markers in cancer or non-cancer cells (41, 42).
Fig. 1.
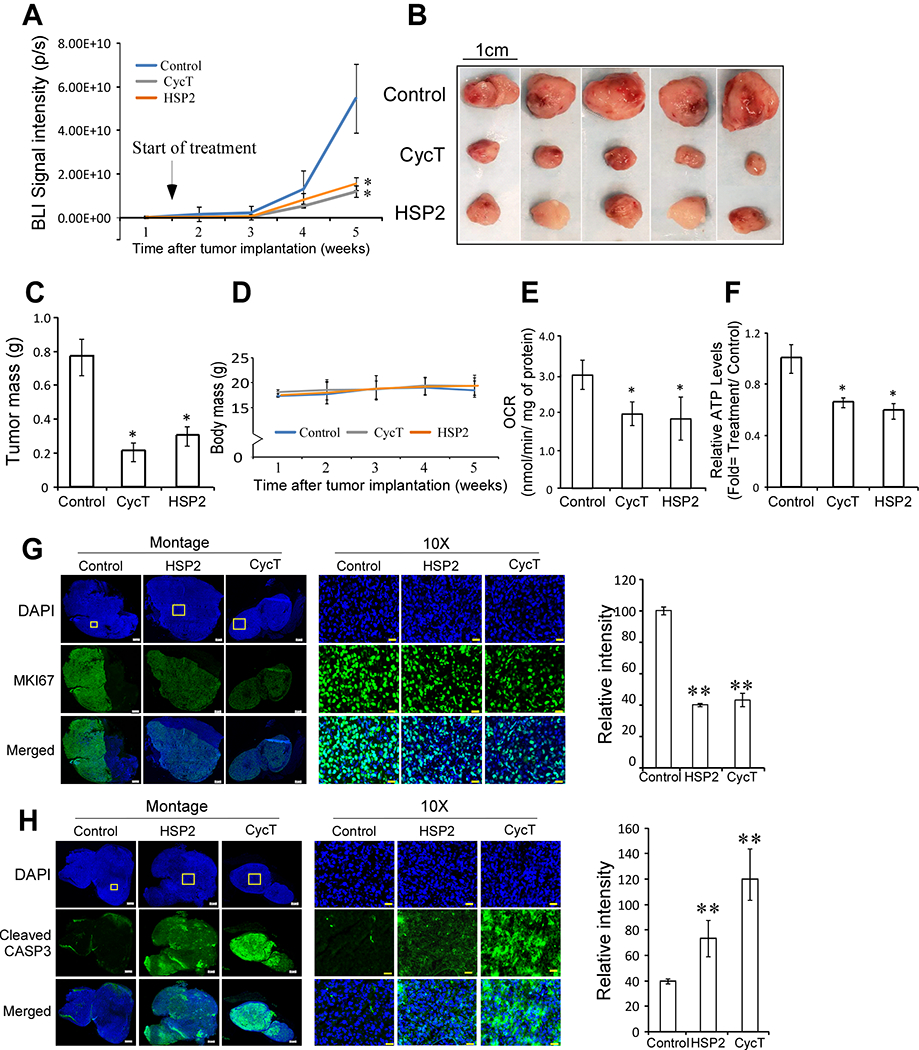
HSP2 and cyclopamine tartrate (CycT) effectively suppress the growth, oxygen consumption rates, and ATP generation in subcutaneous NSCLC H1299-luc tumor xenografts in NOD SCID mice. (A) Quantitative bioluminescence signals represent tumor volumes from mice (n=5/group) treated with saline (control), HSP2 (25 mg/kg I.V every 3 days), or CycT (7.5 mg/kg, I.V. every 3 days). Treatment started 1.5 weeks after tumor implantation when BLI signals were detected and tumors were visible. Mice were sacrificed when tumors in untreated mice reached about 1 cm3. (B) Photos showing excised tumors from mice in A. (C) Average weights for control and treated tumors from A. (D) Average body weights of control and treated mice bearing tumors shown in A-C. (E) Oxygen consumption rates (OCRs) measured in cells from control and treated tumors. (F) ATP levels measured in cells from control and treated tumors. (G) Representative IHC images of H1299 NSCLC tumor tissue sections and graphs showing the levels of the proliferation marker Ki67 in control, HSP2, and CycT-treated tumors. (H) Representative IHC images of H1299 NSCLC tumor tissue sections and graphs showing the levels of the apoptosis marker, cleaved CASP3, in control, HSP2, and CycT-treated tumors. Data are plotted as mean ± SEM. For statistical analysis, the levels in treated tumors were compared to the levels in control tumors with a Welch 2-sample t-test. *, P < 0.05.
MSOT and OE-MSOT imaging data show that both HSP2 and CycT normalize tumor vasculature and improve tumor vascular oxygenation
To better understand the mechanisms by which the heme-targeting drugs suppress tumor growth and progression, we employed MSOT to image the TME. Fig. 2A shows the spatial distribution of baseline deoxyhemoglobin (Hb; blue), oxyhemoglobin (HbO2; red), and total hemoglobin (THb). Quantitative data show that THb levels were decreased by HSP2 or CycT treatment in a statistically significant manner (Fig. 2B). The difference was bigger in HSP2-treated tumors. The calculated oxygen saturation level sO2 was significantly increased in HSP2-treated tumors, but not in CycT-treated tumors. The decreased THb levels and increased sO2 levels indicate vascular regression or normalization, as observed previously in ovarian and breast tumor models following anti-angiogenic therapies (43, 44). Although the differences caused by the drugs in THb levels were small (Fig. 2B), the bigger change in THb levels caused by HSP2 corresponded with a significant increase in sO2, while the smaller change in THb caused by CycT did not coincide with a significant increase in sO2 (Fig. 2C & D).
Fig. 2.
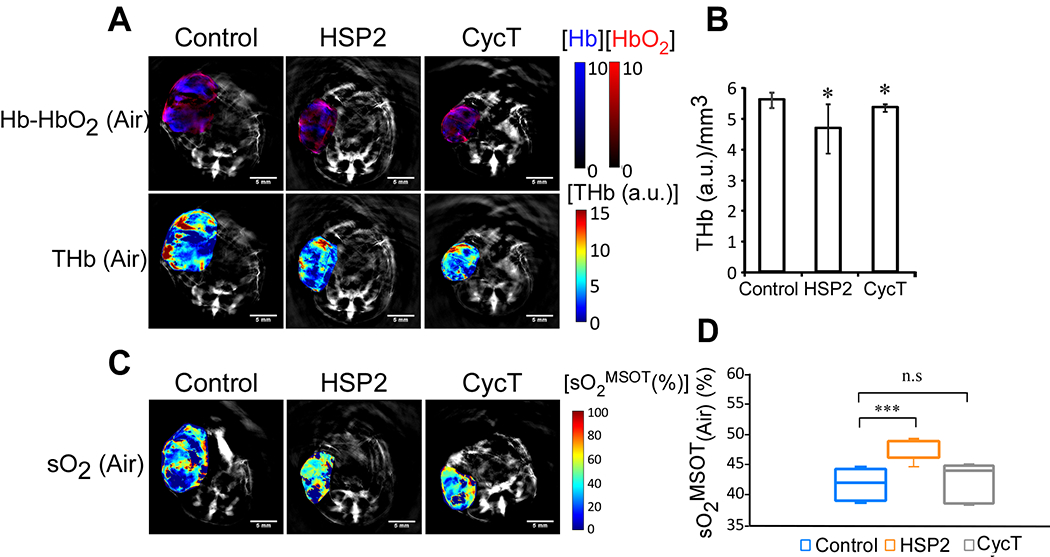
MSOT shows that total hemoglobin levels are reduced in tumors treated with HSP2 or CycT compared to control tumors. Mice were treated with HSP2, CycT, or control saline for 3 weeks prior to imaging. (A) The spatial distribution of baseline deoxyhemoglobin (Hb; blue), oxyhemoglobin (HbO2; red), and total hemoglobin (THb). Maps were constructed using back-projection and spectral-unmixing overlaid on the grayscale image of the corresponding animals in each treatment group (control, HSP2 and CycT). (B) Total hemoglobin levels in tumors treated with HSP2 or CycT compared to control tumors normalized by tumor volume. (C) Representative tumor images of spatial distribution of baseline oxygen saturation in air. (D) Quantification of sO2 in air for each treatment group. Tumor sizes (end-point tumors) are listed in Fig. S1A. Specifically, the sizes of the three shown tumors were as follows: Control: 259 mm3, HSP2: 127 mm3, CycT: 102 mm3. The average sO2 is determined by [HbO2/(Hb+HbO2)] *100 for both air and 100% oxygen breathing conditions. For statistical analysis, the levels in treated tumors were compared to the levels in control tumors with a Welch 2-sample t-test. *, P < 0.05. ***, P < 0.001. n.s., not significant.
OE-MSOT has been shown to be more robust and reproducible in detecting tumor vasculature and oxygenation than static MSOT measurements (28, 29). Thus, we carried out OE-MSOT measurements to further elucidate the mechanism of drug action. Fig. 3 shows that after the 100% oxygen challenge, sO2MSOT levels were significantly increased in HSP2- or CycT-treated (for 3 weeks) tumors compared to control tumors (Fig. 3A & B). Furthermore, the amplitude of ΔsO2 MSOT response to oxygen was significantly increased in HSP2- and CycT-treated tumors compared to untreated tumors (Fig. 3A & C). The same increase in ΔsO2 was observed when we analyzed control and treated tumors whose sizes were similar (see Supplemental Fig. S4A–C). MSOT images were matched with H&E and hypoxia marker pimonidazole staining images (see Fig. 3A). Although it is difficult to match MSOT images with IHC images precisely, the comparison of sO2MSOT maps in Fig. 3A and IHC images in Fig. 3D reveals a pattern of overlapping hypoxic areas detected by MSOT and areas detected by pimonidazole labeling. The quantification of pimonidazole indicated decreased hypoxia in HSP2- and CycT-treated tumor tissues (Fig. 3D & E), consistent with the MSOT data indicating increased oxygenation (Fig. 3A–C). The decrease in hypoxic areas also accompanied a decrease in necrotic areas (See Fig. 3F & G).
Fig. 3.
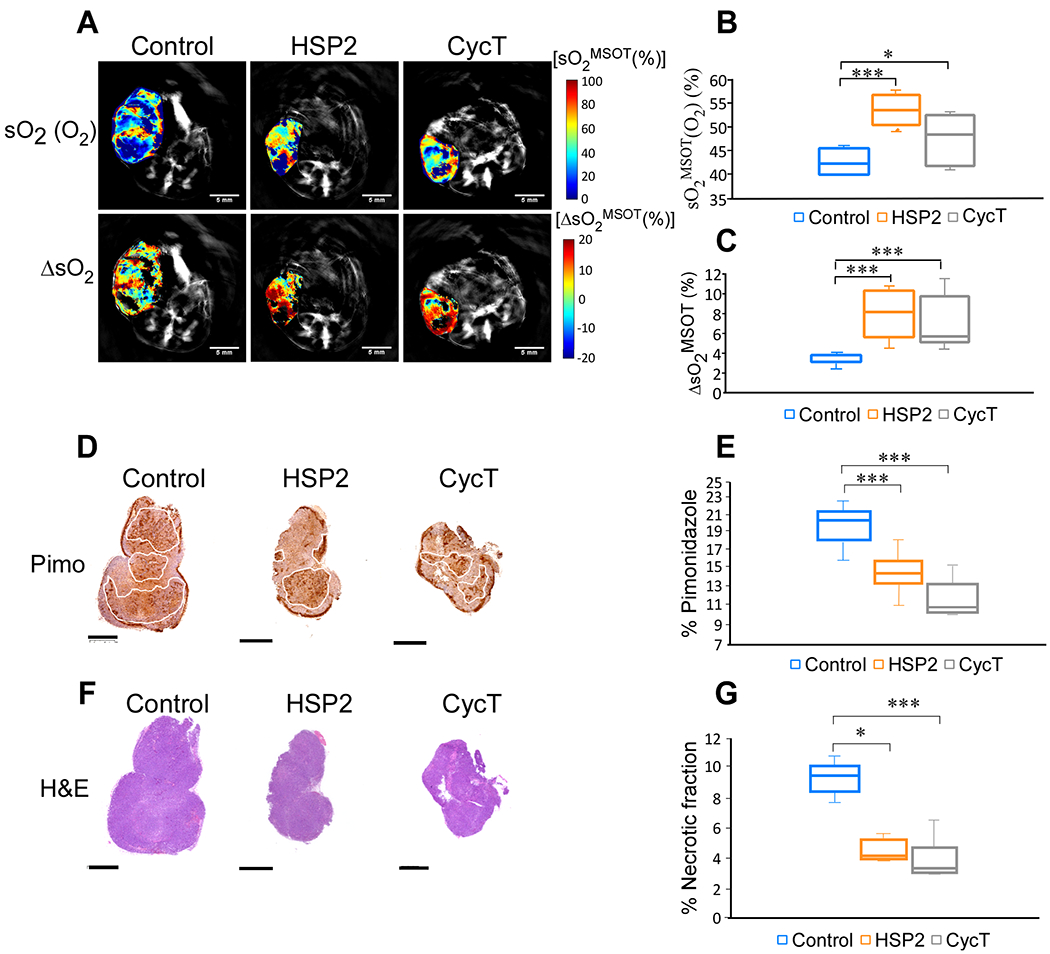
OE-MSOT shows that treatment with HSP2 or CycT significantly increases the amplitude of response to 100% oxygen gas. (A) Representative tumor images of spatial distribution of oxygen saturation [sO2 (O2)] after the oxygen challenge and the amplitude of signal change (ΔsO2) for each treatment group from breathing air to breathing 100% oxygen. The change in sO2 (ΔsO2) is calculated by subtracting the average tumor sO2 while breathing air from the average tumor sO2 while breathing oxygen. (B & C) Quantification of sO2 (O2) and ΔsO2 for each treatment group. (D) IHC shows a decrease in pimonidazole labeling in HSP2 and CycT-treated tumors relative to control tumors, correlating with a detected increase in oxygen saturation shown in A-C. (E) Quantification of pimonidazole coverage in tumor for each group. (F) H&E images of tumors shown in Fig. 2 and in 3A. (G) Quantification of necrosis patch in tumor for each group. One set of H&E images are shown here. For statistical analysis, the levels in treated tumors were compared to the levels in control tumors with a Welch 2-sample t-test. *, P < 0.05. ***, P < 0.001. Box is between 25th and 75th percentile, line at median.
When tumors were analyzed after 1.5 weeks of treatment, HSP2 caused a significant decrease in tumor mass (Supplemental Fig. S5A & B) but did not cause a significant increase in oxygenation (Supplemental Fig. S5C–F). Sustained treatment is likely needed to cause a permanent change in tumor oxygenation and vasculature, because HSP2, as well as CycT, do not directly influence vasculature, but indirectly by reducing ATP generation. Interestingly, the comparison of sO2 and ΔsO2 levels between mid-point tumors and end-point tumors revealed the following insights: (1) As tumors grew, sO2 levels decreased in both control and HSP2-treated tumors, indicating the effect of tumor sizes on oxygen saturation (see Fig. S5C–F). However, the decrease in HSP2-treated tumors were much less than that in control tumors (see Fig. S5D & F), indicating the effect of HSP2 treatment on oxygen saturation. (2) Similarly, as tumors grew, ΔsO2 levels decreased significantly in control tumors but not in HSP2-treated tumors (Fig. S5G & H), indicating that HSP2 treatment had overcome the effect of tumor growth on oxygen saturation and vasculature function. (3) When the tumor sizes of end-point HSP2-treated tumors were compared to those of mid-point control tumors, the end-point HSP2-treated tumors were substantially larger than mid-point control tumors (see the list of tumor sizes in Fig. S1A). sO2 levels in end-point HSP2-treated tumors, compared to mid-point control tumors, were somewhat lower, likely due to larger tumor sizes (Fig. S5D & F). Notably, there was a statistically significant increase in ΔsO2 levels in end-point HSP2-treated tumors, compared to mid-point control tumors, despite the larger sizes of HSP2-treated tumors, indicating a positive effect of HSP2 on tumor vascular function (Fig. S5H).
Correlation analysis of tumor sizes and MSOT parameters of end-point tumors (Fig. S6) reinforce the idea that the observed changes in oxygenation in HSP2-treated tumors were not caused by the difference in tumor sizes in control and treated tumors. Data in Fig. S6A–D showed that there was no statistically significant correlation between tumor sizes and sO2 and ΔsO2 levels among the tumors. By logical reasoning, tumor sizes should influence oxygenation, as reflected in our data shown in Fig. S5C–H for control tumors. However, the comparison of mid-point and end-point HSP2-treated, and control tumors clearly showed that treatment with HSP2 was a much more influential factor on oxygenation, particularly ΔsO2 levels, compared to tumor sizes. It is also worth noting that the smaller sizes of HSP2-treated tumors, compared to control tumors (Fig. S5B), did not cause an improvement in sO2 and ΔsO2 levels (Figs. S5C–H). Interestingly, for HSP2-treated tumors, the increase in tumor sizes from mid-point to end-point did not cause significant changes in ΔsO2 levels (Fig. S5H), indicating that HSP2 normalized tumor vascular function despite tumor growth.
To further support the results from studies of H1299 tumors, we showed that HSP2 treatment caused a significant increase in sO2 and ΔsO2 levels in A549 tumors (Supplemental Fig. S7A–C). The kinetic curves of response to oxygen challenge in treated and control tumors also indicated improved vascular function in HSP2- or CycT-treated tumors (Fig. 4). As expected, the vasculature in the spine of treated and control mice would be functionally similar. Indeed, the sO2MSOT curves and slopes are very similar in treated and untreated mice (Fig. 4A & C). In contrast, the sO2MSOT dynamic trends in HSP2- or CycT-treated tumors were significantly different from untreated control tumors (Fig. 4B & C). In control tumors the sO2 levels changed very little in response to oxygen challenge, suggesting poor vascular function and perfusion. The sO2 levels changed strongly in response to oxygen challenge in HSP2- or CycT-treated tumors, suggesting improved vascular function and perfusion. Together, our MSOT results strongly suggest that treatment of lung tumors with HSP2 and CycT normalizes tumor vasculature and increases tumor perfusion and oxygenation.
Fig. 4.
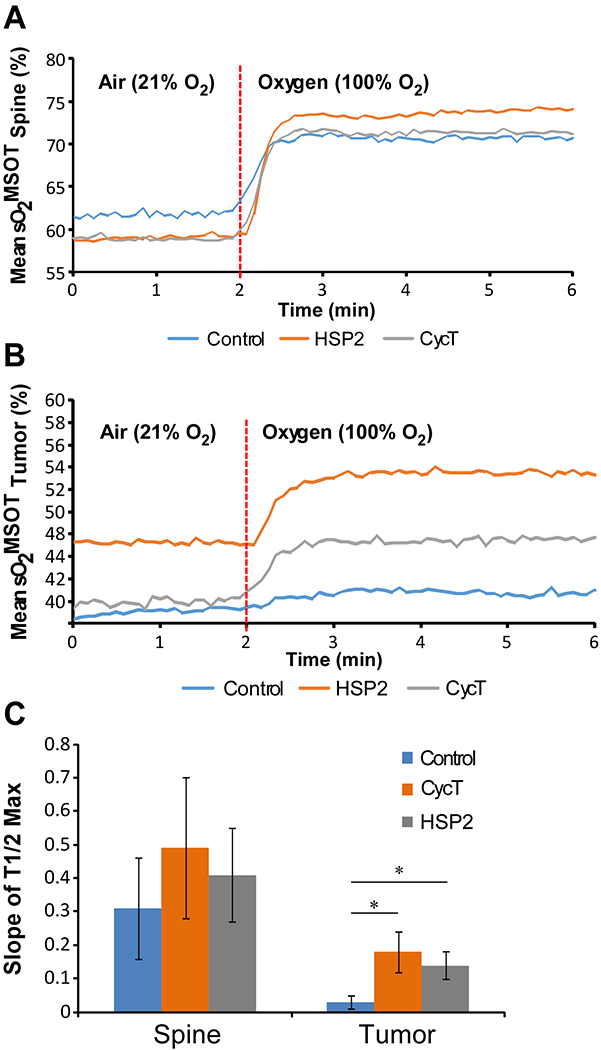
Temporal evolution of the oxygen enhanced optoacoustic tomography (OE-OT) signal. (A) The kinetic curve of sO2 values averaged taken from healthy tissue (spine ROIs) to a 100% oxygen gas challenge from each treatment group. (B) The kinetic curve of sO2 values averaged taken from tumor xenograft ROIs to an oxygen gas challenge from each treatment group. (C) Slopes of the kinetic curves of sO2 values calculated from A and B. For statistical analysis, the levels in treated tumors were compared to the levels in control tumors with a Welch 2-sample t-test. *, P < 0.05.
Immunohistochemistry (IHC) data show that HSP2 and CycT alleviate tumor hypoxia and suppress angiogenic functions
To confirm the results from OE-MSOT, we carried out IHC to detect the levels of various hypoxia markers in treated and untreated tumor tissues. We used endogenous hypoxia marker Carbonic Anhydrase 9 (CA9) and exogenous hypoxia marker pimonidazole (29, 45, 46). HSP2 caused a significant reduction in both pimonidazole labeling and CA9 levels while CycT caused a significant reduction in only pimonidazole labeling (Fig. 5A & B). Pimonidazole labeling reflects the hypoxia status at the time of the binding while CA9 levels reflect the long-term effect of hypoxia. Thus, the data suggest that HSP2 acts to alleviate tumor hypoxia more quickly than CycT. Consistent with this reasoning, HSP2 caused a more severe reduction in the levels of hypoxia inducible factor HIF1α than CycT, although both reductions are significant (Fig. 5C).
Fig. 5.
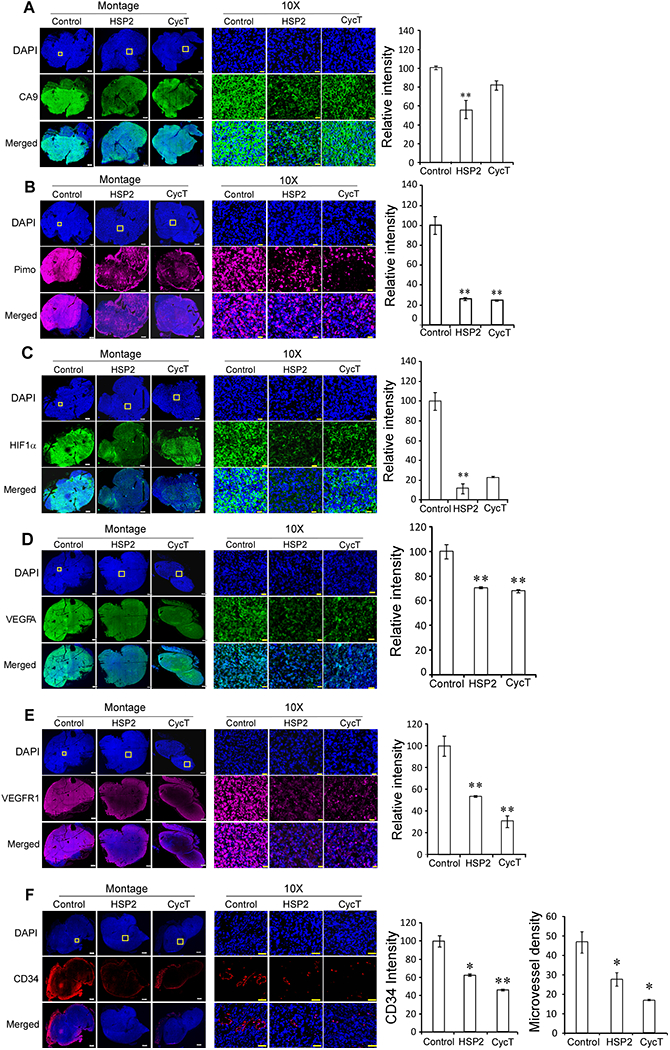
HSP2 and CycT treatment effectively alleviates hypoxia and normalizes vasculature in subcutaneous H1299 NSCLC tumor xenografts. (A) Representative IHC images of H1299 NSCLC tumor tissue sections and graphs showing the levels of CA9 in control, HSP2, and CycT-treated tumors. (B) Representative IHC images of H1299 tumor tissue sections and graphs showing the levels of pimonidazole labeling in control, HSP2, and CycT-treated tumors. (C) Representative IHC images of H1299 tumor tissue sections and graphs showing the levels of HIF1α in control, HSP2, and CycT-treated tumors. (D) Representative IHC images of H1299 tumor tissue sections and graphs showing the levels of VEGFA in control, HSP2, and CycT-treated tumors. (E) Representative IHC images of H1299 tumor tissue sections and graphs showing the levels of VEGFR1 in control, HSP2, and CycT-treated tumors. (F) Representative IHC images of H1299 tumor tissue sections and graphs showing the levels of CD34 and vascular density in control, HSP2, and CycT-treated tumors. Shown are montages and 10X images of control, HSP2, CycT-treated tumor tissue sections stained with DAPI (Row 1) or antibodies against the indicated protein (Row 2) or merged images of DAPI and the indicated protein (Row 3). The white rectangles in DAPI images denote the regions shown in 10X images. Scale bar: montage, 1 mm (for control tumor sections) and 500 μm (for HSP2 and CycT treated tumor sections); 10X, 20 μm. Protein levels were quantified, and data are plotted as mean ± SEM. The values shown in the graphs are averages of signals quantified from three independent IHC experiments. For statistical analysis, the levels in treated tumors were compared to the levels in control tumors with a Welch 2-sample t-test. P * <0.05, ** < 0.005.
To gain insights into the molecular mechanisms by which HSP2 and CycT normalize tumor vasculature and alleviate hypoxia, we detected the levels of the angiogenic factor VEGFA and its receptor VEGFR1 in tumor tissues. Interestingly, the levels of both VEGFA (Fig. 5D) and VEGFR1 (Fig. 5E) were significantly reduced by HSP2 and CycT treatment. Consistent with the result from VEGFA, the detection of CD34 levels showed that HSP2 and CycT caused significant decreases in CD34 levels and microvessel density (Fig. 5F). These results strongly suggest that both HSP2 and CycT possess anti-angiogenic properties and can normalize vasculature.
HSP2 and CycT alleviate tumor hypoxia and suppress angiogenic factors in orthotopic NSCLC xenograft tumor models
To extend the biological implications of our studies, we further examined the effects of HSP2 and CycT on orthotopic lung tumor models (Fig. 6). Detection of tumor growth and progression with BLI showed that HSP2 and CycT significantly suppressed lung tumor growth and progression (Fig. 6A & B). HSP2 and CycT did not cause a significant effect on mouse body masses (Fig. 6C). Histological analysis with H&E staining confirmed that HSP2 and CycT suppressed lung tumor progression (Fig. 6D).
Fig. 6.
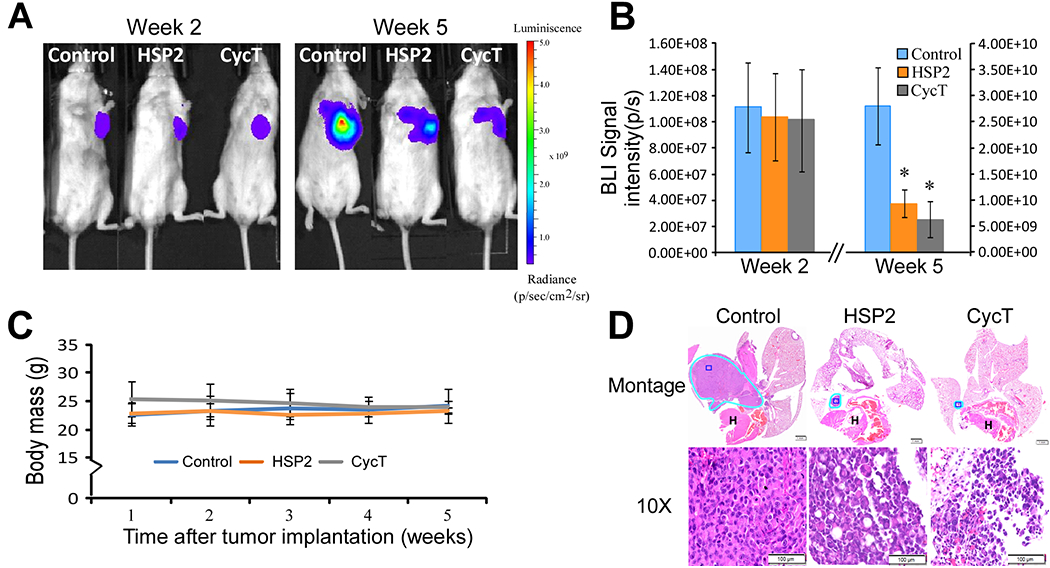
HSP2 and CycT suppress the growth of NSCLC orthotopic tumor xenografts. (A) Representative bioluminescence images of mice bearing orthotopic H1299 tumor xenografts treated with saline (control), HSP2, or cyclopamine tartrate (CycT). Treatment started at 2.5 weeks after tumor cell implantation when BLI signals (>5×10⁷photons/second) were detected from tumors of all tested mice. Treatments were stopped, and mice were sacrificed after the untreated mice with tumors appeared moribund. (B) The quantified luminescence signals representing tumor volumes (n = 6/group). Data are plotted as mean ± standard deviation. For statistical analysis, the levels in treated tumors were compared to the levels in untreated tumors with a Welch 2-sample t-test. *, P < 0.05; **, P < 0.005. (C) The body masses of mice under each treatment condition. (D) Representative H&E images of control tumors and tumors treated with HSP2 or CycT. Tumors are marked with light blue outlines. Montage (scale bar: 1 mm) and 10X (scale bar: 100 μm images of the H&E sections are shown. The dark blue rectangles in Montage denote the regions shown in 10X.
We also examined the effects of HSP2 and CycT on tumor hypoxia and angiogenic factors in orthotopically implanted tumor tissues using IHC. Both HSP2 and CycT caused a significant reduction in both pimonidazole labeling and CA9 levels (Fig. 7A & B). Likewise, the levels of hypoxia inducible factor HIF1α were strongly reduced by HSP2 or CycT treatment (Fig. 7C). These results demonstrated that both HSP2 and CycT can effectively alleviate tumor hypoxia in orthotopically implanted NSCLC tumors. We also detected the levels of the angiogenic factor VEGFA and its receptor VEGFR1 in orthotopically implanted NSCLC H1299 tumor tissues. Corresponding to subcutaneously implanted tumors, we found that the levels of both VEGFA and VEGFR1 were significantly reduced by HSP2 and CycT treatment in orthotopically implanted tumors (Fig. 7D & E vs. Fig. 5D & E). These results in Fig. 5 & 7 show that HSP2 and CycT exert the same effects on tumor vasculature and oxygenation in both subcutaneously and orthotopically implanted NSCLC tumors.
Fig. 7.
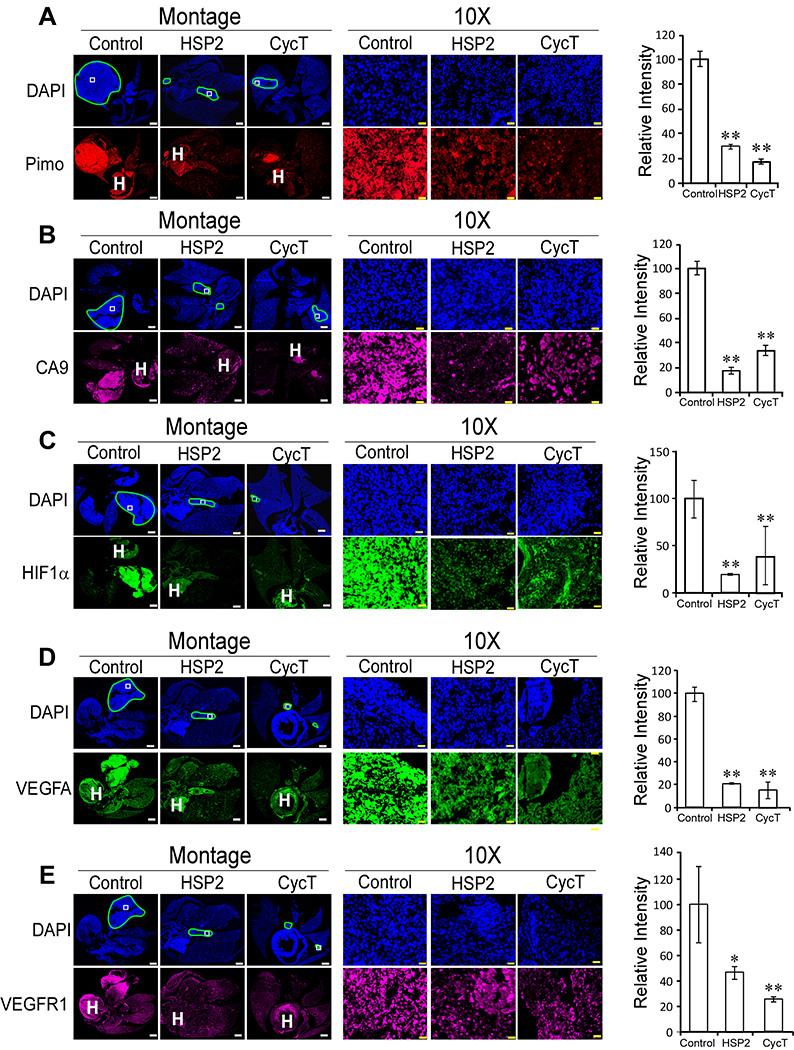
HSP2 and CycT treatment effectively alleviates hypoxia and normalizes vasculature in orthotopic lung tumor xenografts. (A) Representative IHC images of H1299 tumor tissue sections and graphs showing the levels of pimonidazole in control, HSP2, and CycT-treated tumors. (B) Representative IHC images of H1299 tumor tissue sections and graphs showing the levels of CA9 in control, HSP2, and CycT-treated tumors. (C) Representative IHC images of H1299 tumor tissue sections and graphs showing the levels of HIF1α in control, HSP2, and CycT-treated tumors. (D) Representative IHC images of H1299 tumor tissue sections and graphs showing the levels of VEGFA in control, HSP2, and CycT-treated tumors. (E) Representative IHC images of H1299 tumor tissue sections and graphs showing the levels of VEGFR1 in control, HSP2, and CycT-treated tumors. Shown are montages and 10X images of control, HSP2 and CycT-treated tumor tissue sections stained with DAPI or antibodies against the indicated protein. The light blue lines in DAPI images outline the tumors in the lung. The white rectangles in DAPI images denote the regions shown in 10X images. The heart was often stained and is marked with “H”. Scale bar: montage, 1 mm; 10X, 20 μm. Protein levels were quantified, and data are plotted as mean ± SEM. The values shown in the graphs are averages of signals quantified from three independent IHC experiments. For statistical analysis, the levels in treated tumors were compared to the levels in control tumors with a Welch 2-sample t-test. P * <0.05, ** < 0.005.
DISCUSSION
MSOT is a powerful technology for noninvasive monitoring of TME. It detects oxy- and deoxy-hemoglobin (Hb and HbO2), as well as blood oxygen saturation (sO2). THb levels are generally higher in tumors than normal tissue, due to increased angiogenesis (23–25). A previous study detected a decrease in THb levels and a corresponding increase in HbO2 following treatment with the anti-angiogenic trebananib in ovarian mouse tumor models (43). Another study also detected a decrease in THb levels and Hb levels following treatment with the anti-angiogenic drug bevacizumab in breast cancer mouse tumor models (44). Lower sO2 values are generally detected in tumors compared to normal tissues (23–27). A recent study showed that sO2 values correlate with vascular maturity in mouse breast cancer models (20). Here, using MSOT, we detected a significant decrease in THb levels following treatment with HSP2 or CycT in NSCLC tumor xenografts (Fig. 2A & B). A corresponding significant increase in sO2 levels was also detected in HSP2-treated tumors (Fig. 2C & D). The decrease in sO2 levels in CycT-treated tumors was not significant. These results suggest that HSP2 exerts significant anti-angiogenic effects in NSCLC tumors.
OE-MSOT measurements including ΔsO2 have been shown to provide more robust and reproducible data than the static MSOT measurements (28, 29). Previous studies have shown that high ΔsO2 values represent well-perfused tumors while low ΔsO2 values represent poorly perfused tumors (28, 47). Thus, the significant and substantial increase in ΔsO2 values in both HSP2- and CycT-treated tumors relative to control tumors (Fig. 3) indicate that treatment with HSP2 or CycT strongly improved tumor perfusion. The kinetic data (Fig. 4) further supports this conclusion. Because time to maximum cannot be reliably measured in untreated control tumors (Fig. 4B), we calculated slopes of the sO2 kinetic curves in response to 100% oxygen challenges (Fig. 4C). The dramatic increases in slopes of the kinetic curves of HSP2- and CycT-treated tumors relative to control tumors are consistent with the ΔsO2 data in indicating dramatically improved vascular function and perfusion in treated tumors.
The results from MSOT studies are supported by IHC data. First, IHC with three different hypoxia markers showed that treatment with HSP2 or CycT alleviated tumor hypoxia in both subcutaneous (Fig. 5A–C) and orthotopic (Fig. 7A–C) H1299 NSCLC tumors. This was further confirmed for HSP2 in subcutaneous A549 tumors. Here subcutaneous and orthotopic tumors showed very similar vascular development, in contrast to previous studies where very different vascular development was observed in A549 tumors in rats (48, 49) and k-RAS induced tumors in mice (50, 51). Second, IHC with antibodies to VEGF and its receptor showed that HSP2 and CycT exhibited strong anti-angiogenic functions in both subcutaneous (Fig. 5D & E) and orthotopic (Fig. 7D & E) tumors, consistent with our conclusions from MSOT data. Third, IHC with antibodies to CD34 indicated that both HSP2 and CycT increased microvessel density in treated tumors (Fig. 5F), further supporting the MSOT results indicating improved vascular function in treated tumors.
Our MSOT imaging data providing real-time, dynamic information about tumor vasculature and oxygenation, along with validation by immunohistochemistry approaches, demonstrated that two heme-targeting agents, HSP2 and CycT, can effectively normalize tumor vasculature, alleviate tumor hypoxia, and suppress tumor growth and progression. Our results show that HSP2 and CycT can suppress tumor growth and progression via multiple mechanisms. First, heme is an essential prosthetic group or cofactor for OXPHOS complexes II, III, and IV (52). Thus, by inhibiting heme uptake (HSP2) or heme synthesis (CycT), HSP2 and CycT can inhibit ATP generation and suppress tumor growth in both subcutaneous and orthotopic xenograft tumor models, as shown in Fig. 1 & 6 for both HSP2 and CycT. Second, our data show that HSP2 and CycT can normalize tumor vasculature and alleviate hypoxia (Figs. 2–5 & 7). Interestingly, both HSP2 and CycT have anti-angiogenic functions. Data in Fig. 5D & E and Fig. 7D & E show that HSP2 and CycT suppress the levels of the angiogenic factor VEGFA and its receptor VEGFR1. Evidently, one effect of targeting heme is the same as the application of anti-angiogenic therapies, such as bevacizumab, which blocks the function of VEGF.
Reduced heme availability likely causes vascular normalization indirectly by inhibiting oxygen consumption, thereby alleviating tumor hypoxia and reducing the production of angiogenic factors. However, it is also possible that heme can directly influence vasculature by modulating the synthesis of angiogenic factors. Further studies are necessary to gain a full understanding of mechanism of heme action on vascular function. Nonetheless, tumor vascular normalization would cause improved drug delivery to tumor cells, thereby enhancing the anti-tumorigenic effects of HSP2 and CycT. This may cause a feed-forward effect on the anti-tumor efficacy of HSP2 and CycT. The effect may be further enhanced by combining heme-targeting drugs like HSP2 with other anti-cancer therapeutics to fully eradicate tumors.
The results from our studies also indicate that MSOT, and particularly OE-MSOT, can reliably detect oxygenation status noninvasively in tumors in live animals. Many cancers, including lung cancers, are connected with hundreds of oncogenic drivers and multiple environmental factors. Thus, the effectiveness of any treatment regimen cannot be readily predicted and assessed based only on genetic information. Importantly, tumor hypoxia and oxygenation are crucial factors in determining the outcome of cancer therapy. Our results show that MSOT can noninvasively monitor tumor hypoxia and vascular status and reveal the time course for combination therapy to effectively eradicate tumors. For example, human tumors may be treated with anti-angiogenic therapy, such as bevacizumab, or HSP2 or CycT shown here, to normalize vasculature. MSOT can be applied to detect if tumor hypoxia status has been improved. Once tumor hypoxia has been alleviated, then targeted therapy, chemotherapy, or radiotherapy can be applied to maximize the therapeutic effect. Thus, MSOT can potentially improve the ways by which anti-cancer therapies are administered, particularly in terms of optimized timing of sequential combinations and stratification of responsive versus unresponsive tumors, as also suggested by others recently (28, 29, 53). The use of mouse models should allow the development of a platform for applying MSOT to optimize treatment regimens involving combination therapy. Such mouse studies should provide timely improvement for clinical practice in the management of cancer.
Our results reinforce previous studies indicating that OE-MSOT provides a reliable biomarker for tumor vascular function (28, 29). Particularly, the comparison of mid-point and end-point tumors illustrates that OE-MSOT can be a very valuable tool in monitoring tumor progression and therapeutic effects in preclinical and potentially clinical settings. Data in Fig. S5 showed that OE-MSOT allows the detection of worsening oxygen saturation and vascular function, i.e., decreased sO2 and ΔsO2 levels, in control tumors as they grew. Strikingly, the OE-MSOT data showed that unlike control tumors, the growth of HSP2-treated tumors did not cause worsening of oxygen saturation and vascular function (Fig. S5). It is highly plausible that OE-MSOT could detect such a therapeutic effect on vascular function in patients. Such detection may provide critical information for monitoring, managing, and improving therapeutic regimen in clinical settings.
Our data from HSP2 and CycT treatment indicate that lowering heme availability to tumor cells can be a viable strategy for normalizing tumor oxygenation and vascular function. Heme is a central molecule in mitochondrial OXPHOS and in virtually all processes relating to oxygen transport, storage, detoxification, and utilization (54). Three OXPHOS complexes, II, III, and IV, require heme for proper function. Multiple subunits in complexes III and IV require heme as a prosthetic group. Thus, lowering heme availability should cause decreased OXPHOS activity and reduce oxygen consumption, thereby alleviating tumor hypoxia, as indicated by our data presented here. Heme and iron are linked: heme synthesis requires iron, and heme degradation releases iron. However, likely due to their respective chemical properties, the main biological functions of heme iron and non-heme iron in living organisms may be distinct. Due to its unique property for binding oxygen, the primary functions of heme iron are for oxygen utilization, metabolism, and detoxification, particularly in OXPHOS for ATP generation. Non-heme iron, however, often exists in proteins and enzymes as iron-sulfur cluster, and has essential functions in DNA replication, repair, and cell cycle (55). Thus, both iron depletion and heme depletion can have anti-tumor effects, but the mechanisms largely differ. Our data in Supplemental Fig. S8 show that neither HSP2 nor CycT altered iron content in tumor tissues (Fig. S8A) or affected the levels of proteins relating to iron metabolism, TFRC (Fig. S8B) and SLC40A1 (Fig. S8C). Indeed, previous studies of HSP2 and CycT have shown that they do not affect iron metabolism (34, 35). Since CycT and HSP2 do not have a significant effect on iron metabolism, they may not affect cellular hypoxia responses per se and pre-treatment of NSCLC cells with HSP2 or CycT did not significantly affect hypoxic induction of HIF1α (see Fig. S8D). Thus, the effect of HSP2 and CycT treatment on hypoxia markers is likely attributable to their capability to inhibit oxygen consumption and thereby alleviate hypoxia.
In summary, our data show that HSP2 and CycT act to suppress tumor growth and progression in multiple ways: reducing oxygen consumption, lowering ATP synthesis in tumor cells, and inhibiting angiogenic functions and thereby normalizing tumor vasculature. Inhibited OXPHOS activity would contribute to both lowered ATP synthesis and oxygen consumption, thereby alleviating tumor hypoxia and improving oxygenation. Improved oxygenation would contribute to the suppression of angiogenic factors and normalization of tumor vasculature. It would be interesting to further examine if and how heme may directly influence vascular function in future studies. Nonetheless, the results presented here indicate that heme-targeting drugs are promising candidates that can be used to effectively inhibit angiogenesis, normalize tumor vasculature, and alleviate tumor hypoxia in NSCLC tumors, and likely other drug-resistant tumors. Our data suggest that heme-targeting drugs, acting via multiple mechanisms, may have more potent anti-angiogenic and anti-tumor activities than conventional anti-angiogenic drugs, such as bevacizumab.
Supplementary Material
SIGNIFICANCE.
Heme-targeting agents HSP2 and CycT effectively normalize tumor vasculature and alleviate tumor hypoxia, raising the possibility of their combination with chemo-, radio-, and immunotherapies to improve anti-tumor efficacy.
ACKNOWLEDGEMENTS
This work was supported by Cancer Prevention and Research Institute of Texas grants RP160617 & RP200021 and infrastructure provided by the Southwestern Small Animal Imaging Research Program (SW-SAIRP) supported in part by P30 CA142543 and Shared Instrumentation Grants 1S10 RR024757, S10 OD018094-01A1, and we appreciate the skilled histology of John Shelton (JAR Molecular Pathology Core).
Financial support: This work was supported by a Cancer Prevention and Research Institute of Texas grant RP160617 & RP 200021 and NIH grants 1S10 RR024757, S10 OD018094-01A1 and P30 CA142543
Footnotes
Conflicts of interest:
Dr. Garrossian owns Logan Natural Products. Other authors declare no potential conflicts of interest.
REFERENCES
- 1.Hinshaw DC, Shevde LA. The Tumor Microenvironment Innately Modulates Cancer Progression. Cancer Res 2019;79:4557–66. [DOI] [PMC free article] [PubMed] [Google Scholar]
- 2.Khramtsov VV, Gillies RJ. Janus-faced tumor microenvironment and redox. Antioxid Redox Signal 2014;21:723–9. [DOI] [PMC free article] [PubMed] [Google Scholar]
- 3.Siemann DW, Horsman MR. Modulation of the tumor vasculature and oxygenation to improve therapy. Pharmacol Ther 2015;153:107–24. [DOI] [PMC free article] [PubMed] [Google Scholar]
- 4.Martin JD, Fukumura D, Duda DG, Boucher Y, Jain RK. Reengineering the Tumor Microenvironment to Alleviate Hypoxia and Overcome Cancer Heterogeneity. Cold Spring Harb Perspect Med 2016;6. [DOI] [PMC free article] [PubMed] [Google Scholar]
- 5.Son B, Lee S, Youn H, Kim E, Kim W, Youn B. The role of tumor microenvironment in therapeutic resistance. Oncotarget 2016;8:3933–45. [DOI] [PMC free article] [PubMed] [Google Scholar]
- 6.Lee CT, Boss MK, Dewhirst MW. Imaging tumor hypoxia to advance radiation oncology. Antioxid Redox Signal 2014;21:313–37. [DOI] [PMC free article] [PubMed] [Google Scholar]
- 7.Parks SK, Chiche J, Pouyssegur J. Disrupting proton dynamics and energy metabolism for cancer therapy. Nat Rev Cancer 2013;13:611–23. [DOI] [PubMed] [Google Scholar]
- 8.Gillies RJ, Verduzco D, Gatenby RA. Evolutionary dynamics of carcinogenesis and why targeted therapy does not work. Nat Rev Cancer 2012;12:487–93. [DOI] [PMC free article] [PubMed] [Google Scholar]
- 9.McDonald PC, Chafe SC, Dedhar S. Overcoming Hypoxia-Mediated Tumor Progression: Combinatorial Approaches Targeting pH Regulation, Angiogenesis and Immune Dysfunction. Front Cell Dev Biol 2016;4:27. [DOI] [PMC free article] [PubMed] [Google Scholar]
- 10.Matsumoto S, Kishimoto S, Saito K, Takakusagi Y, Munasinghe JP, Devasahayam N et al. Metabolic and Physiologic Imaging Biomarkers of the Tumor Microenvironment Predict Treatment Outcome with Radiation or a Hypoxia-Activated Prodrug in Mice. Cancer Res 2018;78:3783–92. [DOI] [PMC free article] [PubMed] [Google Scholar]
- 11.Semenza GL. Oxygen sensing, hypoxia-inducible factors, and disease pathophysiology. Annu Rev Pathol 2014;9:47–71. [DOI] [PubMed] [Google Scholar]
- 12.Le QT, Chen E, Salim A, Cao H, Kong CS, Whyte R et al. An evaluation of tumor oxygenation and gene expression in patients with early stage non-small cell lung cancers. Clin Cancer Res 2006;12:1507–14. [DOI] [PubMed] [Google Scholar]
- 13.McNally LR, Mezera M, Morgan DE, Frederick PJ, Yang ES, Eltoum IE et al. Current and Emerging Clinical Applications of Multispectral Optoacoustic Tomography (MSOT) in Oncology. Clin Cancer Res 2016;22:3432–9. [DOI] [PMC free article] [PubMed] [Google Scholar]
- 14.Knieling F, Neufert C, Hartmann A, Claussen J, Urich A, Egger C et al. Multispectral Optoacoustic Tomography for Assessment of Crohn’s Disease Activity. N Engl J Med 2017;376:1292–4. [DOI] [PubMed] [Google Scholar]
- 15.Mason RP. Commentary on Photoacoustic Tomography. J Nucl Med 2015;56:1815–6. [DOI] [PubMed] [Google Scholar]
- 16.Steinberg I, Huland DM, Vermesh O, Frostig HE, Tummers WS, Gambhir SS. Photoacoustic clinical imaging. Photoacoustics 2019;14:77–98. [DOI] [PMC free article] [PubMed] [Google Scholar]
- 17.Brown E, Brunker J, Bohndiek SE. Photoacoustic imaging as a tool to probe the tumour microenvironment. Dis Model Mech 2019;12. [DOI] [PMC free article] [PubMed] [Google Scholar]
- 18.Balasundaram G, Ding L, Li X, Attia ABE, Dean-Ben XL, Ho CJH et al. Noninvasive Anatomical and Functional Imaging of Orthotopic Glioblastoma Development and Therapy using Multispectral Optoacoustic Tomography. Transl Oncol 2018;11:1251–8. [DOI] [PMC free article] [PubMed] [Google Scholar]
- 19.Wilson KE, Bachawal SV, Tian L, Willmann JK. Multiparametric spectroscopic photoacoustic imaging of breast cancer development in a transgenic mouse model. Theranostics 2014;4:1062–71. [DOI] [PMC free article] [PubMed] [Google Scholar]
- 20.Quiros-Gonzalez I, Tomaszewski MR, Aitken SJ, Ansel-Bollepalli L, McDuffus LA, Gill M, et al. Optoacoustics delineates murine breast cancer models displaying angiogenesis and vascular mimicry. Br J Cancer 2018;118:1098–106. [DOI] [PMC free article] [PubMed] [Google Scholar]
- 21.Rich LJ, Seshadri M. Photoacoustic imaging of vascular hemodynamics: validation with blood oxygenation level-dependent MR imaging. Radiology 2015;275:110–8. [DOI] [PMC free article] [PubMed] [Google Scholar]
- 22.Dey S, Kumari S, Kalainayakan SP, Campbell J, Ghosh P, Zhou H et al. The vascular disrupting agent combretastatin A-4 phosphate causes prolonged elevation of proteins involved in heme flux and function in resistant tumor cells. Oncotarget 2018;9:4090–101. [DOI] [PMC free article] [PubMed] [Google Scholar]
- 23.Chekkoury A, Nunes A, Gateau J, Symvoulidis P, Feuchtinger A, Beziere N et al. High-Resolution Multispectral Optoacoustic Tomography of the Vascularization and Constitutive Hypoxemia of Cancerous Tumors. Neoplasia 2016;18:459–67. [DOI] [PMC free article] [PubMed] [Google Scholar]
- 24.Li ML, Oh JT, Xie XY, Ku G, Wang W, Li C et al. Simultaneous molecular and hypoxia imaging of brain tumors in vivo using spectroscopic photoacoustic tomography. Proceedings of the Ieee 2008;96:481–9. [Google Scholar]
- 25.Raes F, Sobilo J, Le Mee M, Retif S, Natkunarajah S, Lerondel S et al. High Resolution Ultrasound and Photoacoustic Imaging of Orthotopic Lung Cancer in Mice: New Perspectives for Onco-Pharmacology. PLoS One 2016;11:e0153532. [DOI] [PMC free article] [PubMed] [Google Scholar]
- 26.Imai T, Muz B, Yeh CH, Yao J, Zhang R, Azab AK et al. Direct measurement of hypoxia in a xenograft multiple myeloma model by optical-resolution photoacoustic microscopy. Cancer Biol Ther 2017;18:101–5. [DOI] [PMC free article] [PubMed] [Google Scholar]
- 27.Lavaud J, Henry M, Coll JL, Josserand V. Exploration of melanoma metastases in mice brains using endogenous contrast photoacoustic imaging. Int J Pharm 2017;532:704–9. [DOI] [PubMed] [Google Scholar]
- 28.Tomaszewski MR, Gonzalez IQ, O’Connor JP, Abeyakoon O, Parker GJ, Williams KJ et al. Oxygen Enhanced Optoacoustic Tomography (OE-OT) Reveals Vascular Dynamics in Murine Models of Prostate Cancer. Theranostics 2017;7:2900–13. [DOI] [PMC free article] [PubMed] [Google Scholar]
- 29.Tomaszewski MR, Gehrung M, Joseph J, Quiros-Gonzalez I, Disselhorst JA, Bohndiek SE. Oxygen-Enhanced and Dynamic Contrast-Enhanced Optoacoustic Tomography Provide Surrogate Biomarkers of Tumor Vascular Function, Hypoxia, and Necrosis. Cancer Res 2018;78:5980–91. [DOI] [PubMed] [Google Scholar]
- 30.Siegel RL, Miller KD, Jemal A. Cancer statistics, 2016. CA Cancer J Clin 2016;66:7–30. [DOI] [PubMed] [Google Scholar]
- 31.Riaz SP, Luchtenborg M, Coupland VH, Spicer J, Peake MD, Moller H. Trends in incidence of small cell lung cancer and all lung cancer. Lung Cancer 2012;75:280–4. [DOI] [PubMed] [Google Scholar]
- 32.Siegel R, DeSantis C, Virgo K, Stein K, Mariotto A, Smith T et al. Cancer treatment and survivorship statistics, 2012. CA Cancer J Clin 2012;62:220–41. [DOI] [PubMed] [Google Scholar]
- 33.Allemani C, Weir HK, Carreira H, Harewood R, Spika D, Wang XS et al. Global surveillance of cancer survival 1995–2009: analysis of individual data for 25,676,887 patients from 279 population-based registries in 67 countries (CONCORD-2). Lancet 2015;385:977–1010. [DOI] [PMC free article] [PubMed] [Google Scholar]
- 34.American Cancer Society. Cancer Facts & Figures 2019. [Google Scholar]
- 35.Sohoni S, Ghosh P, Wang T, Kalainayakan SP, Vidal C, Dey S et al. Elevated Heme Synthesis and Uptake Underpin Intensified Oxidative Metabolism and Tumorigenic Functions in Non-Small Cell Lung Cancer Cells. Cancer Res 2019;79:2511–25. [DOI] [PubMed] [Google Scholar]
- 36.Kalainayakan SP, Ghosh P, Dey S, Fitzgerald KE, Sohoni S, Konduri PC et al. Cyclopamine tartrate, a modulator of hedgehog signaling and mitochondrial respiration, effectively arrests lung tumor growth and progression. Sci Rep 2019;9:1405. [DOI] [PMC free article] [PubMed] [Google Scholar]
- 37.Chen JK, Taipale J, Cooper MK, Beachy PA. Inhibition of Hedgehog signaling by direct binding of cyclopamine to Smoothened. Genes Dev 2002;16:2743–8. [DOI] [PMC free article] [PubMed] [Google Scholar]
- 38.Kumar R, Lovell S, Matsumura H, Battaile KP, Moenne-Loccoz P, Rivera M. The hemophore HasA from Yersinia pestis (HasAyp) coordinates hemin with a single residue, Tyr75, and with minimal conformational change. Biochemistry 2013;52:2705–7. [DOI] [PMC free article] [PubMed] [Google Scholar]
- 39.Hooda J, Cadinu D, Alam MM, Shah A, Cao TM, Sullivan LA et al. Enhanced heme function and mitochondrial respiration promote the progression of lung cancer cells. PLoS One 2013;8:e63402. [DOI] [PMC free article] [PubMed] [Google Scholar]
- 40.Liu L, Cao Y, Chen C, Zhang X, McNabola A, Wilkie D et al. Sorafenib blocks the RAF/MEK/ERK pathway, inhibits tumor angiogenesis, and induces tumor cell apoptosis in hepatocellular carcinoma model PLC/PRF/5. Cancer Res 2006;66:11851–8. [DOI] [PubMed] [Google Scholar]
- 41.Kanamori H, Naruse G, Yoshida A, Minatoguchi S, Watanabe T, Kawaguchi T et al. Metformin Enhances Autophagy and Provides Cardioprotection in delta-Sarcoglycan Deficiency-Induced Dilated Cardiomyopathy. Circ Heart Fail 2019;12:e005418. [DOI] [PubMed] [Google Scholar]
- 42.Loubiere C, Clavel S, Gilleron J, Harisseh R, Fauconnier J, Ben-Sahra I et al. The energy disruptor metformin targets mitochondrial integrity via modification of calcium flux in cancer cells. Sci Rep 2017;7:5040. [DOI] [PMC free article] [PubMed] [Google Scholar]
- 43.Bohndiek SE, Sasportas LS, Machtaler S, Jokerst JV, Hori S, Gambhir SS. Photoacoustic Tomography Detects Early Vessel Regression and Normalization During Ovarian Tumor Response to the Antiangiogenic Therapy Trebananib. J Nucl Med 2015;56:1942–7. [DOI] [PMC free article] [PubMed] [Google Scholar]
- 44.Yang J, Zhang G, Li Q, Liao C, Huang L, Ke T et al. Photoacoustic imaging for the evaluation of early tumor response to antivascular treatment. Quant Imaging Med Surg 2019;9:160–70. [DOI] [PMC free article] [PubMed] [Google Scholar]
- 45.Rademakers SE, Span PN, Kaanders JH, Sweep FC, van der Kogel AJ, Bussink J. Molecular aspects of tumour hypoxia. Mol Oncol 2008;2:41–53. [DOI] [PMC free article] [PubMed] [Google Scholar]
- 46.Sun X, Ackerstaff E, He F, Xing L, Hsiao HT, Koutcher JA et al. Visualizing the antivascular effect of bortezomib on the hypoxic tumor microenvironment. Oncotarget 2015;6:34732–44. [DOI] [PMC free article] [PubMed] [Google Scholar]
- 47.Bendinger AL, Glowa C, Peter J, Karger CP. Photoacoustic imaging to assess pixel-based sO2 distributions in experimental prostate tumors. J Biomed Opt 2018;23:1–11. [DOI] [PubMed] [Google Scholar]
- 48.Zhou H, Belzile O, Zhang Z, Wagner J, Ahn C, Richardson JA et al. The effect of flow on blood oxygen level dependent (R(*) 2 ) MRI of orthotopic lung tumors. Magn Reson Med 2019;81:3787–97. [DOI] [PMC free article] [PubMed] [Google Scholar]
- 49.Zhou H, Zhang Z, Denney R, Williams JS, Gerberich J, Stojadinovic S et al. Tumor physiological changes during hypofractionated stereotactic body radiation therapy assessed using multi-parametric magnetic resonance imaging. Oncotarget 2017;8:37464–77. [DOI] [PMC free article] [PubMed] [Google Scholar]
- 50.Graves EE, Vilalta M, Cecic IK, Erler JT, Tran PT, Felsher D et al. Hypoxia in models of lung cancer: implications for targeted therapeutics. Clin Cancer Res 2010;16:4843–52. [DOI] [PMC free article] [PubMed] [Google Scholar]
- 51.Vilalta M, Hughes NP, Von Eyben R, Giaccia AJ, Graves EE. Patterns of Vasculature in Mouse Models of Lung Cancer Are Dependent on Location. Mol Imaging Biol 2016;19:215–24. [DOI] [PMC free article] [PubMed] [Google Scholar]
- 52.Kim HJ, Khalimonchuk O, Smith PM, Winge DR. Structure, function, and assembly of heme centers in mitochondrial respiratory complexes. Biochim Biophys Acta 2012;1823:1604–16. [DOI] [PMC free article] [PubMed] [Google Scholar]
- 53.Mason RP. Oxygen breathing challenge- the simplest theranostic. Theranostics 2017;7:3873–5. [DOI] [PMC free article] [PubMed] [Google Scholar]
- 54.Padmanaban G, Venkateswar V, Rangarajan PN. Haem as a multifunctional regulator. Trends Biochem Sci 1989;14:492–6. [DOI] [PubMed] [Google Scholar]
- 55.Torti SV, Manz DH, Paul BT, Blanchette-Farra N, Torti FM. Iron and Cancer. Annu Rev Nutr 2018;38:97–125. [DOI] [PMC free article] [PubMed] [Google Scholar]
Associated Data
This section collects any data citations, data availability statements, or supplementary materials included in this article.