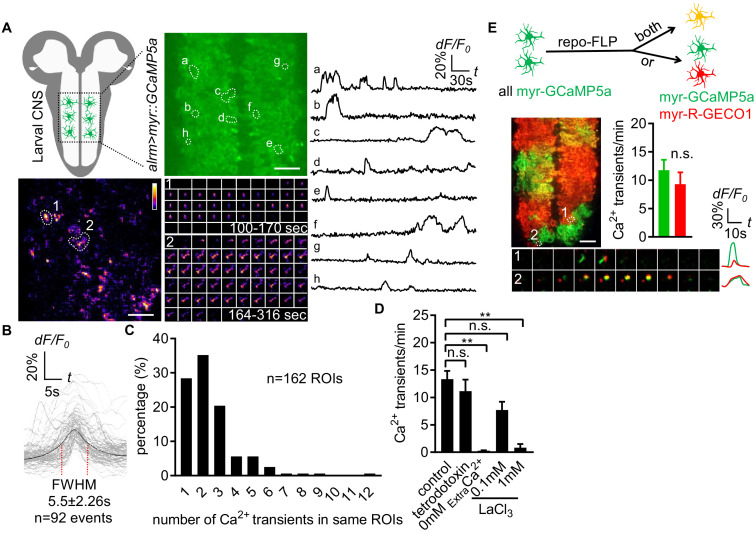
Figure 1. Characterization of microdomain Ca2+ transients in Drosophila astrocytes.
(A) Schematic of larval CNS (white area, neuropil; gray, cortex). An imaging area showing membrane tethered myr-GCaMP5a (green) in astrocytes, in which microdomain Ca2+ transients during 6 min were maximally projected. Traces of 8 individual ROIs microdomains (right, a–h) are shown over the entire 6 min window. Pseudocolor grayscale of Ca2+ signals (bottom left), grayscale values ranging from 0 to 255 (scale bars, 20 µm). Representative time-lapse images (bottom right) of two indicated microdomain Ca2+ transients in 2 ROIs (1, 2). (B) Superimposed traces of individual microdomain Ca2+ transients and an average with its full width at half maximum (FWHM, mean ± SD). (C) Histogram showing the distribution of recurrent microdomain Ca2+ transients at same ROIs. (D) Responses of microdomain Ca2+ transients to tetrodotoxin, 0 extracellular Ca2+ and LaCl3 (n = 6, mean ± SEM, one-way ANOVA). (E) 2-color Ca2+ imaging in neighboring astrocytes. In presence of the flippase repo-FLP, myr-GCaMP5a expressing astrocytes switch to express myr-R-GECO1, resulting in 3 types of astrocytes: myr-GCaMP5a+ (green), myr-R-GECO1+ (red), expressing both indicators (orange) (scale bar, 20 µm). Quantification is from Ca2+ imaging of myr-GCaMP5a and myr-R-GECO1 that were exclusively expressed in adjacent astrocytes (n = 3, unpaired t-test). Time-lapse images and superimposed traces of representative microdomain Ca2+ transients at two juxtaposed ROIs between myr-GCaMP5a and myr-R-GECO1 expressing astrocytes. See source data Figure 1—source data 1.


