

Abstract
Background
Photodegradation of organic pollutants is considered to be the most suitable and cheaper technique to counter the decontamination issues. Metal nanoparticles are considered to be the most effective heterogeneous photocatalysts for photodegradation of organic pollutants. Besides, iron oxide nanoparticles are well-known photocatalysts for degrading organic pollutants.
Methods
We reported the synthesis of neat iron oxide nanoparticles (Fe3O4 NPs) and zirconia supported iron oxide nanoparticles (Fe3O4/ZrO2 NPs) by facile chemical reduction technique for photodegradation ofa toxic azo dye namely methyl red.
Results
The XRD and FTIR analysis has demonstrated a crystalline phase Fe3O4 NPs. The morphological features via scanning electronic microscopy (FESEM) suggested agglomerated morphology of neat Fe3O4 NPs with 803.54 ± 5.11 nm average particle size and revealed the uniform morphology and homogenous dispersion of Fe3O4 NPs over ZrO2 surface in Fe3O4/ZrO2 nanocomposite. A polydispersity index (PDI) of 0.47 showed sufficient variations in the particle size of neat Fe3O4 NPs, which is also supported by the results obtained from atomic force microscopy (AFM), FESEM and Transmission Electron Microscopy (TEM). Fe3O4/ZrO2 NPs demonstrated efficient methyl red degradation over a short period of time under simulated light and degraded about ~ 91.0 ± 1.0% and 87.0 ± 1.0% dye in 40 min, under UV and visible light, respectively.
Conclusion
The excellent photodegradation efficacy and sustainability of Fe3O4/ZrO2 NPs can be attributed to the homogenous distribution of Fe3O4 NPs over ZrO2, which facilitates the generation of photoexcitons (electrons and holes), enhanced charge transfer and minimize the charge recombination.
Keywords: Zirconia, Fe3O4, Nanoparticles, Methyl red, Photodegradation
Introduction
Azo dyes are the most common and largest class of synthetic dyes, which are aromatic in nature and widely used in textile, paper, cosmetics, food, and pharmaceutical industries [1–3]. The use of azo dye in the textile industry for coloring cellulosic fibers such as wool and cotton has increased significantly in the last decades due to their color brightness, cost-effectiveness, and good resistance to light exposure and washing [4]. Many azo dyes are toxic, carcinogenic, and mutagenic and cause allergic reactions [5, 6]. Among the azo dyes, methyl red is a monoazo textile dye with molecular formula C15H15N3O2 and is one of the toxic, mutagenic, and carcinogenic water pollutants and has a potential threat to the environment [7–10]. It causes skin and eye irritation and also irritation of respiratory and digestive tracts if inhaled/swallowed [11], and has low biodegradability due to the presence of benzene rings [12]. Various approaches have been introduced to remove methyl red dye from water such as adsorption [13–16], Extraction [17], biodegradation [18–20], Electrochemical oxidation [21], photo-Fenton’s processes [22], Coagulation/Flocculation [23] etc. But most of these conventional methods are not economic, difficult to handle, non-destructive, and only transfer pollutants into sludge, which give rise to a new type of pollution, which needs further treatment [24]. Currently, photodegradation is widely employed for pollutants remediation is an advance oxidation process in which the photochemical breakdown of toxic molecules occurs into simple and non-toxic species due to light exposure [25]. This is a promising technology for industrial wastewater treatment due to low cost, environmentally friendly process, lack of secondary contamination, and non-selectively degrade various organic dyes into CO2 and H2O [26]. The efficiency of this process can be enhanced by employing photocatalyst, which is a semiconductor material activated by adsorbing light photon and has the capability of accelerating reactions without being consumed [27]. Among the photocatalysts, Fe3O4 is one promising candidate for photocatalytic applications [28] due to low-cost synthesis, no secondary pollution, n-type semiconducting behavior and having a bandgap (Eg = 2.1 eV) [29]. Fe3O4 and its composite materials are potentially utilized in various emerging fields and processes such as sensors [30, 31], adsorption [32], biomedical [33], supercapacitor electrodes [34], lithium-ion batteries [35], solar cells [36], hydrogen production [37] and as photocatalyst in dye degradation [38–42]. In photocatalysis, neat metal NPs aggregates in solution, show high recombination of the photogenerated electron–hole pairs on the photocatalyst surface and difficulties in separation from reaction medium after the completion of reaction. Different approaches have been introduced to overcome these problems, among which synthesizing NPs on support materials is a simple way to retard NPs agglomeration [24]. Supported iron catalysts display enhanced dispersion of the active phase [43], which will increase its photocatalytic efficiency.
In the present study, iron oxide NPs were successfully synthesized on zirconia for retarding its aggregation and enhancing its surface areaby chemical reduction method. Zirconia supported Fe3O4 nanoparticles (Fe3O4/ZrO2 NPs) and neat iron oxide nanoparticles (Fe3O4 NPs) are synthesized and employed as photocatalysts for the photodegradation of MR dye in aqueous medium both under UV and visible light. ZrO2 is an exciting material for various photochemical heterogeneous reactionsdue to its n-type semiconductor nature [44] and also utilized as support materials for nanoparticles synthesis [45]. Multiple studies have been reported on the photodegradation of MR dye employing various photocatalysts such as TiO2 [46], ZnO [47], TiO2/WO3 nanocomposite [48], nanoporous-pyramids structured silicon powder [49], F-TiO2/SiO2/rGO Nanocomposite [50], but most of these studies show long irradiation time and hard reaction conditions. In this work, MR is degraded both under UV and visible light in 40 min. The effect of irradiation time, recovered photocatalysts efficiency, light source, tap water, photocatalyst dosage, and initial dye concentration are evaluated.
Materials and methods
Materials
Calcined ZrO2 was supplied by BDH. NaOH, and FeCl3.6H2O was purchased from Scharlau Chemicals. Methyl red dye was supplied by Sigma-Aldrich.
Synthesis of Fe3O4/ZrO2 NPs and Fe3O4 nanoparticles
In a 500 mL volumetric flask, 100 mL FeCl3.6H2O (0.3 M) solution and 4 g ZrO2 particles (calcined) were taken and then sonicated for complete dispersion of zirconia in the salt solution. The mixture resulted was then basified through adding dropwise NaOH (2 M) solution till pH 9.0 achieved, and the mixture was then refluxed at 80 °C for 4.0 h under constant and continuous stirring. The solution obtained is cooled, then filtered and slowly washed with double distilled water to remove impurities and unwanted chemicals. The obtained Fe3O4/ZrO2 NPs were then completely oven-dried at 100 °C for overnight. The same steps were carried out for the preparation of neat Fe3O4 NPs without adding zirconia particles.
Photodegradation study of methyl Red
The prepared Fe3O4/ZrO2 NPs and Fe3O4 NPs are tested as photocatalysts for degrading Methyl Red (MR) dye under UV and visible light in an aqueous solution as a function of different operational parameters, e.g., irradiation time, irradiation light source, the effect of tap water, recycled catalyst activity, catalyst amount and initial dye concentration. In time study, 0.02 g of photocatalyst was added to the 10 mL solution of MR dye (70 ppm) present in a 50 mL beaker and sonicated for 2 min for NPs complete dispersion. In order to attain a quantitative adsorption–desorption equilibrium of adsorbed dye, the samples were also analyzed in the dark. The sample was irradiated under UV or visible light with constant and continuous stirring for different irradiation times (10, 20, 30, and 40 min). After the reaction time completion, the photocatalyst is separated through centrifugation (12,000 rpm for 10 min). During this study, the catalyst amount (0.02 g) and dye concentration (70 ppm) were kept constant except in dye concentration and catalyst amount study.
Instrumentation
The synthesized Fe3O4/ZrO2 NPs and Fe3O4 NPs were characterized through Field Emission Scanning Electron Microscopy and Energy Dispersive X-Ray (LA-6490, JEOL Japan, in the energy range of 0–20 keV), Atomic Force Microscopy (Model 5500, Agilent, Santa Clara, U.S.A.), Transmission Electron Microscopy (TEM of the samples were taken using a JEOL system (JEM2100F) operating at an acceleration voltage of 200 kV. For TEM, the powder was added to ethanol followed by sonication for 30 min. A droplet (5μL) of dilute suspensions was deposited in a 300-mesh pure carbon-supported grid and then kept in vacuum station for 1 h for further drying before analysis), X-Ray Diffraction (D8-advance instrument, Bruker AXS Ltd., Germany), Fourier Transform Infra-Red (Nicolet Nexus 470, Thermo Electron Co., USA) and Zetasizer (Model ZS-90 Malvern Instruments, Malvern, UK). The photodegradation study was performed by a UV–Visible spectrophotometer (Model = Shimadzu 1800, Japan). A Carry 5000 model was used to investigate optical properties of the samples. Absorption spectra were recorded from 200–800 nm at a scan rate of 100 nm/min.
Results and discussion
Morphology, elemental composition, and mapping study
The surface morphology of Fe3O4/ZrO2 and Fe3O4 NPs are investigated through AFM, FESEM, and TEM analysis. Figure 1 represents the AFM2D images of ZrO2 (a), Fe3O4 NPs (b), and Fe3O4/ZrO2NPs (c). From Fig. 1a, it is observed that ZrO2 has a cracked surface structure. Figure 1b shows that neat Fe3O4NPs are mostly agglomerated into large particle sizes, while Fig. 1c displays that Fe3O4 NPs are deposited on the cracked surface of ZrO2.
Fig. 1.

AFM 2D images of a ZrO2 (b), Fe3O4 NPs c Fe3O4/ZrO2NPs
The results of AFM are well supported by FESEM analysis. Figure 2a-c shows the FESEM images of ZrO2 at different magnifications. The SEM images show that ZrO2 particles are spherical in coagulated form, and hence its size is in the micron range. The surface of the ZrO2is cracked, which might be due to its calcination at high temperature. Figure 2d-f shows that neat Fe3O4NPs have no regular geometry and are highly agglomerated. Figure 2g-i reveals the FESEM images of Fe3O4/ZrO2 NPs, which represent that Fe3O4 NPs are well deposited and decorated on ZrO2 surface. The deposited Fe3O4 NPs are spherical and cubical in shape and mostly observed in dispersed form.
Fig. 2.

FESEM images of a-c ZrO2 d-f Fe3O4 NPs g-i Fe3O4/ZrO2 NPs
The morphological features of Fe3O4/ZrO2 NPs are further investigated through TEM analysisand the results are provided in Fig. 3a-d at various magnifications. The TEM results clearly demonstrate that Fe3O4 NPs have adhered to the surface of ZrO2 in a highly dispersed fashion and dominantly covered its surface. The acquired Fe3O4/ZrO2NPs amalgamation and intercalation is quite useful to provide a facile pathway for solar light absorption and charge transfer during the photocatalytic processes, and hence we could assume the suppression of charge recombination at this stage.
Fig. 3.

a-d TEM images of Fe3O4/ZrO2 NPs at different magnifications
Elemental composition and mapping study
Figure 4a shows the EDX analysis of Fe3O4 NPs, representing peaks for Fe and O, which verify the synthesis of iron oxide NPs. A ~ 26 and ~ 70% atomic wt compositions are observed for elemental iron and oxygen, respectively, which correspond to the Fe3O4 phase. The spectrum also shows anelemental gold (4%) peak, which arises due to gold coating of the samples for these analyses. Importantly, the Fe and O elemental distribution is also supported by the mapping analysis in Fig. 4b and c, respectively. Similarly, Fig. 5a represents the corresponding EDX peaks for elemental Zr, Fe, and O in the spectrum of Fe3O4/ZrO2 NPs. The rough % composition of each element is also provided in tabular form in the same Figure. The higher % atomic wt of oxygen element in EDX indicated that the surface is oxidized by high energy X-ray radiation at the measured location. Furthermore, mapping (Fig. 5b-d) and EDX studies provide information about the existence of each element with their % atomic wt values within the amalgamated Fe3O4/ZrO2 NPs. The more % atomic wt of oxygen signifies the existence of highly oxidized magnetite form, which is further confirmed by the XRD analysis.
Fig. 4.

a E.D.X. analysis of Fe3O4 NPs (b) and c Elemental Mapping of Fe3O4 NPs
Fig. 5.

a EDX analysis of Fe3O4/ZrO2 NPs (b), c and d Elemental Mapping of Fe3O4/ZrO2 NPs
XRD analysis
Figure 6 shows the XRD patterns of ZrO2, Fe3O4/ZrO2 NPs, and Fe3O4 NPs. In the first instance, it can be claimed that the as-synthesized photocatalysts are highly crystalline due to the appearance of sharp and distinct peaks. Furthermore, the XRD pattern of Fe3O4/ZrO2 shows corresponding patterns of Fe3O4 and ZrO2NPs, which is a strong evidence that these materials form a suitable hybrid. Based on the literature survey and morphological assessments, we assume that Fe3O4 NPs are distributed in homogeneous fashion over the ZrO2 support.The peaks observed in the XRD spectra of Fe3O4 NPs in Fe3O4/ZrO2 hybrid at 2θ value of 30.10°, 35.33°, 43.27°, 53.69°, 57.34°, 62.7°, and 74.31° are reflection planes (220), (311), (400), (422), (511), (440), and (533), respectively, and corresponded to iron oxide and was found to match with the standard pattern of (JCPDS file no. 19–0629 [51]. Similarly, the diffraction peaks of ZrO2 corresponding to (110), (111), (1 11), (022), (200), (102), (211), (022), (122), (300), (013), (302), (113), and (222) planes, are well indexed with JCPDS NO. 37–1484, which indicates the formation of the monoclinic crystal phase of ZrO2. In the ZrO2 spectra, no peak was found corresponding to any impure phase of zirconia [52].
Fig. 6.
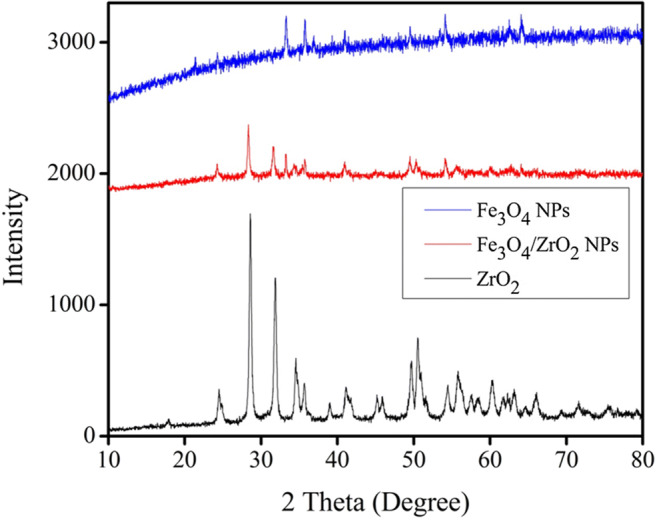
XRD pattern of ZrO2, Fe3O4/ZrO2 NPs, and Fe3O4 NPs
FTIR analysis
Figure 7 shows the FTIR spectra of ZrO2, Fe3O4/ZrO2 NPs, and Fe3O4 NPs from 3500 to 425 cm−1 (break from 2500 to 1200 cm−1). The characteristic broadband in the Fe3O4 NPs spectra at 3410 cm−1 and short peak at 1634 cm−1 represents the stretching frequency of –OH group of absorbed water present in the surface of the Fe3O4 NPs. The band appeared in the Fe3O4 NPs spectra at 580 cm−1 corresponded to the vibration of the Fe–O bonds in the crystalline lattice of Fe3O4 [53]. The band appeared at 723 cm−1 and 470 cm−1 in the range 400–850 cm−1 in the ZrO2 and Fe3O4/ZrO2 hybrid spectra are responsible for Zr–O vibration of monoclinic phase zirconia [54, 55]. In the Fe3O4/ZrO2 NPs spectra, peaks for both Fe3O4 and ZrO2 are present, and no new peaks were observed, which confirm only the deposition of Fe3O4 NPs on the surface of monoclinic ZrO2.
Fig. 7.

FTIR spectra of ZrO2, Fe3O4/ZrO2 NPs, and Fe3O4 NPs
UV–Vis and photoluminescence analysis
The powder UV–Vis diffuse reflectance analysis was used to determine the bandgap, and optical band positions and the corresponding Tauc’s plots are provided in Fig. 8a. The UV spectra of Fe3O4 shows a lower bandgap value of 2.57 eV, which could be attributed to the optical properties of the materials. However, the Fe3O4/ZrO2 NPs exhibits a relatively larger band gap value of 3.17 eV. It is reported that ZrO2 is a wide bandgap material, i.e., bandgap > 3.6 eV [56], so the hybrid possesses an intermediate value of Fe3O4 and ZrO2. These results further confirm the successful distribution of Fe3O4 over ZrO2 surfaces. However, it is difficult to relate the UV–Vis spectra with the photocatalytic activity alone. Therefore we also performed supporting analysis as discussed below. Moreover, optical band positions from the Tauc`s plots can be calculated using Eqs. 1 and 2, [57].
| 1 |
| 2 |
Fig. 8.

Optical and photoelectrochemical analysis of Fe3O4 and Fe3O4/ZrO2 NPs: a Tauc`s plot for bandgap and optical band positions, b The emission PL spectra, c Photoelectrochemical linear sweep voltammograms under light, and d EIS Nyquist plot for charge transfer under the light
where χ is the Mullikan`s absolute electronegativity of corresponding metal oxide, and in the case of hybrid, an average value will be used and E electron is e is the energy on the hydrogen scale (4.5 eV). Putting the values of E electron (4.5 eV), χ(Fe3O4 = 5.78 eV, ZrO2 = 5.91 eV and Fe3O4/ZrO2 = 5.85 eV) in Eqs. (1) and (2) we obtained the band positions in the following Table 1 and also in the Fig. 8a.
Table 1.
Bandgap, valence band and conductance band of ZrO2, Fe3O4 and Fe3O4/ZrO2
| Materials | E electron | Χ | E bandgap | E valence band | E conductance band |
|---|---|---|---|---|---|
| Fe3O4 | 4.5 eV | 5.78 eV | 2.57 eV | 2.57 eV | 0.00 eV |
| ZrO2 | 4.5 eV | 5.91 eV | > 3.60 eV | 3.21 eV | 0.39 eV |
| Fe3O4/ZrO2 | 4.5 eV | 5.85 eV | 3.17 eV | 2.89 eV | -0.28 eV |
Furthermore, The Duetta photometer is used to record the emission photoluminescence (PL) spectra of the Fe3O4 and Fe3O4/ZrO2 NPs, provided in Fig. 8b. PL spectra determine the migration of electron, electron/hole pair recombination, and separation rate. The Fe3O4 NPs exhibit anintense and broad emission peak centered at ~ 700 nm, which significantly quench in the case of Fe3O4/ZrO2 NPs. Higher PL intensity designates the metallic nature of Fe3O4 NPs having lower charge carrier capacity of electrons and holes. The quenching of the PL spectrum is a clear indication of the suppression of charge recombination in the hybrid case,as also reported by Boruha et al. for Fe3O4/rGO system [58]. These results also affirm the successful interaction of ZrO2supported Fe3O4, which are aligned with XRD, FTIR, and other analytical analyses.
Photoelectrochemical and EIS analysis
The photoelectrochemical (PEC) performance of the Fe3O4 and Fe3O4/ZrO2 NPs photoelectrodes was explored via linear-sweep voltammetry (LSV). Figure 8c displays the LSV measurements under regular ON/OFF light illumination. The results revealed that under simulated light up to 1.2 V vs. RHE, the photocurrent densities enormously increased with the voltage sweep, as indicated by the I-V spectra. The spectra represent that the photocurrent density of Fe3O4/ZrO2 NPs is much higher than Fe3O4 NPs. These results indicated that Fe3O4and Fe3O4/ZrO2 NPs are photoactive, however the latter has more photoresponse due to the successful interaction of Fe3O4 and ZrO2 NPs. In order to investigate the interfacial charge transfer in Fe3O4 and Fe3O4/ZrO2 photoelectrodes from the electrolyte to the surface of the electrode, Electronic impedance spectroscopy (EIS) was performed. The samples were analyzed under simulated solar illumination with a DC voltage sweep across the working electrode. Figure 8d shows the EIS Nyquist plot spectra with representative semicircles for Fe3O4 and Fe3O4/ZrO2 NPs, which revealed that Fe3O4/ZrO2 NPs exhibit lower resistance than Fe3O4 NPs. Such lower resistance of Fe3O4/ZrO2 NPs suggested that the synchronized interaction between Fe3O4 and ZrO2 NPs provides a perfect transport path for photoexcitons. The results also proposed that the charge recombination in Fe3O4/ZrO2 NPs is minimized due to which it shows relatively good stability and enhance photocatalytic efficiency than Fe3O4.
Particle size and zeta potential
The neat Fe3O4 NPs are further analyzed through zeta sizer. Figure 9a displays the size distribution plot of neat Fe3O4 NPs, which represents the average particle size 803.54 ± 5.11 nm, representing a large particle size than the sizes in AFM and SEM images, which could be attributed to its aggregation in the aqueous media. The Fe3O4 NPs have a PDI of 0.47, which confirms sufficient variation in the Fe NPs size. Moreover, Fig. 9b signifies the zeta potential of Fe3O4 NPs, which display a surface charge of 11.9 ± 0.39 mV. The surface charge on the surface of Fe3O4 NPs is not so sufficient for NPs electrostatic repulsion in suspension, thus led to fast agglomeration, and hence neat Fe3O4 NPs show less photocatalytic activity compared to Fe3O4/ZrO2 NPs.
Fig. 9.

a Size distribution plot of Fe3O4 NPs b Plot of the total counts versus the zeta potential (mV) of Fe3O4 NPs
Photodegradation of Methyl red
Irradiation time study
The prepared Fe3O4 NPs and Fe3O4/ZrO2 NPs and ZrO2 are utilized as photocatalysts for the photodegradation of methyl red (MR) in aqueous medium under UV and Visible light. Figure 10a, b, c demonstrates the UV–Vis spectra of MR dye before reaction and after UV-light irradiation photo-degraded by ZrO2, Fe3O4 NPs, and Fe3O4/ZrO2 NPs, respectively. From Fig. 10, it can be determined that as irradiation time increases, absorbance decreases (497 nm), confirming the degradation of dyes. Figure 10d shows the %degradation of dye photodegraded by ZrO2, Fe3O4 NPs, and Fe3O4/ZrO2 NPs. All the figures show that increasing irradiation time causes an increase in dye degradation. In dark reaction (adsorption–desorption equilibrium) 4–9 ± 1% dye was removed in which ZrO2 have maximum adsorption capability. In photolysis reaction without photocatalyst under UV-light,no degradation was observed.The %degradation results reveal that within 40 min, ZrO2 removed about 29 ± 1% MR dye, Fe3O4 NPs degraded 84 ± 1.0% dye while Fe3O4/ZrO2 NPs degraded about 91 ± 1.0% dye. ZrO2 removed a small quantity of dye, which might be due to adsorption or its slow degradation efficiency. The observed enhancement in dye degradation by Fe3O4/ZrO2 NPs as compared to Fe3O4 NPs is attributed to the high surface area of NPs on ZrO2 surface while the unsupported Fe3O4 NPs are agglomerated. Figure 11 shows the digital photograph of MR original and degraded dye under UV-light photodegraded by ZrO2, Fe3O4, and Fe3O4/ZrO2 NPs, respectively, as a function of irradiation time.
Fig. 10.

UV–Vis spectra of MR dye before reaction and after specific UV-light irradiation times in the presence of a ZrO2, b Fe3O4 NPs c Fe3O4/ZrO2 NPs d %degradation by ZrO2, Fe3O4 NPs and Fe3O4/ZrO2 NPs (Dye concentration = 70 ppm, catalyst amount = 0.02 g)
Fig. 11.

Digital photograph of MR original and degraded dye under the UV-light photodegraded by a ZrO2, b Fe3O4 NPs and c Fe3O4/ZrO2 NPs (Dye concentration = 70 ppm, catalyst amount = 0.02 g)
Proposed photodegradation mechanism
The photodegradation of dye occurs as UV/Visible light adsorbed by Fe3O4 NPs that result in excitation of electrons (e−) from valence band (VB) to the conduction band (CB), creatingpositively charged holes (h+) in the valence band. In neat Fe3O4 NPs a greater portion of created electron–hole pairs recombine due to its small bandgap and thus show less photocatalytic activity. In the case of Fe3O4/ZrO2 NPs the charge recombination from CB to the VB is minimized due to the electron trapping properties of ZrO2 having a wide bandgap [59].The e− present in the CB of Fe3O4 NPs transfer to the CB band of ZrO2 and thus reduce charge recombination deficiency. The Fe3O4/ZrO2 NPs show enhanced activity because of having a synergistic effect in lowering the recombining deficiency of created charges, high surface area of Fe3O4 NPs on the ZrO2surface, and rapid dye adsorption of MR dye on ZrO2 followed by its drastic degradation on supported Fe3O4 NPs. The hole in the VB reacts with H2O molecules and produces hydroxyl radicals (•OH), while the e− present in the CB reacts with an oxygen molecule and produces superoxide anion radical (•O2−). These generated radicals are highly reactive and degraded dye molecules into more unaffected species such as CO2 and H2O. The possible reaction steps in this mechanism are summarized inthe following equations [24].
| 3 |
| 4 |
| 5 |
| 6 |
| 7 |
The possible reaction mechanism can easily be understood from the Fig. 12a.
Fig. 12.

a Proposed mechanism for MR dye photodegradation b optical band position vs. NHE c Optimized geometry of methyl red dye computed at wB9XD level and 6-31G + (d,p) basis set. The white ball represents hydrogen, grey represents carbon, red represents oxygen, and blue represents nitrogen
Based on the E valence band and E conductance band calculations a schematic band structure was proposed and the optical band position were represented in the Fig. 12b. The diagram show that the CB of ZrO2 is lower than Fe3O4 NPs and thus upon light irradiation the photo-induced electrons would be shifted from higher CB of Fe3O4 to lower CB of ZrO2, where the electron trapped due to its high bandggap than Fe3O4 NPs. Hence the charge recombination is minimized in the Fe3O4/ZrO2 NPs than Fe3O4 NPs and thus represent maximum photocatalytic efficiency.
DFT prediction of major radicalfor dye degradation
In order to determine the significant radical responsible for MR dye photodegradation, computational simulations were performed to clearly understand the competition between •OH and •O2− radical to attack the dye molecule and to know the mechanism of dye degradation. The density functional theory (DFT) computations were carried out on Gaussian 09 code [60]. The sub-level of DFT was used is wB97XD while the basis set employed is 6-31G + (d,p). The hessian calculation was done to prove the stability of the optimized dye molecule, which is confirmed by the absence of any imaginary frequency. The optimized geometry of methyl red (MR) dye is depicted in Fig. 12c, while the values of chemical reactivity descriptors (local softness S0 and Fukui functions ƒ0) are given in Table 2.
Table 2.
Computed chemical reactivity descriptors for MR dye and •OH and O2 radicals
| MR- (S = 6.980291 | |||
|---|---|---|---|
| Atoms Code | ƒ 0 | S0 | ∆S0 |
| N7 | 0.073 | 0.552151 | 0.479141 |
| N8 | 0.089 | 0.583191 | 0.510921 |
| N15 | 0.042 | 0.312319 | 0.291013 |
| C2 | 0.017 | 0.192180 | 0.120014 |
| C5 | 0.042 | 0.320913 | 0.298301 |
| C9 | 0.021 | 0.207621 | 0.178101 |
| C10 | 0.020 | 0.206711 | 0.173191 |
| C18 | 0.008 | 0.098115 | 0.062930 |
| O19 | 0.042 | 0.3219180 | 0.291079 |
| O20 | -0.012 | − 0.012310 | -0.010130 |
| •OH radical (S = 5.310210) | |||
| O | 0.6921 3.341 | ||
| •O2− radical (S = 3.14101) | |||
Sites with relatively high softness and high Fukui functions are just mentioned in Table 2 and Fig. 11c. To know the best selectivity of the radical attack for the dye molecule and the bond cleavage center, we applied the softness-matching principle [61]. This principle is mainly based on the HSAB principles, which states the hard atoms react with hard atoms, and soft atoms react with other soft atoms. The values of softness mentioned in Table 2 for dye molecules and radical molecule clearly show that the dye molecule will interact highly with the •OH radical as compared to the •O2− radical because the softness values of dye molecule and •OH radical are closed to each other which justify that these molecules interacted strongly with each other during the dye degradation. Next, the value of local softness (S0) and difference of softness (∆S0) suggested that the N7 and N8 sites on N = N bond are the hot targets of •OH radical attack. The DFT computed descriptors indicate that the cleavage of N—N bond is more favorable than the N—C bond cleavage. These findings are in good agreement with the previously reported studies [62, 63]. Thus the DFT computation predicts that •OH radical attack is more preferable than the •O2− radical and also clarifies the dye degradation process by showing the bond cleavage sites.
The photocatalytic activity of the recycled Fe3O4 NPs and Fe3O4/ZrO2 NPs was also evaluated in order to check its sustainability under the same experimental conditions as a function of irradiation time. The sustainability of both photocatalysts was investigated by comparing the photodegradation efficiency of the fresh and recycled photocatalysts. Figure 13a, b shows the comparison of %degradation of MR dye photodegraded by fresh and recycled Fe3O4 NPsand Fe3O4/ZrO2 NPs, respectively. Figure 13 shows that the recycled photocatalysts also degraded significant quantities of dye but represent less photocatalytic activity than fresh photocatalysts. The results show that fresh Fe3O4 NPs degraded about 84 ± 1% while its recovered counterpart degraded 80.0 ± 1.0% within 40 min irradiation time. Similarly, the fresh Fe3O4/ZrO2 NPs degraded 91.0 ± 1.0% dye, while the recovered 84.0 ± 1.0% dye within 40 min. The advantages of Fe3O4/ZrO2 NPs over Fe3O4 NPs are the high photocatalytic activity, easy recyclability due to bulk nature and much sustainability. The efficiency of both the photocatalysts was also tested under visible light as a function of irradiation time. The activity of Fe3O4 and Fe3O4/ZrO2 NPs are investigated under UV/visible light, and the results are consolidated in the Figure. Figure 13c, d represents the %degradation comparison of MR dye under the UV and Vis-light photodegraded by Fe3O4 NPs and Fe3O4/ZrO2 NPs, respectively. The %degradation results show that both Fe3O4 and Fe3O4/ZrO2 NPs are photocatalytically activity under UV and visible light, but Fe3O4/ZrO2 NPs are more active than Fe3O4 NPs in both light regions.
Fig. 13.

Comparison of %degradation of MR dye photodegraded by a fresh and recycled Fe3O4 NPs b fresh and recycled Fe3O4/ZrO2 NPs (c) Fe3O4 NPs under UV and visible light (d) Fe3O4/ZrO2 NPs under UV and visible light (Dye concentration = 70 ppm, catalyst amount = 0.02 g)
The effect of tap water on the photodegradation of MR dye was also investigated by degrading MR dye solution (70 ppm) in tap water and carried out the reaction under UV light as a function of irradiation time.Figs. 14a, b displays MR dye degradation over Fe3O4and Fe3O4/ZrO2 NPs, before and after different UV-light irradiation. The photocatalytic activity of Fe3O4 NPs and Fe3O4/ZrO2 NPs in distilled water and tap water solution were compared, and the results are represented in Fig. 14c, d. Figure 14c shows the %degradation comparison of MR dye in distilled and tap water photodegraded by Fe3O4 NPs, which degraded about 84.0 ± 1.0% in distilled water and 96.0 ± 1.0% in tap water within 40 min irradiation time. Similarly, Fig. 14d demonstrates the %degradation comparison of MR dye in distilled and tap water photodegraded by Fe3O4/ZrO2 NPs. The results show that Fe3O4/ZrO2 NPs degraded about 91.0 ± 1.0% dye in distilled water and 97.0 ± 1.0% dye within 40 min.Such drastic enhancement in tap water might be due to the presence of the minerals ions present in tap water, which increases the photocatalytic activity of the photocatalysts [24].
Fig. 14.

U.V./Vis spectra of MR dye in tap water before reaction and after different UV-light irradiation times in the presence of a Fe3O4 NPs b Fe3O4/ZrO2 NPs c %degradation comparison of MR dye in distilled and tap water photodegraded by Fe3O4 NPs (d) %degradation comparison of MR dye in distilled and tap water photodegraded by Fe3O4/ZrO2 NPs (Dye concentration = 70 ppm in tap water, catalyst amount = 0.02 g)
Effect of photocatalyst dosage and initial dye concentration
The effect of increasing or decreasing the photocatalyst dosage may also change the rate of photodegradation of MR dye, and therefore, the impact of photocatalyst dosage is also evaluated. For this purpose, different quantities of catalysts were applied, and the results are consolidated in Fig. 15a. Figure 15a represents the %degradation of MR dye photodegraded by different quantity of both the photocatalysts. The results show that increasing catalyst amount up to a certain limit significantly enhances the rate of dye degradation and beyond increasing catalyst amount from that limit, no significant enhancement observed. The results show that 0.005 g of Fe3O4 NPsand Fe3O4/ZrO2 NPs degraded about 49 ± 1 and 60 ± 1%, while further increasing catalyst dosage to 0.03 g Fe3O4 NPs and Fe3O4/ZrO2 NPs degraded about 77 ± 1 and 82 ± 1%, respectively.The effect of initial dye concentration on the photodegradation of MR dye was also evaluated because industries discharge their effluents containing dyes at different concentrations. Figure 15b shows the %degradation of MR dye at various initial dye concentrations (50, 60, 70, 80, and 90 ppm) photodegraded by Fe3O4 NPs and Fe3O4/ZrO2 NPs. The Figure shows that dye degradation efficiency decreases as the initial MR dye concentration increases. It was found that at aminimum initial concentration of 50 ppm, Fe3O4 NPs and Fe3O4/ZrO2 NPs degraded about 80.0 ± 1.0% and 86.0 ± 1.0% dye while increasing initial dye concentration to 90 ppm, degradation efficiency decreases to 51.0 ± 1.0% and 56.0 ± 1.0%, respectively.
Fig. 15.

a % degradation of MR dye by different dosage of Fe3O4 NPs and Fe3O4/ZrO2 NPs (Dye concentration = 70 ppm, irradiation time = 20 min) b %degradation of MR dye at various initial concentrations photodegraded by Fe3O4 NPs and Fe3O4/ZrO2 NPs (Catalyst amount = 0.02 g, irradiation time = 20 min)
Conclusion
ZrO2 have a high surface area that not only act as stable support material but also increase the surface area of Fe3O4 NPs by homogenous dispersion. ZrO2 supported Fe3O4 NPs are well decorated and highly oxidizable due to its high surface area, while unsupported Fe3O4 NPs are highly agglomerated and are therefore less oxidized. The enhanced photocatalytic efficiency of Fe3O4/ZrO2 NPs is attributed to the uniform distribution of Fe3O4 NPs, which increases its surface area that provides more photoactive sites for synergistic dye and light energy adsorption on the ZrO2 surface followed by its rapid photodegradation by supported Fe3O4 NPs. The good sustainability of recycled Fe3O4/ZrO2 NPs is due to its easy recovery owing to its bulkiness and easy washing. The enhanced efficiency of photocatalysts in tap water is due to various mineral ions present in tap water, which might increase its activity. It was also found that the photodegradation of MR dye increase by increasing catalyst amount up to a certain limit and decreasing initial dye concentration. We believe that the newly developed Fe3O4 supported on ZrO2 could be useful photocatalyst for future industrial applications, especially for the remediation of waste materials and solar harnessing applications.
Acknowledgments
The authors acknowledge the department of Chemistry, Bacha Khan University Charsadda Pakistan, for providing research facilities and characterization tools.
Compliance with ethical standards
Conflict of interest
The authors declare that there is no conflict of interest.
Footnotes
Publisher’s note
Springer Nature remains neutral with regard to jurisdictional claims in published maps and institutional affiliations.
References
- 1.Mani P, Fidal VT, Bowman K, Breheny M, Chandra TS, Keshavarz T, Kyazze G. Degradation of azo dye (acid orange 7) in a microbial fuel cell: comparison between anodic microbial-mediated reduction and cathodic laccase-mediated oxidation. Front Energy Res. 2019 doi: 10.3389/fenrg.2019.00101. [DOI] [Google Scholar]
- 2.Ajaz M, Rehman A, Khan Z, Nisar MA, Hussain S. Degradation of azo dyes by Alcaligenes aquatilis 3c and its potential use in the wastewater treatment. AMB Expr. 2019;9:64. doi: 10.1186/s13568-019-0788-3. [DOI] [PMC free article] [PubMed] [Google Scholar]
- 3.Singh PK, Singh RL. Bio-removal of azo dyes: a review. Int J Appl Sci Biotechnol. 2017;5:108–126. doi: 10.3126/ijasbt.v5i2.16881. [DOI] [Google Scholar]
- 4.Zuorro A, Lavecchia R, Monaco MM, Iervolino G, Vaiano V. Photocatalytic degradation of azo dye reactive violet 5 on Fe-doped titania catalysts under visible light irradiation. Catalysts. 2019;9:645. doi: 10.3390/catal9080645. [DOI] [Google Scholar]
- 5.Gicevic A, Hindija L, Karacic A. Toxicity of azo dyes in pharmaceutical industry. Int Conf Med Biol Eng. 2019;581–87.
- 6.Foster SL, Estoque K, Voecks M, Rentz N, Greenlee LF. Removal of synthetic azo dye using bimetallic nickel-iron nanoparticles. J Nanomater. 2019 doi: 10.1155/2019/9807605. [DOI] [Google Scholar]
- 7.Ahmad MA, Ahmed NAB, Adegoke KA, Bello OS. Sorption studies of methyl red dye removal using lemon grass (Cymbopogoncitratus) Chem Data Collect. 2019;22:100249. doi: 10.1016/j.cdc.2019.100249. [DOI] [Google Scholar]
- 8.Hu Y, Zhang M, Xiao Z, Jiang T, Yan B, Li J. Photodegradation of methyl red under visible light by mesoporous carbon nitride. IOP Conf Ser Earth Environ Sci. 2018;121:022030. doi: 10.1088/1755-1315/121/2/022030. [DOI] [Google Scholar]
- 9.Narayan RB, Goutham R, Srikanth B, Gopinath KP. A novel nano-sized calcium hydroxide catalyst prepared from clam shells for the photodegradation of methyl red dye. J Environ Chem Eng. 2018;6:3640–3647. doi: 10.1016/j.jece.2016.12.004. [DOI] [Google Scholar]
- 10.Jyoti K, Singh A. Green synthesis of nanostructured silver particles and their catalytic application in dye degradation. J Genet Eng Biotechnol. 2016;14:311–317. doi: 10.1016/j.jgeb.2016.09.005. [DOI] [PMC free article] [PubMed] [Google Scholar]
- 11.Sahoo C, Gupta AK, Pal A. Photocatalytic degradation of Methyl Red dye in aqueoussolutions under UV irradiation using Ag+ doped TiO2. Desalination. 2005;181:91–100. doi: 10.1016/j.desal.2005.02.014. [DOI] [Google Scholar]
- 12.Dadfarnia S, Shabani AH, Moradi SE, Emami S. Methyl red removal from water by iron based metal-organic frameworks loaded onto iron oxide nanoparticle adsorbent. Appl Surf Sci. 2015;330:85–93. doi: 10.1016/j.apsusc.2014.12.196. [DOI] [Google Scholar]
- 13.Mayathevar R, Arulanandham X. Adsorption of reactive magenta and methyl red from aqueous solution using activated carbons. Int J Curr Res. 2018;10:72565–72574. [Google Scholar]
- 14.Zang Y. Removal of Methyl Red from aqueous solution by adsorption onto Mg-Al HTlc. Adv Mater Res. 2013;750–752:1426–1429. doi: 10.4028/www.scientific.net/AMR.750-752.1426. [DOI] [Google Scholar]
- 15.Zaheer Z, Asfar AA, Aazam ES. Adsorption of methyl red on biogenic Ag@Fe nanocomposite adsorbent: Isotherms, kinetics and mechanisms. J Mol Liq. 2019;283:287–298. doi: 10.1016/j.molliq.2019.03.030. [DOI] [Google Scholar]
- 16.Enenebeaku CK, Okorocha NJ, Uchechi EE, Ukaga IC. Adsorption and equilibrium studies on the removal of methyl red from aqueous solution using white potato peel powder. Int Lett Chem Phys Astron. 2017;72:52–54. doi: 10.18052/www.scipress.com/ILCPA.72.52. [DOI] [Google Scholar]
- 17.Muthuraman G, Teng TT. Extraction of methyl red from industrial wastewater using xylene as an extractant. Prog Nat Sci. 2009;19:1215–1220. doi: 10.1016/j.pnsc.2009.04.002. [DOI] [Google Scholar]
- 18.Abioye OP, Iroegu VT, Aransiola SA. Biodegradation of methyl red by staphylococcus aureus isolated from waste dump site. J Environ Sci Technol. 2015;8:131–138. doi: 10.3923/jest.2015.131.138. [DOI] [Google Scholar]
- 19.Zhao M, Sun P, Du L, Wang G, Jia X, Zhao Y. Biodegradation of methyl red by Bacillus sp. strain UN2: decolorization capacity, metabolites characterization, and enzyme analysis. Environ SciPollut Res. 2014;21:6136–6145. doi: 10.1007/s11356-014-2579-3. [DOI] [PubMed] [Google Scholar]
- 20.Sari IP, Simarani K. Decolorization of selected azo dye by Lysinibacillus fusiformis W1B6: biodegradation optimization, isotherm, and kinetic study biosorption mechanism. Adsorpt Sci Technol. 2019;37:492–508. doi: 10.1177/0263617419848897. [DOI] [Google Scholar]
- 21.Tavares MG, Silva LVA, Solano AMS, Tonholo J, Huitle CAM, Zanta CLPS. Electrochemical oxidation of Methyl Red using Ti/Ru0.3Ti0.7O2 and Ti/Pt anodes. ChemEng J. 2012;204–206:141–150. [Google Scholar]
- 22.Devi LG, Raju KSA, Kumar SG. Photodegradation of methyl red by advanced and homogeneous photo-Fenton’s processes: a comparative study and kinetic approach. J Environ Monit. 2009;11:1397–1404. doi: 10.1039/b900936a. [DOI] [PubMed] [Google Scholar]
- 23.Kankeu EF, Webster A, Ntwampe IO, Waanders FB. Coagulation/flocculation potential of polyaluminium chloride and bentonite clay tested in the removal of methyl red and crystal violet. Arab J Sci Eng. 2017;42:1389–1397. doi: 10.1007/s13369-016-2244-x. [DOI] [Google Scholar]
- 24.Khan I, Sadiq M, Khan I, Saeed K. Manganese dioxide nanoparticles/activated carbon composite as efficient UV and visible-light photocatalyst. Environ Sci Pollut Res. 2019;26:5140–5154. doi: 10.1007/s11356-018-4055-y. [DOI] [PubMed] [Google Scholar]
- 25.Saeed K, Khan I. Efficient photodegradation of neutral red chloride dye in aqueous medium using graphene/cobalt-manganese oxides nanocomposite. Turk J Chem. 2017;41:391–398. doi: 10.3906/kim-1606-44. [DOI] [Google Scholar]
- 26.Chiu Y, Chang TM, Chen C, Sone M, Hsu Y. Mechanistic insights into photodegradation of organic dyes using heterostructure photocatalysts. Catalysts. 2019;9:430. doi: 10.3390/catal9050430. [DOI] [Google Scholar]
- 27.Saeed K, Khan I, Gul T, Sadiq M. Efficient photodegradation of methyl violet dye using TiO2/Pt and TiO2/Pd photocatalysts. Appl Water Sci. 2017;7:3841–3848. doi: 10.1007/s13201-017-0535-3. [DOI] [Google Scholar]
- 28.Valaskova M, Tokarsky J, Pavlovsky J, Prostejovsky T, Kocí K. α-Fe2O3 nanoparticles/vermiculite clay material: structural, optical and photocatalytic properties. Materials. 2019;12:1880. doi: 10.3390/ma12111880. [DOI] [PMC free article] [PubMed] [Google Scholar]
- 29.Liu Y, Sun N, Hu J, Li S, Qin G. Photocatalytic degradation properties ofα-Fe2O3 nanoparticles for dibutyl phthalate in aqueous solution system. R Soc Open Sci. 2018;5:172196. doi: 10.1098/rsos.172196. [DOI] [PMC free article] [PubMed] [Google Scholar]
- 30.Hjiri M, Aida MS, Neri G. NO2 Selective sensor based on α-Fe2O3 nanoparticles synthesized via hydrothermal technique. Sensors. 2019;19:167. doi: 10.3390/s19010167. [DOI] [PMC free article] [PubMed] [Google Scholar]
- 31.Ma T, Zheng L, Zhao Y, Xu Y, Zhang J, Liu X. Highly porous double-shelled hollow hematite nanoparticles for gas sensing. ACS Appl Nano Mater. 2019;2:2347–2357. doi: 10.1021/acsanm.9b00228. [DOI] [Google Scholar]
- 32.Dissanayake DMSN, Mantilaka MMMGPG, Palihawadana TC, Chandrakumara GTD, Silva RTD, Pitawala HMTGA, Silva KMN, Amaratunga GAJ. Facile and low-cost synthesis of pure hematite (α-Fe2O3) nanoparticles from naturally occurring laterites and their superior adsorption capability towards acid-dyes. RSC Adv. 2019;9:21249–212257. doi: 10.1039/C9RA03756J. [DOI] [PMC free article] [PubMed] [Google Scholar]
- 33.Naz S, Islam M, Tabassum S, Fernandas NF, Blanco EJC, Zia M. Green synthesis of hematite (α-Fe2O3) nanoparticles using Rhus punjabensis extract and their biomedical prospect in pathogenic diseases and cancer. J Mol Struct. 2019;1185:1–7.
- 34.Ge Y, Hoque MIU, Qu Q. 1D Hematite-[α-Fe2O3]-nanorods prepared by green fabrication for supercapacitor electrodes. Electrochem Energy Technol. 2019;5:1–6. doi: 10.1515/eetech-2019-0001. [DOI] [Google Scholar]
- 35.Kim J, Hwang J, Sun Y. Hassoun JA single layer of Fe3O4@TiO2 submicron spheres as a high-performance electrode for lithium-ion microbatteries. Sustain Energy Fuels. 2019;3:2675–2687. doi: 10.1039/C9SE00259F. [DOI] [Google Scholar]
- 36.Harnchana V, Chaiyachad S, Pimanpang S, Saiyasombat C, Srepusharawoot P, Amornkitbamrung V. Hierarchical Fe3O4-reduced graphene oxide nanocomposite grown on NaCl crystals for triiodide reduction in dye-sensitized solar cells. Sci Rep. 2019;9:1494. doi: 10.1038/s41598-018-38050-z. [DOI] [PMC free article] [PubMed] [Google Scholar]
- 37.Kumar A, Rana A, Sharma G, Naushad M, Muhtaseb AA, Guo C, Juez AI, Stadler FJ. High-performance photocatalytic hydrogen production and degradation of levofloxacin by wide spectrum-responsive Ag/Fe3O4 bridged SrTiO3/g-C3N4 plasmonic nanojunctions: joint effect of Ag and Fe3O4. ACS Appl Mater Interfaces. 2018;10:40474–40490. doi: 10.1021/acsami.8b12753. [DOI] [PubMed] [Google Scholar]
- 38.Imran M, Abutaleb A, Ali MA, Ahamad T, Ansari AR, Shariq M, Lolla D, Khan A. UV light enabled photocatalytic activity of α-Fe2O3 nanoparticles synthesized via phase transformation. Mater Lett. 2020;258:126748. doi: 10.1016/j.matlet.2019.126748. [DOI] [Google Scholar]
- 39.Gebrezgiabher M, Gebreslassie G, Gebretsadik T, Yeabyo G, Elemo F, Bayeh Y, Thomas M, Linert W. A C-Doped TiO2/Fe3O4 nanocomposite for photocatalytic dye degradation under natural sunlight irradiation. J Compos Sci. 2019;3:75. doi: 10.3390/jcs3030075. [DOI] [Google Scholar]
- 40.Yin H, Zhao Y, Hua Q, Zhang J, Zhang Y, Xu X, Long Y, Tang J, Wang F. Controlled synthesis of hollow α-Fe2O3 microspheres assembled with ionic liquid for enhanced visible-light photocatalytic activity. Front Chem. 2019;7:58. doi: 10.3389/fchem.2019.00058. [DOI] [PMC free article] [PubMed] [Google Scholar]
- 41.Maji SK, Mukherjee N, Mondal A, Adhikary B. Synthesis, characterization and photocatalytic activity of a-Fe2O3 nanoparticles. Polyhedron. 2012;33:145–149. doi: 10.1016/j.poly.2011.11.017. [DOI] [Google Scholar]
- 42.RazipNIM,Lee KM, Lai CW, Ong BH. Recoverability of Fe3O4/TiO2nanocatalyst in methyl orange degradation. Mater Res Express. 2019;6(7).10.1088/2053-1591/ab176e
- 43.Galvis HMT, Bitter JH, Khare CB, Ruitenbeek M, Dugulan AI, Jong KP. Supported iron nanoparticles as catalysts for sustainable production of lower olefins. Science. 2012;335:835. doi: 10.1126/science.1215614. [DOI] [PubMed] [Google Scholar]
- 44.Lopez MCU, Lemus MAA, Hidalgo MC, Gonzalez RL, Owen PQ, Ruiz SO, Lopez SAU, Acosta J. Synthesis and characterization of ZnO-ZrO2 nanocomposites for photocatalytic degradation and mineralization of phenol. J Nanomater. 2019 doi: 10.1155/2019/1015876. [DOI] [Google Scholar]
- 45.Saeed K, Sadiq M, Khan I, Ullah S, Ali N, Khan A. Synthesis, characterization, and photocatalytic application of Pd/ZrO2 and Pt/ZrO2. Appl Water Sci. 2018;8:60. doi: 10.1007/s13201-018-0709-7. [DOI] [Google Scholar]
- 46.Kistan A, Kanchana V, Sakayasheela L, Sumathi J, Premkumar A, Selvam A, Ansari T. Titanium dioxide as a catalyst for photodegradation of various concentrations of methyl orange and methyl red dyes using Hg vapour lamp with constant pH. Orient J Chem. 2018;34:1000–1010. doi: 10.13005/ojc/340250. [DOI] [Google Scholar]
- 47.Singh NK, Saha S, Pal A. Methyl red degradation under UV illumination and catalytic action of commercial ZnO: a parametric study. Desalin Water Treat. 2015;56:1066–1076. doi: 10.1080/19443994.2014.942380. [DOI] [Google Scholar]
- 48.Patil SM, Deshmukh SP, More KV, Shevale VB, Mullani SB, Dhodamani AG, Delekar SD. Sulfated TiO2/WO3 nanocomposite: an efficient photocatalyst for degradation of Congo red and methyl red dyes under visible light irradiation. Mater Chem Phys. 2018 doi: 10.1016/j.matchemphys.2018.12.041. [DOI] [Google Scholar]
- 49.Kamel L, Anbia M. Preparation and evaluation of nanoporous-pyramids structured silicon powder as an effective photocatalyst for degradation of methyl red. Int J Environ Sci Technol. 2019;16:2101–2108. doi: 10.1007/s13762-017-1630-6. [DOI] [Google Scholar]
- 50.Samadi S, Khalili E, Ghasri MRA. Degradation of methyl red under visible light using N,F-TiO2/SiO2/rGO nanocomposite. J Electron Mater. 2019;48:7836–7845. doi: 10.1007/s11664-019-07585-w. [DOI] [Google Scholar]
- 51.Mishra K, Basavegowda N, Lee YR. Biosynthesis of Fe, Pd, and Fe–Pd bimetallic nanoparticles and their application as recyclable catalysts for [3 + 2] cycloaddition reaction: a comparative approach. Catal Sci Technol. 2015;5:2612–2621. doi: 10.1039/C5CY00099H. [DOI] [Google Scholar]
- 52.Kumar S, Kumar S, Tiwari S, Srivastava S, Srivastava M, Yadav BK, Kumar S, Tran TT, Dewan AK, Mulchandani A, Sharma JG, Maji S, Malhotra BD. Biofunctionalized nanostructured zirconia for biomedical application: a smart approach for oral cancer detection. Adv Sci. 2015;2:1500048. doi: 10.1002/advs.201500048. [DOI] [PMC free article] [PubMed] [Google Scholar]
- 53.Yang K, Peng H, Wen Y, Li N. Re-examination of characteristic FTIR spectrum of secondary layer in bilayer oleic acid-coated Fe3O4 nanoparticles. Appl Surf Sci. 2010;256:3093–3097. doi: 10.1016/j.apsusc.2009.11.079. [DOI] [Google Scholar]
- 54.Rashid H, Ahmad MS, Sadiq M, Aman R. Potent heterogenous catalyst for low temperature selective oxidation of cyclohexanol by molecular oxygen. J Chem. 2016 doi: 10.1155/2016/1254796. [DOI] [Google Scholar]
- 55.Singh AK, Nakate UT. Microwave synthesis, characterization, and photoluminescence properties of nanocrystalline zirconia. Sci World J. 2014 doi: 10.1155/2014/349457. [DOI] [PMC free article] [PubMed] [Google Scholar]
- 56.Kumar A, Guo C, Sharma G, Pathania D, Naushad M, Kalia S, Dhiman P. Magnetically recoverable ZrO2/Fe3O4/chitosan nanomaterials for enhanced sunlight driven photoreduction of carcinogenic Cr(vi) and dechlorination & mineralization of 4-chlorophenol from simulated waste water. RSC Adv. 2016;6:13251–13263. doi: 10.1039/C5RA23372K. [DOI] [Google Scholar]
- 57.Khan I, Qurashi A. Shape controlled synthesis of copper vanadate platelet nanostructures, their optical band edges, and solar-driven water splitting properties. Sci Rep. 2017;7. [DOI] [PMC free article] [PubMed]
- 58.Boruah PK, Borthakur P, Darabdhara G, Kamaja CK, Karbhal I, Shelke MV, Phukan P, Saikia D, Das MR. Sunlight assisted degradation of dye molecules and reduction of toxic Cr(vi) in aqueous medium using magnetically recoverable Fe3O4/reduced graphene oxide nanocomposite. RSC Adv. 2016;6:11049–11063. doi: 10.1039/C5RA25035H. [DOI] [Google Scholar]
- 59.Kambur A, Pozan GS, Boz I. Preparation, characterization and photocatalytic activity of TiO2–ZrO2 binary oxide nanoparticles. Appl Catal B-Environ. 2012;115–116:149–158. doi: 10.1016/j.apcatb.2011.12.012. [DOI] [Google Scholar]
- 60.Frisch MJ, Trucks GW, Schlegel HB, Scuseria GE, Robb MA, Cheeseman JR, Scalmani G, Barone V, Mennucci B, Petersson GA, et al. Gaussian 09, revision C.01. Wallingford: Gaussian, Inc; 2009. [Google Scholar]
- 61.Vos AM, Nulens KHL, Proft FD, Schoonheydt RA, Geerlings P. Reactivity descriptors and rate constants for electrophilic aromatic substitution: acid zeolite catalyzed methylation of benzene and toluene. J Phys Chem B. 2002;106:2026–2034. doi: 10.1021/jp014015a. [DOI] [Google Scholar]
- 62.Wahab OO, Olasunkanmi LO, Govender KK, Govender PP. A DFT study of disperse yellow 119 degradation mechanism by hydroxyl radical attack. ChemistrySelect. 2018;3:12988–12997. doi: 10.1002/slct.201802904. [DOI] [Google Scholar]
- 63.Turkten N, Cinar Z. Photocatalyticdecolorization of azo dyes on TiO2: Prediction of mechanism via conceptual DFT. Catal Today. 2017;287:169–175. doi: 10.1016/j.cattod.2017.01.019. [DOI] [Google Scholar]