

Abstract
Purpose:
This report introduces and validates a new diffusion MRI based method termed MRI-Cytometry that can non-invasively map intravoxel, non-parametric cell size distributions in tissues.
Methods:
MRI was used to acquire diffusion-weighted signals with a range of diffusion times and gradient factors, and a model was fit to these data to derive estimates of cell size distributions. We implemented a two-step fitting method to avoid noise-induced artificial peaks and provide reliable estimates of tumor cell size distributions. Computer simulations in silico and experimental measurements on cultured cells in vitro and animal xenografts in vivo were used to validate the accuracy and precision of the method. Tumors in seven patients with breast cancer were also imaged and analyzed using this MRI-Cytometry approach on a clinical 3T MRI scanner.
Results:
Simulations and experimental results confirm MRI-Cytometry can reliably map intravoxel, non-parametric cell size distributions and has the potential to discriminate smaller and larger cells. The application in breast cancer patients demonstrates the feasibility of direct translation of MRI-Cytometry to clinical applications.
Conclusion:
The proposed MRI-Cytometry method can characterize non-parametric cell size distributions in human tumors, which potentially provides a practical imaging approach to derive specific histopathological information on biological tissues.
Keywords: MRI, diffusion, cytometry, distribution, cell size, volume fraction, oscillating gradient
INTRODUCTION
Cell size is one of the fundamental properties of living cells and plays an important role in metabolism(1), proliferation (2), and cell death (3). At the organ level, biological tissues contain a large variety of cells with different sizes. Most epithelial tissues show a “striking regularity” in cell size, and size heterogeneity often indicates neoplastic growth (4). Therefore, quantifying cell size distributions may provide important information on the state of tissues for diagnosis or monitoring responses to interventions. Currently, cell size information is widely used in blood analyses of anemia (5,6) and cancer (7) but its full potential has not been realized in solid tumors. Biopsy is the standard-of-care method for cell size measurements, but it is invasive, especially for tumors in critical organs. Therefore, it would be valuable to characterize cell size information using non-invasive imaging methods.
Several attempts have been made to acquire cell size information using Diffusion-weighted magnetic resonance imaging (DWI); however, it remains challenging to accurately estimate cell size distributions non-invasively. Two approaches have been reported to overcome this challenge: measuring mean cell size and pre-defining a parametric distribution function for cell size. The first approach measures mean cell size only, simplifying the problem and retaining the most important histopathological information. Mean axon sizes have been measured using q-space imaging (8), AxActive (9), DDE (double diffusion encoding) (10), and qTDS (quantitative temporal diffusion spectroscopy) (11) methods. Mean cell sizes in tumors have been measured using VERDICT (vascular, extracellular and restricted diffusion for cytometry in tumors) (12,13), IMPULSED (imaging microstructural parameters using limited spectrally edited diffusion) (14,15), and POMACE (pulsed and oscillating gradient MRI for assessment of cell size and extracellular space) methods (16). However, these methods do not characterize cell size heterogeneity, which may itself be a diagnostic biomarker. The second approach pre-defines a parametric distribution function for cell size, such as a gamma distribution (17). This analysis provides information on the heterogeneity of cell sizes while adding only one more fitting parameter compared with the first approach. However, cell size distributions likely change during disease progression and in response to treatment (4) making it is inappropriate to pre-define a specific functional form of cell size distributions. Therefore, there is a need to develop an imaging method that can characterize cell size distribution without any pre-defined functional forms.
Estimating non-parametric compartment size distributions without a priori knowledge of the distribution function has been performed to estimate: (i). pore size distribution of glass capillaries (18); (ii) non-parametric axon size distributions in fixed tissues using PGSE (pulse gradient spin echo) (19), NOGSE (non-uniform oscillating gradient spin echo) (20), or DDE (21); and (iii) cell size distributions in asparagus and animal allografts (22). All of these methods addressed the complex optimization problems without assuming any specific distribution forms, ensuring the generalizability of both normal and abnormal tissues. However, these approaches either used special preclinical hardware or focused on animal applications only.
Here, we introduce a new framework, MRI-Cytometry, that estimates cell size distribution without a priori knowledge using clinical MRI scanners. We report the theoretical basis that links DWI signals to cell size distributions and provide validation of MRI-Cytometry using computer simulations in silico, cell culture experiments in vitro, and animal xenograft experiments in vivo. We also show its clinical applicability in patients with breast cancer.
THEORY
Assumptions
Similar to previous studies (12,14,16,23), MRI-Cytometry assumes DWI signals arise from two compartments, i.e., intra- and extracellular spaces without transcytolemmal water exchange. The following assumptions were made.
Intracellular diffusion: Cells are modeled as spheres (12,14,16,23). Each spherical cell has a cell size, i.e., diameter d and an intracellular diffusion coefficient Din, both of which can differ from cell to cell. For example, a cell in an early apoptotic stage may have both smaller d and Din than a normal cell (24). Therefore, each image voxel contains cells characterized by P(d) and P(Din), the distributions of d and Din, respectively. This is more realistic than the assumption of a mean cell size and a single for all cells.
Extracellular diffusion: We adapt the concept of spin packets (25) for extracellular diffusion. The extracellular DWI signals are described as a sum of signals from a large number of individual spin packets originating from different positions in the extracellular spaces within the voxel. Each spin packet has its own diffusion time-dependent diffusion coefficient which can be approximated as (14) Dex = Dex0 + βexf when a narrow frequency range is used, where f is the gradient frequency, Dex0 represents Dex at very long diffusion time, and βex is the diffusion dispersion rate. Because spin packets originate from different positions, diffuse through different pathways, and encounter different restrictions and hindrances, a voxel contains both P(Dex0) and P(βex), the distributions of Dex0 and βex, respectively. This is different from previous studies that assumed a single extracellular diffusion coefficient (12).
Transcytolemmal exchange: Transcytolemmal water exchange is ignored here. This assumption has been widely used in other cell size measurements such as IMPULSED (14,24) and VERDICT (12). This could bias the estimation of intracellular volume fraction but may not affect the estimation of mean cell size (26).
Basic equation
The DWI signals of a voxel can be written as
| [1] |
and , v(d) = πd3/6 is cell volume, Pin(d, Din) is the normalized distribution function of the number of cells with a diameter d and an intracellular diffusivity Din, Pex(Dex0, βex) is the normalized distribution function of the number of spin packets with Dex0 and βex, ρin and ρex are the T2-weighted intra- and extracellular DWI signals per unit volume, respectively, and sin is intracellular signal attenuation of an impermeable spherical cell. The analytical equations for sin linking geometric features (d and Din) to DWI signals have been reported for sine- and cosine-modulated gradient waveforms (27) and cosine-modulated trapezoidal OGSE waveforms (23). Unlike previous studies that enforced a known distribution function (28), Eq. [1] does not assume any specific distribution function for any microstructural parameters.
A general fit of Eq. [1] to data is a complex non-linear optimization problem, especially with the inclusion of variable cell volumes (see below). To address the difficulty of directly fitting Eq.[1] to data reliably, we propose the following two-step fitting approach.
MRI-Cytometry fitting – step#1
Discretization of signal equation
First, we define two weighting parameters: is proportional to the cell-volume-weighted distribution of the number of cells with d and Din and wex = ρexPex(Dex0, βex) is proportional to the distribution of spin packet volumes with Dex0 and βex. Second, Eq. [1] can be discretized based on physiologically relevant parameter ranges, i.e., 0 ≤ d ≤ dmax, 0 ≤ Din, Dex0 ≤ Dfree, and 0 ≤ βex ≤ βex,max. dmax denotes the largest cell size that can be reliably fit depending on the longest diffusion time used in acquisition e.g. in this study dmax is set as 25 μm because the root-mean-square displacement of free water diffusion for tdiff = 70 ms is ~21 μm. The βex,max = 10 μm2 was determined by previous simulations and animal studies in vivo (24). We empirically discretize d, Din, Dex0, and βex with N = 50, M = 16, P = 16, and Q = 21 possible values, respectively. Larger numbers of possible parameter values can increase the “resolution” in the parameter space but will significantly increase the computing time. Therefore, for a number of K measurements (each with a combination of experimental parameters such as tdiff and b value), Eq. [1] can be discretized as the kth measurement becomes
| [2] |
here and sin(d(n), Din(m)|bk, fk) are the intracellular signal fraction and signal arising from a combination of d(n) and Din(m), respectively, and wex(p,q) is the extracellular signal fraction arising from spin packets with a combination of Dex0(p), and βex(q).
Construction of a dictionary (signal basis matrix)
We create a dictionary containing all possible intra- and extracellular signal forms. Specifically, Eq.[2] can be rewritten as
| [3] |
Where M is the basis signal matrix (dictionary) containing both intra- and extracellular signal forms: min(n,m|k) = sin(d(n), Din(m)|bk, fk), and mex(p,q|k) = exp[−bk(Dex0(p) + βex(q) f)]. Note that any , wex(…) ≥ 0.
Fitting
We use a regularized non-negative least-squares (NNLS) analysis (29–31) to fit Eq.[3] to data. This approach incorporates a priori information of non-negative signal intensities and finite signal energy to prevent the non-negative least-squares analysis from over-fitting the noisy data while retaining the numerical accuracy of the solution. The resulting regularized non-negative least-squares problem formulation is given as
| [4] |
Where I is a unity matrix with a size of N × M + P × Q and ξ is a regularization penalty parameter. Of note, larger values of ξ result in more regularization but increase fitting errors, while smaller ξ may decrease fitting errors while increasing the risk of overfitting. We used computer simulations to empirically determine ξ = 0.01 to achieve reasonable fits in the presence of experimental noise with SNR < 150 on T2w images.
Fitting results – step#1
After the regularized NNLS fitting, the vector w′ can be split and converted into two matrices, i.e., a N × M matrix for intracellular and a P × Q wex matrix for extracellular spaces. The projection of each matrix to each dimension provides a distribution. Namely, the cell-volume-weighted cell size distribution can be obtained as
| [5] |
the distribution function for extracellular diffusion coefficient at long diffusion times as
| [6] |
and the distribution of βex as
| [7] |
Note that P(Din), the distribution of Din, will be obtained in step#2 (see below). In addition to the distributions of microstructural parameters, some other parameters can also be estimated using MRI-Cytometry. For example, the apparent intracellular volume fraction can be calculated as
| [8] |
and the cell-volume-weighted mean cell size
| [9] |
MRI-Cytometry fitting – step#2
The fitted Pvw(d) is cell-volume-weighted, which may not meet the needs of many biological and clinical studies that require true cell size distribution (5). A natural approach to convert cell-volume-weighted cell size distributions to cell size distributions is
| [10] |
However, this is usually not optimal in practice because this conversion serves as a low-pass filter that could amplify noise-induced artificial peaks in the distribution which appear at small cell sizes. To overcome this problem, we adopt a second fitting step.
Based on the obtained in step#1, the fitted intracellular signals Sin can be obtained as
| [11] |
We then generate another basis matrix (dictionary) for intracellular diffusion only, namely,
| [12] |
Where Min is the intracellular signal basis matrix and win(n,m) is proportional to the distribution of the number of cells with a combination of dn and Din(m). Like the fittings in step#1, we perform another regularized NNLS fitting as
| [13] |
Where Iin is a unity matrix with a size of N ×M and ξ2 is a regularization penalty parameter usually different from ξ in step#1. We used computer simulations to find ξ2 in the range of 0.0001 to 0.001 could provide reasonable estimations and empirically determine ξ2 = 0.0005 throughout this work. Finally, the fitted win can be converted to a N × M matrix and the projections to each dimension provide the distributions of d and Din, respectively. Namely,
| [14] |
and
| [15] |
Moreover, the overall mean cell size can be obtained as
| [16] |
mean intracellular diffusivity as
| [17] |
and the standard deviation of cell sizes as
| [18] |
Figure 1 shows the diagram of the two-step MRI-Cytometry fitting of a simulated tissue with a Gaussian cell size distribution (actual mean cell size μm with a standard deviation σd = 3 μm). Details of all other simulation parameters can be found in the Simulation section.
Figure 1.
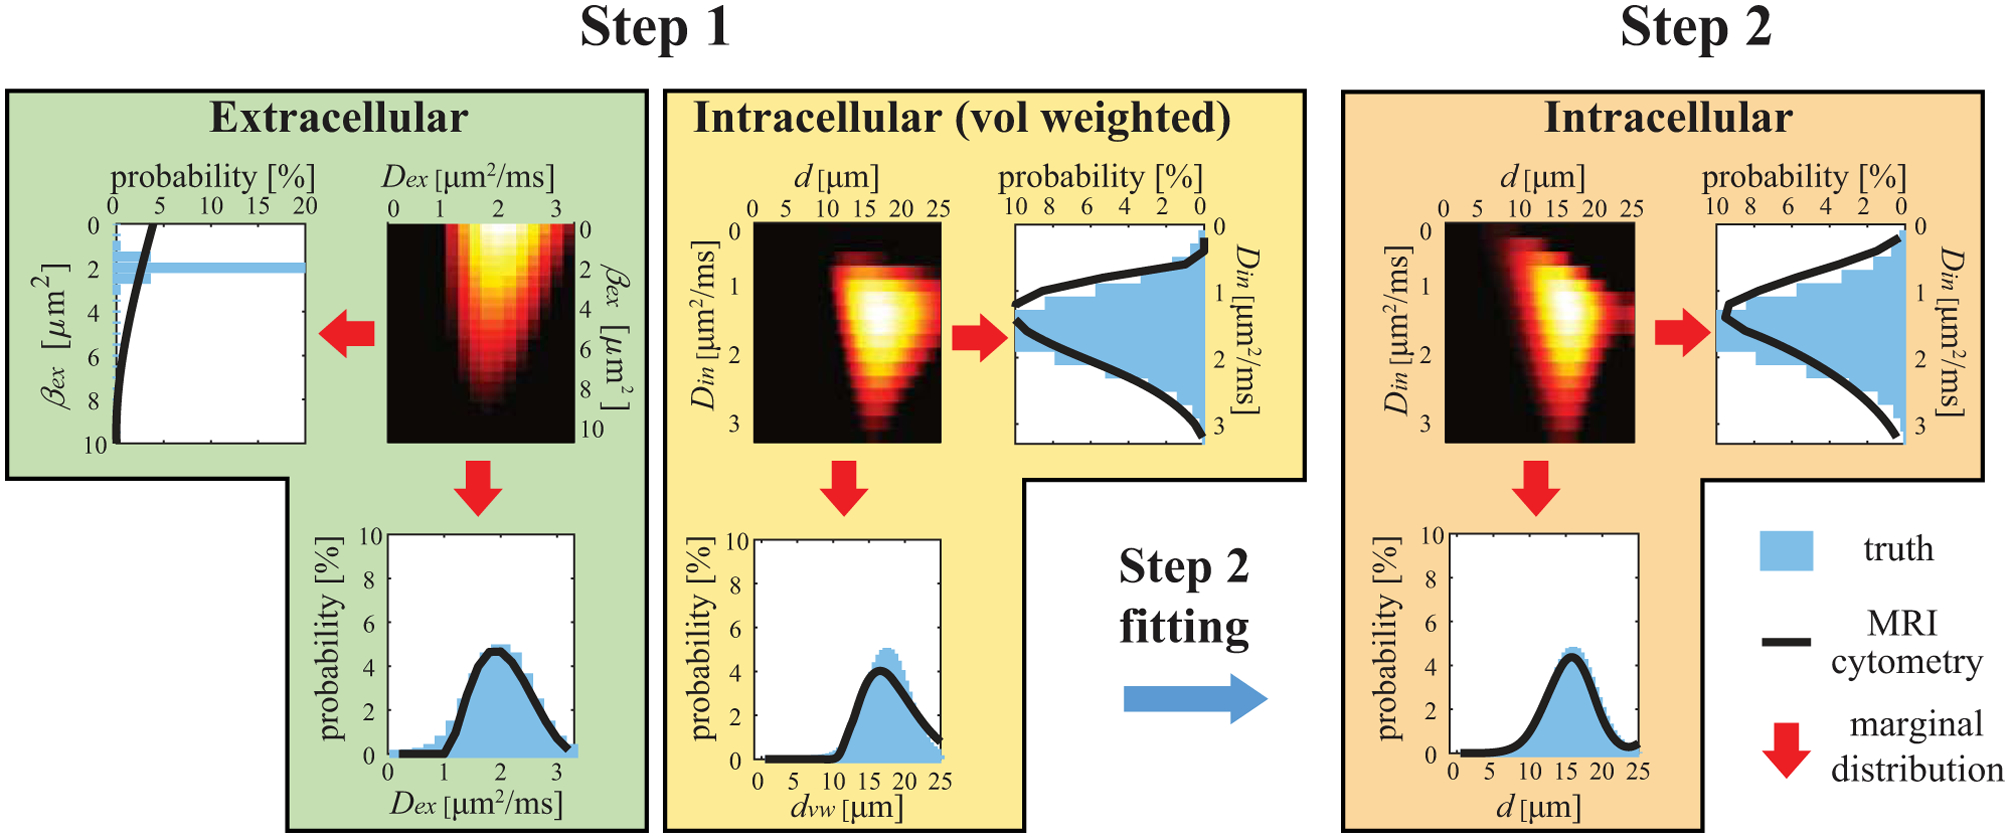
Diagram of two-step MRI-Cytometry fitting of a simulated tissue with a Gaussian cell size distribution. The calculations of marginal distributions are shown in Eqs.[5], [6], [7], [10], [14], and [15].
METHODS
Because MRI-Cytometry is a general framework, we used the data acquired previously for IMPULSED (23), including validation data using cultured cells, animal xenografts, and in vivo data from patients with breast cancer; however, we use the analyses described above. We generated new simulation data, in which the ground-truth microstructural parameters followed distributions of values, in contrast to the single values used in the IMPULSED simulations. All acquisition details for experiments in cultured cells, animal xenografts, and breast cancer patients have been reported previously (23). Brief descriptions are provided below.
Acquisition protocol
All studies in this work, including computer simulations, cultured cells, animal xenografts, and cancer patients, used the same protocols as in (23). Briefly, three acquisitions with effective diffusion times 70, 10, and 5 ms, respectively, were used with the highest b values of 1800 s/mm2, 1000 s/mm2, and 300 s/mm2, respectively. The highest gradient strength was 80 mT/m, gradient rise time 0.9 ms, and the total scan time ~7 mins.
Computer simulations in silico
DWI signals were generated using Eq.[2] with distributions of d, Din, Dex0, and βex and noise at different signal-to-noise ratios (SNR). Each simulation was repeated 100 times each with different noise but at the same SNR level to investigate the accuracy and precision of MRI-Cytometry. For simplicity, all input parameters were selected to obey Gaussian distributions. Unless otherwise specified, the distributions used in terms of (mean, STD, discretization step) were (16, 2, 0.5) μm, (1.58, 0.5, 0.2) μm2/ms, (2, 0.5, 0.2) μm2/ms, and (2, 0.25, 0.25) μm2 for of d, Din, Dex0, and βex, respectively. These values were determined from our previous fittings of solid tumors (15,32,33). The input vin was 70%. Four specific simulations were performed:
Influence of SNR. Six SNRs (20, 40, 60, 80, 150, and ∞) were simulated to investigate how SNR affects MRI-Cytometry results.
Influence of distribution median. Five medians (dcen = 4, 8, 12, 16, and 20 μm) with the same σd = 2 μm were simulated.
Influence of distribution width. Five standard deviations (σd = 1, 2, 3, 4, and 5 μm) with the same median cell size of dcen = 16 μm were simulated.
Influence of bi-modal distribution. A bi-model distribution consisting of two peaks (8(2) and 16(2) μm in terms of median(STD)) with five different vd,small values, i.e., cell number fractions of the small cells were simulated at SNR = 40. d = 10 μm was used as the threshold to separate small and large cells.
Validation using cultured cells in vitro
Three types of breast cancer cell lines (MDA-MB-231, MCF7, and MDA-MB-453), one acute T cell leukemia (Jurkat) cell line (all purchased from American Type Culture Collection (Manassas, Virginia, USA)) and the mixture of primary lymphocytes (extracted from human peripheral blood) were prepared from either culture or separation, and then pelleted for MRI experiments. Light microscopy was used to estimate the true cell size distribution.
Validations using animal xenografts in vivo
All procedures were approved by the Institutional Animal Care and Usage Committee at Vanderbilt University Medical Center. MDA-MB-231 (n = 6) and two MCF7 (n = 4) subcutaneous xenografts in the hind limbs were developed in female Athymic nude mice (Harlan Laboratories, Inc., Indianapolis, IN). Animals were scanned on a Varian/Agilent 4.7T MRI when tumor sizes reached 200 – 300 mm3 and then euthanized for histology using H&E staining for cellularity and Na+/K+-ATPase (ab76020, Abcam) staining for cell size. Histology images were analyzed using CellProfiler™ to obtain quantitative information on cell sizes.
Applications in patients
The human imaging study was approved by the Institutional Review Board at Vanderbilt University Medical Center. Following written informed consent, seven female patients with breast cancer (age 55.3±8.0 years) with tumors ≥ 1 cm were recruited. All human imaging was performed on a Philips 3T Achieva MRI scanner using a 16-channel breast coil.
Data analyses
All DWIs were co-registered to T2-weighted b = 0 images using FSL (34,35) to reduce motion-induced artifacts. Regions-of-interest (ROIs) were manually drawn on PGSE DWIs with b = 1000 s/mm2. MRI-Cytometry data fittings were performed using in-house code with Matlab (Mathworks, Natick, Massachusetts) inside ROIs only. As a means of validation, MRI-Cytometry derived cell size distributions were compared with light-microscopy or histology derived distributions in the cultured cells and animal xenografts studies, respectively.
RESULTS
Computer simulations in silico
Figure 2 shows the influence of SNR on the MRI-Cytometry fits. Except for βex, the mean distributions of 100 repeats of all other parameters match the ground-truth distributions, suggesting reasonably good accuracy of MRI-Cytometry. Even without noise, MRI-Cytometry still cannot fit P(βex) accurately, indicating MRI-Cytometry has very low sensitivity to βex. Recall that Pcal(d) is the cell size distribution calculated directly from the cell-volume-weighted size distribution Pvw(d) using Eq.[10]. Because Eq.[10] serves as a low-pass filter, Pcal(d) shows large artificial peaks at small cell sizes, which are presumably caused by noise. These artificial peaks are removed in P(d) obtained by the step#2 MRI-Cytometry.
Figure 2.
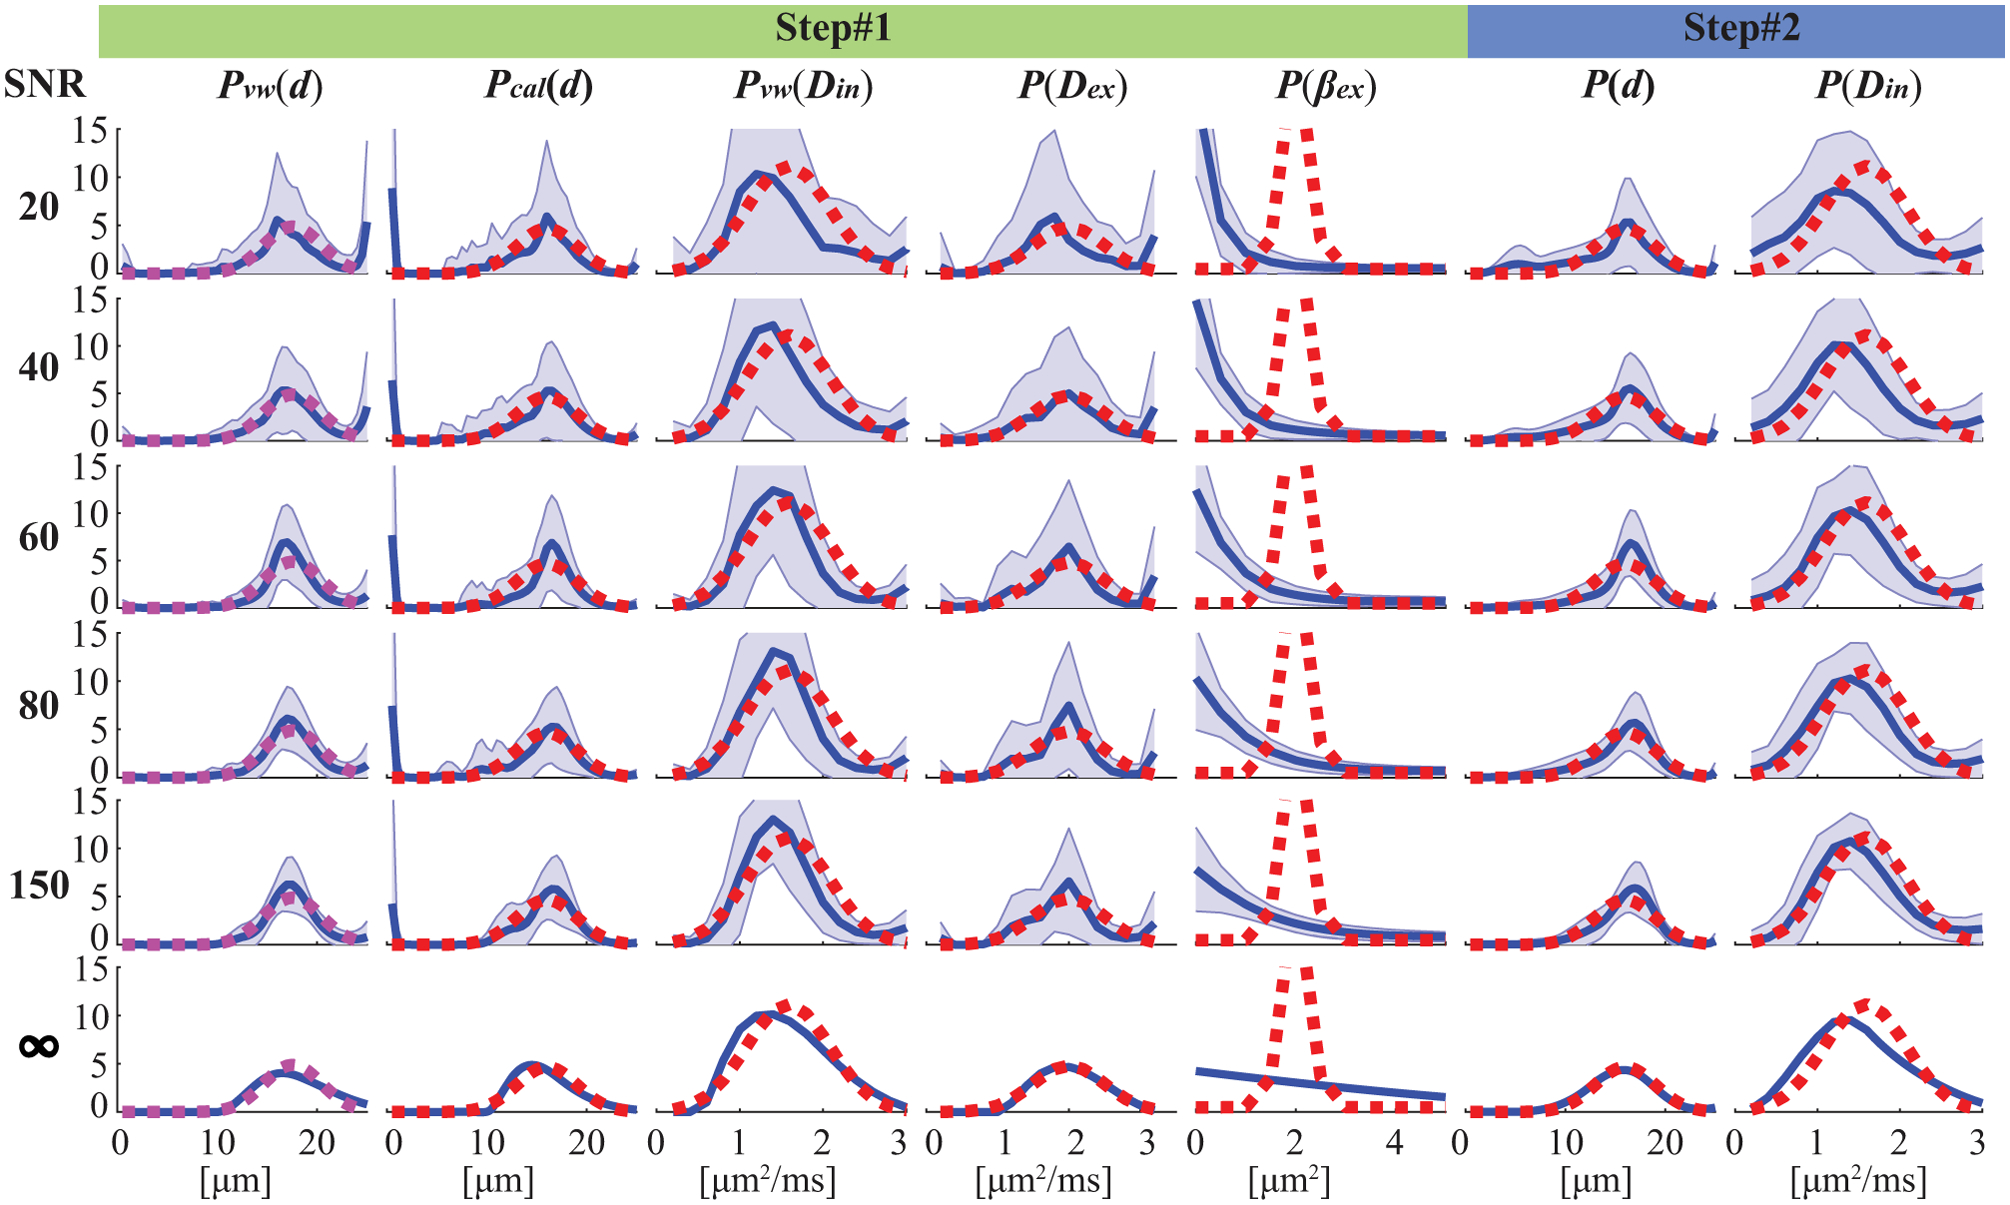
Simulated influence of noise at different SNR levels on MRI-Cytometry fitted distributions of microstructural parameters. For each SNR, the fittings were repeated 100 times each with different noise but at the same SNR level. The red dash lines represent the ground truth, blue solid lines represent the mean fitted distributions of 100 repeats, and the shaded areas represent standard deviations.
The shaded areas in Figure 2 are standard deviations of 100 repeated fits, representing fitting precisions. SNR has a very strong impact on fitting precisions of all distributions obtained with MRI-Cytometry. For typical SNRs such as from 20 to 60 on human scanners, the precisions are relatively low. For SNR=150, the precision is significantly improved, especially for P(d) and P(Din), and their corresponding coefficients of variation are less or around 10%, indicating reasonably accurate fittings. This is encouraging because a recent report (36) has shown that voxel-wise SNR=150 is achievable in DWI on clinical MRI scanners. It does, however, result in increased scan times (4 acquisitions) and decreased spatial resolution (2.5×2.5×5 mm). Note that P(d) and P(Din) obtained by step#2 above show much higher precisions than those of Pcal(d) and Pvw(Din) obtained in step#1, indicating the regularization in step#2 further minimizes the influence of noise. This is another benefit of the two-step approach, in addition to improving accuracy by removing artificial peaks at small cell sizes.
Figure 3 shows the influences of mean cell sizes on MRI-Cytometry fits at SNR=40, a typical SNR achievable in our human breast cancer scans. MRI-Cytometry overestimates P(d) at smaller μm, while providing more accurate estimations of P(d) for larger . Similarly, estimates of P(Din) are significantly biased at smaller and the accuracy increases at larger . This is expected because the detection sensitivity to cell size and intracellular diffusivity decreases at smaller restriction sizes. Figure 3b summarizes the accuracy and precision of MRI-Cytometry derived parameters dependent on . The estimated vin seems independent of . Both and reflect the change in . The large standard deviations of suggest that it is hard to estimate reliably, consistent with our previous findings in IMPULSED (23). The fitted σd (standard deviations of each fitted P(d)) shows good accuracy but lower precision. The coefficient of variation of d (COV(d)) decreases to ~ 10% only when μm, indicating P(d) width can be reliably fit only with larger using the current acquisitions.
Figure 3.
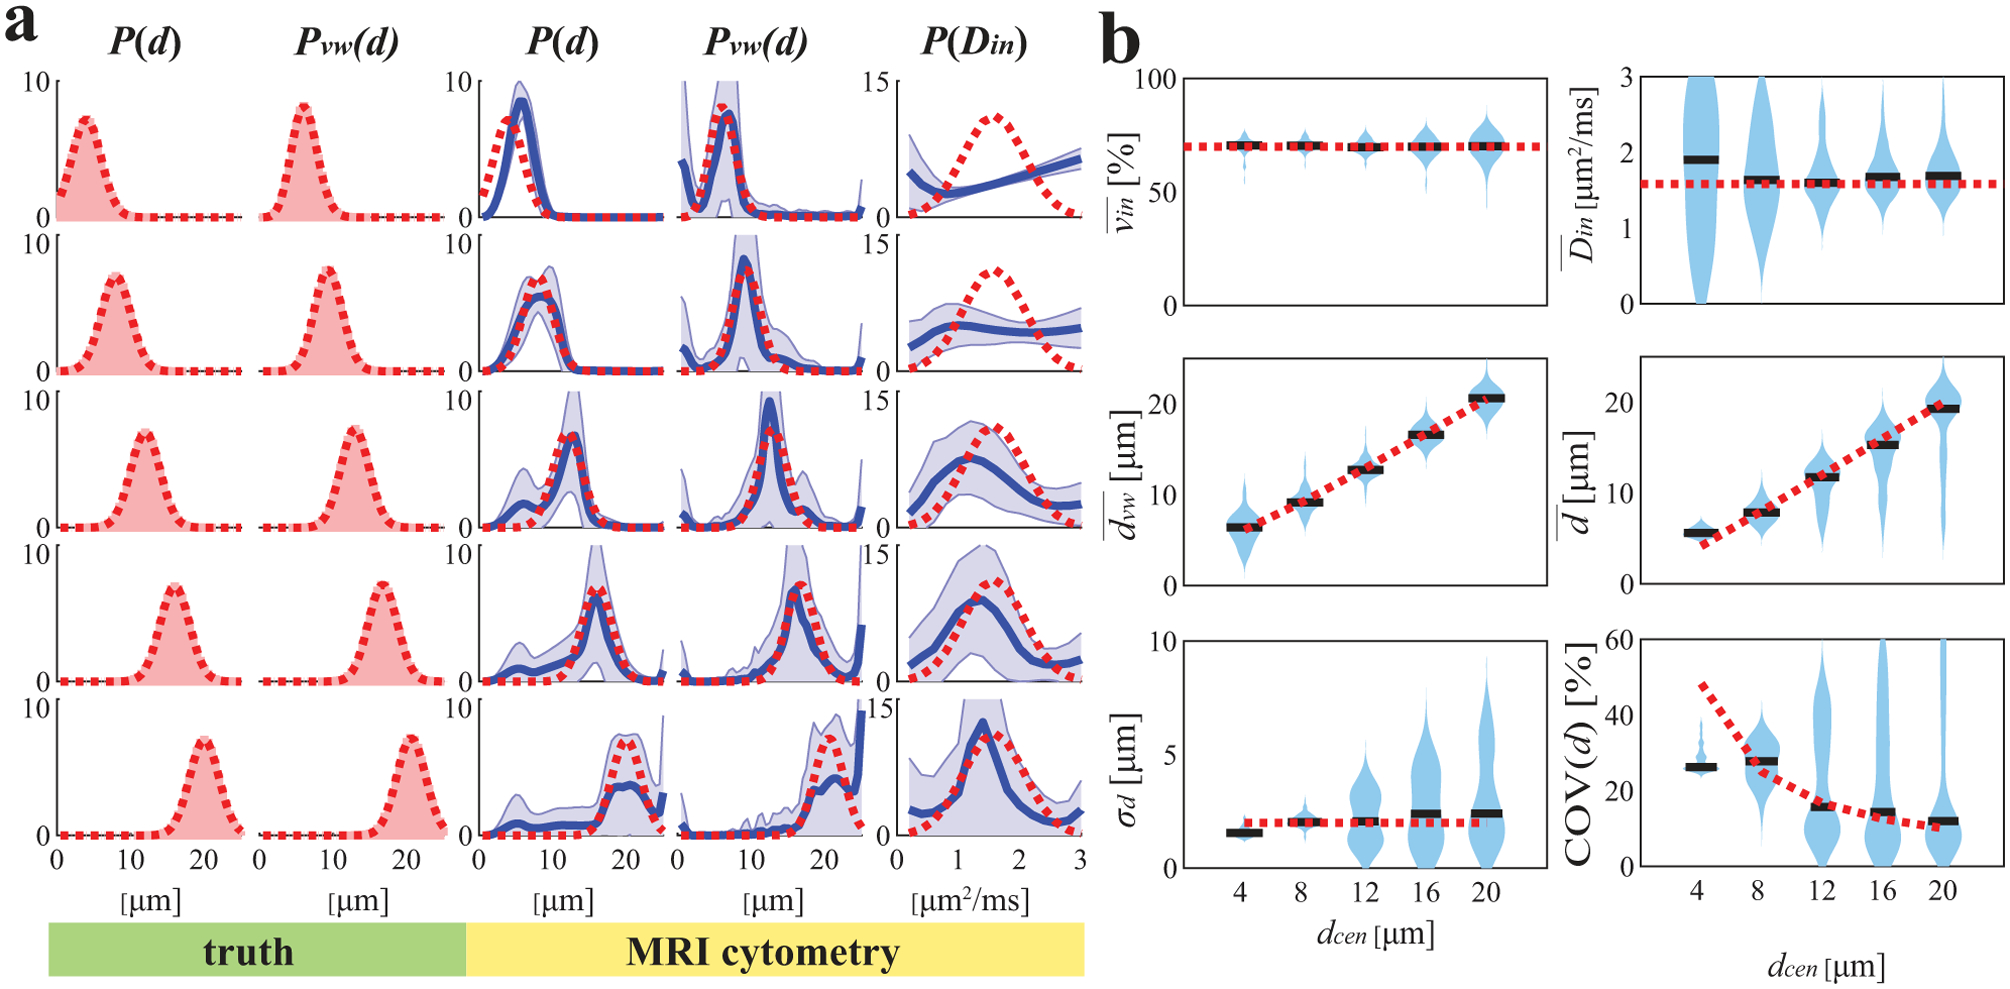
Simulated influence of true median cell size on MRI-Cytometry fitted (a) distributions of microstructural parameters and (b) MRI-Cytometry derived parameters. Figure legends are the same in Figure 2.
Figure 4 shows the influences of the width of P(d) (in terms of STD) on MRI-Cytometry fits when μm. Although vin, , , and can be fit with reasonable accuracy, MRI-Cytometry derived σd overestimates the width of P(d) when ground-truth σd is < 2 μm. On the other hand, it underestimates the width of P(d) when ground-truth σd > 3 μm. COV(d) is larger than 10%, indicating it is challenging to fit P(d) width reliably at SNR = 40. Therefore, MRI-Cytometry provides higher accuracy to estimate than σd.
Figure 4.
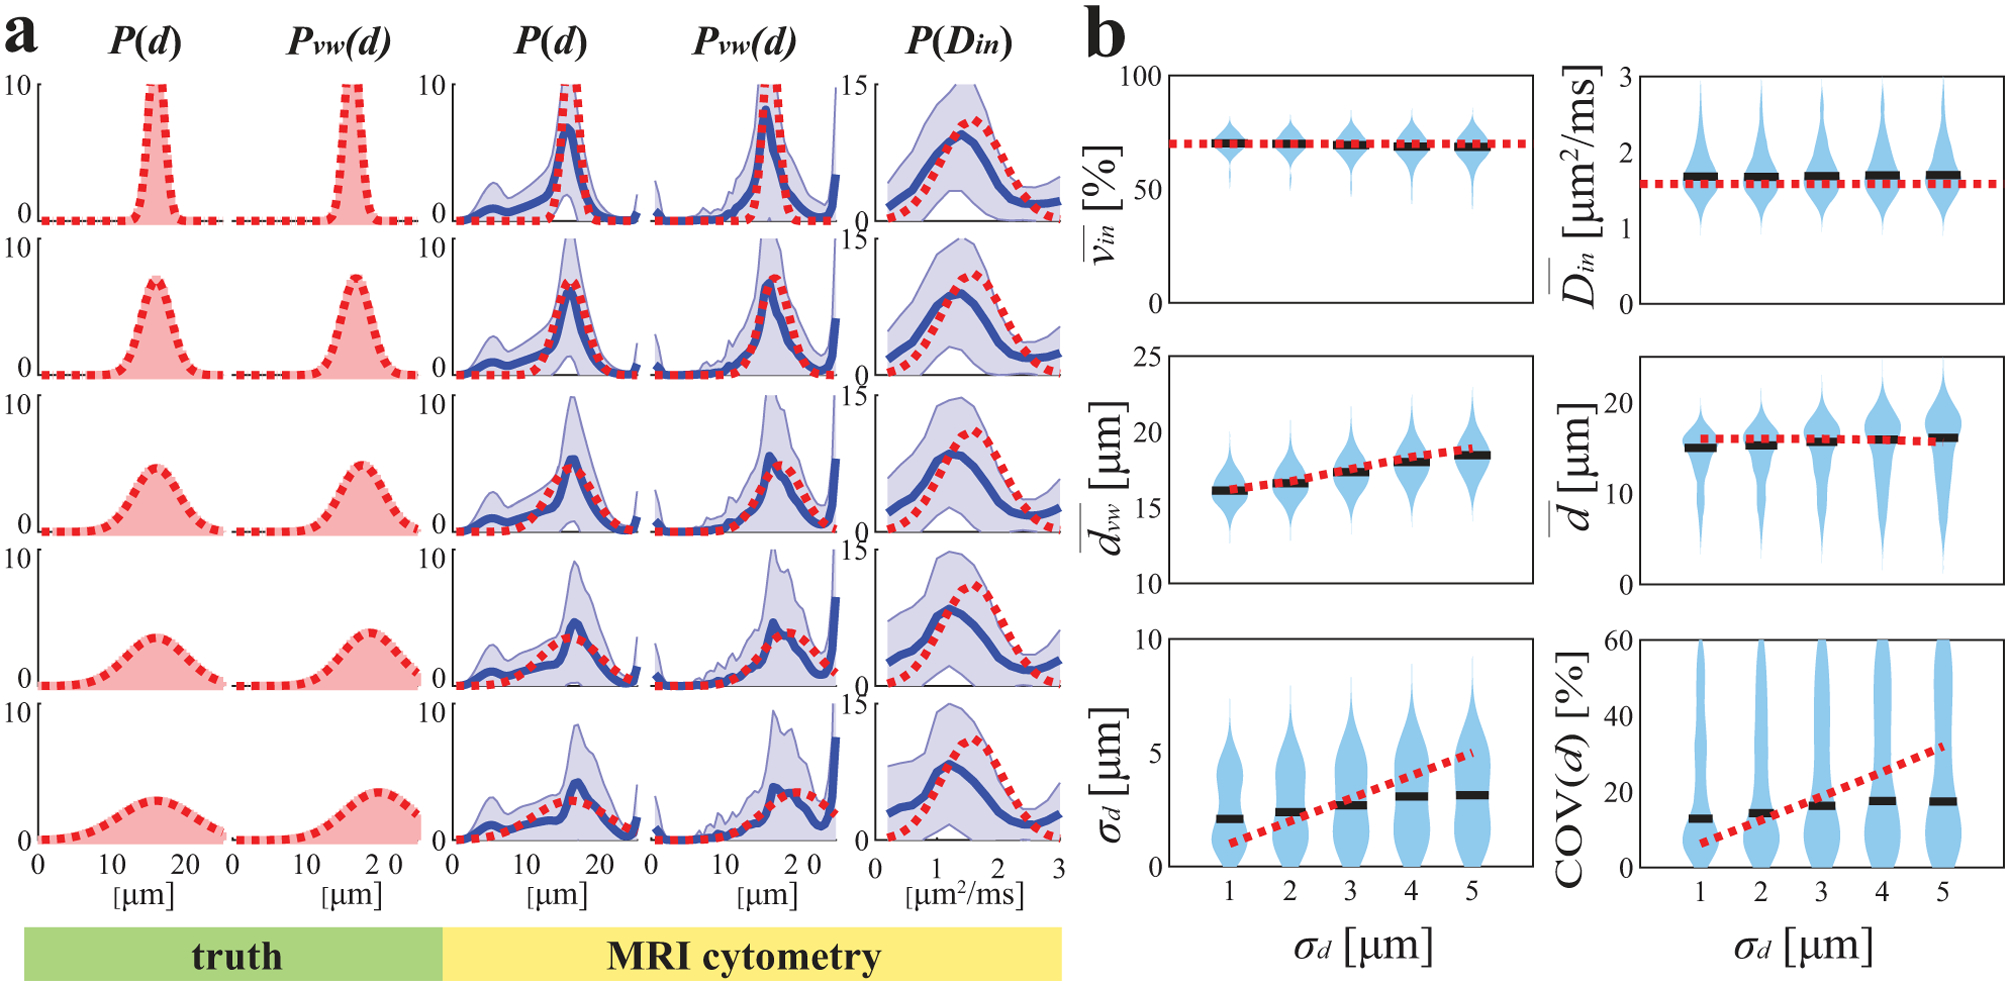
Simulated influence of the standard variation of true mean cell size distribution on MRI-Cytometry fitted (a) distributions of microstructural parameters and (b) MRI-Cytometry derived parameters. Figure legends are the same in Figure 2.
Figure 5 shows how MRI-Cytometry fits bi-modal distributions of d. Recall that the bi-modal distributions consist of two peaks, one of small cells (8 μm) and one of large cells (17 μm), and their relative cell number fractions vary. Note Pvw(d) (i.e., cell-volume-weighted size distributions) barely show bi-modal patterns even if the cell number fraction of small cells reaches 50% (i.e. half of the cells are small). This is because small cells have much smaller cell volumes, so their signal contributions are much smaller than those of larger cells. As a result, Pvw(d) is more sensitive to large cells. As shown in Figure 5b, MRI-Cytometry derived shows good accuracy for all combinations of small and large cells, but is slightly overestimated when both small and large cells are present. The MRI-Cytometry derived apparent fractions of cells smaller than 10 μm, , shows a monotonic dependence on ground-truth values, suggesting MRI-Cytometry can characterize the cell number fractions of small cells. This information cannot be obtained using previous methods that report mean cell sizes (12,14,16).
Figure 5.
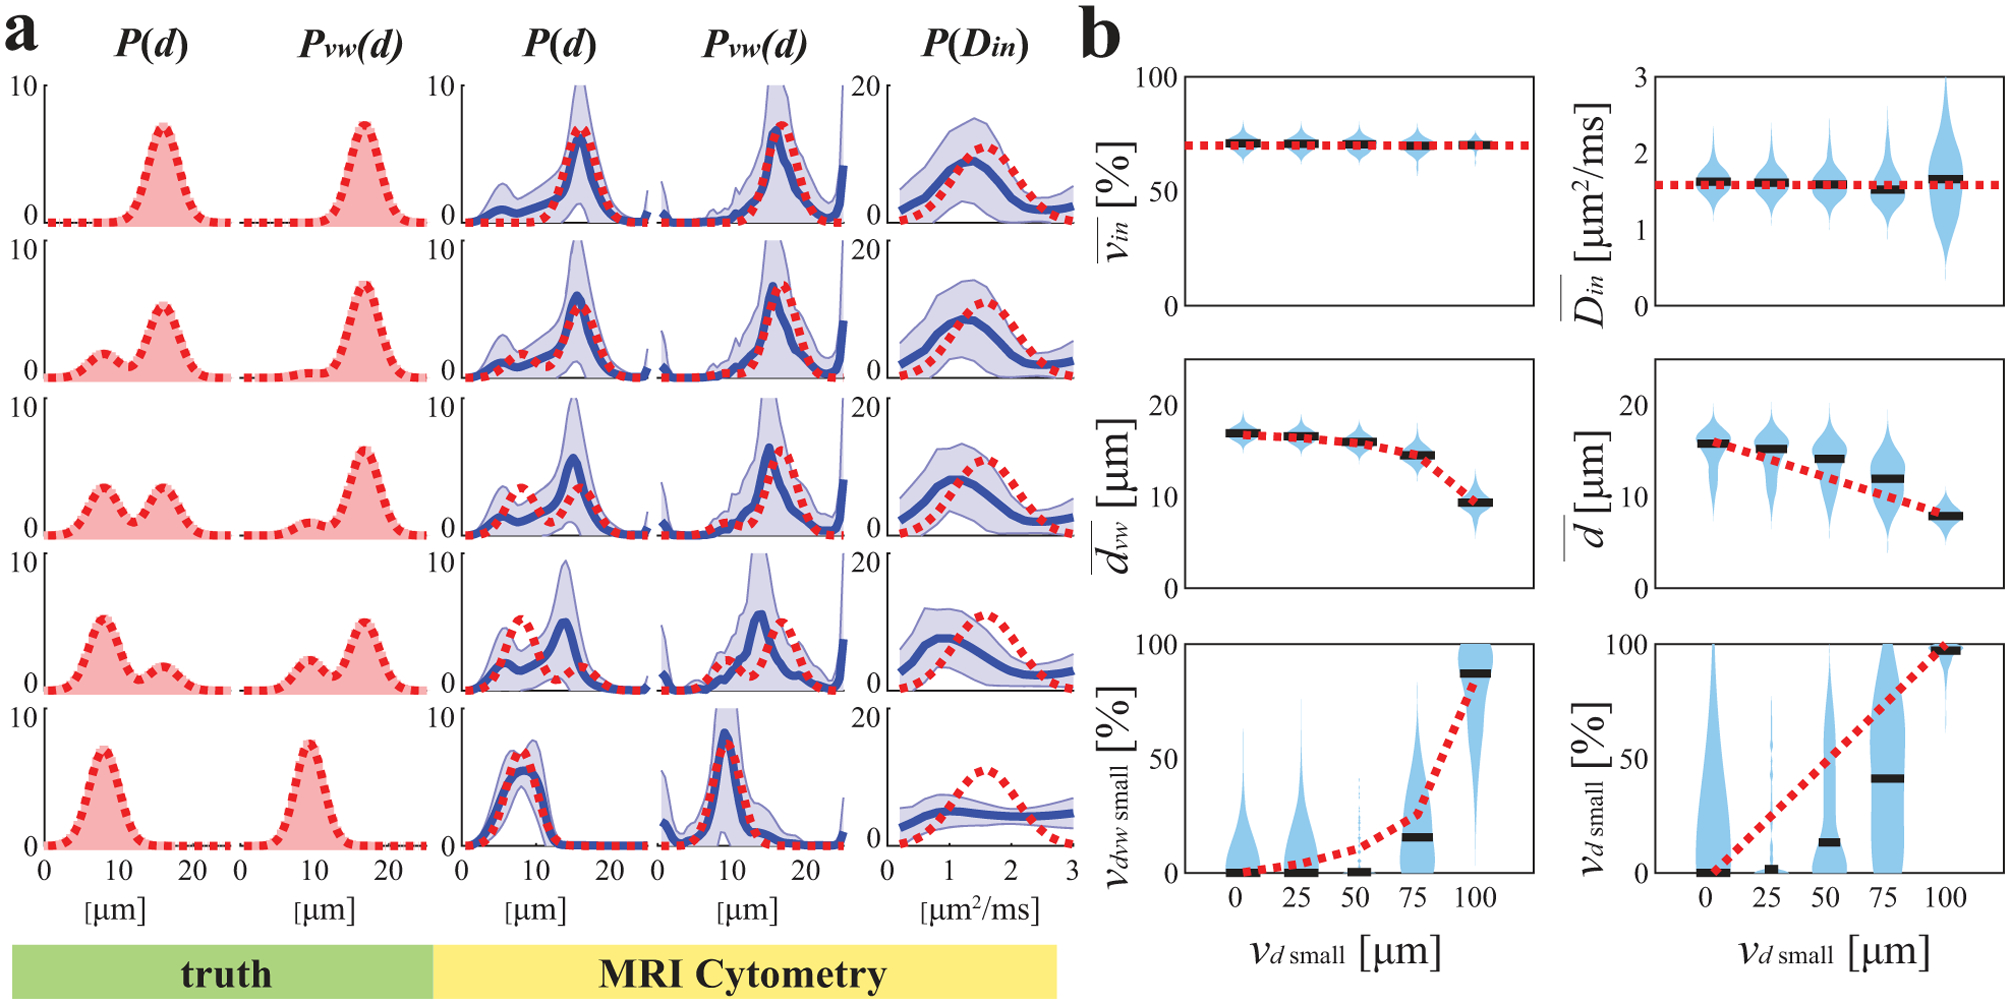
Simulated influence of small cell fractions on MRI-Cytometry fitted (a) distributions of microstructural parameters and (b) MRI-Cytometry derived parameters. Figure legends are the same in Figure 2.
Cultured cells in vitro
Figure 6 shows comparisons of MRI-Cytometry and light microscopy derived cell size distributions P(d) using cultured cells in vitro. For the three breast cancer cell lines (MDA-MB-231, MCF-7, and MDA-MB-453) and Jurkat leukemia cancer cells, P(d) obtained using MRI-Cytometry matched those from light microscopy. For the smallest lymphocytes, MRI-Cytometry found accurate mean values for P(d) but with a broader width. Figure 6b shows the correlation between MRI-Cytometry and light microscopy derived mean cell size and standard deviation σd. Although there is a good correlation in , there are discrepancies in σd which is consistent with simulated results that MRI-Cytometry provides more accurate estimates of than those of σd.
Figure 6.
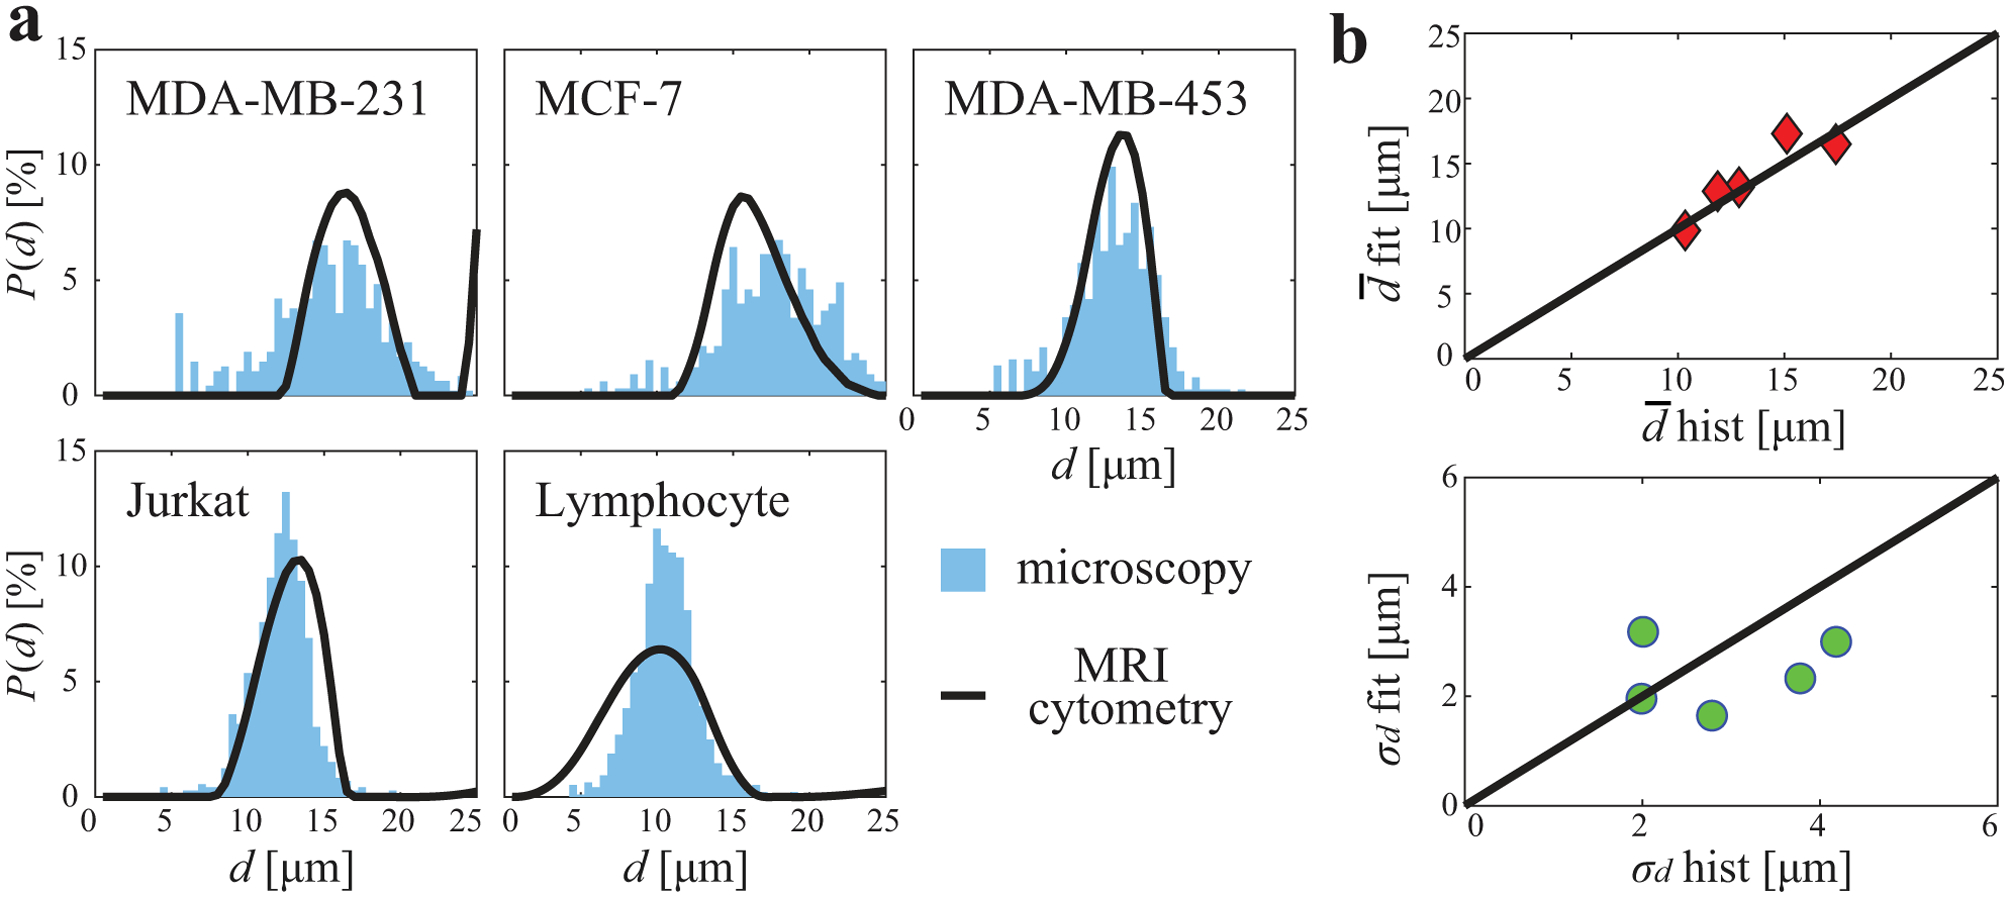
Comparison of MRI-Cytometry and light microscopy derived cell size distribution P(d) using cultured cells in vitro. (a) comparison of distributions of five different cell samples. (b) correlations of MRI-Cytometry and light microscopy derived mean cell size and standard deviation σd.
Animal xenografts in vivo
Figure 7a shows comparisons of MRI-Cytometry and histology derived cell size distribution of two types of mouse xenografts (MDA-MB-231 and MCF-7) in vivo. There is a good match in all five representative animals. Because it is challenging to distinguish small cells from other small structures such as cell debris, cells only with a size larger than a threshold of 5.5 μm were included. Note this exclusion did not affect our overall results significantly because the fractions of very small cells (< 5.5 μm) are low, and hence they make minor contributions to overall signals. Figure 7b shows the agreement between MRI-Cytometry and histology derived mean cell size and standard deviation σd. The 95% limits of agreement are 1.6 μm and 1.4 μm for and σd, respectively, suggesting good agreements.
Figure 7.
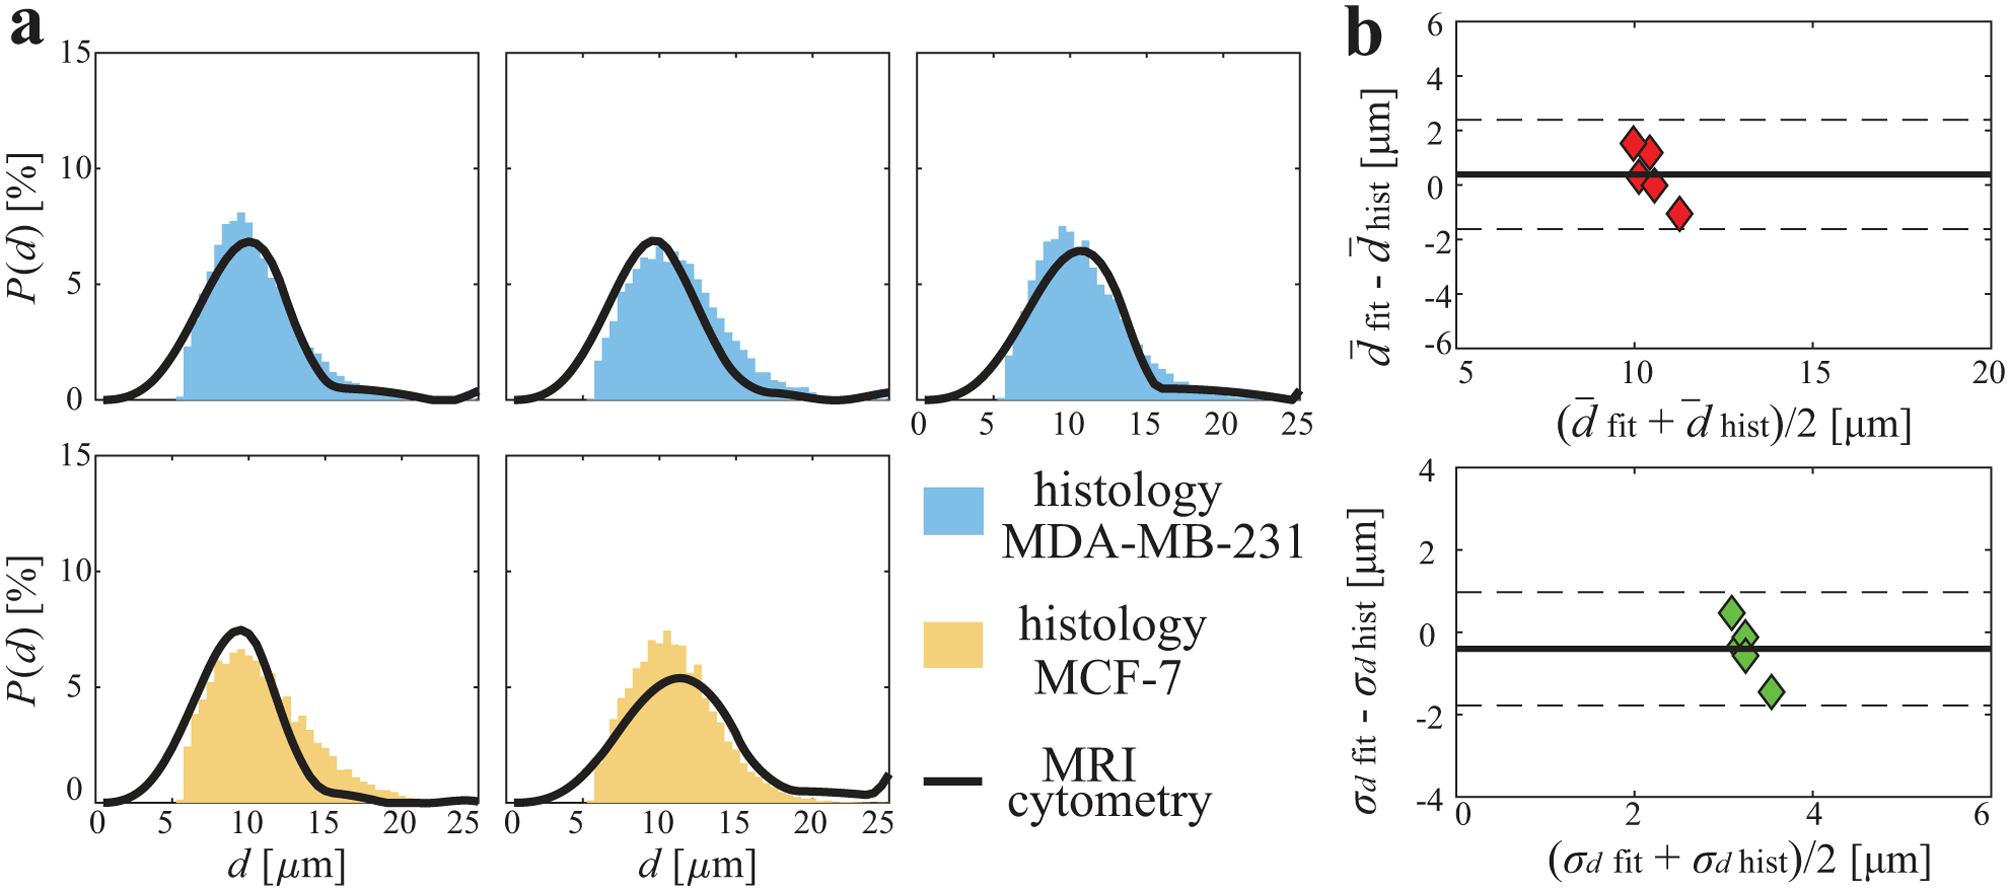
Comparison of MRI-Cytometry and histology derived cell size distribution P(d) of mouse tumors in vivo. (a) comparison of distributions of five tumors (top: MDA-MB-231. Bottom: MCF-7). (b) Bland-Altman plots show the agreement of MRI-Cytometry and light microscopy derived mean cell size and standard deviation σd
Breast Cancer patients in vivo
Figure 8 shows representative cell size distributions P(d) and MRI-Cytometry derived vin and parametric maps of a human breast tumor. SNR was ~45 on T2w images. Four examples of cell size distributions from four representative image voxels are provided. For the voxels in the viable tumors (#1, #2, and #4 shown in Figure 8a, e, and g), the shapes of P(d) are similar to each other. However, voxel #2 shows hyperintensity on the T2-weighted b = 0 image and reduced vin. This might be due to increased extracellular water. By contrast, P(d) appears very differently as a small peak at large cell sizes (> 20 μm) for the voxel #3 in the necrotic region. This is because the necrotic core consists of mainly fluid and cell debris with few restrictions. This leads to a small fitted intracellular volume fraction vin (< 10%) and large fitted cell sizes ≥ 20.5 μm, the root-mean-square-displacement of free water at body temperature 37°. Figure 8d and h demonstrate the MRI-Cytometry derived vin and parametric maps, which show low vin and high in the necrotic core compared with viable tumors. Note that transcytolemmal water exchange may be responsible for the underestimation of vin, but it may have minor influence on , as we reported previously (26).
Figure 8.
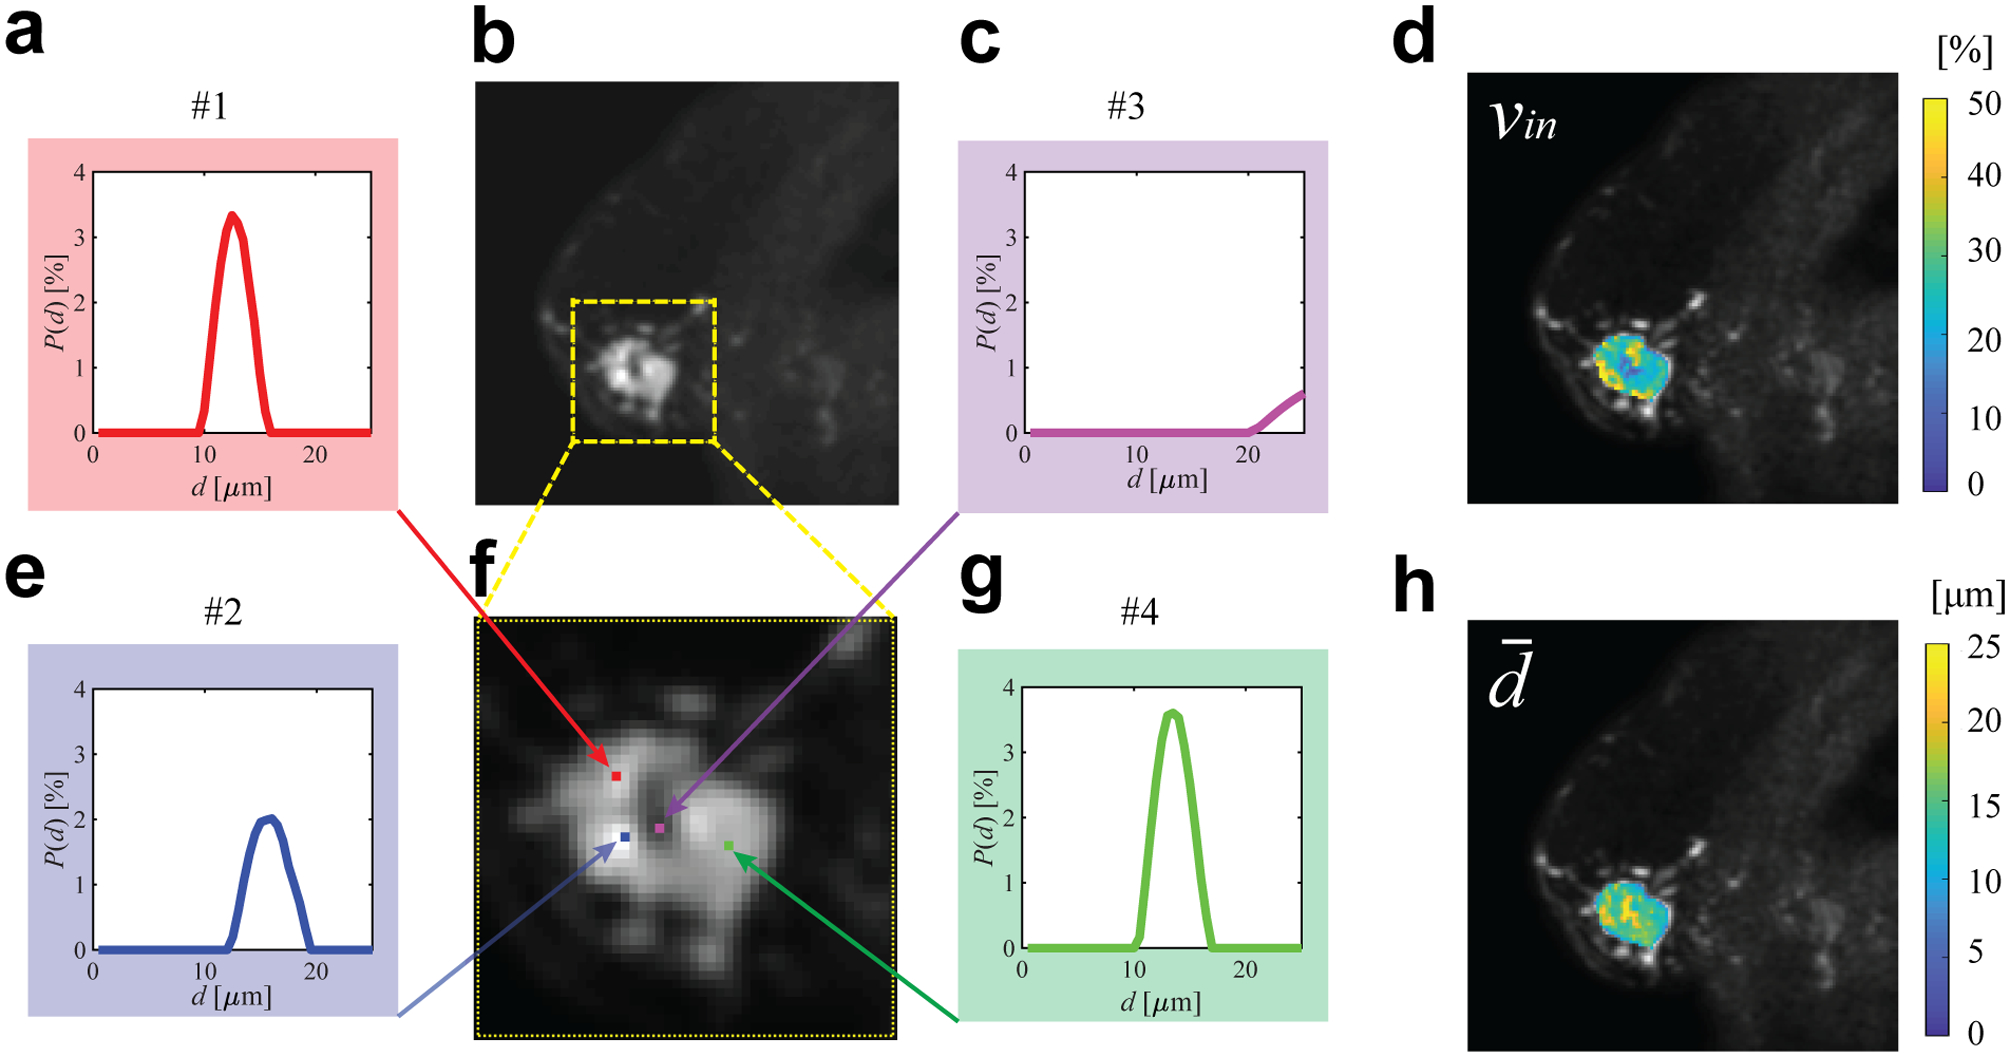
Representative cell size distributions and MRI-Cytometry derived parametric maps of a breast tumor. (b) is T2-weighted b = 0 image of the tumor and (f) is an enlarged view. (a,c,e,g) are four examples of cell size distributions. (d) and (h) are MRI-Cytometry derived vin and maps of the same tumor.
In addition to the voxel-wise fitting shown above, MRI-Cytometry was also fitted to the whole-tumor signals to investigate the overall cell size distribution of each tumor as shown in Figure 9a. P(d) displays different locations and widths of distributions in different breast tumors. This finding is consistent with previous reports that human breast tumors have large variations in cell sizes (37). For a direct comparison, the averaged cell size distributions from voxel-wise spectra were also provided. The latter shows broader spectra and peaks close to large d indicating voxels in the necrotic regions. Note that the whole tumor data had a much higher SNR than the voxel-wise data, which may contribute to the discrepencies between two results. Unfortunately, the current study lacks histopathological analysis in breast cancer patients to validate the fitted P(d) directly. All fitted distributions are smooth, presumably due to the regularization effect. Figure 9b shows the comparison of MRI-Cytometry and IMPULSED derived cell-volume-weighted mean cell size . Pearson’s correlation coefficient is r = 0.83 and p < 0.02. This is consistent with previous reports that NNLS fitted results agree well with those fitted using non-linear procedures (31), suggesting the information on mean cell size from IMPULSED can be provided by MRI-Cytometry as well. Figure 10 shows a direct comparison of the mean cell size maps of seven patients obtained using IMPULSED and MRI-Cytometry. The maps are slightly different from each other. Notably, IMPULSED provides more high fitted values > 20 μm especially at tumor boundaries, indicating MRI-Cytometry might be more robust and less sensitive to partial volume effects.
Figure 9.
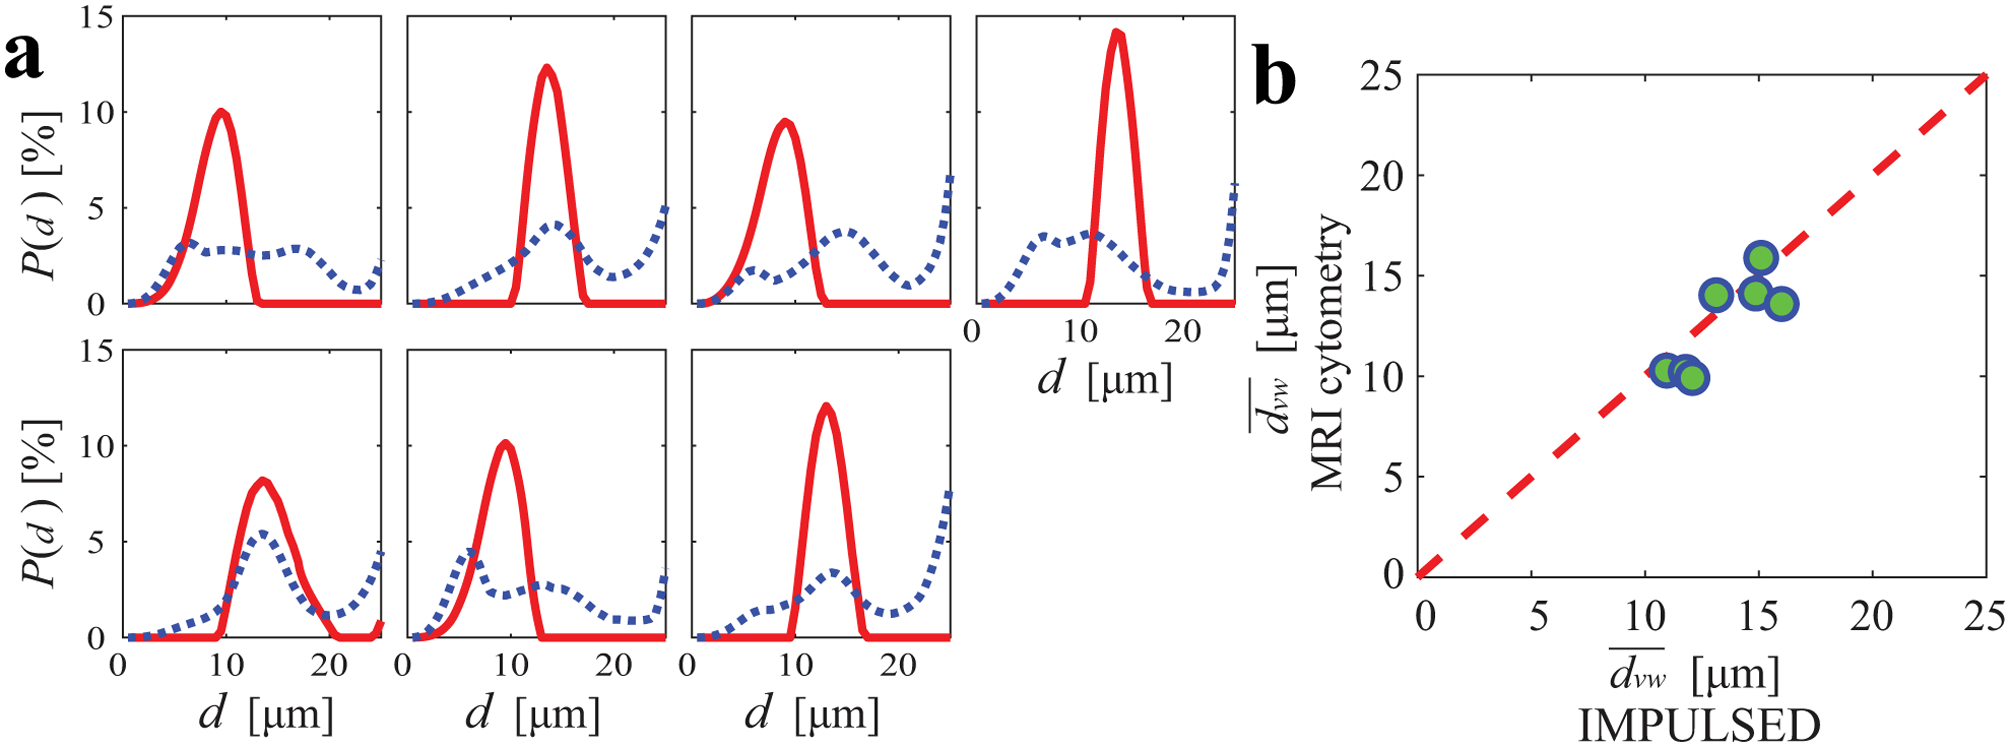
(a) MRI-Cytometry derived cell size distributions of all seven breast cancer patients. Red solid lines and blue dashed lines represent the distributions fitted from the whole tumor data and the averaged voxel-wise spectra, respectively. (b) the comparison of MRI-Cytometry and IMPULSED derived cell-volume-weighted mean cell size . The Pearson’s correlation provides r = 0.83 and p < 0.02. The red dash line represents identity.
Figure 10.
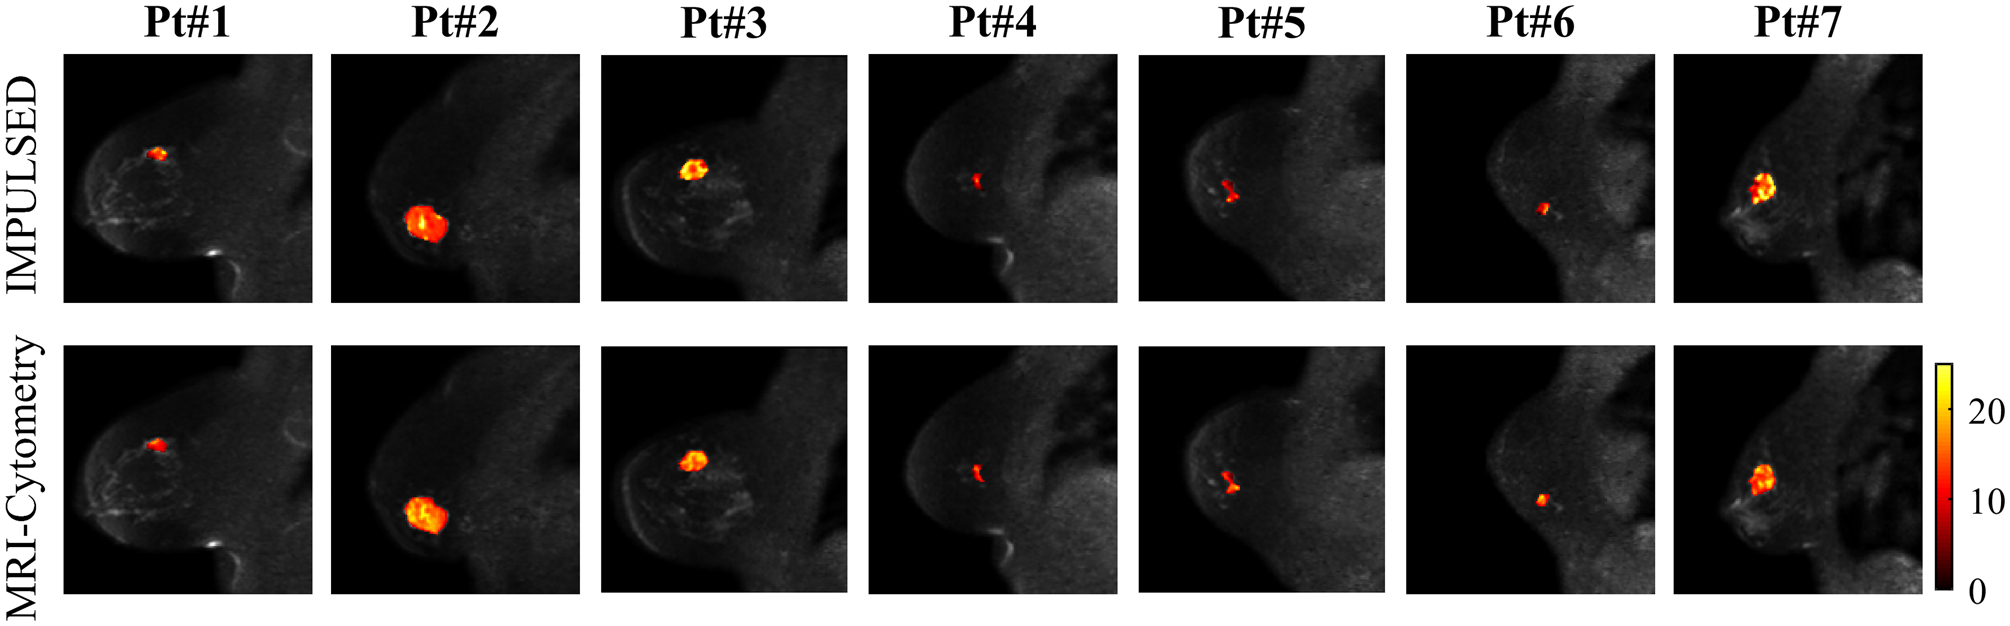
Comparison of mean cell size maps obtained by IMPULSED (top) and MRI-Cytometry (bottom). Each column is a representative slice from a patient.
DISCUSSION
The two-step MRI-Cytometry method is a framework for mapping arbitrary cell size distributions without assuming any parametric distribution. As a general framework, MRI-Cytometry can incorporate combinations of any DWI acquisition methods with appropriate adjustments of fitting basis matrices (dictionaries) as long as the measurements are sensitive to changes in restriction size. We chose data acquisitions used in the IMPULSED method because it is clinically feasible (23). Future directions include using the same MRI-Cytometry framework but with different diffusion acquisition methods (such as PGSE, OGSE, and DDE) and compare the results with the same hardware limitations.
An attractive potential application of mapping cell size distribution is to distinguish different cell populations. For example, immunotherapy provides cutting-edge anti-cancer treatments usually associated with T cell infiltration in tumors (38). Because T cell sizes (7 – 9 μm) are usually smaller than relatively larger cancer cells (10 – 25 μm) (39), mapping cell fractions at different cell sizes may provide an opportunity to characterize T cell infiltration, which is currently not achievable using conventional MRI. Our simulations (Figure 5) suggest that MRI-Cytometry can separate the fractions of small (< 10 μm) cells from relatively larger cancer cells. This may provide an indirect means to probe T cell infiltration in tumors. However, many confounding effects may make this characterization challenging, such as the presence of macrophage and the much smaller contributions of small cells to DWI signals. Stronger gradient coils would improve the ability of MRI-Cytometry to detect smaller cells, which may provide more accurate estimates of T cell infiltration. The current work used a gradient strength up to 80 mT/m and a slew rate < 100 mT/m/sec, both of which limit the shortest diffusion time to be ≈ 5 ms with a corresponding maximum b = 300 s/mm2. Such a diffusion time range decreases the detection sensitivity to small cell sizes and intracellular diffusivities, leading to lower fitting precision for MRI-Cytometry derived distributions and parameters such as and . If stronger gradients such as the Human Connectome coil with 300 mT/m (40) can be used, the detection sensitivity of MRI-Cytometry to smaller cell sizes and intracellular diffusivities may significantly increase. For example, our previous animal study (15) could achieve ≈ 1.7 ms (b = 600 s/mm2) and ≈ 2.5 ms (b = 1320 s/mm2) with a gradient strength up to 360 mT/m. Importantly, intracellular diffusivity Din of cancer cells can be fit reliably with these much shorter diffusion times. We have recently demonstrated success with this approach using the stronger gradients available on animal scanning systems (15,24).
MRI-Cytometry is based on a two-compartment (intra- and extracellular) model with free water naturally included in the extracellular compartment with Dex0 = Dfree and βex = 0. However, the peak corresponding to free water on the Dex spectra may not be resolved independently due to the regularization used in the MRI-Cytometry fittings, but the free water alters the estimated distribution of extracellular diffusivities P(Dex0). Fitting multiparametric diffusion models to data is an ill-posted problem and the influence of free water on DWI signals may be similar to having different distributions of extracellular diffusivities, leading to the possibility of multiple solutions. The inclusion of another dimension of measurements using, e.g., varying echo times, may provide additional information to assist in solving this problem. Moreover, the influences of free water fraction and cell membrane permeability, amongst other factors, on MRI-Cytometry fitting need further investigation.
Due to the limited long tdiff ranges used in the current work, our results suggest MRI-Cytometry has a low sensitivity to βex. This is consistent with our previous findings in patients (23) that Dex could be assumed to be a constant, which enhances fitting precisions of other parameters. As a general framework, MRI-Cytometry should not be limited by the practical parameters and it could fit βex reliably if a broader range of frequencies can be used, such as up to 150 Hz suggested in a previous animal study (24). However, if only limited frequency ranges are used, it is possible to simply MRI-Cytometry by removing βex from the free fitting parameters.
MRI-Cytometry was implemented voxel-wisely on images obtained from breast cancer patients. However, as shown in Figure 8c, it may not be a suitable model for necrotic regions of the tumor, where water is less restricted. A similar example has been reported that suggests models such as IMPULSED may not always be appropriate in very heterogeneous brain tumors (33). A possible solution is to perform a model selection first to determine the suitability of each model before any data fitting is performed (33).
CONCLUSIONS
A novel and fast MRI-Cytometry imaging method is introduced for mapping intravoxel, non-parametric cell size distributions using diffusion MRI. With validations using computer simulations in silico, cultured cells in vitro, and animal xenografts in vivo, we demonstrate the accuracy and precision of MRI-Cytometry. The applications in breast cancer patients in vivo suggest MRI-Cytometry may be translated to clinical applications.
ACKNOWLEDGMENTS
The authors thank MR technologists Clair Jones, Leslie McIntosh, Christopher Thompson, and Fuxue Xin for assistance in data acquisition and Drs. Katy Beckermann and Kirsten Young for collecting lymphocytes. This work was funded by NIH grants K25CA168936, R01CA109106, R01CA173593, UL1TR002243, S10OD021771, U01CA142565, F32CA216942, UL1TR000445, P30CA068485, RO1HD094381, RO1AG053548; American Cancer Society grant IRG#58-009-56. BrightFocus Foundation: A2017330S.
REFERENCES
- 1.Kozlowski J, Konarzewski M, Gawelczyk AT. Cell size as a link between noncoding DNA and metabolic rate scaling. Proc Natl Acad Sci U S A 2003;100(24):14080–14085. [DOI] [PMC free article] [PubMed] [Google Scholar]
- 2.Baserga R Is cell size important? Cell cycle 2007;6(7):814–816. [DOI] [PubMed] [Google Scholar]
- 3.Bortner CD, Cidlowski JA. A Necessary Role for Cell Shrinkage in Apoptosis. Biochemical Pharmacology 1998;56:1549–1559. [DOI] [PubMed] [Google Scholar]
- 4.Ginzberg MB, Kafri R, Kirschner M. Cell biology. On being the right (cell) size. Science 2015;348(6236):1245075. [DOI] [PMC free article] [PubMed] [Google Scholar]
- 5.Price‐Jones C The diameters of red cells in pernicious anaemia and in anaemia following haemorrhage. The Journal of Pathology and Bacteriology 1922;25(4):487–504. [Google Scholar]
- 6.Evans TC, Jehle D. The red blood cell distribution width. J Emerg Med 1991;9 Suppl 1:71–74. [DOI] [PubMed] [Google Scholar]
- 7.Montagnana M, Danese E. Red cell distribution width and cancer. Annals of translational medicine 2016;4(20):399. [DOI] [PMC free article] [PubMed] [Google Scholar]
- 8.Ong HH, Wehrli FW. Quantifying axon diameter and intra-cellular volume fraction in excised mouse spinal cord with q-space imaging. NeuroImage 2010;51(4):1360–1366. [DOI] [PMC free article] [PubMed] [Google Scholar]
- 9.Alexander DC, Hubbard PL, Hall MG, Moore EA, Ptito M, Parker GJ, Dyrby TB. Orientationally invariant indices of axon diameter and density from diffusion MRI. NeuroImage 2010;52(4):1374–1389. [DOI] [PubMed] [Google Scholar]
- 10.Weber T, Ziener CH, Kampf T, Herold V, Bauer WR, Jakob PM. Measurement of apparent cell radii using a multiple wave vector diffusion experiment. Magn Reson Med 2009;61(4):1001–1006. [DOI] [PubMed] [Google Scholar]
- 11.Xu J, Li H, Harkins KD, Jiang X, Xie J, Kang H, Does MD, Gore JC. Mapping mean axon diameter and axonal volume fraction by MRI using temporal diffusion spectroscopy. NeuroImage 2014;103:10–19. [DOI] [PMC free article] [PubMed] [Google Scholar]
- 12.Panagiotaki E, Walker-Samuel S, Siow B, Johnson SP, Rajkumar V, Pedley RB, Lythgoe MF, Alexander DC. Noninvasive quantification of solid tumor microstructure using VERDICT MRI. Cancer Res 2014;74(7):1902–1912. [DOI] [PubMed] [Google Scholar]
- 13.Panagiotaki E, Chan RW, Dikaios N, Ahmed HU, O’Callaghan J, Freeman A, Atkinson D, Punwani S, Hawkes DJ, Alexander DC. Microstructural characterization of normal and malignant human prostate tissue with vascular, extracellular, and restricted diffusion for cytometry in tumours magnetic resonance imaging. Investigative radiology 2015;50(4):218–227. [DOI] [PubMed] [Google Scholar]
- 14.Jiang X, Li H, Xie J, Zhao P, Gore JC, Xu J. Quantification of cell size using temporal diffusion spectroscopy. Magn Reson Med 2016;75(3):1076–1085. [DOI] [PMC free article] [PubMed] [Google Scholar]
- 15.Jiang X, Li H, Xie J, McKinley ET, Zhao P, Gore JC, Xu J. In vivo imaging of cancer cell size and cellularity using temporal diffusion spectroscopy. Magn Reson Med 2017;78(1):156–164. [DOI] [PMC free article] [PubMed] [Google Scholar]
- 16.Reynaud O, Winters KV, Hoang DM, Wadghiri YZ, Novikov DS, Kim SG. Pulsed and oscillating gradient MRI for assessment of cell size and extracellular space (POMACE) in mouse gliomas. NMR in biomedicine 2016;29(10):1350–1363. [DOI] [PMC free article] [PubMed] [Google Scholar]
- 17.Barazany D, Basser PJ, Assaf Y. In vivo measurement of axon diameter distribution in the corpus callosum of rat brain. Brain 2009;132(Pt 5):1210–1220. [DOI] [PMC free article] [PubMed] [Google Scholar]
- 18.Benjamini D, Komlosh ME, Basser PJ, Nevo U. Nonparametric pore size distribution using d-PFG: comparison to s-PFG and migration to MRI. J Magn Reson 2014;246:36–45. [DOI] [PMC free article] [PubMed] [Google Scholar]
- 19.Benjamini D, Komlosh ME, Holtzclaw LA, Nevo U, Basser PJ. White matter microstructure from nonparametric axon diameter distribution mapping. NeuroImage 2016;135:333–344. [DOI] [PMC free article] [PubMed] [Google Scholar]
- 20.Shemesh N, Alvarez GA, Frydman L. Size Distribution Imaging by Non-Uniform Oscillating-Gradient Spin Echo (NOGSE) MRI. PloS one 2015;10(7):e0133201. [DOI] [PMC free article] [PubMed] [Google Scholar]
- 21.Anaby D, Morozov D, Seroussi I, Hametner S, Sochen N, Cohen Y. Single- and double-Diffusion encoding MRI for studying ex vivo apparent axon diameter distribution in spinal cord white matter. NMR in biomedicine 2019:e4170. [DOI] [PubMed] [Google Scholar]
- 22.Duchene G, Abarca-Quinones J, Leclercq I, Duprez T, Peeters F. Insights into tissue microstructure using a double diffusion encoding sequence on a clinical scanner: Validation and application to experimental tumor models. Magn Reson Med 2019. [DOI] [PubMed] [Google Scholar]
- 23.Xu J, Jiang X, Li H, Arlinghaus LR, McKinley ET, Devan SP, Hardy BM, Xie J, Kang H, Chakravarthy AB, Gore JC. Magnetic resonance imaging of mean cell size in human breast tumors. Magn Reson Med 2020;83(6):2002–2014. [DOI] [PMC free article] [PubMed] [Google Scholar]
- 24.Jiang X, McKinley ET, Xie J, Li H, Xu J, Gore JC. In vivo magnetic resonance imaging of treatment-induced apoptosis. Scientific reports 2019;9(1):9540. [DOI] [PMC free article] [PubMed] [Google Scholar]
- 25.Yablonskiy DA, Bretthorst GL, Ackerman JJ. Statistical model for diffusion attenuated MR signal. Magn Reson Med 2003;50(4):664–669. [DOI] [PMC free article] [PubMed] [Google Scholar]
- 26.Li H, Jiang X, Xie J, Gore JC, Xu J. Impact of transcytolemmal water exchange on estimates of tissue microstructural properties derived from diffusion MRI. Magn Reson Med 2017;77(6):2239–2249. [DOI] [PMC free article] [PubMed] [Google Scholar]
- 27.Xu J, Does MD, Gore JC. Quantitative characterization of tissue microstructure with temporal diffusion spectroscopy. J Magn Reson 2009;200(2):189–197. [DOI] [PMC free article] [PubMed] [Google Scholar]
- 28.Assaf Y, Blumenfeld-Katzir T, Yovel Y, Basser PJ. AxCaliber: a method for measuring axon diameter distribution from diffusion MRI. Magn Reson Med 2008;59(6):1347–1354. [DOI] [PMC free article] [PubMed] [Google Scholar]
- 29.Whittall KP, MacKay AL. Quantitative interpretation of NMR relaxation data. Journal of Magnetic Resonance 1989;84:134–152. [Google Scholar]
- 30.Wang Y, Wang Q, Haldar JP, Yeh FC, Xie M, Sun P, Tu TW, Trinkaus K, Klein RS, Cross AH, Song SK. Quantification of increased cellularity during inflammatory demyelination. Brain 2011;134(Pt 12):3590–3601. [DOI] [PMC free article] [PubMed] [Google Scholar]
- 31.Daducci A, Canales-Rodriguez EJ, Zhang H, Dyrby TB, Alexander DC, Thiran JP. Accelerated Microstructure Imaging via Convex Optimization (AMICO) from diffusion MRI data. NeuroImage 2015;105:32–44. [DOI] [PubMed] [Google Scholar]
- 32.Jiang X, Li H, Zhao P, Xie J, Khabele D, Xu J, Gore JC. Early detection of treatment-induced mitotic arrest using temporal diffusion magnetic resonance spectroscopy. Neoplasia 2016;18(6):387–397. [DOI] [PMC free article] [PubMed] [Google Scholar]
- 33.Jiang X, Xu J, Gore JC. Quantitative temporal diffusion spectroscopy as an early imaging biomarker of radiation therapeutic response in gliomas: A preclinical proof of concept. Adv Radiat Oncol 2019;4(2):367–376. [DOI] [PMC free article] [PubMed] [Google Scholar]
- 34.Jenkinson M, Smith S. A global optimisation method for robust affine registration of brain images. Medical image analysis 2001;5(2):143–156. [DOI] [PubMed] [Google Scholar]
- 35.Jenkinson M, Beckmann CF, Behrens TE, Woolrich MW, Smith SM. Fsl. Neuroimage 2012;62(2):782–790. [DOI] [PubMed] [Google Scholar]
- 36.Avram AV, Sarlls JE, Basser PJ. Measuring non-parametric distributions of intravoxel mean diffusivities using a clinical MRI scanner. NeuroImage 2019;185:255–262. [DOI] [PMC free article] [PubMed] [Google Scholar]
- 37.Bell CD, Waizbard E. Variability of cell size in primary and metastatic human breast carcinoma. Invasion & metastasis 1986;6(1):11–20. [PubMed] [Google Scholar]
- 38.Jiang X, Dudzinski S, Beckermann KE, Young K, McKinley E, J McIntyre O, Rathmell JC, Xu J, Gore JC. MRI of tumor T cell infiltration in response to checkpoint inhibitor therapy. Journal for ImmunoTherapy of Cancer 2020;8(1):e000328. [DOI] [PMC free article] [PubMed] [Google Scholar]
- 39.Shashni B, Ariyasu S, Takeda R, Suzuki T, Shiina S, Akimoto K, Maeda T, Aikawa N, Abe R, Osaki T. Size-based differentiation of cancer and normal cells by a particle size analyzer assisted by a cell-recognition PC software. Biological and Pharmaceutical Bulletin 2018;41(4):487–503. [DOI] [PubMed] [Google Scholar]
- 40.Cohen-Adad J, Tisdall MD, Kimmlingen R, Eberlein E, Witzel T, Hoecht P, Keil B, Nistler J, Lehne D, Heberlein K, McNab JA, Thein H, Schmitt F, Rosen BR, Wedeen VJ, Wald LL. Improved Q-Ball imaging using a 300 mT/m human gradient. 2012; Melbourne, Australia: p 694. [Google Scholar]