

Abstract
Background:
Aggression often occurs alongside alcohol and drug misuse. However, it is not clear whether the latent and manifest relations among alcohol-related, drug-related, and non-substance-related aggression are separate manifestations of a single construct or instead are three distinct constructs.
Methods:
To examine these associations, we conducted a preregistered analysis of 13,490 participants in the Collaborative Study on the Genetics of Alcoholism (COGA). In a structured interview, participants reported their lifetime perpetration of these three aggression phenotypes.
Results:
The data were better fit by a model that treated these aggression phenotypes as three distinct latent factors, as compared to models in which the items all loaded onto one (‘general’) or two (‘substance-related’ and ‘non-substance-related’) aggression factors. This three factor model fit better for men than women. Subsequent exploratory analyses then showed that among these three factors, alcohol-related aggression explained the variance of overall aggression better than the other two factors.
Conclusions:
Our findings suggest that these three forms of aggression are distinct phenotypes (especially among men). Yet, people’s alcohol-related aggression can accurately characterize their overall aggressive tendencies across these domains. Future research will benefit from articulating the unique and shared pathways and risk factors underlying each of these facets of aggression.
Keywords: aggression, alcohol-related aggression, alcohol misuse, drug-related aggression, violence
Introduction
Human aggression often undermines health and well-being. In 2018, over 1.2 million violent crimes were recorded in the United States alone — a 4.7% increase from 2014 (Federal Bureau of Investigation, 2019). Such violence led to more than 65,000 fatalities in 2017 (Centers for Disease Control and Prevention, 2019) and cost taxpayers over $25 billion in 2010 (Centers for Disease Control and Prevention, 2014). Alcohol and drug misuse are contributing factors in at least 40% of violent acts (Collins & Messerschmidt, 1993; Martin, 1992; National Institute of Justice, 1991). Despite the immense import of alcohol and drug misuse to understanding aggression, it remains unclear whether alcohol-related, drug-related, and non-substance-related aggression are three distinct constructs or if they are simply three facets of a single aggression factor. In what follows, we sought to fill this gap in our understanding by statistically modeling whether these three aggression phenotypes were best characterized as manifestations of a general aggression construct, or as three distinct constructs unto themselves.
Aggression: Definition and Taxonomy
Aggression is any deliberate attempt to harm others against their will (Allen & Anderson, 2017). It does not include acts of self-harm, accidentally harming others, protecting oneself from assailants, or consensual infliction of pain. Rather, a malicious motivation to harm others is required for an act to be considered aggression (Parrott & Giancola, 2007). It is a behavior, meaning that angry feelings, hostile thoughts, and desires to harm others do not count as aggression on their own. The conceptual taxonomy of aggression is often articulated into a growing array of sub-types (e.g., appetitive, direct, hostile, impulsive, indirect, physical, premeditated, proactive, reactive, relational, retaliatory, verbal) that vary in their underlying goals, sources, targets, and timeframes (Parrott & Giancola, 2007). Although alcohol-related and drug-related aggression have been recognized for their massive impact on public health, empirical research that establishes their place within the aggression taxonomy has been lacking. Doing so is a theoretically useful endeavor that could unify the more applied substance misuse and violence research literatures with basic theories of aggression. Further, this taxonomic integration could allow for novel predictions to be made about alcohol-related and drug-related aggression, possibly leading to novel interventions.
An initial step towards integrating these phenotypes is to define their conceptual properties. Alcohol-related aggression refers to aggressive acts that are associated with the perpetrator’s recent alcohol consumption. Drug-related aggression captures aggressive acts that are associated with the perpetrator’s recent consumption of illicit drugs (e.g., amphetamines, cocaine, marijuana, opioids). Conversely, non-substance-related aggression represents aggressive acts that are not associated with recent alcohol/drug consumption by the perpetrator of those aggressive acts. Yet what are the underlying relations among these three phenotypes?
Alcohol-Related and Drug-Related Aggression
Alcohol and drug use are often comorbid. Similarly, perpetrators of alcohol-related aggression are also often perpetrators of drug-related aggression — especially because perpetrators often misuse both of these substance categories (Pihl & Sutton, 2009). Alcohol has the clearest link to aggression, with powerful correlations between alcohol misuse and aggression observed in large-scale epidemiological studies and causal effects established in laboratory experiments (Parrott & Eckhardt, 2018). Alcohol’s ability to increase aggression is contingent on dispositional and situational factors. For example, alcohol tends to increase aggression only among individuals who are already dispositionally prone to aggressive behavior (Giancola, 2002). Further, alcohol elicits greater aggression in response to interpersonal provocation but has no effect on unprovoked, proactive aggression (Giancola et al., 2002). Alcohol’s effect on aggression is complex, which also holds true for drugs’ effects on aggression.
Drugs’ effects on aggression are heterogeneous given the varying effects of each drug class (Pihl & Sutton, 2009). Acute and chronic cocaine misuse is a reliable correlate of aggressive behavior (Licata, Taylor, Berman, & Cranston, 1993; Murray et al., 2003). Other central nervous system stimulants (e.g., amphetamines) also increase aggressive acts by magnifying arousal and antisocial impulses (Dawe, Davis, Lapworth, & McKetin, 2009). Sedative (e.g., alprazolam, diazepam) and opioid (e.g., heroin) misuse are both positively correlated with a greater frequency and severity of violence perpetration, likely due to impairments in impulse control (Chermack et al., 2008). Conversely, marijuana intoxication is associated with reduced aggression in a dose-dependent manner (Myerscough & Taylor, 1985). Polydrug users (i.e., those who misuse more than one drug), reported higher levels of physical aggression than mono-users (those who only misuse a single drug) who in turn reported higher levels of aggression than non-users (Steele & Peralta, 2017). The evidence is clear that alcohol and drug misuse are both robust contributors to aggression and often overlap within aggressive individuals.
Conceptual Distinction and Overlap Between Aggression Phenotypes
To what extent is an individual’s aggressive behavior specific to the context of alcohol misuse, drug misuse, or a lack thereof? On one side of the spectrum of possibilities, individuals would only be aggressive while misusing alcohol, misusing drugs, or sober — with no overlap between these categories. On the other side, individuals’ aggressive tendencies would blur these boundaries to the point of nonexistence and those who were aggressive while sober would be certain to behave aggressively under the influence of alcohol and drugs. Given that a substantial amount of violent crimes occur outside the context of substance misuse (Collins & Messerschmidt, 1993; Martin, 1992; National Institute of Justice, 1991) and the modest correlations between self-report measures of these phenotypes (r = .37; Berke, Leone, Parrott, & Gallagher, 2020), there is clear reason to expect that these three aggression phenotypes are to some extent orthogonal and to some extent correlated. Yet the extent of the conceptual overlap and distinction between these constructs remains un-estimated.
The Present Study
In order to better understand the conceptual links between alcohol-related, drug-related, and non-substance-related aggression, we conducted a preregistered analysis of existing interview data from the Collaborative Study on the Genetics of Alcoholism (COGA). We used confirmatory factor analyses to test the predictions that treating these three aggression phenotypes as distinct latent factors would exhibit better fit to the data than (A) combining alcohol-related and drug-related aggression into a ‘substance-related aggression’ factor, or (B) combining all three into a ‘general aggression’ factor.
Materials and Methods
Open Science Statement
The preregistration plan that details our predictions and data analysis procedures is publicly available here: https://osf.io/2aux5. De-identified data necessary to replicate these results are publicly available in the database of Genotypes and Phenotypes (dbGaP) under study accession phs000763.v1.p1. The R statistical software code needed to reproduce our analyses is publicly available here: https://osf.io/e8dwx/files.
Participants
We obtained data from the Collaborative Study on the Genetics of Alcoholism (COGA), a multi-site study of probands who were in treatment for alcohol use disorder and their family members, as well as a smaller number of comparison families (see Nurnberger et al., 2004 for more detail). Data collection for COGA proceeded across multiple phases. From the first phase of the COGA dataset, we identified 9,325 participants who provided aggression data. Our preregistration plan stated that we would only include data from this first phase of the COGA project but we deviated from this plan and decided to include participants from later phases in order to reduce type I and II error rates via greater statistical power. This resulted in a final sample of 13,490 participants1 (see Table 1 for sample demographics).
Table 1.
Characteristics of COGA participants included in analyses.
| Age | M | SD | Range |
|---|---|---|---|
| 38.7 | 15.1 | 17–97 | |
| Education | High School Completed | High School Not Completed | Missing |
| 10,553 (78.2%) | 2,936 (21.8%) | 1 (0.00%) | |
| Ethnicity | Hispanic | Non-Hispanic | Missing |
| 1810 (13.4%) | 11680 (86.6%) | 0 (0.00%) | |
| Race | American Indian | Non-American Indian | Missing |
| 119 (0.9%) | 13371 (99.1%) | 0 (0.00%) | |
| Asian | Non-Asian | Missing | |
| 119 (0.93%) | 13371 (99.1%) | 0 (0.00%) | |
| Black | Non-Black | Missing | |
| 3753 (27.8%) | 9737 (72.2%) | 0 (0.00%) | |
| Other | Non-Other | Missing | |
| 141 (1.0%) | 13349 (99.0%) | 0 (0.00%) | |
| White | Non-White | Missing | |
| 9347 (69.3%) | 4143 (30.7%) | 0 (0.00%) | |
| Sex | Women | Men | Missing |
| 7204 (53.4%) | 6286 (46.6%) | 0 (0.00%) |
This sample size was not predetermined by an a priori power analyses, but was instead determined by the availability of data that met the needs of our preregistered analyses. Our sample size of 13,490 provided us 80% power, at α = .05, to detect even quite small inter-factor correlations of β = .03 and larger within the three-factor model.
Research Ethics Statement
Research ethics boards at all seven COGA data collection sites approved the study procedures, in accordance with institutional and national research ethics guidelines. All participants provided informed consent and the investigators obtained consent from the parents of the three participants who were under 18 years of age.
Materials
SSAGA.
The Semi-Structured Assessment for the Genetics of Alcoholism (SSAGA) was developed by the COGA team (Bucholz et al., 1994). The SSAGA included assessments of many diagnosable forms of psychopathology, based on the third and fourth editions of the Diagnostic and Statistical Manual (DSM: American Psychiatric Association, 2000). Individual SSAGA items were modified from existing, validated semi-structured interviews (e.g., the Structured Clinical Interview for DSM [SCID]). The modifications made to these existing items improved upon many aspects, but most germane to the present research was the attempt to tease apart the comorbidity between alcohol misuse and antisocial behavior (i.e., identifying antisocial behavior that was related to alcohol and drug misuse, or not). SSAGA scores for antisocial behavior and alcohol misuse scores exhibited good inter-rater agreement, test-retest reliability, invariance across in-person and telephone administration methods, and agreement with other well-validated interview assessments of alcohol misuse and antisocial behavior (Begleiter et al., 2995; Bucholz et al., 1994, 1996; Hesselbrock, Easton, Bucholz, Schuckit, & Hesselbrock, 1999; Kramer et al., 2009).
Among the full battery of SSAGA items, participants were verbally asked by a trained interviewer about their past instances of alcohol-related aggression, drug-related aggression, and non-substance-related aggression. After reviewing the entire SSAGA battery, we sought to include items that (A) met the definition of aggressive behavior and (B) could be could be categorized into our three aggression-related, drug-related, and non-substance-related phenotypes, based either on the content of the question or the way in which responses to the question were coded. We adopted an inclusive approach to SSAGA item selection, in which items that described behaviors that could be aggressive (e.g., throwing objects), but were not certainly so (e.g., the target of the thrown objects could have been a person or an inanimate object), were included. This inclusive approach was motivated by the relatively small number of SSAGA items that asked about aggression and the ability of our statistical models to identify items that exhibited poor empirical properties (e.g., weak factor loadings), which we could subsequently exclude from our analyses.
This inclusive item selection approach led us to map our three aggression phenotypes onto items from three different sections of the SSAGA. Alcohol-related aggression items were taken from the ‘Alcohol’ section of the SSAGA, in which participants reported whether they had ever in their lives perpetrated four different acts of aggression and we coded their responses as ‘0 = No’ or ‘1 = Yes’. Drug-related aggression items were taken from the ‘Drugs’ section of the SSAGA, in which participants reported whether they had ever in their lives experienced a physical fight because of one of five types of drugs and we coded their responses as ‘0 = No’ or ‘1 = Yes’.
Non-substance-related aggression items were taken from the ‘Antisocial’ section of the SSAGA, in which participants reported whether they had ever in their lives perpetrated four different acts of aggression we coded their responses as ‘0 = No’, ‘0 = Yes, with alcohol and/or drugs only’, ‘1 = Yes, clean’, and ‘1 = Yes, with alcohol and/or drugs and clean’. Item content for each phenotype is provided in Table 2. Data collection for COGA was spread across multiple phases with different variants of the SSAGA at each phase. 5,353 of the COGA participants in our sample were assessed multiple times over several years. For these participants, we coded whether each form of aggression occurred at any assessment (1) or none of them (0).
Table 2.
SSAGA items and response codes, separated by phenotype. Bracketed text indicates modified context in later versions of the SSAGA (bracketed text before a parenthesis = first SSAGA version, bracketed text after a parenthesis = later SSAGA versions).
| Phenotype | Item Content |
|---|---|
| Alcohol-Related Aggression | ARA.1. Did you ever hit things or throw something when you had been drinking? |
| ARA.2. Did you ever hit [a significant other or] anyone in your family when you had been drinking? | |
| ARA.3. Did you ever hit anyone else when you had been drinking without getting into a fight? | |
| ARA.4. Did you ever get into physical fights while drinking? | |
| Drug-Related Aggression | Did you ever experience any physical fights because of your… |
| DRA.1. cocaine use? | |
| DRA.2. stimulant use? | |
| DRA.3. sedative use? | |
| DRA.4. opioid use? | |
| DRA.5. other drug use? | |
| Non-Substance-Related Aggression | NSRA.1. Did you start physical fights with persons other than your brothers or sisters 3 or more times? |
| NSRA.2. Did you [more than once / ever] use a weapon like a stick, gun or a knife [in a fight / to injure someone], other than in combat or as part of your job? Outside of fighting, have you ever physically injured anyone on purpose? | |
| NSRA.3. Outside of fighting, have you ever physically injured anyone on purpose? | |
| NSRA.4. Since you were 15, have you often hit, physically attacked, or thrown things at anyone, including your wife/husband/partner/ children? |
To ensure that alcohol naive participants were not included in reports of alcohol-related aggression, these items were skipped for participants who either: (I) reported having never consumed at least three drinks within a 24-hour period, or (II) reported that they had never consumed alcohol regularly (i.e., had at least one alcoholic drink per month for at least six consecutive months) and reported that that they had never been drunk (to the point where their speech was slurred or they were unsteady on their feet). To exclude drug naive participants from reports of drug-related aggression, each item that corresponded to a specific drug-type (i.e., cocaine, opiates, sedatives, stimulants, and other drugs) was skipped for participants who reported that they had not used that given drug-type at least 11 times in their life. In COGA’s phase 1 of data collection, the fourth non-substance-related aggression item was also skipped for participants who did not have at least two instances of conduct problems before the age of 18, lifetime alcohol problems, lifetime marijuana problems, or lifetime drug problems.
Procedure
Participants completed the SSAGA in person at one of the seven COGA data collection sites with a trained interviewer, or, if they were unable to travel to a data collection site, were interviewed by telephone. Approximately 20–34% of the SSAGA interviews were conducted over the phone, depending on when they were recruited (Kramer et al., 2009).
Data Analyses
We conducted a series of confirmatory factor analyses (CFA) using the lavaan (version 0.6; Rosseel, 2012) and semTools (version 0.5; Jorgensen, Pornprasertmanit, Schoemann, & Rosseel, 2019) packages in R statistical software (version 3.2.1; R Core Team, 2019). These CFAs employed weighted least squares estimation due to the binary nature of the indicators (Flora & Curran, 2004), error terms of each SSAGA item were uncorrelated, and (when applicable) each model estimated correlations between each latent factor. To set the scale of each latent factor, the first indicator of each factor was fixed to one.
Results
Descriptive Statistics
Descriptive statistics for all 13 SSAGA items are presented in Table 3, revealing a low endorsement rate of all three aggression phenotypes. Further, a considerable amount of data were missing from alcohol-related and drug-related forms of aggression.
Table 3.
The frequency and percentage of the 13,490 participants who endorsed or were missing data for each SSAGA aggression item. Missing data are due to incomplete interviews as well as instructions to skip items that were not relevant (e.g., skip alcohol-related aggression items for participants with no history of alcohol consumption).
| Item | N Yes | % Yes | N No | % No | N Missing | % Missing |
|---|---|---|---|---|---|---|
| ARA.1 | 3599 | 26.7 | 7763 | 57.5 | 2128 | 15.8 |
| ARA.2 | 1874 | 13.9 | 9488 | 70.3 | 2128 | 15.8 |
| ARA.3 | 1440 | 10.7 | 9918 | 73.5 | 2132 | 15.8 |
| ARA.4 | 3599 | 26.7 | 7762 | 57.5 | 2129 | 15.8 |
| DRA.1 | 706 | 5.2 | 9342 | 69.3 | 3442 | 25.5 |
| DRA.2 | 358 | 2.7 | 9350 | 69.3 | 3782 | 28.0 |
| DRA.3 | 219 | 1.6 | 9342 | 69.3 | 3929 | 29.1 |
| DRA.4 | 206 | 1.5 | 9372 | 69.5 | 3912 | 29.0 |
| DRA.5 | 210 | 1.6 | 9503 | 70.4 | 3777 | 28.0 |
| NSRA.1 | 1758 | 13.0 | 11658 | 86.4 | 74 | 0.5 |
| NSRA.2 | 858 | 6.4 | 12556 | 93.1 | 76 | 0.6 |
| NSRA.3 | 480 | 3.6 | 12935 | 95.9 | 75 | 0.6 |
| NSRA.4 | 878 | 6.5 | 11322 | 83.9 | 1290 | 9.6 |
NOTE: ARA = alcohol-related aggression, DRA = drug-related aggression, NSRA = non-substance-related aggression.
The substantial amount of missing data was mostly due to the screening procedures that prevented participants from answering many of these items if they did not exhibit sufficient levels of past alcohol, drug, or conduct issues.
Confirmatory Factor Analyses
The single-factor CFA exhibited largely inadequate model fit (Table 4), though all 13 items returned statistically-significant loadings onto the general aggression factor (Figure 1). Factor loadings were strongest for alcohol-related aggression items.
Table 4.
Model fit estimates of confirmatory factor analyses, with and without covariates (i.e., age, sex, ethnicity, race, and education-level).
| Factors | X2(df) | RMSEA | CFI | TLI | SRMR |
|---|---|---|---|---|---|
| No Covariates | |||||
| One | 1026.11(65)* | .045 | .944 | .933 | .094 |
| Two | 754.87(64)* | .038 | .960 | .951 | .089 |
| Three | 259.19(62)* | .021 | .989 | .986 | .042 |
| With Covariates | |||||
| One | 2,169.14(173)* | .039 | .909 | .897 | .062 |
| Two | 1,692.07(163)* | .036 | .930 | .916 | .058 |
| Three | 1,095.35(152)* | .029 | .957 | .945 | .034 |
NOTE: RMSEA = Root Mean Square Error of Approximation, CFI = Comparative Fit Index, TLI = Tucker-Lewis Index, SRMR = Standardized Root Mean Squared Residual.
p < .001.
Figure 1.
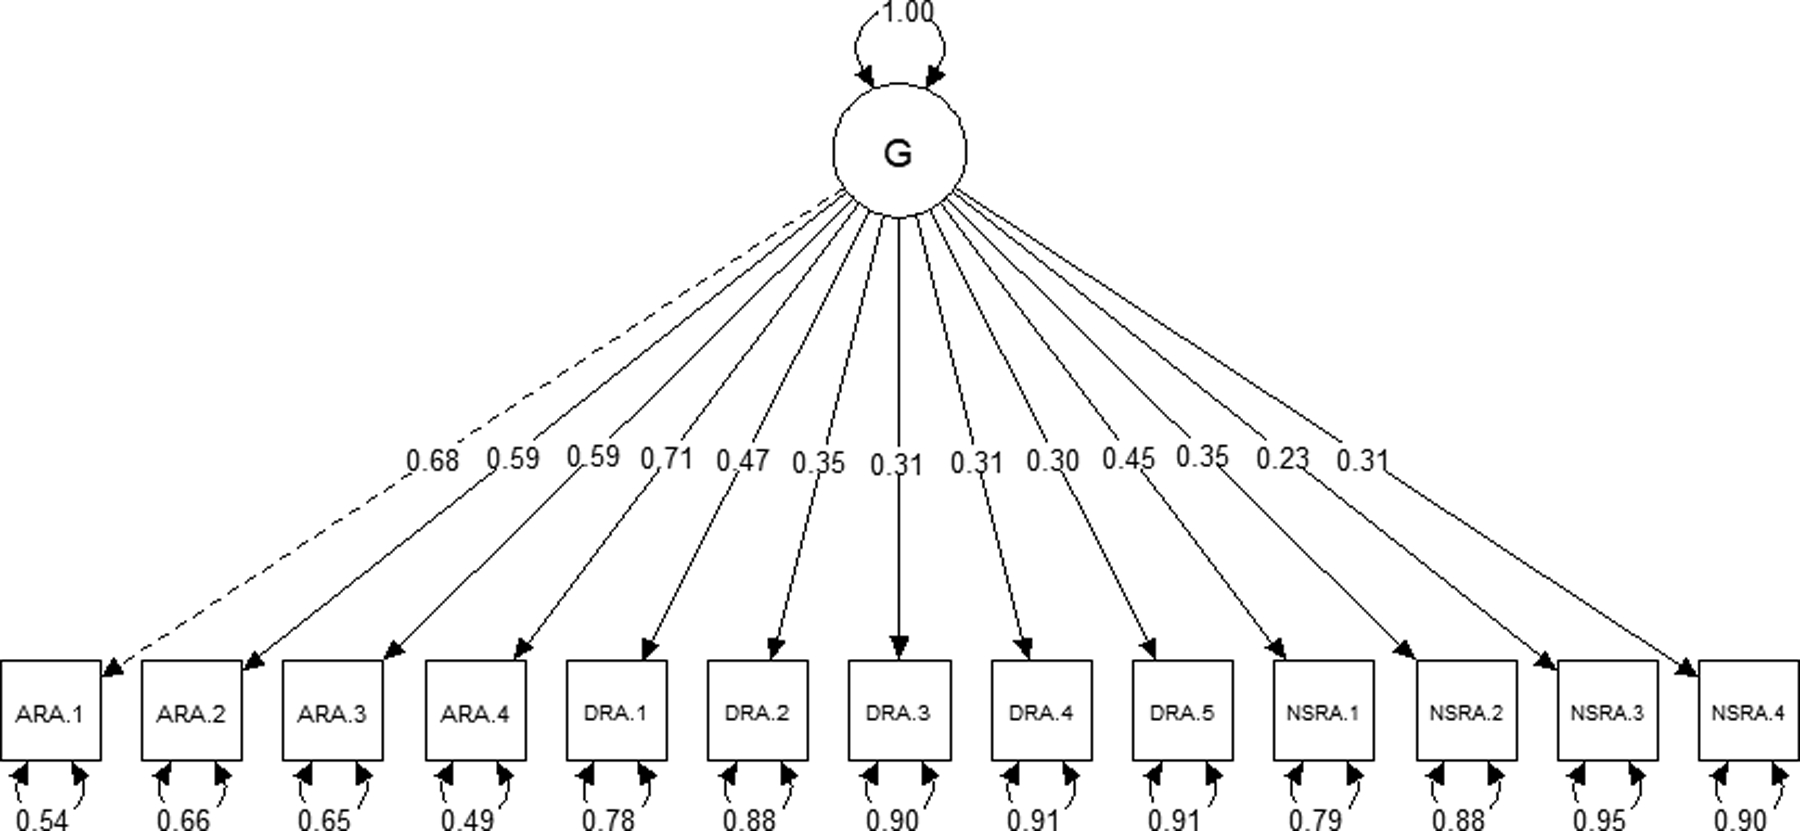
Results of the single-factor CFA. Values displayed over single-headed arrows represent standardized factor loadings and values displayed over curved, double-headed arrows represent standardized residual variances. The dashed loading was preset to one, as was the variance of G. Figure made with the semPlot package for R statistical software (Epskamp, 2015). ARA = alcohol-related aggression, DRA = drug-related aggression, NSRA = non-substance-related aggression, G = general aggression factor.
Modeling alcohol-related and drug-related aggression items as loading onto a substance-related factor and non-substance-related aggression items as loading into a second factor yielded improved model fit over the single aggression factor model, but not past an acceptable threshold (Figure 2; Table 4). All items exhibited statistically-significant loadings onto their respective factors and both factors were positively correlated (Figure 2). Within the substance-related aggression factor, alcohol-related aggression items exhibited stronger loadings than drug-related aggression.
Figure 2.
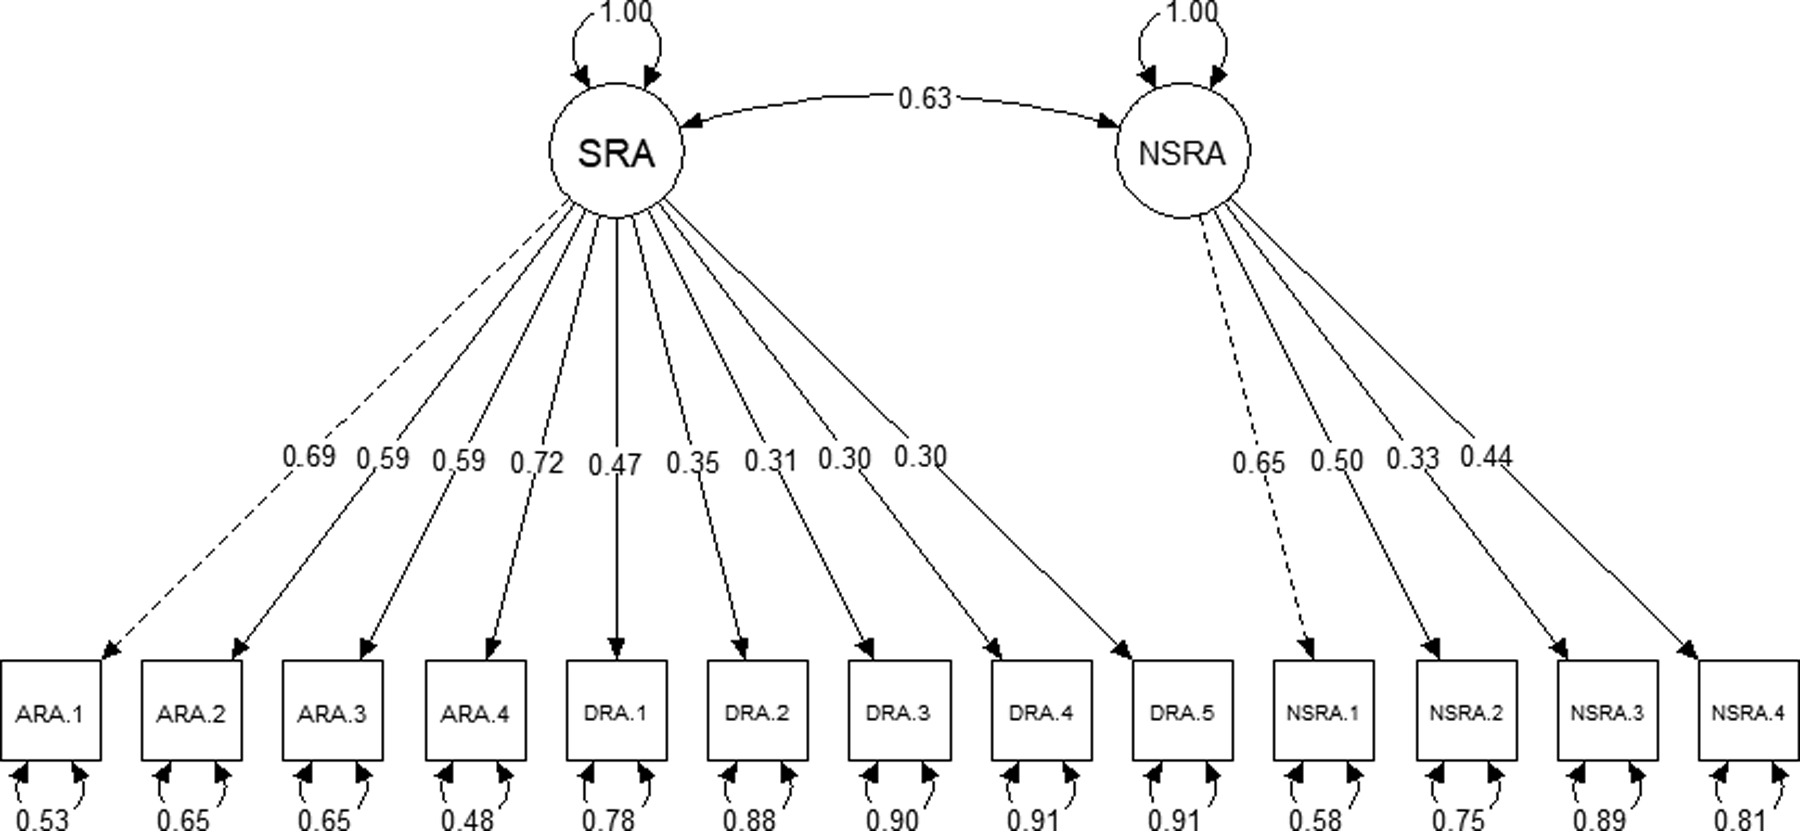
Results of the two-factor CFA. Values displayed over single-headed arrows represent standardized factor loadings and values displayed over curved, double-headed arrows represent standardized residual variances and the standardized inter-factor correlation. Dashed loadings were preset to one, as was the variance of each latent factor. ARA = alcohol-related aggression, DRA = drug-related aggression, NSRA = non-substance-related aggression, SRA = substance-related aggression.
We observed the best overall model fit when all three aggression types were modeled as separate factors (Figure 3; Table 4). All items exhibited statistically-significant loadings onto their respective factors. All three factors were positively-correlated, though the association was strongest between alcohol-related and non-substance-related aggression (Figure 3).
Figure 3.
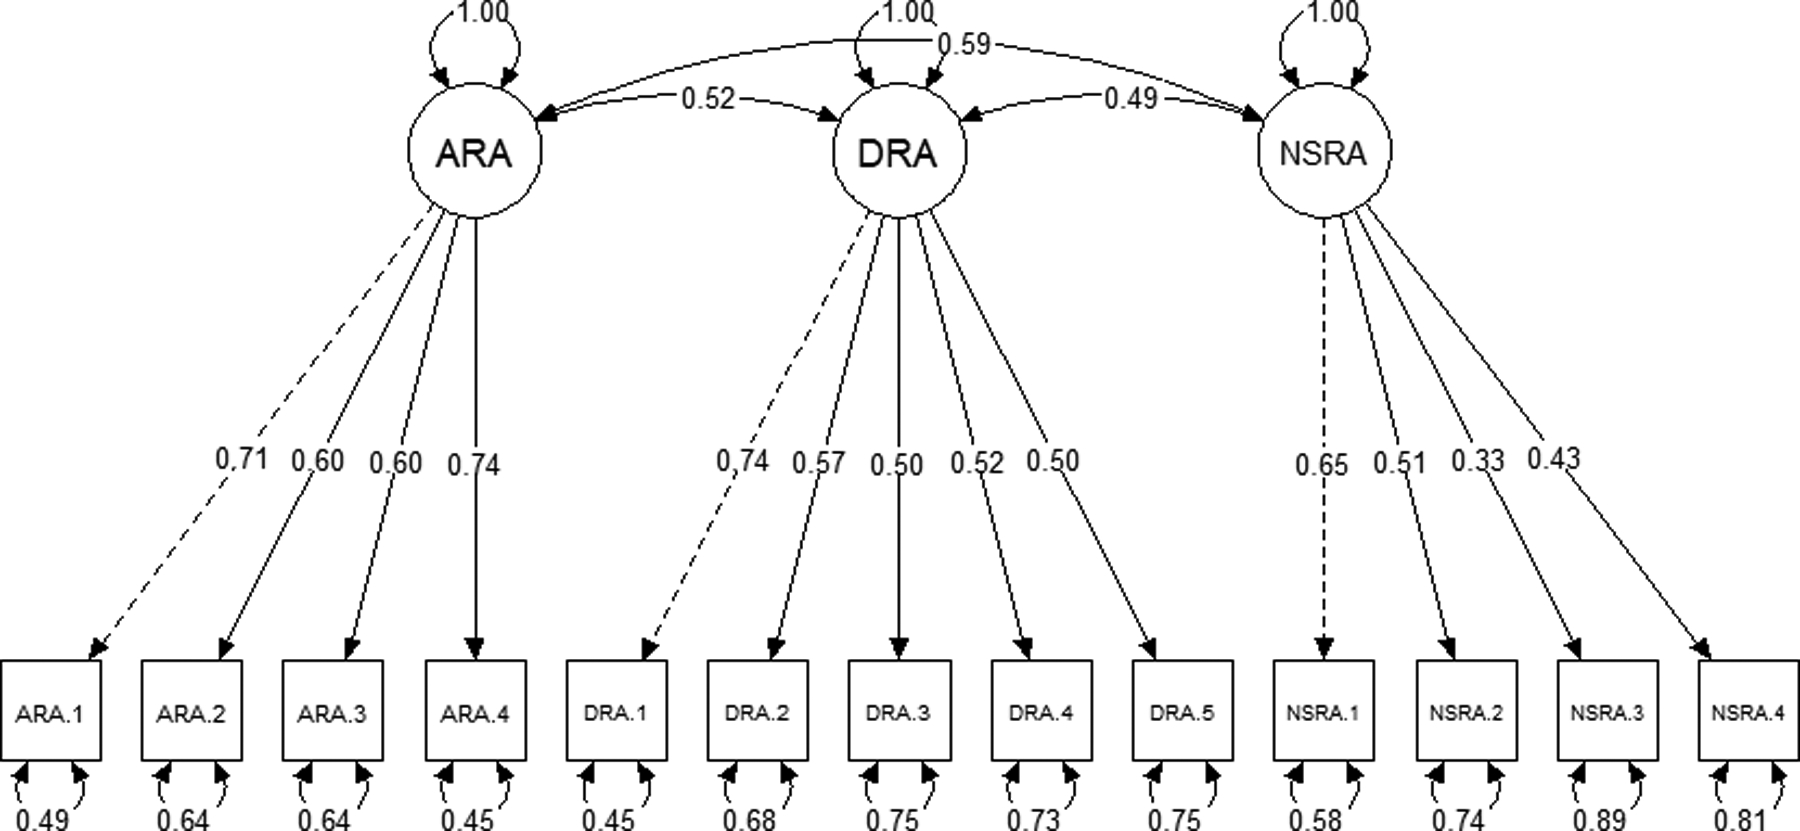
Results of the three-factor CFA. Values displayed over single-headed arrows represent standardized factor loadings and values displayed over curved, double-headed arrows represent standardized residual variances. Dashed loadings were preset to one, as was the variance of each latent factor. ARA = alcohol-related aggression, DRA = drug-related aggression, NSRA = non-substance-related aggression.
We added age, sex (coded: 1 = men, 2 = women), ethnicity (coded: 1 = Hispanic, 0 = Non-Hispanic), race (dummy variables for each racial group coded: 1 = member, 0 = non-member), and education-level (coded: 1 = completed high school, 0 = did not complete high school) as covariates of each latent factor. Doing so reduced overall model fit for each model (Table 4). Yet even with these added covariates, the three factor model still exhibited relatively better model fit than the one and two factor solutions (Table 4).
Exploratory Bi-Factor Analyses
A common approach to estimating whether a general (G) factor helps explain the relations among various specific (S) factors, is bi-factor modeling. In a symmetrical bi-factor model, each item loads onto its given S factor and the broader G factor. However, symmetrical bi-factor models are inappropriate unless the subscales can be construed as randomly drawn from a broader array of interchangeable S factors (Eid, Geiser, Koch, & Heene, 2017). Bi-factor-S-1 models circumvent this issue by leaving one S factor un-modeled, which allows that un-modeled S factor to conceptually define the G factor (Heinrich, Zagorscak, Eid, & Knaevelsrud, 2018).
We conducted a series of three bi-factor-S-1 models, in which we defined the G factor by not modeling one of three aggression phenotypes: alcohol-related, drug-related, and non-substance-related aggression. Each of these bi-factor-S-1 models exhibited improved fit to the data as compared to the three-factor model (Table 5). In comparing the bi-factor models to each other, drug-related aggression was the worst fitting general factor, non-substance-related aggression was a better fitting general factor, and alcohol-related aggression as the general factor was the best fitting model we tested (Figure 4; Table 5).
Table 5.
Model fit estimates for each bi-factor-S-1 factor analysis, separated by what variable was left unmodeled to define the general (G) factor: ARA = Alcohol-Related Aggression, DRA = Drug-Related Aggression, NSRA = Non-Substance-Related Aggression.
| G Factor | X2(df) | RMSEA | CFI | TLI | SRMR |
|---|---|---|---|---|---|
| ARA | 178.09(55)* | .017 | .993 | .990 | .026 |
| DRA | 207.64(56)* | .019 | .991 | .988 | .040 |
| NSRA | 184.61(55)* | .018 | .992 | .989 | .034 |
NOTE: RMSEA = Root Mean Square Error of Approximation, CFI = Comparative Fit Index, TLI = Tucker-Lewis Index, SRMR = Standardized Root Mean Squared Residual.
Figure 4.
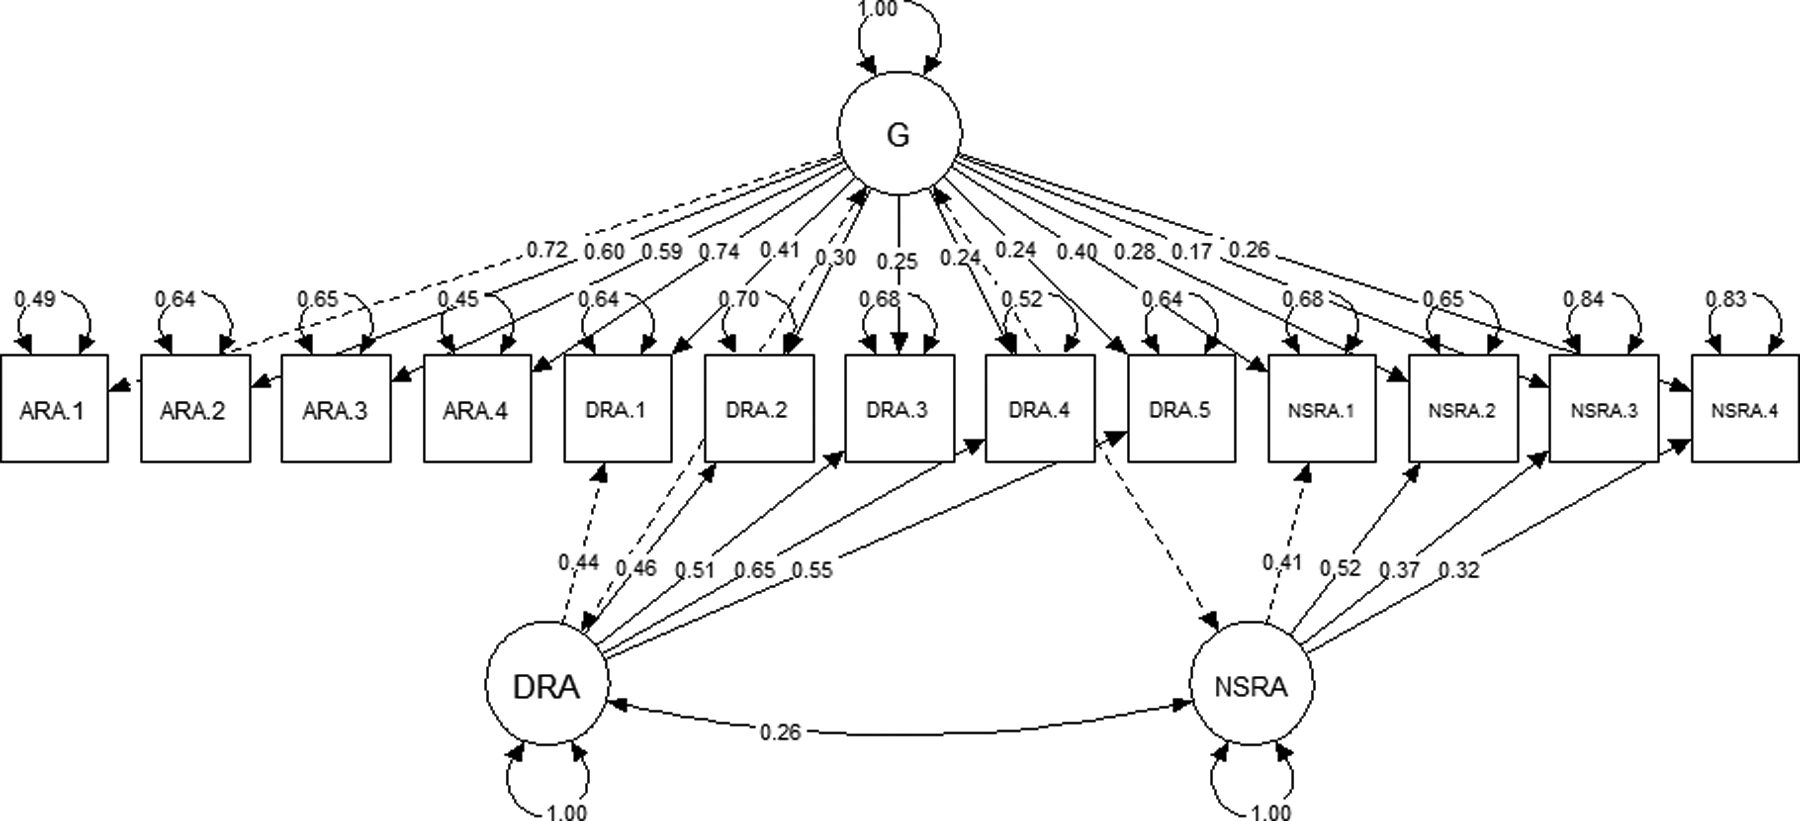
Standardized factor loadings, factor correlations, and residual variances for the bi-factor-S-1 model, in which ARA defined G. Dashed factor correlations were preset to zero and dashed factor loadings were preset to one. ARA = alcohol-related aggression, DRA = drug-related aggression, G = general aggression factor.
Model Invariance by Sex
We next tested whether the best-fitting models (i.e., the three-factor model and the bi-factor-S-1 model in which alcohol-related aggression defined the general factor) exhibited measurement invariance across men and women. These analyses were exploratory and not specified in our preregistration plan.
Three factor model.
The three factor model did exhibit configural invariance across men and women when sex was modeled as a grouping variable and compared to the three-factor model without this grouping variable, ΔX2(62) = 14.74, p = .999. However, the three factor model did not exhibit metric invariance across men and women when factor loadings were fit with equality constraints and this model was compared against the configural invariance model, ΔX2(10) = 249.63, p < .001. Indeed, the three-factor model exhibited a modestly better fit for men, X2 = 260.09, than women, X2 = 263.48. A potential reason for this differential model fit may be that the latent factor associations between two out of the three latent aggression factors were stronger for men than women (Table 6).
Table 6.
Latent factor associations from the three factor model, by sex.
| Sex | Factor Correlation | β | Z | p |
|---|---|---|---|---|
| Men | ARA <--> DRA | .51 | 32.97 | < .001 |
| ARA <--> NSRA | .59 | 31.74 | < .001 | |
| DRA <--> NSRA | .48 | 22.40 | < .001 | |
| Women | ARA <--> DRA | .53 | 23.42 | < .001 |
| ARA <--> NSRA | .50 | 24.42 | < .001 | |
| DRA <--> NSRA | .45 | 13.82 | < .001 |
NOTE: ARA = Alcohol-Related Aggression, DRA = Drug-Related Aggression, NSRA = Non-Substance-Related Aggression.
Bi-factor-S-1 model (alcohol-related aggression as general factor).
The bi-factor model in which alcohol-related aggression defined the general factor exhibited configural invariance across men and women, ΔX2(55) = 11.46, p = .999, but not metric invariance, ΔX2(19) = 343.45, p < .001. As in the three-factor model, the bi-factor model exhibited a better fit for men, X2 = 242.72, than women, X2 = 290.28. This differential model fit may be due to the association between drug-related and non-substance-related aggression being stronger for men, β = .33, Z = 8.43, p < .001, and absent for women, β = .05, Z = 0.87, p = .384.
Discussion
Aggressive behavior often occurs in the context of alcohol and drug misuse, though plenty of violence is committed by sober parties (Collins & Messerschmidt, 1993; Martin, 1992). Yet it remains unclear if these tendencies towards alcohol-related, drug-related, and non-substance-related aggression reflect a common aggressive disposition or if they reflect easily distinguishable phenotypes. Using confirmatory factor analyses, we found empirical support for our preregistered predictions that participants’ individual differences in these three phenotypes are accurately characterized as distinct, though modestly correlated, latent constructs. Indeed, this three factor model fit the data better than a single-factor model or a hybrid, two-factor approach in which alcohol-related and drug-related aggression items loaded onto a substance-related factor. These findings suggest that each of these three constructs might be unique additions to hierarchical taxonomies and nosologies of aggression phenotypes (Parrott & Giancola, 2007), which have previously neglected to articulate them among other forms of aggressive behavior.
Alcohol-Related Aggression as a Core Factor
Exploratory bi-factor-S-1 analyses demonstrated that variance across all three forms of aggression were also relatively and incrementally better explained by a general factor that was characterized by alcohol-related aggression. These findings imply that information about individuals’ tendency to be aggressive during alcohol consumption might accurately characterize their tendencies to be aggressive in relation to drug consumption and when sober. Indeed, alcohol-related aggression’s ability to serve as this general factor argues that it is more diagnostic of overall aggression than the other two facets and that alcohol-related violence cannot be viewed as entirely disentangled from violence in these other categories. What remains to be seen is if conceptual models of alcohol-related aggression (e.g., alcohol myopia theory; Steele & Josephs, 1990) can be translated to these other two domains by virtue of alcohol-related aggression’s ability to characterize overall aggressive tendencies. Because these analyses were exploratory, they should receive less inferential confidence than the ones we preregistered.
An important caveat to consider is the fact that many aggressive acts occur outside the context of alcohol consumption and misuse. Alcohol-related aggression’s ability to explain variance across these aggression domains may be an artifact of the heightened levels of alcohol misuse and other externalizing behaviors present in our sample. Our findings may or may not replicate in a sample that is comprised primarily of social or casual drinkers. Longitudinal studies that track individuals’ aggressive behavior before and after their initial exposures to alcohol misuse will be crucial in determining whether alcohol-related aggression is able to best explain overall aggressive tendencies. It may be that alcohol misuse serves as a litmus test of whether an individual will perpetrate harm upon others in other contexts, perhaps due to its disinhibiting and ubiquitous qualities (Giancola, 2002). More work is needed to determine whether alcohol-related aggression plays such a role.
Hierarchical Approaches
Psychopathology constructs can be articulated using hierarchical approaches in which higher-order, broad construct dimensions give rise to more specific phenotypes at lower levels (e.g., the Hierarchical Taxonomy of Psychopathology [HiTOP]; Kotov et al., 2017). The ability for a general factor, characterized by alcohol-related aggression, to best explain the variance across the three specific aggression phenotypes we examined suggests that a hierarchical approach is likely to be an accurate and generative means to studying aggressive behavior and its relations with other externalizing behaviors. Within the HiTOP model, aggression falls underneath the broader category of externalizing behaviors (Creswell, Wright, Flory, Skrzynski, & Manuck, 2019). Externalizing is split into ‘antagonistic externalizing’ (which subsumes antisocial behaviors such as aggression) and ‘disinhibited externalizing’ (which subsumes both antisocial behaviors and substance misuse; Kotov et al., 2017). Based on this articulation, alcohol-related and drug-related aggression are most likely to fall under both of these externalizing dimensions, whereas non-substance-related aggression is more likely to exclusively fall underneath ‘antagonistic externalizing’. Future research is needed to test these possibilities and subsequently place these three aggression phenotypes within the HiTOP and other hierarchical frameworks of externalizing behaviors and psychopathology.
Sex Differences
Our inferences cannot be applied to men and women in an identical fashion. Each of the three aggression factors were strongly, positively correlated with one another, but these associations differed by sex. Men exhibited stronger inter-factor correlations, suggesting that the distinctions between alcohol-related, drug-related, and non-substance-related aggression are fuzzier among men. These findings fit with previous research suggesting that alcohol’s and drugs’ effects on aggression are stronger among men than women (Giancola et al., 2009; Schnitzer et al., 2010). However, modeled fit was still acceptable within each sex group and lends confidence that the distinctions between each aggression construct might be accurately applied to both men and women.
These observed sex differences highlight the importance of future analyses that take a person-centered approach to investigate the overlap and distinctions among closely-related phenotypes. Person-centered analyses such as latent class and latent profile analyses, are able to identify whether individuals tend to cluster into different groups or longitudinal trajectories (Swartout & Swartout, 2012). If alcohol-related, drug-related, and non-substance-related aggression are indeed three distinct constructs, then person-centered analyses would show different clusters and trajectories of individuals based on different combinations of these three aggression phenotypes. If these three forms of aggression were all reflections of a single underlying construct, individuals might only differ based on whether they engaged in relatively higher or lower amounts of all three forms of aggression. Future person-centered research is needed in order to examine these possibilities.
Limitations and Future Directions
Our findings should be considered in light of 6 limitations. First, the SSAGA items had somewhat different methodological features across the three aggression types. For instance, some subscales asked participants about a wide range of aggressive acts whereas other subscales only asked about participation in “fights”. These sources of method-based variance might have amplified the distinctions we observed between these constructs. Future work should seek to replicate our work using measures with minimal methodological variance between categories. Second, our measure of drug-related aggression lumped together five different drug-types that were remarkably different from one another. Though each have been independently linked to aggressive acts, and all of them ultimately loaded onto the same factor, our results ignored the many meaningful differences between these different drugs. In the future, research should better articulate the similarities and differences in aggression between various types of drug misuse. Relatedly, our drug-related aggression measure excluded marijuana-related aggression. This was of less concern because marijuana misuse has been linked to lesser aggression (Myerscough & Taylor, 1985), yet this important and relatively frequent form of drug misuse and its relations to aggression and aggression types should be investigated in more detail. Third, our findings were correlational and experimental work is needed to examine the causal influence of alcohol and drug misuse in affecting aggressive behavior. Fourth, our measures were self-reported and retrospective, which are likely subject to biases and memory errors. Future research employing other measures that are less susceptible to bias should be conducted. Self-reports were also scored dichotomously, inherently eliminating much of the naturally-occurring variability in aggressive behavior. The future use of continuous measures that better capture the varying degrees of the various aggression phenotypes that exist in the real-world would alleviate such issues. Fifth, we had higher-than-desirable rates of missing data for several variables. These missing data were due to screening procedures that excluded individuals without considerable histories of substance misuse, as alcohol and drug naive individuals would have not had the opportunities to perpetrate alcohol-related and drug-related aggression. Yet 7,442 participants provided full SSAGA aggression datasets, lending further reliability to our findings. Sixth, participants in COGA were selected based on their heightened risk for alcohol misuse. Future studies are needed to determine whether our factor analytic results will hold in less risk-prone samples.
Conclusions
Our analyses probed the question of whether alcohol-related, drug-related, and non-substance-related aggression reflect three manifestations of a single construct, or are t] three entirely distinct constructs. Our findings suggest that the answer appears to be that they might be distinct. Additionally, our data suggest a more complex reality — that most of the variance across these three phenotypes can be explained by a general factor that is characterized by alcohol-related aggression. This large general factor reinforces the central role of alcohol in causing human violence, though more research is needed into the psychological and biological features it shares with other forms of aggression and those that make unique. Uncovering these processes will aid attempts to effectively intervene upon and reduce these different forms of violence.
Acknowledgments
The Collaborative Study on the Genetics of Alcoholism (COGA; Principal Investigators: B. Porjesz, V. Hesselbrock, H. Edenberg, & L. Bierut) includes 11 different centers: University of Connecticut (V. Hesselbrock); Indiana University (H.J. Edenberg, J. Nurnberger Jr. & T. Foroud); University of Iowa (S. Kuperman & J. Kramer); SUNY Downstate (B. Porjesz); Washington University in St. Louis (L. Bierut, J. Rice, K. Bucholz, & A. Agrawal); University of California at San Diego (M. Schuckit); Rutgers University (J. Tischfield & A. Brooks); University of Pennsylvania (L. Almasy); Virginia Commonwealth University (D. Dick); Icahn School of Medicine at Mount Sinai (A. Goate); and Howard University (R. Taylor). Other COGA collaborators include: L. Bauer (University of Connecticut); J. McClintick, L. Wetherill, X. Xuei, Y. Liu, D. Lai, S. O’Connor, M. Plawecki, S. Lourens (Indiana University); G. Chan (University of Iowa; University of Connecticut); J. Meyers, D. Chorlian, C. Kamarajan, A. Pandey, J. Zhang (SUNY Downstate); J.-C. Wang, M. Kapoor, S. Bertelsen (Icahn School of Medicine at Mount Sinai); A. Anokhin, V. McCutcheon, S. Saccone (Washington University); J. Salvatore, F. Aliev, B. Cho (Virginia Commonwealth University); and Mark Kos (University of Texas Rio Grande Valley). A. Parsian and H. Chin are the NIAAA Staff Collaborators. We continue to be inspired by our memories of Henri Begleiter and Theodore Reich, founding PI and Co-PI of COGA, and also owe a debt of gratitude to other past organizers of COGA, including P. Ting-Kai Li. Michael Conneally, Raymond Crowe, and Wendy Reich, for their critical contributions. This national collaborative study is supported by NIH grant U10AA008401 from the National Institute on Alcohol Abuse and Alcoholism (NIAAA) and the National Institute on Drug Abuse (NIDA). Research reported in this publication was further supported by the NIAAA under awards K01AA026647 (PI: Chester), K01AA024152 (PI: Salvatore), and K02AA018755 (PI: Dick).
Footnotes
The results of our preregistered analyses did not meaningfully differ if the preregistered sample of 9,325 participants was used instead of this larger sample.
References
- Allen JJ, & Anderson C (2017). Aggression and violence: Definitions and distinctions In Sturmey P (Ed.), The Wiley Handbook of Violence and Aggression. John Wiley & Sons. [Google Scholar]
- American Psychiatric Association. (2000). Diagnostic and statistical manual of mental disorders. American Psychiatric Publishing. [Google Scholar]
- Begleiter H, Reich T, Hesselbrock V, Porjesz B, Li TK, Schuckit MA, Edenberg HJ, & Rice JP (1995). The collaborative study on the genetics of alcoholism. Alcohol Health and Research World, 19, 228–228.31798102 [Google Scholar]
- Berke DS, Leone R, Parrott D, & Gallagher KE (2020). Drink, don’t think: The role of masculinity and thought suppression in men’s alcohol-related aggression. Psychology of Men & Masculinities, 21(1), 36–45. [DOI] [PMC free article] [PubMed] [Google Scholar]
- Bucholz KK, Cadoret R, Cloninger CR, Dinwiddie SH, Hesselbrock VM, Nurnberger JI Jr, Reich T, Schmidt I, & Schuckit MA (1994). A new, semi-structured psychiatric interview for use in genetic linkage studies: A report on the reliability of the SSAGA. Journal of Studies on Alcohol, 55(2), 149–158. [DOI] [PubMed] [Google Scholar]
- Bucholz KK, Heath AC, Reich T, Hesselbrock VM, Krarner JR, Nurnberger JI Jr, & Schuckit MA (1996). Can we subtype alcoholism? A latent class analysis of data from relatives of alcoholics in a multicenter family study of alcoholism. Alcoholism: Clinical and Experimental Research, 20(8), 1462–1471. [DOI] [PubMed] [Google Scholar]
- Centers for Disease Control and Prevention. (2014). Cost of injury report – 2010. Retrieved from https://wisqars.cdc.gov:8443/costT/.
- Centers for Disease Control and Prevention. (2019). Fatal injury report – 2017. Retrieved from https://webappa.cdc.gov/sasweb/ncipc/mortrate.html.
- Chermack ST, Murray RL, Walton MA, Booth BA, Wryobeck J, & Blow FC (2008). Partner aggression among men and women in substance use disorder treatment: Correlates of psychological and physical aggression and injury. Drug and Alcohol Dependence, 98(1–2), 35–44 [DOI] [PMC free article] [PubMed] [Google Scholar]
- Collins JJ, & Messerschmidt PM (1993). Epidemiology of alcohol-related violence. Alcohol Health & Research World, 17(2), 93–100. [Google Scholar]
- Creswell KG, Wright AG, Flory JD, Skrzynski CJ, & Manuck SB (2019). Multidimensional assessment of impulsivity-related measures in relation to externalizing behaviors. Psychological Medicine, 49(10), 1678–1690. [DOI] [PMC free article] [PubMed] [Google Scholar]
- Dawe S, Davis P, Lapworth K, & McKetin R (2009). Mechanisms underlying aggressive and hostile behavior in amphetamine users. Current Opinion in Psychiatry, 22(3), 269–273. [DOI] [PubMed] [Google Scholar]
- Eid M, Geiser C, Koch T, & Heene M (2017). Anomalous results in G-factor models: Explanations and alternatives. Psychological Methods, 22(3), 541–562. [DOI] [PubMed] [Google Scholar]
- Epskamp S (2015). semPlot: Unified visualizations of structural equation models. Structural Equation Modeling, 22(3), 474–483. [Google Scholar]
- Federal Bureau of Investigation. (2019). Crime in the United States 2018. Retrieved from https://ucr.fbi.gov/crime-in-the-u.s/2018/crime-in-the-u.s.−2018/topic-pages/violent-crime.
- Flora DB, & Curran PJ (2004). An empirical evaluation of alternative methods of estimation for confirmatory factor analysis with ordinal data. Psychological Methods, 9(4), 466–491. [DOI] [PMC free article] [PubMed] [Google Scholar]
- Giancola PR (2002). Alcohol-related aggression in men and women: the influence of dispositional aggressivity. Journal of Studies on Alcohol, 63(6), 696–708. [DOI] [PubMed] [Google Scholar]
- Giancola PR, Helton EL, Osborne AB, Terry MK, Fuss AM, & Westerfield JA (2002). The effects of alcohol and provocation on aggressive behavior in men and women. Journal of Studies on Alcohol, 63(1), 64–73. [PubMed] [Google Scholar]
- Giancola P, Levinson C, Corman M, Godlaski A, Morris D, Phillips J, & Holt J (2009). Men and women, alcohol and aggression. Experimental and Clinical Psychopharmacology, 17(3), 154–164. [DOI] [PubMed] [Google Scholar]
- Heinrich M, Zagorscak P, Eid M, & Knaevelsrud C (2018). Giving G a meaning: An application of the bifactor-(S-1) approach to realize a more symptom-oriented modeling of the Beck Depression Inventory–II. Assessment [no volume, issue, or page information available]. [DOI] [PubMed] [Google Scholar]
- Hesselbrock M, Easton C, Bucholz KK, Schuckit M, & Hesselbrock V (1999). A validity study of the SSAGA‐a comparison with the SCAN. Addiction, 94(9), 1361–1370. [DOI] [PubMed] [Google Scholar]
- Jorgensen TD, Pornprasertmanit S, Schoemann AM, & Rosseel Y (2019). semTools: Useful tools for structural equation modeling (version 0.5–2) [Software]. Retrieved from https://CRAN.R-project.org/package=semTools.
- Kotov R, Krueger RF, Watson D, Achenbach TM, Althoff RR, Bagby RM, Brown TA, Carpenter WT, Caspi A, Clark LA, Eaton NR, Forbes MK, Forbush KT, Goldberg D, Hasin D, Hyman SE, Ivanova MY, Lynam DR, Markon K, Miller JD, Moffitt TE, Morey LC, Mullins-Sweatt SN, Ormel J, Patrick CJ, Regier DA, Rescorla L, Ruggero CJ, Samuel DB, Sellbom M, Simms LJ, Skodol AE, Slade T, South SC, Tackett JL, Waldman ID, Waszczuk MA, Widiger TA, Wright AGC, & Zimmerman M (2017). The hierarchical taxonomy of psychopathology (HiTOP): A dimensional alternative to traditional nosologies. Journal of Abnormal Psychology, 126(4), 454–477. [DOI] [PubMed] [Google Scholar]
- Kramer JR, Chan G, Kuperman S, Bucholz KK, Edenberg HJ, Schuckit MA, Polgreen LA, Kapp ES, Hesselbrock VM,Nurnberger JI Jr, & Bierut LJ (2009). A comparison of diagnoses obtained from in-person and telephone interviews, using the semi-structured assessment for the genetics of alcoholism (SSAGA). Journal of Studies on Alcohol and Drugs, 70(4), 623–627. [DOI] [PMC free article] [PubMed] [Google Scholar]
- Licata A, Taylor S, Berman M, & Cranston J (1993). Effects of cocaine on human aggression. Pharmacology Biochemistry and Behavior, 45(3), 549–552. [DOI] [PubMed] [Google Scholar]
- Martin SE (1992). The epidemiology of alcohol-related interpersonal violence. Alcohol Health & Research World, 16(3), 230–238. [Google Scholar]
- Murray HW, Patkar AA, Mannelli P, DeMaria P, Desai AM, & Vergare MJ (2003). Relationship of aggression, sensation seeking, and impulsivity, with severity of cocaine use. Addictive Disorders & Their Treatment, 2(4), 113–121. [Google Scholar]
- Myerscough R & Taylor S (1985). The effects of marijuana on human physical aggression. Journal of Personality and Social Psychology, 49(6), 1541–1546. [DOI] [PubMed] [Google Scholar]
- National Institute of Justice. (1991). Drug use forecasting 1991 report. Retrieved from https://www.bjs.gov/content/pub/pdf/DRRC.PDF.
- Nurnberger JI, Wiegand R, Bucholz K, O’Connor S, Meyer ET, Reich T, Rice J, Schuckit M, King L, Petti T, Bierut L, Hinrichs AL, Kuperman S, Hesselbrock V, & Porjesz B (2004). A family study of alcohol dependence: Coaggregation of multiple disorders in relatives of alcohol-dependent probands. Archives of General Psychiatry, 61(12), 1246–1256. [DOI] [PubMed] [Google Scholar]
- Parrott DJ, & Eckhardt CI (2018). Effects of alcohol on human aggression. Current Opinion in Psychology, 19, 1–5. [DOI] [PMC free article] [PubMed] [Google Scholar]
- Parrott DJ, & Giancola PR (2007). Addressing “The criterion problem” in the assessment of aggressive behavior: Development of a new taxonomic system. Aggression and Violent Behavior, 12(3), 280–299. [Google Scholar]
- Pihl RO, & Sutton R (2009). Drugs and aggression readily mix: So what now? Substance Use & Misuse, 44(9–10), 1188–1203. [DOI] [PubMed] [Google Scholar]
- R Core Team (2019). R: A language and environment for statistical computing (version 3.2) [Software]. R Foundation for Statistical Computing. Available from https://www.R-project.org/. [Google Scholar]
- Rosseel Y (2012). Lavaan: An R package for structural equation modeling and more (version 0.6–5) [Software]. Journal of Statistical Software, 48(2), 1–36. Available from http://www.jstatsoft.org/v48/i02/. [Google Scholar]
- Schnitzer S, Bellis MA, Anderson Z, Hughes K, Calafat A, Juan M, & Kokkevi A (2010). Nightlife violence: A gender-specific view on risk factors for violence in nightlife settings: a cross-sectional study in nine European countries. Journal of Interpersonal Violence, 25(6), 1094–1112. [DOI] [PubMed] [Google Scholar]
- Severance L, Bui‐Wrzosinska L, Gelfand MJ, Lyons S, Nowak A, Borkowski W, Soomro N, Soomro N, Rafaeli A, Treister DE, Lin CC, & Yamaguchi S (2013). The psychological structure of aggression across cultures. Journal of Organizational Behavior, 34(6), 835–865. [Google Scholar]
- Steele C, & Josephs R (1990). Alcohol myopia: Its prized and dangerous effects. American Psychologist, 45(8), 921–933. [DOI] [PubMed] [Google Scholar]
- Swartout K, & Swartout A (2012). Shifting perspectives: Applying person-centered analyses to violence research. Psychology of Violence, 2(4), 309–312. [Google Scholar]