

Abstract
3-(1’-Hexyloxyethyl)-3-devinyl-pyropheophorbide-a (HPPH or Photochlor), a tumor-avid chlorophyll-a derivative currently undergoing human clinical trials, was conjugated at various peripheral positions (position-17 or 20) of HPPH with either Gd(III)-aminobenzyl-DTPA (Gd(III) DTPA) or Gd(III)-aminoethylamido-DOTA (Gd(III) DOTA). The corresponding conjugates were evaluated for in vitro PDT efficacy, T1, T2 relaxivities, in vivo fluorescence, and MR imaging under similar treatment parameters. Among these analogs, the water-soluble Gd(III)-aminoethylamido-DOTA linked at position-17 of HPPH, i.e., HPPH-17-Gd(III) DOTA, demonstrated strong potential for tumor imaging by both MR and fluorescence, while maintaining the PDT efficacy in BALB/c mice bearing Colon-26 tumors (7/10 mice were tumor free on day 60). In contrast to Gd(III) DTPA (Magnevist) and Gd(III) DOTA (Dotarem), the HPPH-Gd(III) DOTA retains in the tumor for a long period of time (24 to 48 h) and provides an option of fluorescence-guided cancer therapy. Thus, a single agent can be used for cancer-imaging and therapy. However, further detailed pharmacokinetic, pharmacodynamic, and toxicological studies of the conjugate are required before initiating Phase I human clinical trials.
Graphical Abstract
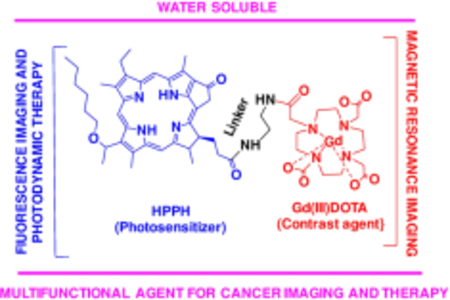
Single agent, dual function: HPPH, a highly effective photosensitizer conjugated with Gd(III) DOTA shows excellent dual-imaging capacity (fluorescence and magnetic resonance) of tumors and retains its photodynamic therapy (PDT) efficacy of exposing the tumors with an appropriate wavelength of light. This single agent can be used for cancer imaging and therapy.
Introduction
Magnetic resonance imaging (MRI) is a versatile medical imaging technique that provides a multitude of applications in medicine, including oncological (cancer) imaging1–5. MRI provides excellent spatial resolution and yields unparalleled soft tissue contrast in living subjects that can be further augmented with the use of contrast-enhancing agents. This makes MRI highly useful for obtaining detailed morphological information for solid tumors. Unlike PET or CT, MRI does not use ionizing radiation which in turn reduces potential health risks to patients during imaging sessions. Furthermore, MRI has no practical limits in the depth of penetration into the living subjects, a significant advantage over optical fluorescence and ultrasound imaging. However, MRI has poor sensitivity and is significantly more expensive6 relative to other imaging modalities. These shortcomings of MRI can be compensated to a degree with optical fluorescence imaging (OFI) in the near-infrared range of the electromagnetic spectrum as OFI’s strengths include fast acquisition, high sensitivity and low cost. Therefore, complementing the high-resolution gross anatomy from MRI with information provided by optical fluorescence imaging offers the opportunity to further expand the clinical applications of both modalities and provide a more comprehensive overview of the diseased state7,8.
In recent years, our laboratory has been focused on developing bi-functional agents for tumor imaging and photodynamic therapy (PDT)9–11. PDT is a localized therapy that works via the creation of cytotoxic singlet oxygen formed by shining laser light at an appropriated wavelength onto a tumor-avid photosensitizer that has been administered intravenously to patients12,13. One of the first generation photosensitizers approved by FDA was porfimer sodium (Photofrin), which has been shown to be effective against Barrett’s esophagus, cervical, endobronchial, and papillary bladder cancers14,15. However, Photofrin has two limitations: Photofrin cannot absorb energy efficiently at longer wavelengths (peak absorbance 635 nm) which limits its effectiveness against deep-seated tumors, and second, residual Photofrin delocalizes throughout the skin resulting in unwanted skin photosensitivity. These limitations have led to the development of second-generation photosensitizers that are activated by light at longer wavelength (e. g., chlorins) and are more tumor avid. One such photosensitizer is 3-(1-hexyloxyethyl) pyro pheophorbide-a (HPPH), which exhibits a strong absorption at 665 nm in vivo, and is currently in phase I/II clinical trials for the treatment of esophageal, lung, and head & neck cancers14. Furthermore, unlike many porphyrin-based compounds, HPPH has a relatively high quantum yield which makes it a suitable fluorophore for optical fluorescence imaging. Therefore, HPPH presents itself as a promising bi-functional agent and may allow the use of imaging to better guide the therapy by improving the conspicuity of tumors17. To understand the impact of HPPH structural modifications in cell-specificity, we have evaluated a variety of photosensitizers and observed that the position of substituents, small molecules or targeting group(s) in the parent photosensitizer make a significant difference in tumor-uptake, tumor-retention and biological efficacy.18
We have previously reported the utility of HPPH in delivering MR-imaging agent Gd(III) DTPA, conjugated at position-17 of the photosensitizer to tumors without diminishing its in vivo PDT activity19–21 The solubility of the conjugates increased by increasing the number of GD(III) DTPA moieties. However, formulating these conjugates at higher concentrations was problematic. In addition to Gd(III) DTPA (Magnevist™) a variety of Gd(III)-based chelates, e. g., Gd(III) DOTA22 has also created considerable interest due to its enhanced water solubility and favorable thermodynamic stability. Therefore, the objective(s) of our study was to conjugate Gd(III) DOTA at position-17 and 20 of the HPPH moiety, and investigate the difference in tumor-imaging and therapy of the four conjugates 4, 6, 8 & 9 (Scheme 1) for comparative MR imaging ability.
Scheme 1.
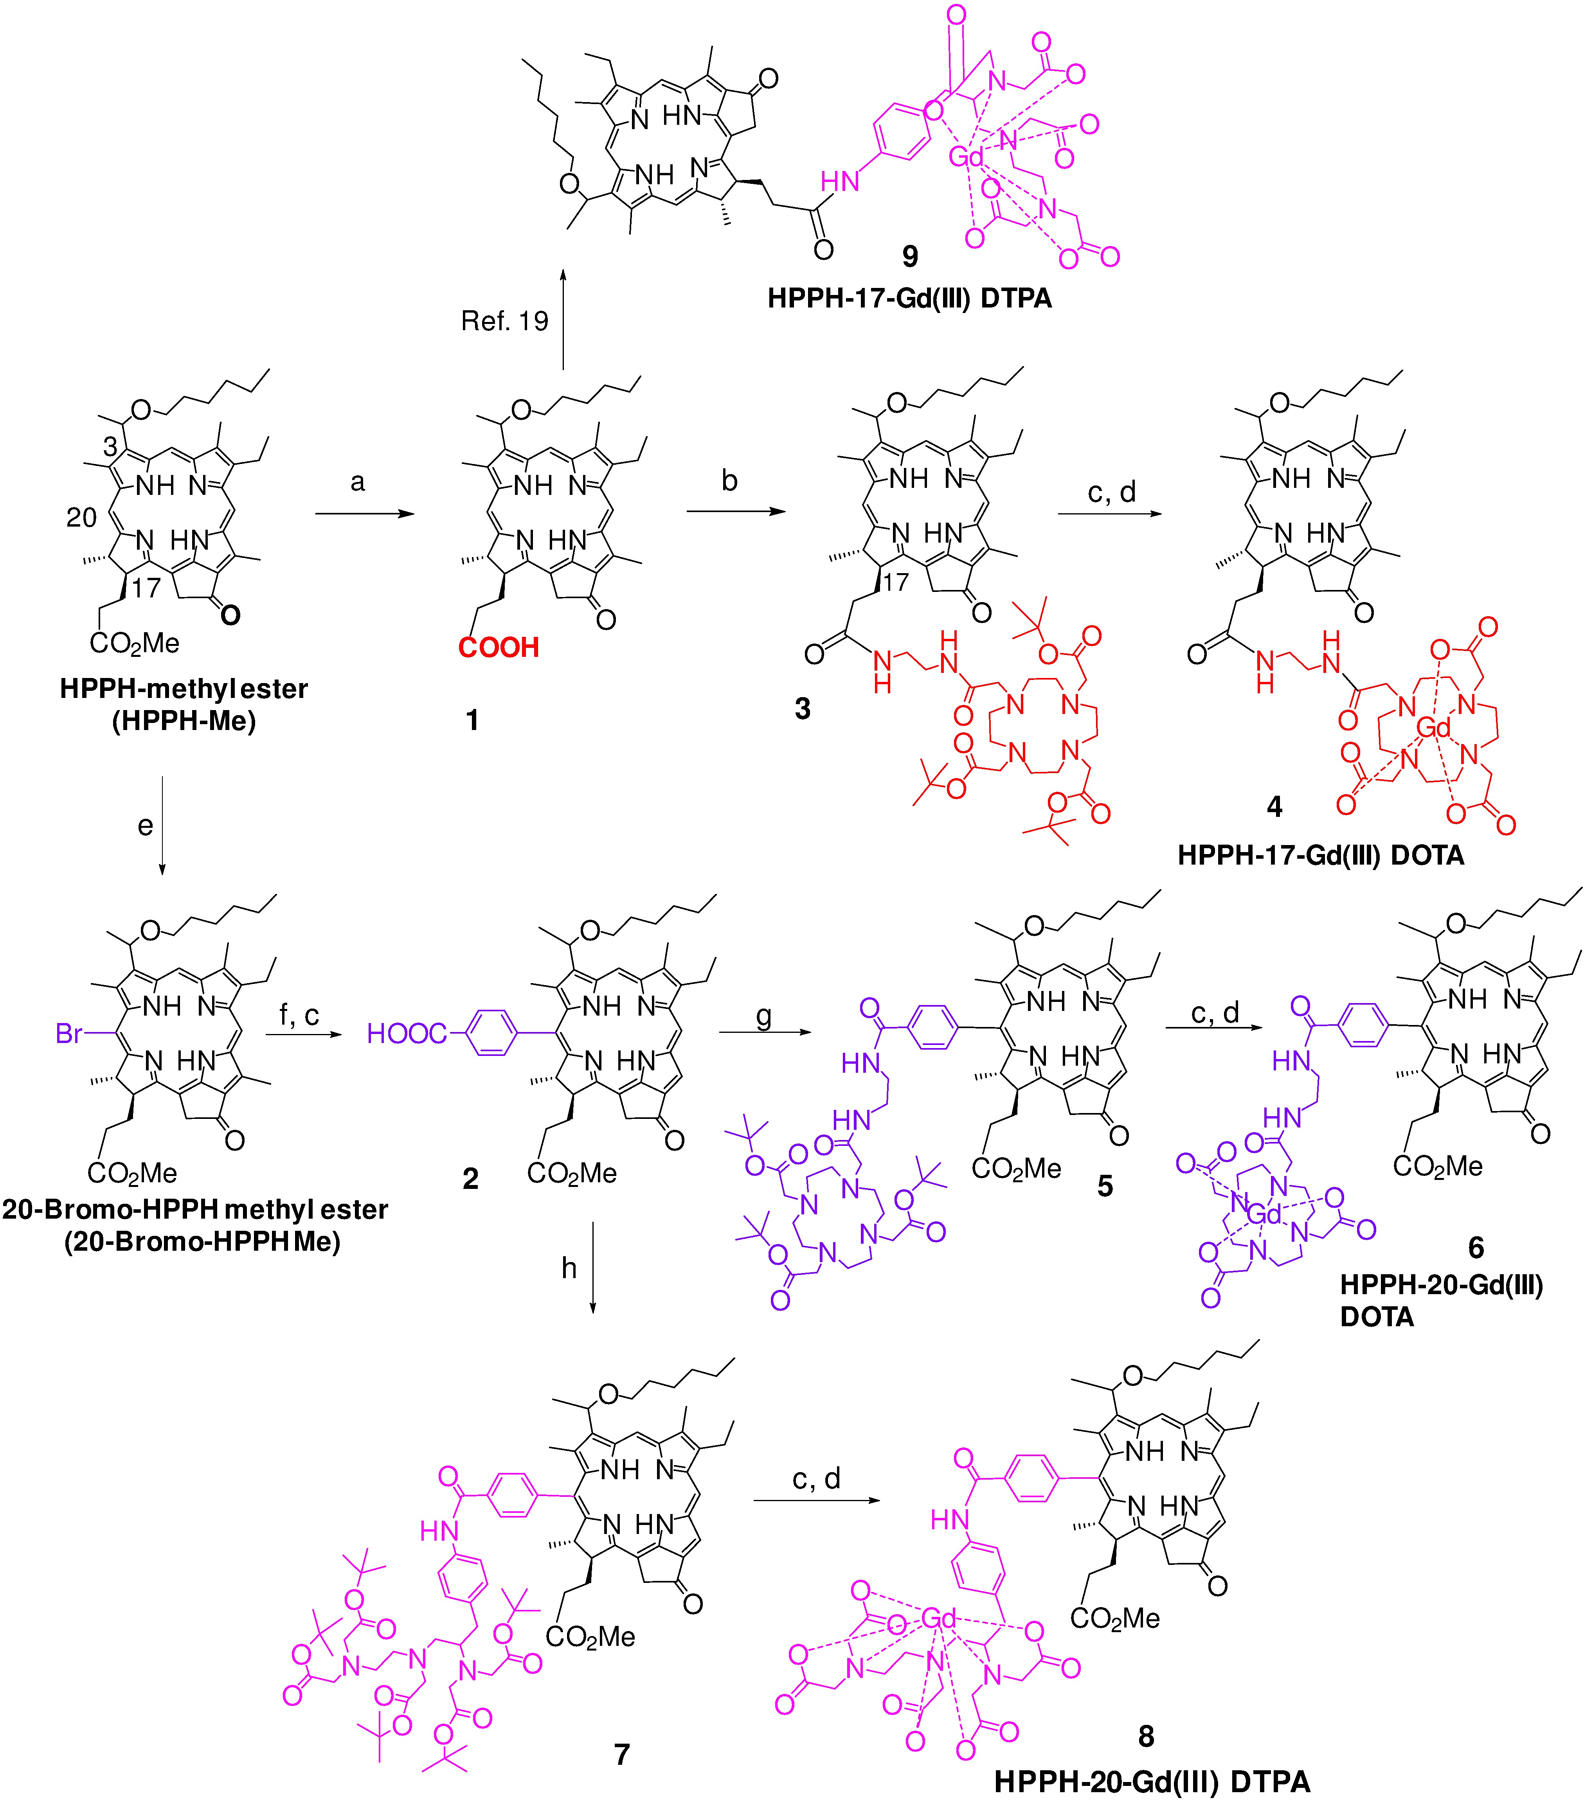
Synthesis of 17- and 20- substituted HPPH-Gd(III) DTPA and DOTA conjugates: a) LiOH in H20, MeOH, THF; b) 2-Aminoethyl-DOTA-tris(tert-butyl ester), DMTMM, THF; c) 70% TFA/CH2Cl2; d) Pyridine, GdCl3.6H20; e) Pyridinium tribromide, pyridine (cat), CH2Cl2; f) 3-(tert-Butoxycarbonyl)phenylboronic acid pinacol ester Pd (PPh3)4; K3PO4, THF; g) 2-Aminoethyl-DOTA-tris(tert-butyl ester), PyBOP, Et3N, DMF; h) p-NH2-Bn-DTPA-penta(tert-butyl ester), PyBOP, Et3N, DMF.
Results and Discussion
Chemistry
HPPH-DTPA conjugate 9 in which the PS was linked with a Gd(III)DTPA moiety at position-17 was synthesized by following previously reported methodology.19 The synthesis of related conjugates in which Gd(III) DTPA and Gd(III) DOTA were conjugated at position-20, and Gd(III) DOTA at position-17 of HPPH moiety were prepared by following the reaction sequences depicted in Scheme 1.
In brief, for introducing Gd(III) DOTA as position-172, the methyl ester functionality was converted into the corresponding carboxylic acid and then reacted with 2-aminoethyl-DOTA-tris(t-Bu ester). The butyl ester functionalities were converted into the corresponding carboxylic acid by reacting with trifluoroacetic acid (TFA). The intermediate tricarboxylic analog was reacted with gadolinium chloride (GdCl3), and the conjugate 4 was isolated in 86% yield. For introducing the Gd chelates at position-20, HPPH methyl ester was first reacted with pyridinium bromide following our own methodology and afforded the corresponding 20-bromo analog.23 It was further reacted with 3-(tert-butoxycarbonyl)phenylboronic acid pinacol ester under Suzuki reaction conditions and the intermediate 20-benzoic acid derivative 2 was obtained in good yield after treating the intermediate with TFA. It was individually reacted with amino-functionalized DOTA and DTPA, and the corresponding intermediates bearing tert-butyl ester functionalities 5 and 7 thus obtained were treated with TFA before converting them in to respective HPPH-Gd(III) DOTA 6 and Gd(III) DTPA analog 8.
Formulation of conjugates
(a). Liposomal formulation
Due to limited solubility of the conjugates 4, 6, 8 and 9 in water, they were initially formulated into liposomes. A ratio of 2:1 60% lecithin to cholesterol (Sigma) by mass was dissolved in a minimal amount of dichloromethane in a large-mouthed test tube. The CH2Cl2 was then evaporated by purging with nitrogen slowly while the test tube was kept warm by warm water bath. The test tube was then placed into a desiccator under high vacuum for 1 h to ensure complete removal of the solvent. The agent was weighed out in a ratio of 2:1 60% lecithin to compound by mass and placed into another large test tube. Phosphate buffered saline (PBS, 6 mL, pH 7.2) was added to the compound and sonicated for 5–10 min. This mixture was then pipetted into the test tube with the liposome film and sonicated for 2 h immersed in ice cold water to dissipate heat. After 2 hours the solution was filtered through a 0.45 μm filter, then through a 0.2 μm filter into a plastic culture tube and wrapped in aluminum foil, storing at −18 °C.
(b). PBS formulation
The more hydrophilic conjugate 4 was also formulated in PBS by dissolving the photosensitizer in PBS (1 mL, pH 7.4) on sonication for 15 min. The solution was then filtered using a 0.45 μm filter, and finally with a 0.2 μm filter. For clarity, the PBS formulation of conjugate 4 is identified as 4P, while the liposomal formulation is reported as 4L. The other conjugates 6, 8, 9 showed limited solubility in PBS, and were formulated in liposomes.
To determine the concentration of the conjugate in various formulations, a portion of the particular formulation was diluted 1:100 with MeOH. Drug concentrations were determined by UV-visible spectroscopy on a Varian spectrophotometer using the Beer-Lambert law and the extinction coefficients previously determined (Supporting Information).
Spectroscopic properties of the conjugates
To determine the effect of the nature and position of gadolinium chelator conjugation on the absorption and fluorescence properties of the conjugates 4, 6 and 8 were compared with HPPH for their absorption and fluorescence properties at a concentration of 0.5 μM. As can be seen in Figure 1, there was a red-shift of approximately 10 nanometers in the long wavelength absorption (670 nm) for the 20-position conjugates (6 and 8) derived from HPPH and the 17-position conjugate (4, 660 nm). This shift was typical for 20-position phenyl substituted HPPH moieties due to the extension of conjugation. The extinction coefficient values for all the conjugates were similar and were ~47,500 in methanol.
Figure 1.
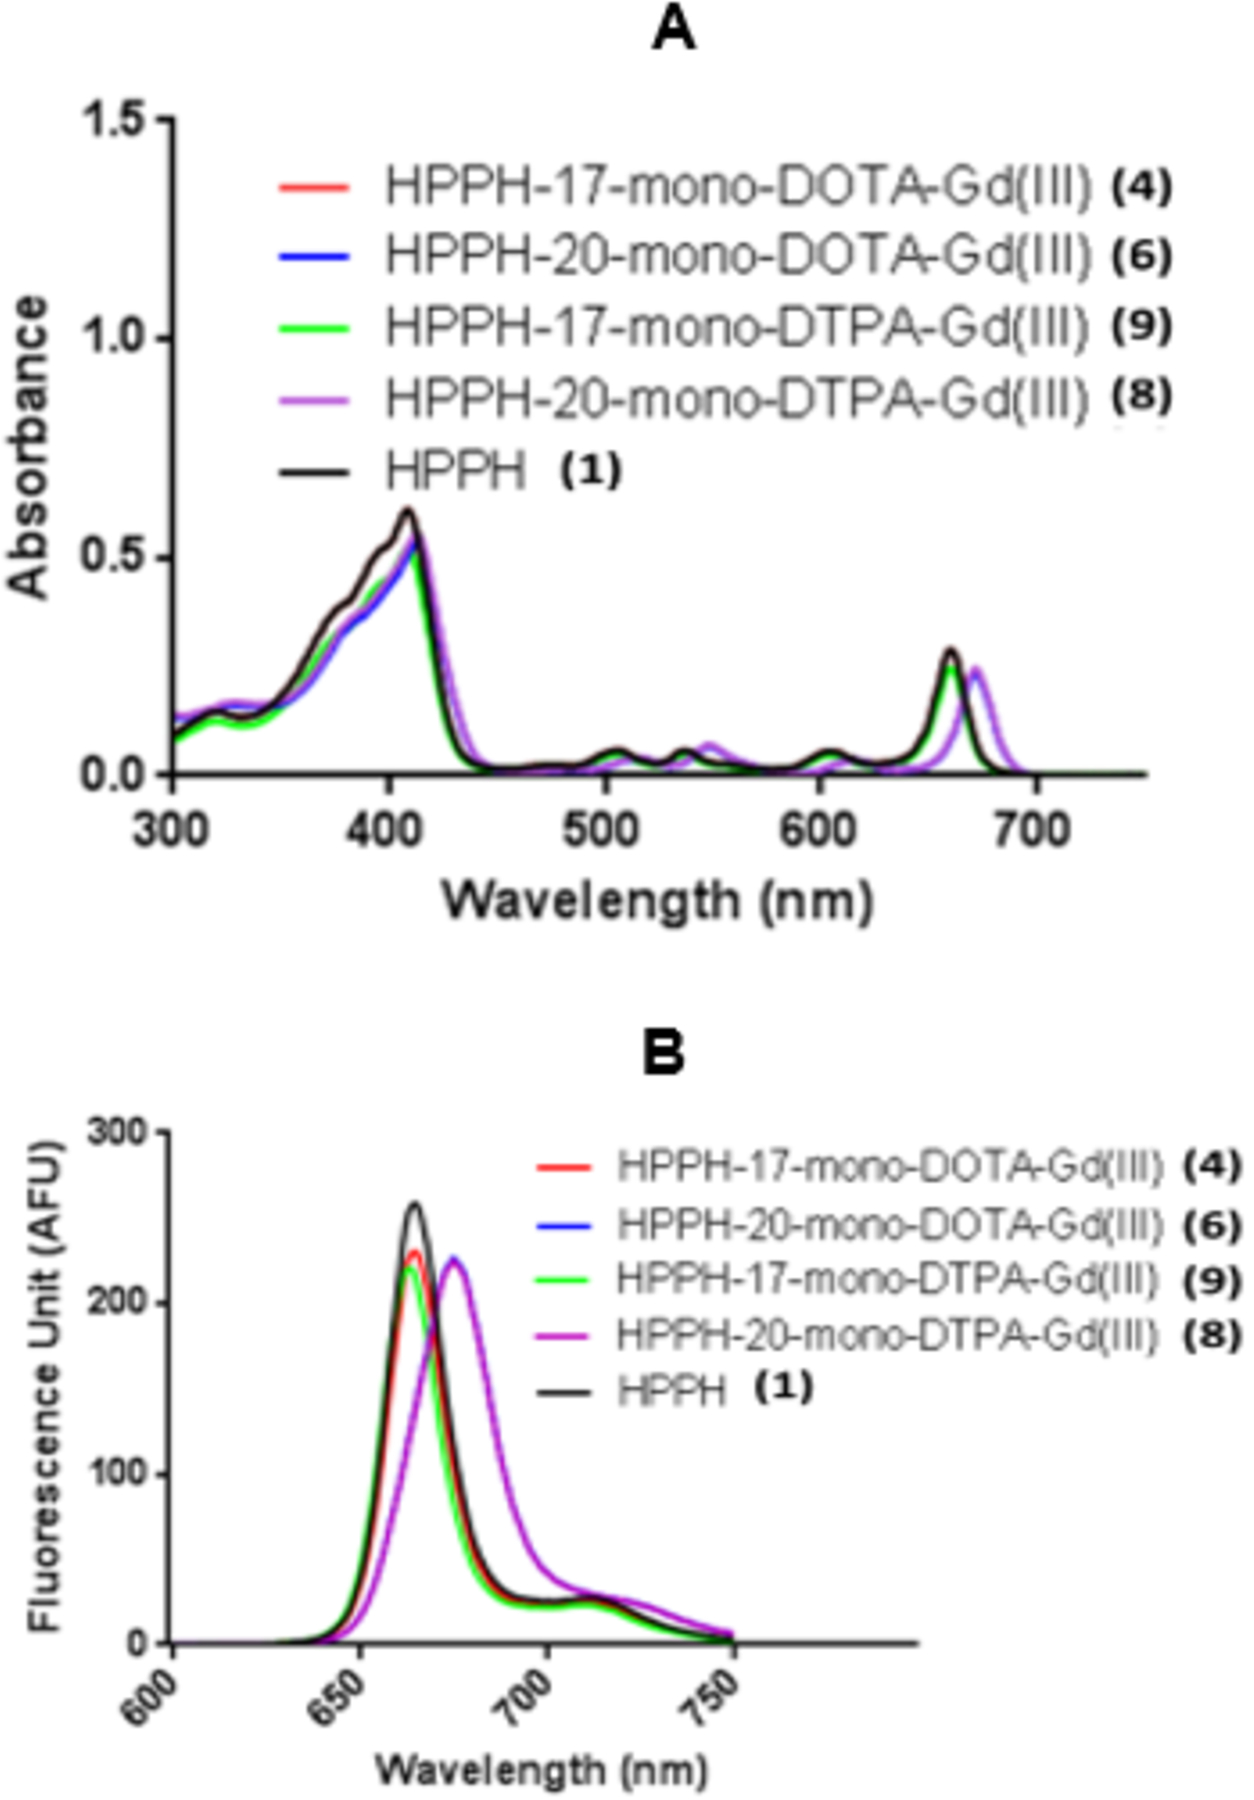
Comparative absorbance (A) and fluorescence (B) spectra of conjugates 4, 6, 8, 9 and HPPH (1) in methanol (conc. 0.5 μM).
The strong absorption in the “Soret” band region for conjugates 4, 6, 8 and 9 exhibited the absorption peak similar to that observed for HPPH (408 nm) except with 6 it shifted to 415 nm. Emission peak at 665 nm (strong)/720 nm (weak) for HPPH and conjugates 4 and 9, whereas conjugates 6 and 8 exhibited the emission peak at 675 nm, and compared to HPPH, the emission wavelength of the conjugates showed approximately 17% decrease in fluorescence peak intensity in methanol.
Stability of Gd chelation with and without light irradiation
As a free ion, gadolinium is known to be toxic in vivo, causing calcium channel inhibition and interference with Ca2+-mediated enzymatic reactions24. Therefore, it must stay in a chelated form in vivo. Due to the toxicity of Gd(III) as a free ion, we examined the stability of the gadolinium chelates using a xylenol orange colorimetric assay25. Conjugations were subjected to acidic conditions (pH = 1) and a laser light of 665 nm, and the potential shift of the spectral profile of xylenol orange was monitored for 2 days (48 hours). None of the four conjugates showed a detectable amount of free Gd(III) release during the duration of the study.
Phototoxicity/viability assay (MTT assay) post PDT and cellular uptake
The effects of the nature of Gd(III)-chelating moiety (DOTA vs. DTPA), the position of chelate (17 vs. 20), and the nature of formulation vehicles on the photosensitizing efficacy of the conjugate 4, 6, 8 were compared with HPPH-17-Gd(III) DTPA 9. The phototoxicity on Colon-26 cells at 4 h incubation at the light dose 0.5 J/cm2 is shown in Figure 2A. As can be seen, the DOTA conjugates 4 and 6 showed increased PDT efficacy (cell kill) over DTPA conjugates 8 and 9. No conjugate caused any detectable cytotoxicity without light treatment, and there was no discernable difference in PDT efficacy between the liposomal (4L) and PBS (4P) formulations of the conjugate 4.The effect of cellular uptake on PDT efficacy was determined by flow cytometry. However, using excitation at 660 nm, the 17-position conjugates showed higher fluorescence than the 20-position conjugates, so a direct comparison of fluorescence emission between 17- and 20-position conjugates was not feasible by this method. As shown in Figure 2B, the differences in in vitro PDT efficacy between conjugates can partially be explained by differential cellular uptake. The cellular uptake of 17-position conjugates (4 and 9) peaked after 4 hours incubation, while 20-position conjugates (6 and 8) were taken up more slowly, peaking at 24 hours. DOTA conjugates 4 and 6 were taken up by Colon-26 cells at higher level than DTPA conjugates 8 and 9. The conjugate 4 formulated either in PBS or liposomes gave similar cellular uptake.
Figure 2.
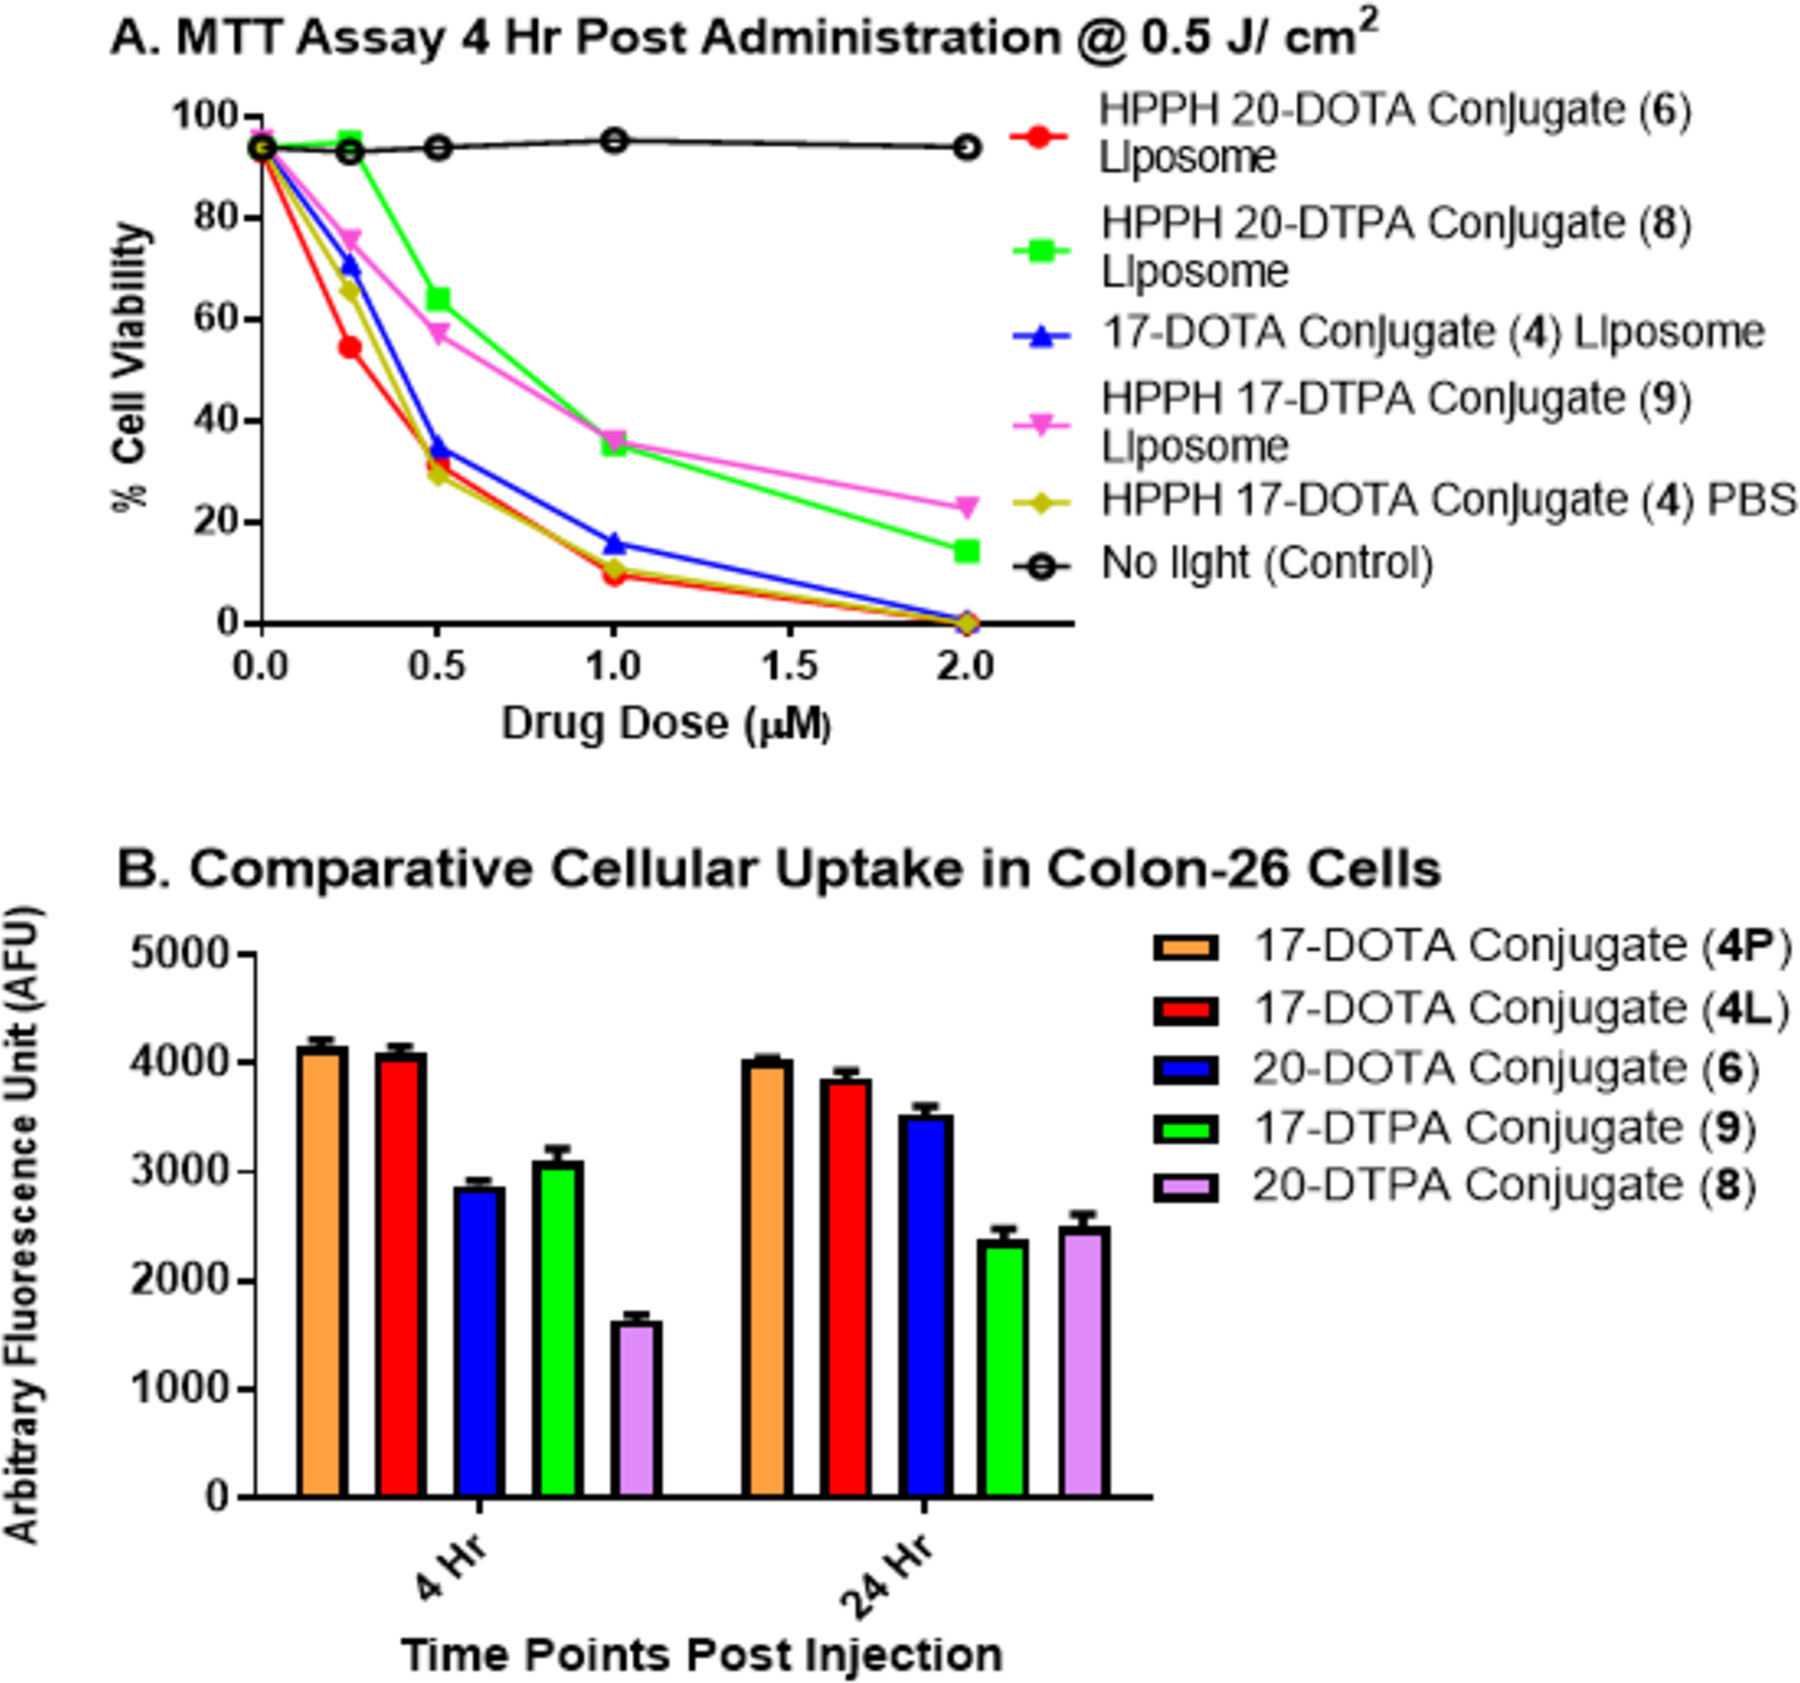
(A) MTT assay of conjugates 4 in PBS (4P) and liposomal (4L) formulations and 6, 8, 9 in liposomal formulation (conc. 0.5 μM) incubated in Colon-26 cells ( 0.5 × 10⁶) for 4 h and 24h followed by a light dose of 0.5 J/cm2 at a fluence rate of 3.2 mW/cm2. (B) Cellular uptake of conjugates 4P, 4L, 6, 8 and 9 studied in Colon-26 cells. 0.5 μM of each conjugate was incubated with cells, which were harvested and examined for cellular uptake 4 hours and 24 hours after incubation.
In vitro T1/T2 relaxivity
The T1 and T2 relaxivity values of the conjugates (r1 and r2, respectively), including HPPH −17-Gd(III) DTPA 9 and Gd (III) DTPA (Scheme 1), are summarized in Table 1. The two DOTA conjugates 4 and 6 exhibited higher T1 relaxivity than the DTPA conjugates 8 and 9, and therefore will provide greater signal enhancement for T1-weighted imaging assuming equal tissue deposition. The 20-position conjugates 6 and 8 showed increased the T1 relaxivity 90% vs. 69%, respectively, over their 17-position counterparts 4 and 9. The T1 relaxivity of HPPH-17-Gd(III) DOTA 4 was slightly reduced when formulated in liposome (T1 = 6.5) vs. PBS (T1 = 7.2). Encapsulation of the paramagnetic Gd(III) compounds within a liposome limits close interactions with water molecules, reducing T1 relaxation efficiency. A similar reduction in T2 relaxivity was not observed, as r2/r1 ratios for encapsulated MR contrast agents are generally higher than their non-liposomal counterparts, likely due to increased local magnetic susceptibility gradients.26,27
Table 1.
Comparative in vitro relaxivity of Gd(III) DTPA Gd (III) DOTA, HPPH-Gd(III) DTPA and HPPH-Gd(III) DOTA conjugates
| Conjugate | Formulation/code | T1 | T2 |
|---|---|---|---|
| 4 | PBS / 4P | 7.2 | 22.4 |
| 4 | Liposome / 4L | 6.5 | 22.4 |
| 6 | Liposome / 6 | 12.4 | 53.3 |
| 8 | Liposome / 8 | 7.8 | 45.9 |
| 9 | Liposome / 9 | 4.6 | 42.8 |
| Gd(III)-DTPA | PBS | 4.3 | 5.1 |
Whole-body in vivo fluorescence imaging
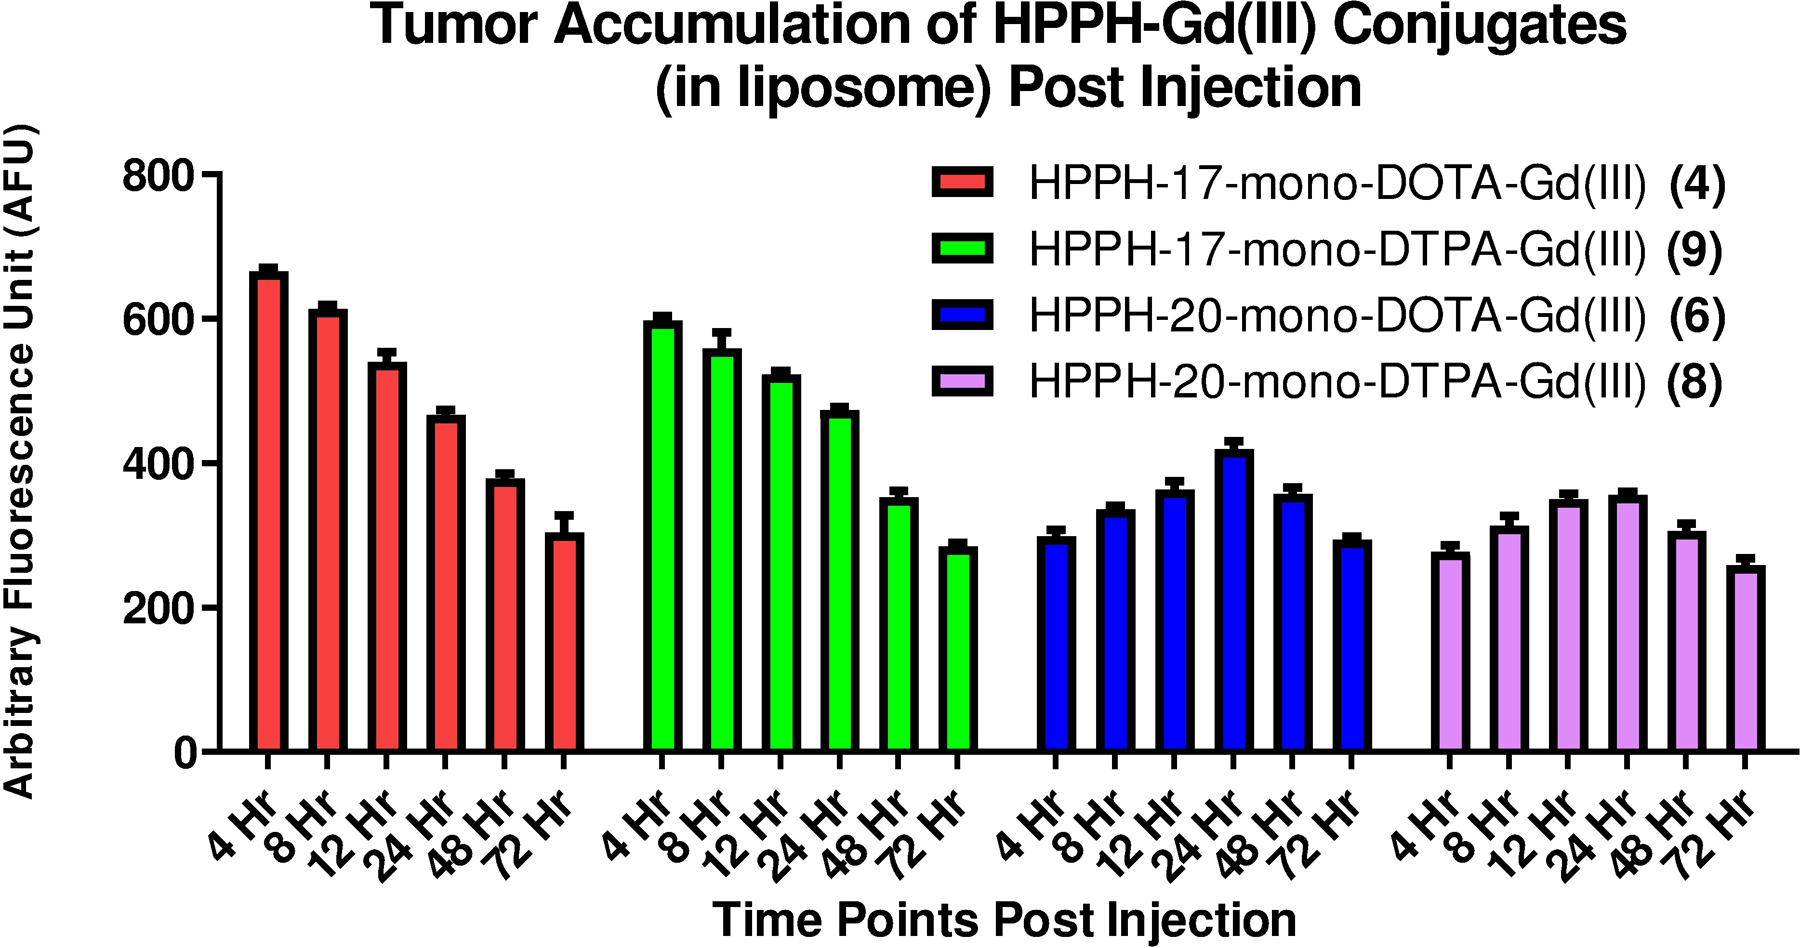
Whole-body fluorescence imaging was performed using the IVIS Spectrum system (PerkinElmer, Waltham, MA) to examine maximal accumulation of the conjugate in tumors after post-injection and determine the best treatment time point(s) to irradiate the tumors for each candidate. For our study, BALB/c mice were implanted with 1×10⁶ Colon-26 tumor cells on the right flank. When the tumors reached 4 −5 mm in diameter the animals (3 mice/conjugate) were injected intravenously with 10 μmol/kg of conjugate (the optimal MRI dose). Prior to imaging, the mouse was shaved and Nair was applied to remove hair. At 4, 12, 24 and 48 hours after drug injection mice were anesthetized with 4% isoflurane. The mouse was exposed to excitation light for 25 ms. The excitation filter was a 640 nm (± 10 nm) band-pass filter and the emission signal was acquired from 650 nm – 750 nm at 10 nm increments with a 645 nm long-pass filter. Regions of interest were then outlined for the tumor and skin and the amount of signal was calculated using the Living Image software. Prior to in vivo assessment, an exploratory study with the conjugates 4 formulated in PBS (4P) and liposome (4L) and 6 was performed to determine their tumor accumulation pattern in mice, to establish the optimal parameters for in vivo PDT treatment and imaging at various time points ranging from 4 to 72 h post injection (Figure 3).
Figure 3.
Comparative tumor uptake of the conjugates formulated in PBS and liposome determined by fluorescence. The conjugates were administered (i.v.) in mice (BALB/c mice bearing Colon 26 tumors, 3 mice/group) at an imaging dose of 10 μmol/kg bearing subcutaneous Colon-26 tumors. Fluorescence was acquired at variable time points ranging from 4 to 48 hours post injection using the Maestro imaging system.
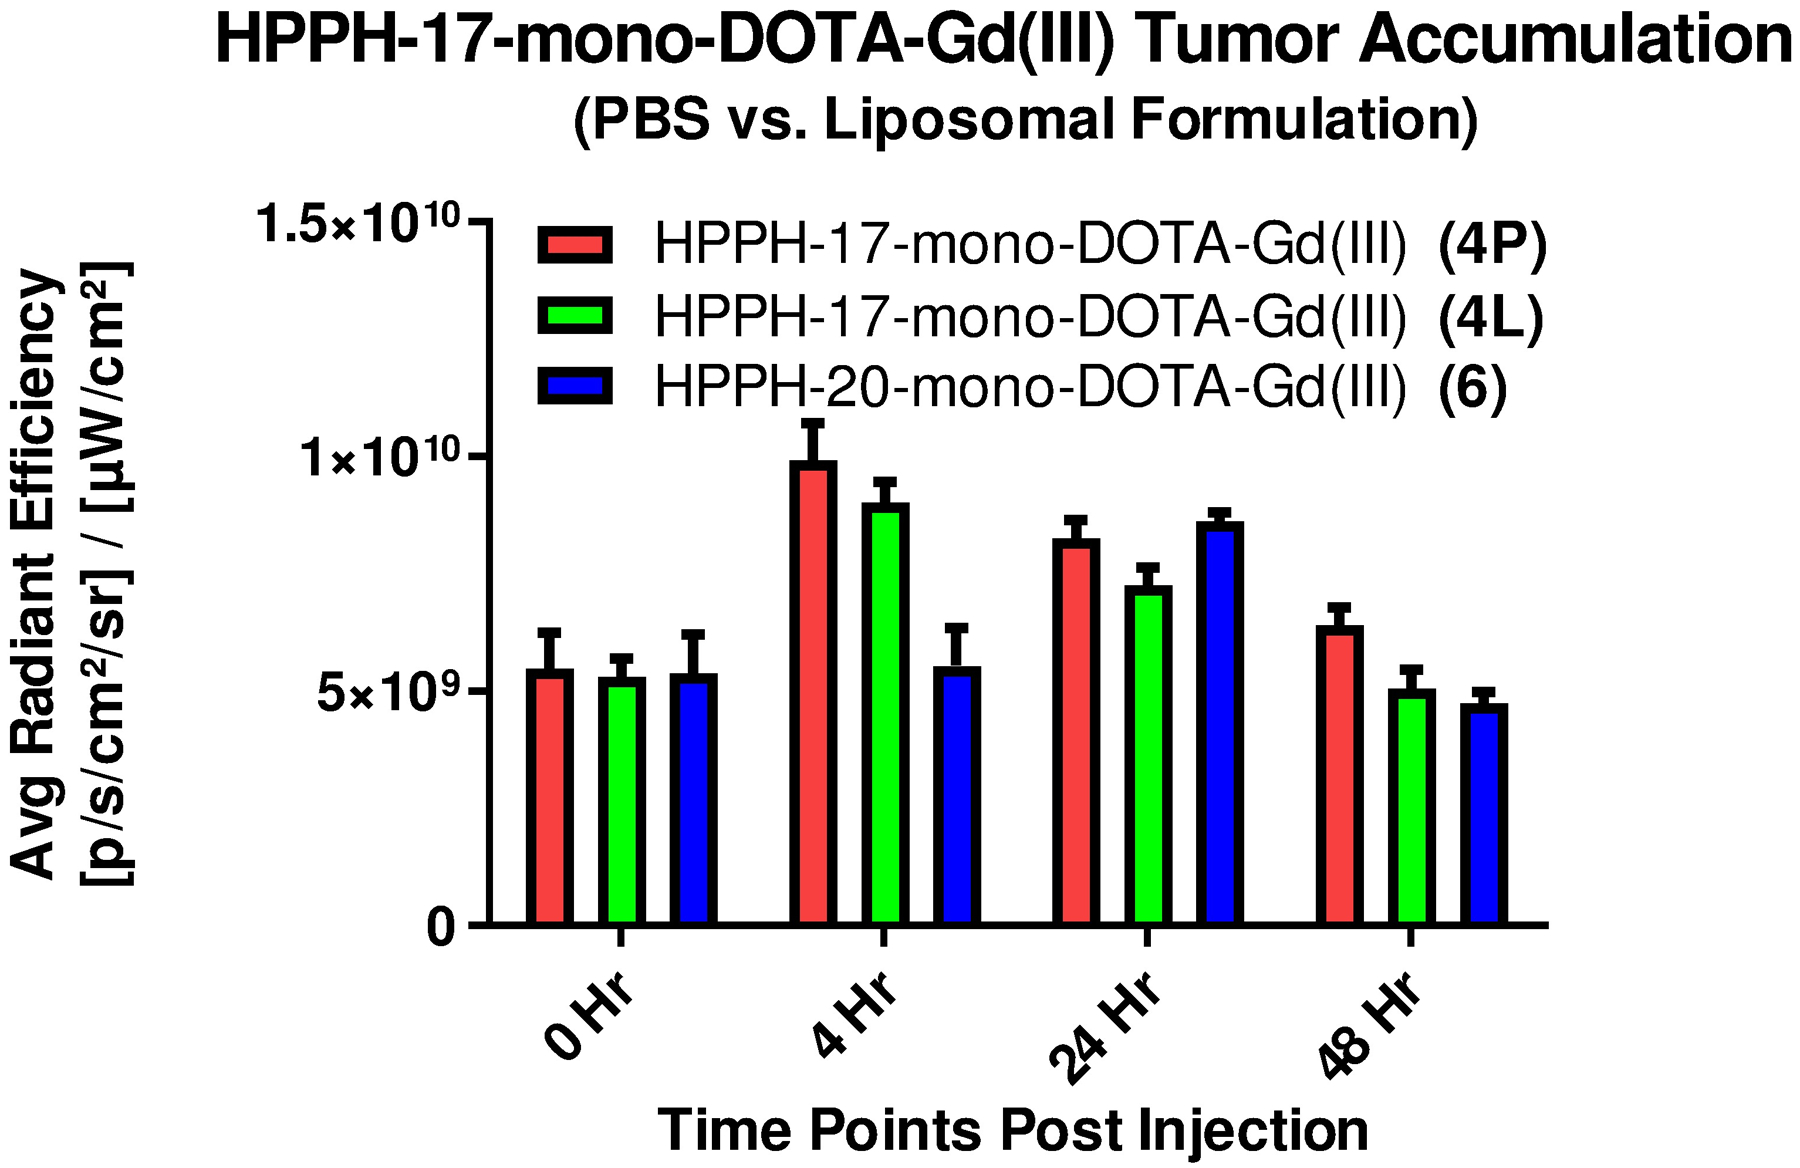
For the position-17 DOTA conjugates, optimal tumor accumulation was observed at 4 h post injection, whereas the position-20 conjugates gave maximal tumor accumulation at 24 h post injection which correlated to the in vitro cellular uptake. The DTPA conjugates did not accumulate in tumor as well as the respective DOTA analogs, regardless the position of conjugation (data not shown). Due to their high MR imaging potential, conjugate 4 in liposomal (4L) and PBS (4P) formulations and conjugate 6 (liposomal) were also examined for their tumor accumulation patterns at 0, 4, 8, 24 and 48 hours post administration using the IVIS Spectrum imaging system (Figure 4).
Figure 4.
The time course study showing comparative tumor accumulation of conjugates 4P, 4L and 6 as measured by in vivo fluorescence. The conjugates were injected (i.v.) at the imaging dose of 10 μmol/kg to BALB/c mice (n=3) bearing subcutaneous Colon-26 tumors.
For each formulation of the 17-DOTA conjugate 4, the fluorescence intensity was highest in the tumor at 4 hours post injection and decreased steadily thereafter. The PBS formulated HPPH-17- Gd(III) DOTA-Gd(III) (see Scheme 1) showed only slightly higher accumulation in comparison to the liposomal formulation. Conjugates formulated in liposomes (4L and 6L) cleared from the tumor faster than the PBS formulated conjugate 4P, returning to the baseline level by 48 hours post injection whereas the PBS formulated conjugate 4P was still ~16% higher than the baseline at 48 h post-injection. Visual inspection of the fluorescence images suggests that conjugate 6 was not as tumor specific as conjugate 4 at peak tumor accumulation time. A considerable level of fluorescence signal was detected at the periphery of the tumor region in the case of conjugate 6 at 24 hours post injection, similar to the level detected in tumor.
In vivo MR relaxometry to determine conjugate 4 accumulation in tumor and normal organs
In our previous study, to determine the impact of variable number of gadolinium units in tumor contrast, HPPH was conjugated with a variable number of Gd(III) DTPA.21 Among these analogs, increasing the number of gadolinium units increased the contrast to some extent, but it was optimal with the conjugate containing three Gd(III) DTPA (lead compound, Figure 5). Therefore, the MR imaging potential of the lead compound was compared with the newly synthesized HPPH-mono-Gd(III) DOTA 4.
Figure 5.
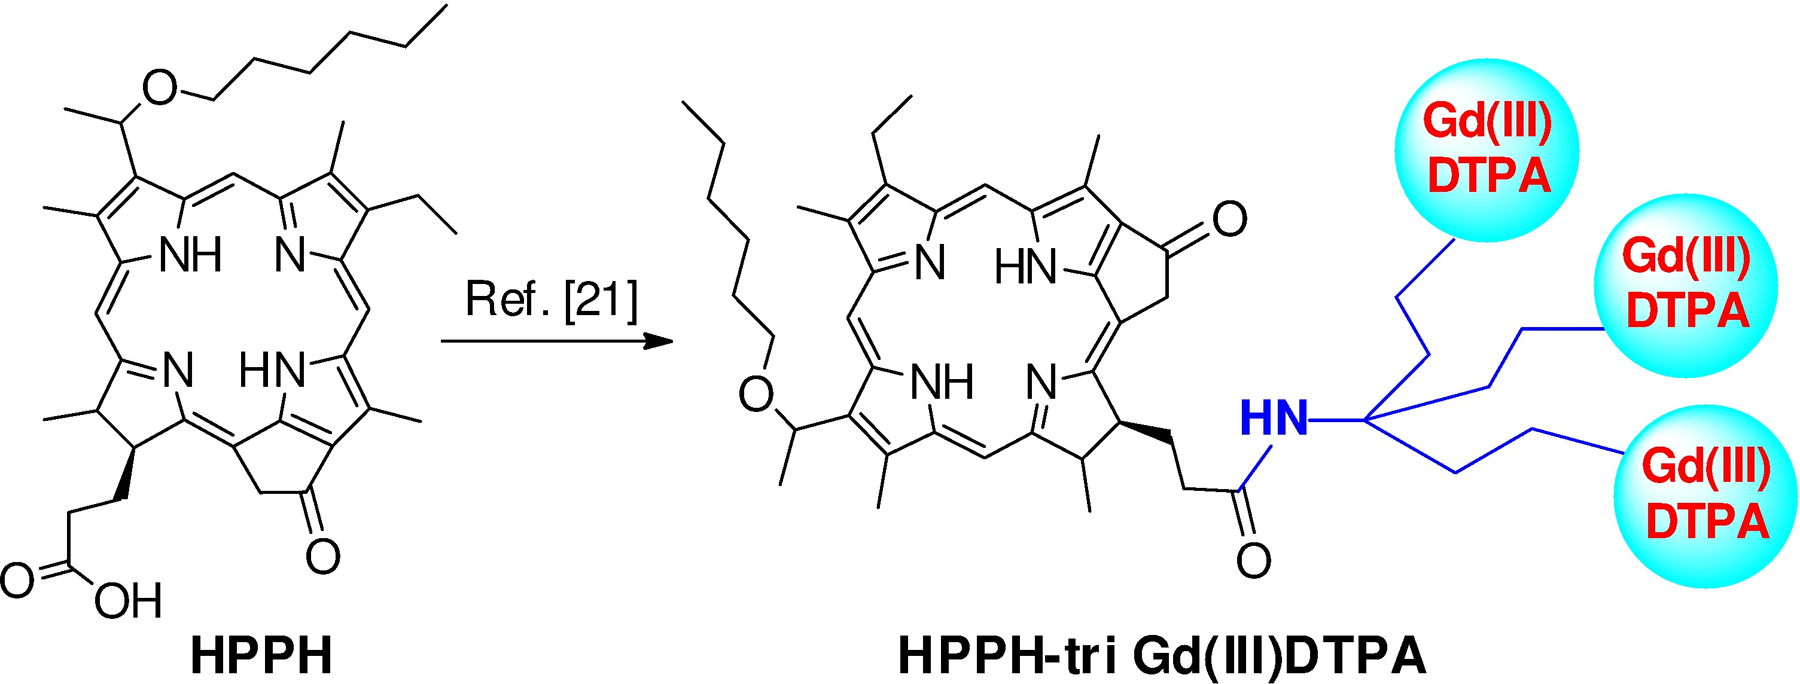
Structure of HPPH conjugated with three molecules of Gd(III)DTPA (ref. [21]).
Despite the lower T1 relaxivity of 17- Gd(III) DOTA conjugate 4, in comparison to HPPH-17-tri-DTPA-Gd(III), (7.2 vs. 13.5 mM−1 • s−1), it produced similar levels of increase in tumor relaxation rates, as illustrated in Figure 6A, indicating higher intratumor deposition for conjugate 4P. This observation indicates that the nature of DOTA as Gd-chelator makes a significant impact in the conjugates ability to server as an MRI contrast agent while retaining its PDT efficacy both in vitro and in vivo.
Figure 6.
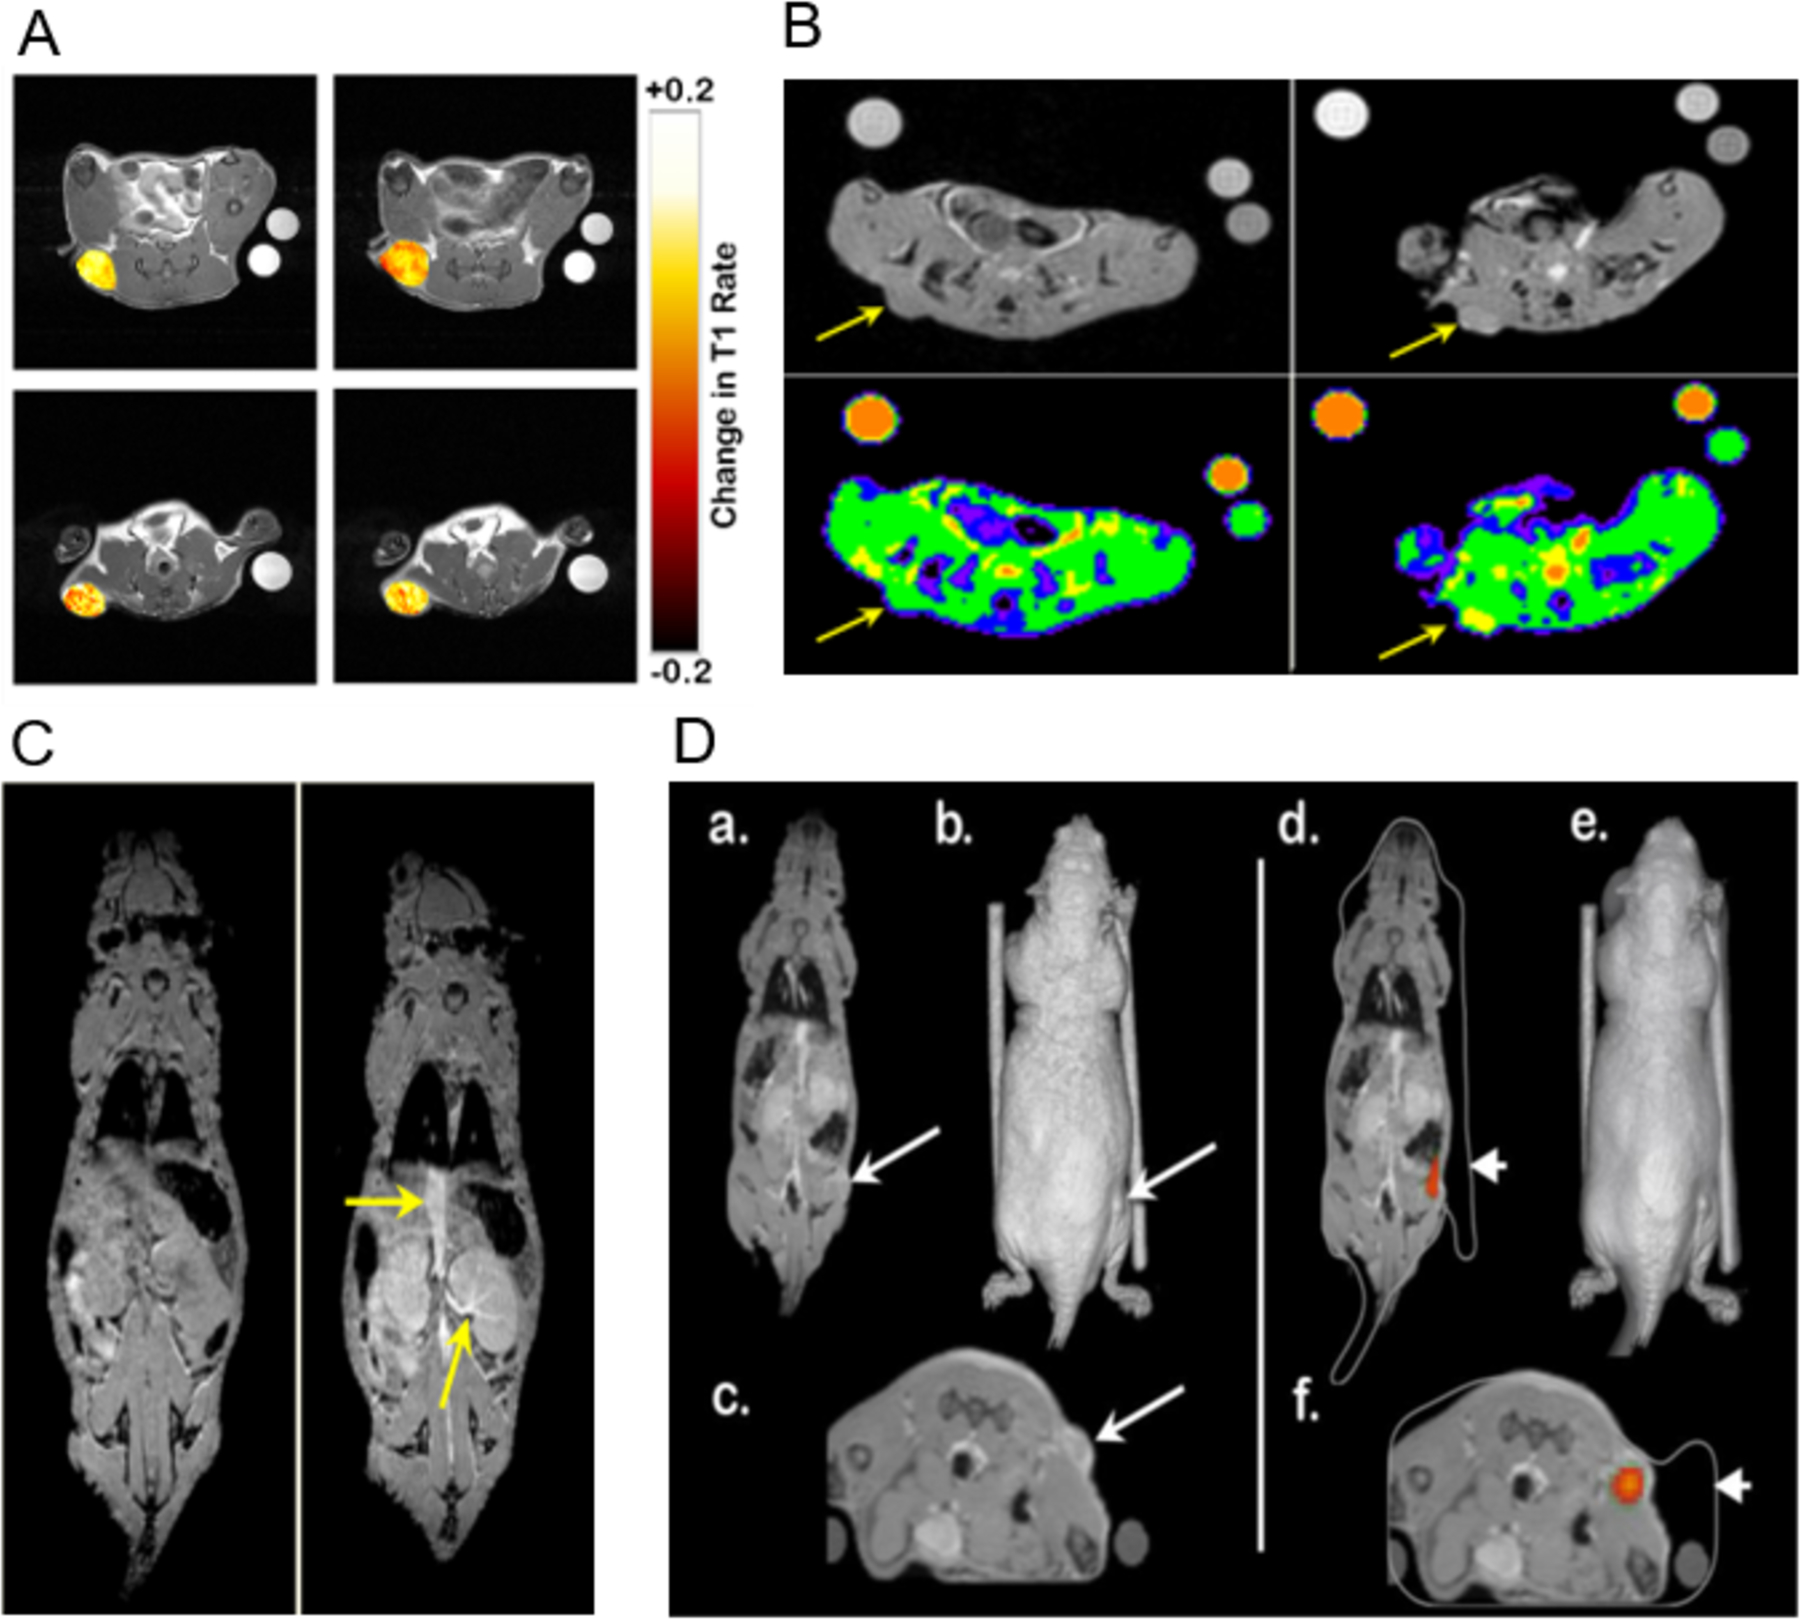
(A). Overlay of T1 weighted scan images with false color representing the change in T1 rate values (s−1) over baseline within subcutaneous tumors for conjugate 4P (top) and HPPH-17-tri-DTPA-Gd(III) (bottom) 4h (left column) and 24h post injection (right column) (B). Increase in MRI signal intensity produced by conjugate 4P at 4h post injection (right panel) in comparison to baseline (left panel) represented by raw image (top panel) and images overlaid with false color (lower panel). (C). Left panel: improved visibility was shown after the use of 17-DOTA conjugate 4P (right), as the yellow arrow points out the vena cava and kidney, shown with higher clarity in comparison to baseline level (left). (D) Right panel: representative slices of co-registered MR data in the coronal view (a) and axial view (c) as well as a volumetric 3D reconstruction (b). A subcutaneous tumor is highlighted with a long arrow. They two cylinders are NMR tubes used as co-registration fiducial markers. 3D optical data generated by an IVIS Spectrum system co-registered with the MR data. Color overlay indicates source of fluorescence signal, with excellent co-localization of signal to the tumor location determined by MR imaging. The white outline (d & f) is the 3D volume generated by the Spectrum’s laser profilometry system (short arrow). An error in the Spectrum’s profilometry reconstruction depth is noted for the right NMR tube (f); otherwise the multimodality co-registration is of high quality. Please note: Conjugate 4 formulated in PBS is coded as 4P.
In vivo MR imaging and co-registration with fluorescence images using IVIS spectrum
Conjugate 4 formulated in PBS (4P), having proven to be capable both as a fluorescence and MR imaging agent, may be able to serve as a tumor-avid fluorescent marker in addition to enhancing the tumor tissue contrast in MRI scanning. As shown in Figure 6C, conjugate 4P was able to provide improved visibility of the vessels and well-vascularized organs such as the kidneys. During 3D fluorescence tomography, the fluorescence signal in tumor produced recapitulated the size and location of the tumor as observed by MRI (Figure 6D). Therefore, 17-DOTA conjugate was found to provide both MRI contrast and tomographic signal, and can be used for in vivo studies that require the input from such co-registration in the future.
Uptake of HPPH-Gd(III) DOTA conjugate 4P (4 formulated in PBS) by vital organs using ex- vivo magnetic resonance and optical imaging
High uptake of conjugate in off-target organs such as kidney, liver, muscle etc. may lead to unwanted damage of healthy tissues during treatment. This is especially was a concern in our study, because conjugate 4P (formulated in PBS) for imaging would be used at a dose 21 times higher than the HPPH therapeutic dose required for PDT treatment (10 μmol/kg vs. 0.47 μmol/kg) in vivo, whereas a dose 7 times higher was needed for 50% cell kill (LD 50 dose) determined in vitro (0.44 μM vs. 0.0625 μM). Before evaluating these conjugates in vivo, the time-point of maximal uptake at similar imaging parameters were determined in mice. In brief, 3 BALB/c mice/group bearing Colon-26 tumor were injected with the conjugate at a concentration of 10 μmol/kg and the tumor uptake at 4, 24, or 48 h post injection was determined by MR/optical imaging. This was done using both MRI (full-body scanning), and optical imaging (organs were taken out after animal was sacrificed), as proof of principle that conjugate 4P can be used in both imaging modalities simultaneously. Following the same scanning protocol, 3 mice/group were injected with selected conjugate (10 μmol/kg) and MRI acquisitions were conducted before and 4, 24 or 48 hours after the injections. An increase in tumor signal intensity produced by 17-DOTA conjugate 4P (Figure 6C) is visible on the T1-weighted SPGR scans. Immediately after the MRI acquisition, mice were subjected to optical imaging. After each time period mice were sacrificed and vital organs and structures were excised (skin, thigh muscle, spleen, intestine, stomach, kidney, liver, heart, and lung) and ex-vivo imaging acquisition was performed using the same excitation/emission filter pair described above. One control mouse (with tumor, no conjugate injection) was also included in this experiment to receive baseline signal intensities. As presented in Figure 7, at 48 hours post injection, the conjugate 4 formulated in PBS (4P) largely cleared from the vital organs while still retained in tumor in significant concentrations.
Figure 7.
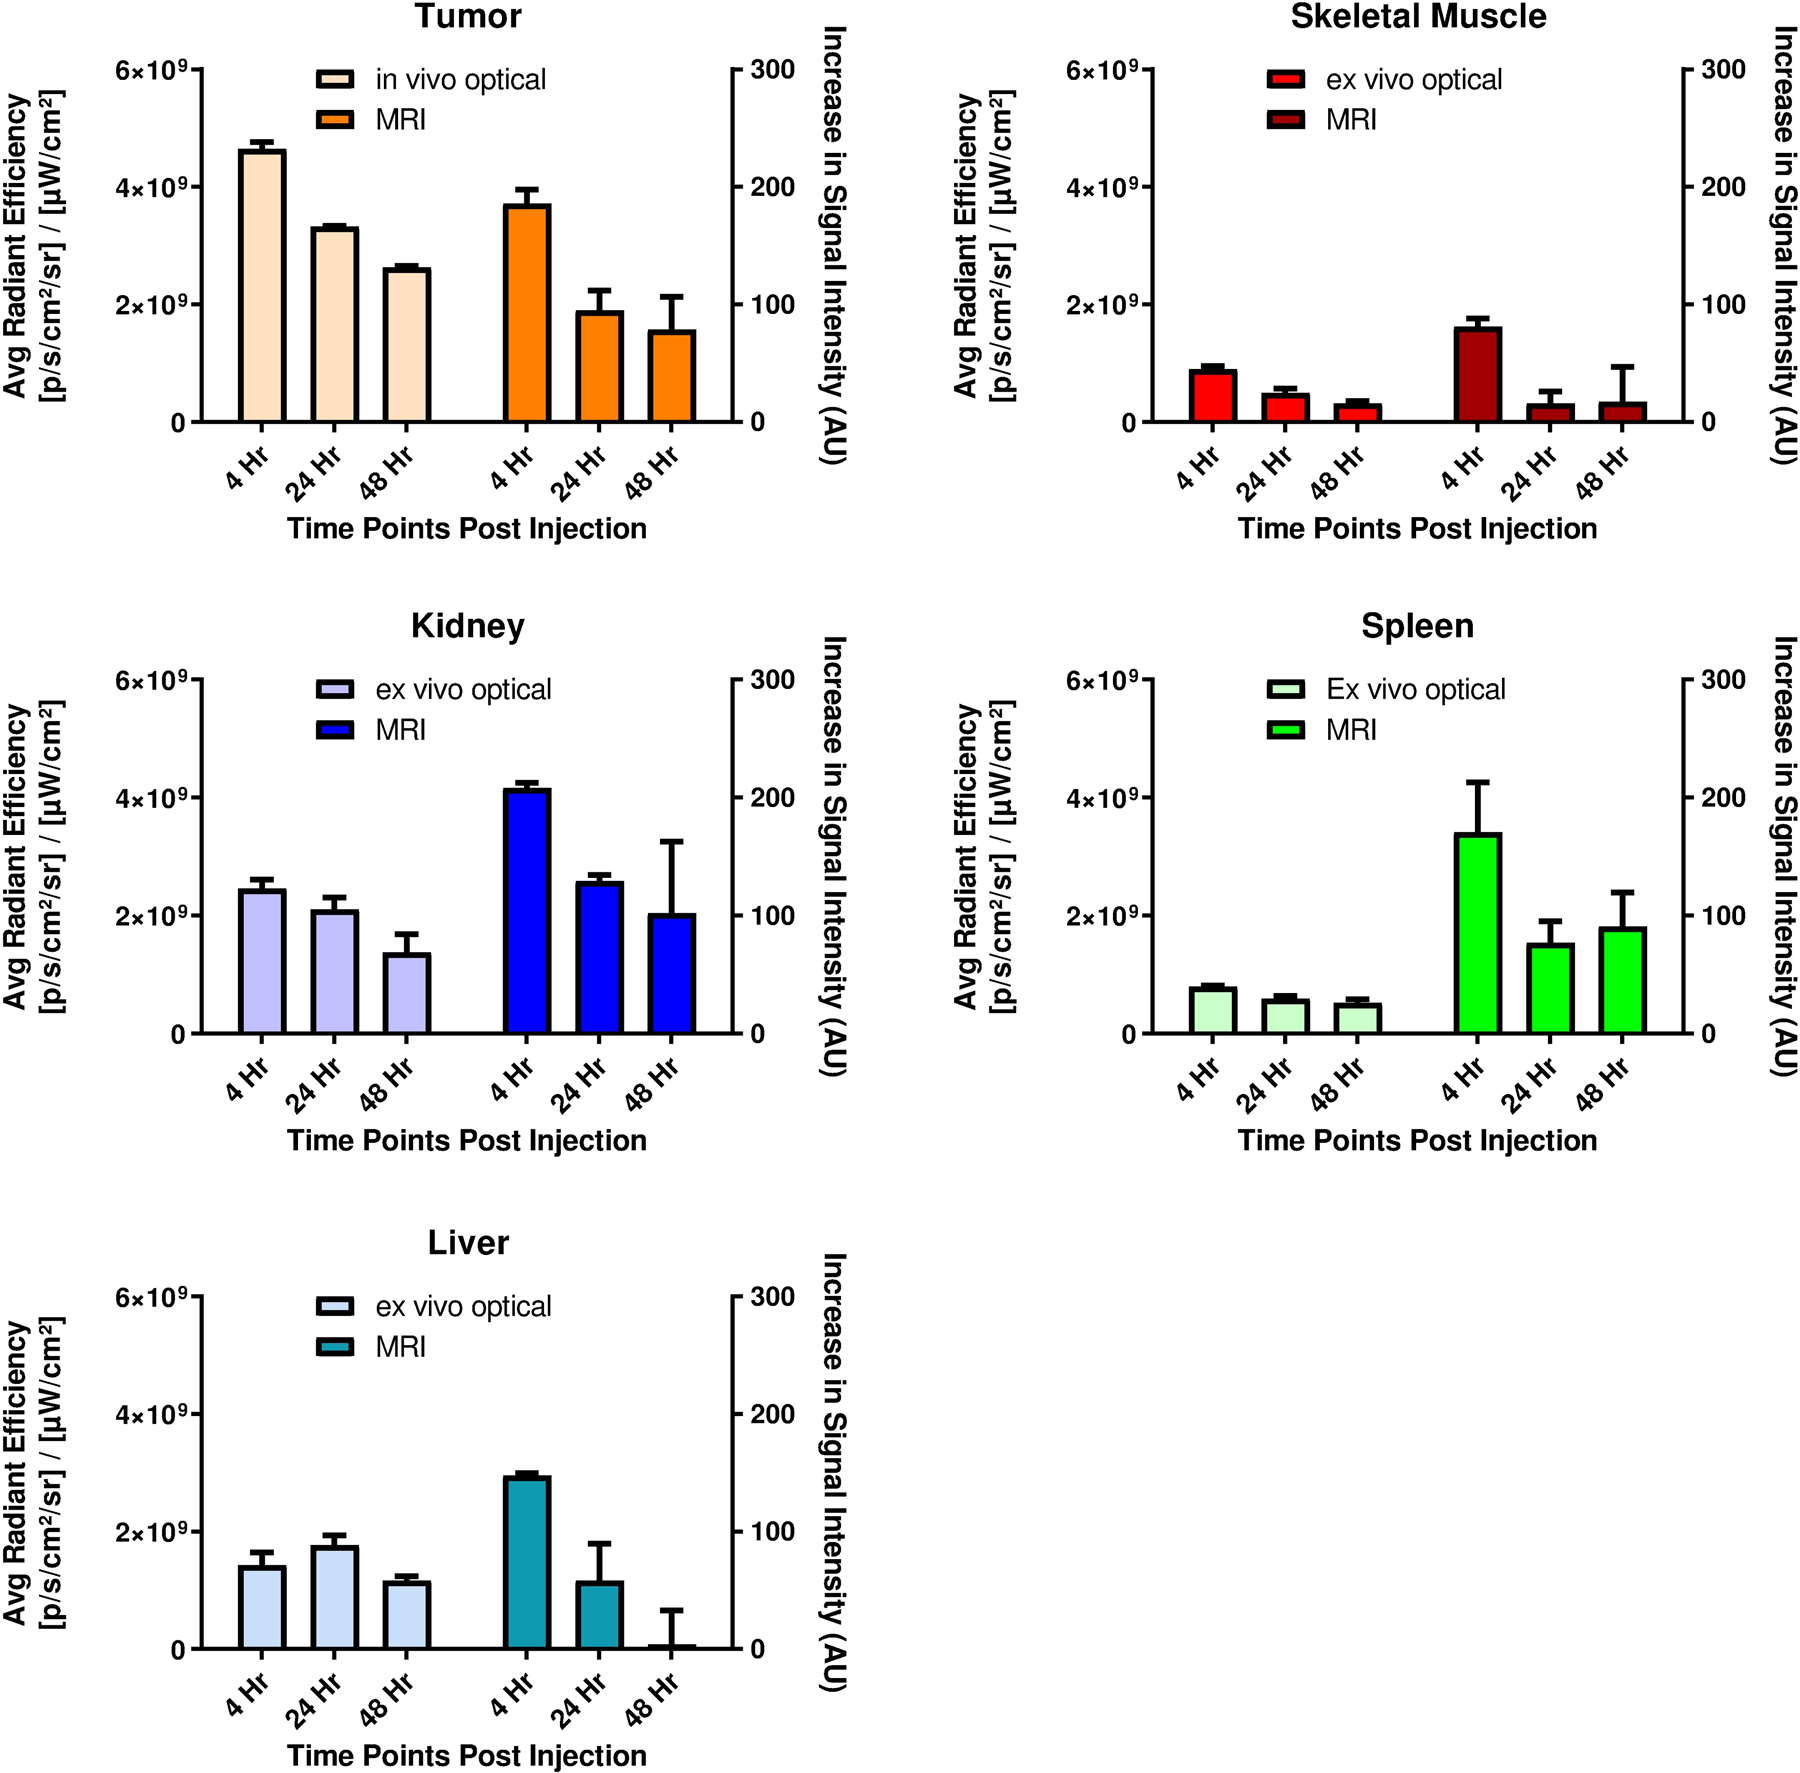
Comparative imaging using optical and MR imaging of vital organs and structures (thigh muscle, liver, kidney, spleen) to subcutaneous Colon-26 tumor implanted in the flank. 3D MRI images were acquired 4, 24, and 48h post injection of conjugate 4P at an imaging dose of 10 μmol/kg. Immediately after MRI scanning, in vivo tumor imaging was conducted before mice (n=3 for each time point) were sacrificed and organs excised for ex vivo imaging.
The data generated from the two imaging modalities correlated with each other reasonably well, as similar levels of signal reduction trends were observed using either optical or MR imaging. It was speculated that this difference in the kidney was due to the high level of circulating blood within kidney in vivo that is removed when the organ is excised.
In Vivo PDT Efficacy of conjugate 4P
Based on the results of the preliminary studies the conjugate 4 in PBS formulation (4P) was identified as the leading conjugate, in vivo PDT efficacy of the conjugate was examined at an imaging dose of 10 μmol/kg (MR imaging dose).
An exploratory experiment was conducted to find the right light dose and treatment time that would not be toxic to mice. Based on this result, light irradiation (wavelength 665 nm) was conducted 48 hours post injection at light dose regimen (40 J/cm2 at 40 mW/cm2). As shown in Figure 8, 10 BALB/c mice bearing subcutaneous Colon-26 tumor were treated and tumor growth was monitored daily for 60 days after the light treatment. None of the mice showed any visible toxicity, and 7/10 mice were tumor free (70% tumor cure) on day 60.
Figure 8.
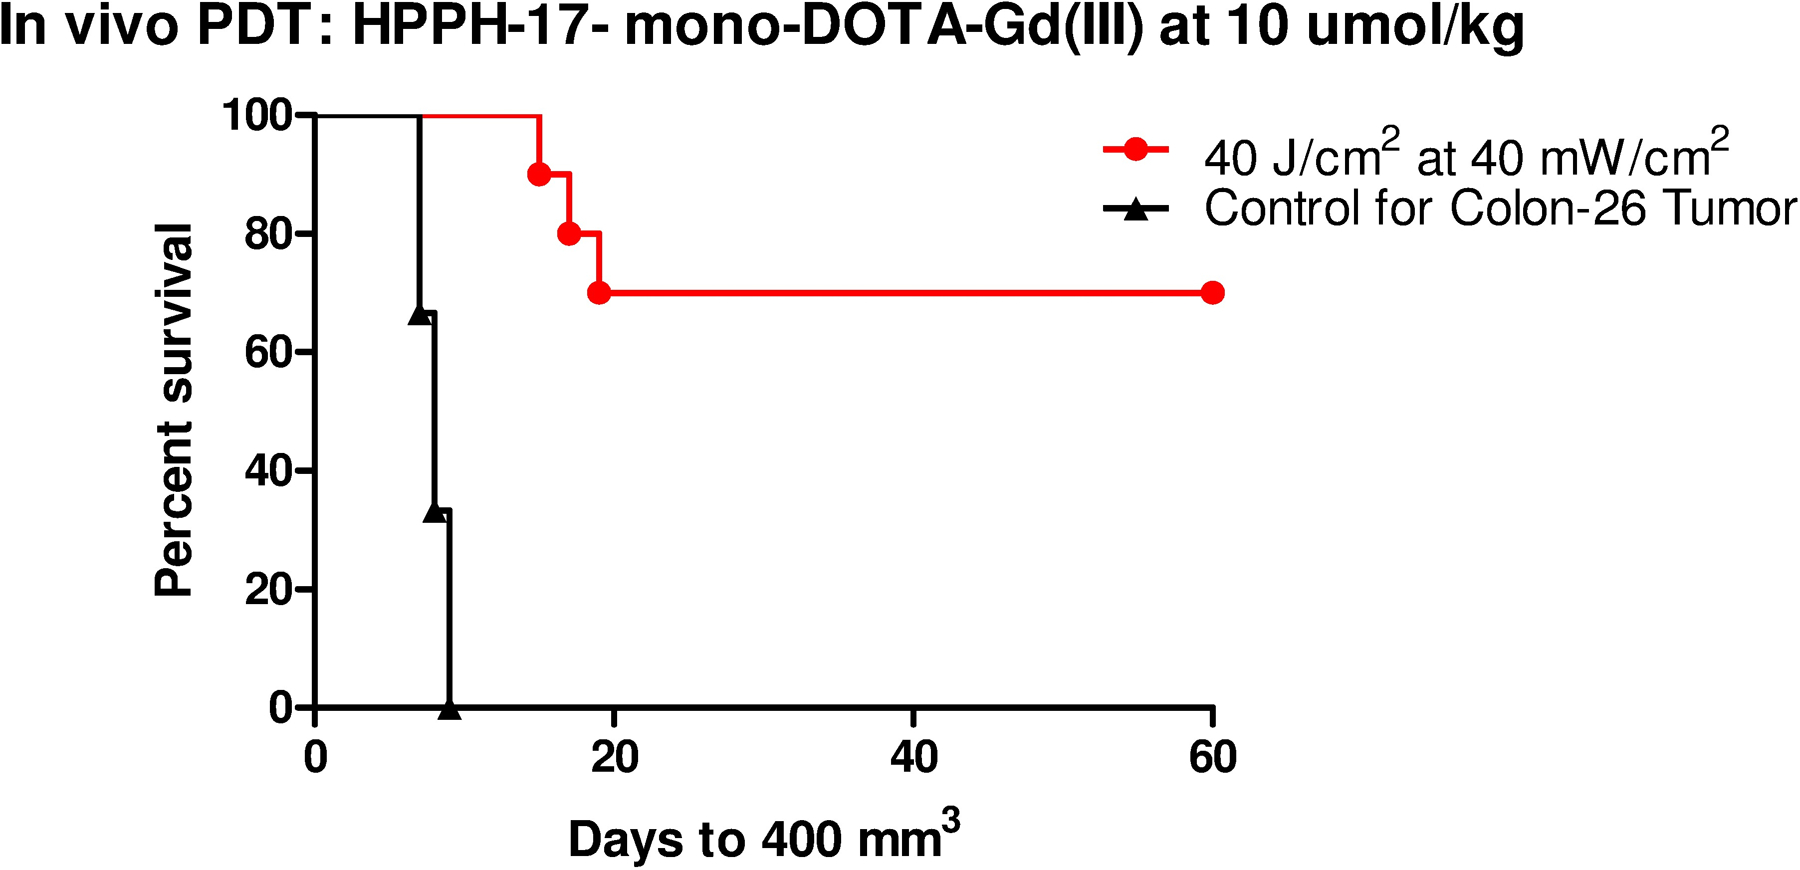
In vivo photosensitizing efficacy of water soluble HPPH-17-mono-DOTA-Gd (III) 4P at a dose of 10 μmole/kg (light dose: 40 J/cm2 at 40 mW/cm2). Mice (10 mice/group), bearing 4–6 mm diameter Colon-26 tumors were implanted in BALB/c mice. The tumors were exposed to light for 16 min 40 sec from a tunable dye laser tuned to the maximum red absorption peak (λmax= 665 nm) at 48 h post-administration. Tumor regrowth was monitored daily. Three mice with tumor regrowth (>400 mm3) were euthanized following the guidelines of approved animal protocol. At day 60, 7/10 mice did not show any tumor-regrowth (70% cure)
Conclusion
In summary, our study examines how the position of conjugation of Gd(III) chelates to a tumor-avid photosensitizer (HPPH), and the vehicle used for the formulation affect the ability of these conjugates to serve as MR and optical imaging agents with an option of PDT. It was found that the position of conjugation and the nature of chelators had a significant impact on the PDT efficacy, tumor avidity, cellular uptake and MRI contrast enhancement. Among the conjugates examined, HPPH-17-Gd(III)DOTA, formulated in PBS (4P) was determined to be the most promising multifunctional agent.
Conjugate 4P accumulated in tumor at a good concentration (as observed from fluorescence and MR imaging) with significant tumor specificity while maintaining the PDT efficacy. It showed contrast enhancement similar to that observed previously using at a same dose of HPPH-17-tri- Gd(III) DTPA-Gd(III)19. These results are interesting because HPPH-17-tri-Gd(III) DTPA contains three gadolinium ions per molecule, whereas in conjugate 4 has only one, suggesting that the nature of the chelating agent (DTPA vs. DOTA) makes a significant difference in MR relaxivity, tumor uptake and elimination rates. Based on the results of HPPH-Gd(III) DTPA conjugates, it is quite possible that increasing the number of Gd(III)DOTA moieties in the conjugate may further enhance tumor contrast, and these studies are currently in progress. At this point it is not clear if the difference of tumor uptake between various conjugates due to overall lipophilicity of the molecules or to their difference in interaction with human serum albumin or other proteins and is under investigation. In any event, our present study suggests that tumor-avid molecules such as HPPH on conjugating with Gd(III) DOTA shows potential to develop a water-soluble multifunctional agent for cancer imaging (MR and fluorescence) and image-guided PDT.
Experimental Section
All chemicals were of reagent grade and used as such. Solvents were dried using standard methods unless stated otherwise. Reactions were carried out under argon atmosphere and were monitored by precoated (0.20 mm) silica TLC plastic sheet (20 × 20 cm) strips (POLYGRAM SIL N-HR) and/or UV-visible spectroscopy. UV-visible spectra were recorded on a Varian (Cary-50 Bio) spectrophotometer. 1H NMR were 13C NMR spectra were recorded on a Brucker AMX-400 NMR spectrometer. Proton chemical shifts are reported in parts per million (ppm) relative to CDCl3 (7.26 ppm). Coupling constants (J) are reported in hertz (Hz). Mass spectral analyses were obtained at the Mass Spectrometry Facility, University of Buffalo (SUNY, Buffalo).
HPPH-17-mono-DOTA-tert-butyl ester (3):
A mixture of HPPH 1 (40.0 mg, 0.063 mmol), 2-Aminoethyl-DOTA-tris(t-Bu ester) (65.52 mg, 0.08 mmol), 4-(4,6-di methoxy-1,3,5,-triazin-2yl)-4-methyl morpholinium chloride (DMTMM) (20.85 mg, 0.075 mmol) in dry THF (8 mL) was stirred at room temperature under argon for 24 h. Water (1 mL) was added, and the reaction mixture was allowed to stir for 15 min. After this 20 mL of CH2Cl2 was added to the reaction mixture, and the resulting solution was washed with H2O (4 × 20 mL). The organic layer was separated, dried with sodium sulfate, filtered and concentrated. The residue was purified by Alumina grade III column chromatography using 3% MeOH in CH2Cl2 as the eluent to give product 3 with 81% yield (62.78 mg). UV-vis (MeOH, λmax, nm ): 660 (rel. intensity 0.645), 604 (0.116), 536.9 (0.127), 504 (0.123), 408 (1.260), 319 (0.306). 1H NMR (400 MHz, CDCl3, δ ppm): 9.74/9.73 (1H, s, 5-H), 9.48 (1H, s, 10-H), 9.03 (1H, br m, –NHCH2CH2NH-), 8.79 (1H, br t, J ~ 5 Hz –NHCH2CH2NH-), 8.62/8.61 (1H, s, 20-H), 5.90/5.89 (1H, q, J = 6.8 Hz, 31-H), 5.37 (1H, d, J = 20.2 Hz, 132-CHH), 5.11 (1H, d, J =20.2 Hz, 132-CHH), 4.73 (1H, q, J = 7.3 Hz, 18-H), 4.27 (1H, d, J = 10.4 Hz, 17-H), 3.70 (2H, q, J = 7.7 Hz, 8-CH2CH3), 3.54–3.69 (2H, m, -OCH2(CH2)4CH3), 3.66 (3H, s, 12-CH3), 1.0–3.6 (24H, br m, DOTA ring and exocyclic CH2 groups)*, 3.41 (2H, br s, -NHCH2CH2NH-), 3.378/3.376 (3H, s, 2-CH3), 3.35 (2H, br m, -NHCH2CH2NH-), 3.25 (3H, s, 7-CH3), 2.84 (1H, m, 1H of 17-CH2CH2-), 2.80 (1H, m, 1H of 17-CH2CH2-), 2.60 (1H, m, 1H of 17-CH2CH2-), 2.11/2.10 (3H, d, J = 6.7 Hz, 31-CH3), 2.07 (1H, m, 1H of 17-CH2CH2-), 1.81 (3H, d, J = 7.3 Hz, 18-CH3), ~1.73 (2H, m, -OCH2CH2(CH2)3CH3), 1.70 (3H, t, J = 7.6 Hz, 8-CH2CH3), 1.40, 1.39, 1.38 (18H, 3 × s, 2 × -COOC(CH3)3), 1.34 (9H, br s, -COOC(CH3)3), 1.29–1.46 (2H, m, -O(CH2)2CH2(CH2)2CH3), 1.16–1.27 (4H, m, -O(CH2)3(CH2)2CH3), 0.77 (3H, distorted t, J ~ 7 Hz, -O(CH2)5CH3), 0.41/0.40 (1H, s, core NH), −1.74/−1.75 (1H, s, core NH); 13C NMR (100 MHz, CDCl3, δ ppm): 196.53/196.52, 173.43/173.42, 172.76/172.75, 172.1, 171.9 (2C)*, 171.4, 162.18/162.15, 154.9, 150.5, 149.1, 144.6, 141.3/141.2, 139.31/139.26, 137.5, 136.0, 135.6/135.5, 132.7/132.6, 130.5, 127.78/127.77, 106.29/106.27, 103.6, 97.4, 93.6/93.5, 82.0, 81.94, 81.91, 72.82/72.79, 69.6, 56.0, 55.54, 55.48, 55.4, 47–53 (8C)*, 52.3, 49.8, 48.2, 39.3, 39.13/39.09, 33.61/33.59, 31.7, 31.2, 30.2, 28.0 (3C), 27.92 (3C), 27.87 (3C), 26.0, 24.8/24.7, 23.5, 22.6/22.5, 19.5, 17.5, 14.0, 12.0, 11.3, 11.1. Notes: *DOTA signals severely broadened by ring fluxion. The total 1H integral in the ~1.0–3.6 ppm region is ~8H higher than expected. This may be due to overlapping signals from grease impurity and water. Photosensitizer, linker, and t-butyl group signal integrals in the ~1.0–3.6 ppm region are augmented by contributions from broad, overlapping DOTA resonances. Nominal integrals for the augmented peaks (listed above) do not include this contribution. See the 1H spectrum (supporting material) for actual integral values. MS (ESI) calculated for C69H105N10O10 [MH+] 1233.80, found 1233.80.
HPPH-17-Gd(III)-DOTA-Gd(III) (4):
Compound 3 (50 mg, 0.04 mmol) was stirred in 70% trifluoroacetic acid (TFA) in dichloromethane [7 mL TFA and 3 mL CH2Cl2] under argon for 3.0 hours. The TFA was then removed under vacuum. The residue was re-dissolved in CH2Cl2 (15 mL), washed with water (3 × 50 mL) and dried over sodium sulfate. It was filtered and the solvent from the filtrate was removed under vacuum, and the pure intermediate carboxylic acid was obtained in quantitative yield. UV-vis (methanol, λmax, nm): 660 (rel. intensity 0.810), 604 (0.156), 536.9 (0.164), 505.1 (0.159), 408 (1.686), 319 (0.424). HRMS (ESI): calculated for C57H80N10O10 [M+] 1064.6011; found 1064.6028.
The intermediate carboxylic acid (35.0 mg, 0.033 mmol) was dissolved in pyridine (5 mL), and while stirring, GdCl3 6H2O (24.5 mg, 0.066 mmol) in 0.5 mL of DI water added slowly, and the resultant mixture was stirred at room temperature for 48 h. The reaction mixture was concentrated to dryness under high vacuum. The residue was washed with CH2Cl2 (2×5 mL) and acetone (2×5 mL). The crude reaction mixture was purified by Bio-Gel P-6 (medium) column using DI water two times and 1K 50 mL centrifugal devices 4 times as eluent to give product 4 with 86% yield (34.48 mg). UV-vis (MeOH, λmax, nm (ε)): 659 (3.96 × 10⁴), 604 (2.07 × 10⁵), 536 (1.93 × 10⁵), 505 (1.96 × 10⁵), 407 (1.87× 10⁴), 316.9 (7.53 × 10⁴). MS (ESI) : 1218.50 [M - H+]. HRMS (ESI): calculated for C57H76N10O10Gd [M - H+] 1218.4987, found 1218.5033.
HPPH-20-mono-DOTA-tert-butyl ester (5):
Compound 2 (15 mg, 0.019 mmol), 2-Aminoethyl-DOTA-tris(t-Bu ester) (20 mg, 0.029 mmol) and benzotriazol-1-yloxytris(dimethylamino)-phosphonium hexafluorophosphate (PyBOP, 15 mg, 0.029 mmol) were dissolved in dry DMF (8 mL) under argon atmosphere. To this solution, triethylamine (TEA, 0.15 mL) was added, and the reaction mixture was stirred overnight at room temperature. After this, 20 mL of CH2Cl2 was added to the reaction mixture, and the resulting solution was washed with H2O (4×20 mL). The organic layer was separated, dried with sodium sulfate, filtered and concentrated under reduced pressure. The resulting residue was purified by alumina grade 3 column chromatography, using gradient 1.0 – 2.5 % MeOH in CH2Cl2 as the eluent to give compound 5 with 54% yield (14 mg). UV-Vis λmax (CH2Cl2): 671 (rel. intensity 0.370), 614 (0.056), 548 (0.110), 515 (0.068), 415 (0.844). 1H NMR (400 MHz, CDCl3, δ ppm): 10.13/10.10 (1H, s, 5-H), 9.503/9.498 (1H, s, 10-H), 9.44 (1H, br s, -NHCH2CH2 NHC(=O)phenyl-), 9.39 (1H, br m, -NH CH2CH2NHC(=O)phenyl-), 8.75/8.73 (1H, dd, J = 8.0, 1.9 Hz, 203a-H), 8.64/8.60 (1H, dd, J = 8.0, 2.0 Hz, 203b-H), 8.20/8.19 (1H, dd, J = 7.9, 1.9 Hz, 202a-H), 7.67/7.65 (1H, dd, J = 7.9, 1.9 Hz, 202b-H), 5.783/5.779 (1H, q, J = 6.7 Hz, 31-H), 5.22/5.21, 5.18 (2H, ABq, JAB = 19.9 Hz, 132-CH2), 4.32/4.28 (1H, q, J = 7.0 Hz, 18-H), 4.09 (1H, m, 17-H), 3.85 (2H, br s, -NHCH2CH2NHC(=O)phenyl-), 3.72 (2H, q, J = 7.6 Hz, 8-CH2CH3), 1.4–3.7 (24H, br m, DOTA ring and exocyclic CH2 groups)*, 3.69/3.68 (3H, s, 12-CH3), 3.67# (~1H, t, J = 6.7 Hz, -OCH2(CH2)4CH3), 3.55 (2H, br s, -NHCH2CH2NHC(=O)phenyl-), 3.56/3.55 (3H, s, -COOCH3), 3.51# (~0.5H, dt, J = 9.1, 6.5 Hz, -OCHH(CH2)4CH3), 3.42# (~0.5H, dt, J = 9.1, 6.8 Hz, -OCHH(CH2)4CH3), 3.280/3.278 (3H, s, 7-CH3), ~2.53 (1H, m, 17-CH2CHH-), ~2.45 (1H, m, 17-CHHCH2-), 2.33/2.32 (3H, s, 2-CH3), ~2.24 (1H, m, 17-CHHCH2-), ~2.15 (1H, m, 17-CH2CHH-), 2.14/1.98 (3H, d, J = 6.7 Hz, 31-CH3), ~1.75/1.63 (2H, m, -OCH2CH2(CH2)3CH3), 1.72 (3H, t, J = 7.6 Hz, 8-CH2CH3), 1.48 (27H, s, 3 × -COOC(CH3)3), ~1.20–1.45 (2H, m, -O(CH2)2CH2(CH2)2CH3), ~1.30 (1H, br s, core NH), ~1.22/~1.13 (4H, m, -O(CH2)3(CH2)2CH3), 1.03/1.01 (3H, d, J = 7.0 Hz, 18-CH3), 0.78/0.70 (3H, distorted t, J ~ 7 Hz, -O(CH2)5CH3), −1.50/−1.57 (1H, s, core NH); 13C NMR (100 MHz, CDCl3, δ ppm): 196.4, 173.44/173.42, 172.1 (2C)*, 172.3, 171.81/171.76, 171.6, 167.13/167.11, 160.1/ 160.0, 153.9, 151.54/151.52, 148.31/148.30, 144.4, 143.7, 141.7/141.3, 139.6/139.5, 138.91/ 138.90, 136.7, 134.5/134.2, 134.1/ 133.4, 133.74, 133.71/133.55, 131.9/131.7, 131.0, 128.41/128.39, 128.20/128.19, 127.73/ 127.71, 111.73/111.72, 106.11/106.09, 103.5/ 103.4, 98.9, 82.14 (2C), 82.05, 72.9/72.8, 69.8/69.5, 56.0, 55.7, 55.6 (2C), ~47–54 (8C)*, 52.13/52.12, 51.6, 48.7, 48.4/48.3, 40.1, 39.4, 31.8/31.7, 31.1/31.0, 30.3/30.1, 29.9/29.8, 28.1 (6C), 28.0 (3C), 26.1/25.9, 25.1/24.7, 22.6/22.5, 21.13/21.07, 19.5, 17.4, 14.02/13.74, 13.97/13.90, 12.1, 11.3. Notes: #The -OCH2- group signals arising from two diastereomeric forms were observed at 3.67 ppm (equivalent pair of first form) and 3.51, 3.42 ppm (non-equivalent pair of second form). *DOTA signals severely broadened by ring fluxion. The total 1H integral in the ~1.4–3.7 ppm region is ~10H higher than expected. This is mostly due to an overlapping water signal. Photosensitizer, linker, and t-butyl group signal integrals in the ~1.4–3.7 ppm region are augmented by contributions from broad, overlapping DOTA resonances. Nominal integrals for the augmented peaks (listed above) do not include this contribution. See the 1H spectrum (supporting material) for actual integral values. 1H impurity signals were observed at 1.25 (likely grease CH2), and 0.88 ppm (likely grease CH3). A 13C impurity signal was observed at 29.7 ppm (likely grease CH2). HRMS (ESI) calculated for C77H110N10O12Na [MNa+] 1389.8202, found 1389.8169.
HPPH-20-Gd(III)DOTA (6):
Compound 5 (14 mg) was stirred in 3 mL of 75% solution of trifluoroacetic acid in CH2Cl2 for 3 hours under argon atmosphere at room temperature. The reaction mixture was then diluted with 20 mL of CH2Cl2, and gently (to avoid creation of stable emulsion) washed with H2O (5 × 10 mL, until wash water pH >6.5). The organic layer was separated, dried over Na2SO4, and filtered. After removing the solvent, intermediate carboxylic acid was obtained in quantitative yield. UV-Vis λmax (MeOH) : 671 (rel. intensity 0.444), 614 (0.073), 547 (0.132), 513 (0.082), 412 (0.938);HRMS (ESI) calculated for C65H86N10O12Na [MNa+] 1221.6324, found 1221.6318. The intermediate (14 mg, 0.0121 mmol) in pyridine (15 mL) was added to solution of GdCl3•6H2O (4.5 mg, 0.0121 mmol) in deionized water (2 mL). The solution was stirred at room temperature for 3 h. Solvent was removed, and the residue was washed with CH2Cl2 (10 mL) and dried in rotatory evaporator for 3 times. The dark blue solid was collected and dried with high vacuum in a desiccator to provide 6 (14.7 mg) in 90% yield. HRMS: calculated for C65H83N10O12Gd [M+] 1353.5, found: 1353.55.
HPPH-20-mono-DTPA-penta-tert-butyl ester (7):
Compound 2 (15 mg, 0.019 mmol), p-Amino-Bn-DTPA-penta(tert-butyl ester) (23 mg, 0.029 mmol) and benzotriazol-1-yloxytris(dimethylamino)-phosphonium hexafluorophosphate (PyBOP, 15 mg, 0.029 mmol) were dissolved in dry DMF (8 mL) under argon atmosphere. To this solution, triethylamine (TEA, 0.15 mL) was added, and the reaction mixture was stirred overnight at room temperature. After this, 20 mL of CH2Cl2 was added to the reaction mixture, and the resulting solution was washed with H2O (4×20 mL). The organic layer was separated, dried with sodium sulfate, filtered and concentrated under reduced pressure. The resulting residue was purified by alumina grade 3 column chromatography, using gradient 0.5 – 1.5 % MeOH in CH2Cl2 as the eluent to give compound 7 with 49% yield (15 mg). UV-Vis λmax (CH2Cl2) : 672 (rel. intensity 0.360), 615 (0.053), 547 (0.108), 514 (0.065), 415 (0.826), 326 (0.174); 1H NMR (400 MHz, CDCl3, δ ppm): 10.16/10.12 (1H, s, 5-H), 9.55/9.54 (1H, s, 10-H), 8.32 (1H, d, J ~ 7.8 Hz, 203a-H), 8.28/8.27 (1H, dd, J = 7.8, 1.7 Hz, 202a-H), ~8.17 (2H, m, amide NH & 203b-H), 7.80/7.77 (1H, dd, J = 7.8, 1.8 Hz, 202b-H), 7.68 (2H, d, J = 8.0 Hz, 2 × phenyl H), 7.35 (2H, d, J = 8.2 Hz, 2 × phenyl H), 5.82 (1H, q, J = 6.7 Hz, 31-H), 5.21 (2H, m, 132-CH2), 4.28/4.26 (1H, q, J = 7.1 Hz, 18-H), 4.12 (1H, m, 17-H), 3.73 (2H, q, J = 7.6 Hz, 8-CH2CH3), 3.70/3.69 (3H, s, 12-CH3),3.66# (~1H, t, J = 6.7 Hz, -OCH2(CH2)4 CH3), 3.573/3.570 (3H, s, -COOCH3), ~3.54# (~0.5H, m, -OCHH(CH2)4CH3), 3.51(4H, m, -N(CH2C(=O)OC(CH3)3)2), 3.45 (4H, m, -N(CH2C(=O)OC(CH3)3)2), ~3.44# (~0.5H, m, -OCHH(CH2)4CH3), 3.41 (2H, m, >NCH2 C(=O)OC(CH3)3), 3.30 (3H, s, 7-CH3), 3.16 (1H, m, -NH-phenyl-CH2CH<), 2.91 (2H, m, -NH-phenyl-CHHCH(N<)CHH-), 2.75 (5H, m, -NH-phenyl-CHH- & >NCH2CH2N<), ~2.56 (2H, m, -NH-phenyl-CH2CH(N<)CHH- & 17-CH2 CHH-), ~2.46 (1H, m, 17-CHHCH2-), 2.38/2.37 (3H, s, 2-CH3), ~2.24 (1H, m, 17-CHHCH2-), ~2.21 (1H, m, 17-CH2CHH-), 2.13/2.00 (3H, d, J = 6.7 Hz, 31-CH3), ~1.75/1.64 (2H, m, -OCH2CH2(CH2)3CH3), 1.73 (3H, t, J = 7.6 Hz, 8-CH2CH3), 1.49 (18H, s, 2 × -COOC(CH3)3), 1.48 (18H, s, 2 × -COOC(CH3)3), 1.46 (9H, s, -COOC(CH3)3), ~1.21–1.44 (2H, m, -O(CH2)2 CH2(CH2)2CH3), ~1.23 (1H, br s, core NH), ~1.23/~1.15 (4H, m, -O(CH2)3(CH2)2CH3), 1.06/1.05 (3H, d, J = 7.0 Hz, 18-CH3), 0.79/0.72 (3H, distorted t, J ~ 7 Hz, -O(CH2)5CH3), −1.52/−1.59 (1H, s, core NH); 13C NMR (100 MHz, CDCl3, δ ppm): 196.2, 173.4, 171.4 (2C), 171.3, 171.01/170.97, 170.8 (2C), 165.2, 160.1/160.0, 153.82/153.81, 151.74/151.71, 148.37/148.36, 145.0, 144.60/ 144.59, 141.9/141.5, 139.24/139.17, 139.15/ 139.12, 137.4, 136.91/136.89, 135.8, 134.86/ 134.68, 134.75, 133.8/133.5, 132.7/ 132 .4, 132.5, 131.28/131.26, 130.1 (2C), 129.02/ 128.99, 127.1, 126.52/126.47, 120.5 (2C), 110.6, 106.3/106.2, 103.81/103.78, 99.34 /99.29, 80.8 (2C), 80.6 (2C), 80.5, 72.9/72.8, 69.7/69.5, 63.3, 56.4, 56.1 (2C), 55.9, 53.6 (2C), 53.0, 52.7, 52.22/52.19, 51.6, 48.6, 48.31/48.28, 36.8, 31.7/31.6, 31.24/ 31.22, 30.2/30.1, 29.9, 28.23 (9C), 28.19 (6C), 26.1/ 26.0, 25.0/24.6, 22.6/22.5, 21.05/21.04, 19.5, 17.4, 14.1/13.8, 14.0/13.9, 12.1, 11.3. Notes: #The -OCH2- group signals arising from two diastereomeric forms were observed at 3.66 ppm (equivalent pair of first form) and 3.54, 3.44 ppm (non-equivalent pair of second form). 1H impurity signals were observed at 1.26 (likely grease CH2), and 0.88 ppm (likely grease CH3). 13C impurity signals (mostly studies were carried out in a linearly-polarized minor) were observed at several chemical shifts. The impurity peak at 29.7 ppm (likely grease CH2) is larger. HRMS (ESI) calculated for C88H123N8O15 Na [MNa+] 1553.8927, found 1553.8883.
HPPH-20-Gd(III)DTPA (8):
Compound 7 (15 mg) was stirred in 3 mL of 75% solution of trifluoroacetic acid in CH2Cl2 for 3 hours under argon atmosphere at room temperature. The reaction mixture was then diluted with 20 mL of CH2Cl2, and gently (to avoid creation of stable emulsion) washed with H2O (5 × 10 mL, until wash water pH >6.5). The organic layer was separated, dried over Na2SO4, and filtered. After removing the solvent, intermediate carboxylic acid was obtained in quantitative yield. UV-Vis λmax (MeOH) : 673 (rel. intensity 0.226), 619 (0.049), 549 (0.079), 515 (0.061), 414 (0.407), 325 (0.173). HRMS (ESI) calculated for C68H83N8O15 [MH+] 1251.5978, found 1251.5933. The intermediate (15 mg, 0.0121 mmol) in pyridine (15 mL) was added to solution of GdCl3•6H2O (4.5 mg, 0.0121 mmol) in deionized water (2 mL). The solution was stirred at room temperature for 3 h. Solvent was removed, and the residue was washed with CH2Cl2 (10 mL) and dried in rotatory evaporator for 3 times. The dark blue solid was collected and dried with high vacuum in a desiccator to provide the desired conjugate 8 (15.3 mg) in 90% yield. HRMS: calculated for C68H77N8O15Gd [M+] 1403.5, found 1403.5.
MR relaxometry:
MRI acquisitions were performed using a General Electric 4.7 T/33 cm horizontal bore magnet (GE NMR instruments, Fremont, CA) incorporating AVANCE digital electronics (Bruker Biospec platform, Bruker BioSpin, Billerica, MA). In vitro and MR relaxometry 1H 35mm ID radiofrequency (RF) coil.
Conjugate(s) dilutions ranging from 20–100 μM underwent MR relaxometry at 4.7 Tesla, 25 C. In vitro T1 relaxation rates were measured using an inversion-recovery True-FISP acquisition with the following parameters: matrix size =128×128, TE/TR =1.5/3.0 ms, flip angle=30°, inversion repetition time =10s, segments =16, frames =100. Signal intensities at each point along the recovery curve were sampled by taking the mean intensity within regions of interest (ROI’s) using commercially available image processing software (Analyze 7.0, Analyze Direct, Overland, KS). T1 relaxation rates were calculated with non-linear curve fitting (MATLAB, MathWorks, Natick MA) as previously described25,28. To determine T2 relaxation rates, multi-echo acquisitions were employed29. T1 and T2 relaxivities for each conjugate were determined by obtaining the slope of the relaxation rate vs. molar concentration by linear regression fitting in Microsoft Excel.
Cellular uptake:
Colon-26 cells were seeded (5 × 10⁵ cells) in triplicate in 6-well plates per conjugate in 2 mL of medium. Each conjugate was added at a dose of 0.5 μM in triplicate and incubated at 37°C for 4h and 24 h. Untreated cells (no conjugate added) were used to determine baseline autofluorescence. Cells were harvested at 4 or 24 h and transferred through a strainer cap into 5 mL FACS tubes, centrifuged. The pellets were re-suspended in 0.25 mL PBS containing 2% FCS. Samples were examined by flow cytometry (LSR II BD Biosciences, San Jose, CA) using a 40 mW Coherent “Cube” solid state laser system using a 640 nm excitation source with detection at 660 nm (± 10 nm).
In vitro PDT efficacy:
In vitro PDT efficacy studies were performed in murine colorectal adenocarcinoma Colon-26 cells, which were grown in RPMI 1640 with 10% BCS, 2 mM L-Glutamine, and 50 IU penicillin/50 μg/mL streptomycin. Cells were maintained in 5 % CO2 and 95% air at 100% humidity. Colon-26 cells were plated in 96 well plates at a density of 3500 cells/well in complete medium and allowed to incubate for 4 hours. PDT compounds were added in triplicate at the concentration ranging from 0.125 – 2 μM. After 4 hours incubation in the dark at 37 °C, the cells were irradiated with laser light from an argon pumped dye laser using a total fluence of 0 J/cm2, 0.5 J/cm2, 1 J/cm2, 2 J/cm2, and 4 J/cm2 delivered at a dose rate of 3.2 mW/cm2. The wavelength of light irradiation was adjusted to the specific maximum excitation wavelength of each drug. After irradiation, the cells were incubated for 48 hours, and then 15 μL of 4 mg/mL 3-(4, 5-dimethylthiazol-2-yl)-2, 5-diphenyltetrazolium bromide (MTT) in PBS was then added to each well and cells were incubated for an additional 4 hours. The MTT-containing medium was removed, and 100μL DMSO was added to solubilize the formazan crystals. The absorbance of the wells was read on a microtiter plate reader at a wavelength of 560 nm. The results were plotted as percent of viable cells (normalized to untreated control cells) cells vs. light dose (J/cm2) for each individual drug, at each concentration and time point.
In vivo imaging studies:
Fluorescence imaging:
Preliminary imaging studies were conducted in vivo to assess the accumulation pattern of each conjugate over time post intravenous injection (see Supporting Information). BALB/c mice bearing Colon-26 tumors on the right flank with an average diameter of 4–5 mm were shaved and depilated with Nair cream over the tumor and the surrounding skin. Compounds were injected via tail vein (3 mice/conjugate) at 10 μmol/kg (MR imaging dose). At 4, 24, and 48 hours post injection, mice were anesthetized with isoflurane and underwent fluorescence imaging using an excitation band pass filter of 640 nm and an emission band pass filter of 680 nm (IVIS® Spectrum, PerkinElmer, Waltham, MA). Signal intensities at each time point were sampled by taking the average radiant efficiency ([p/s/cm2/sr] / [μW/cm2]) within regions of interest using the builtin Living Image software.
MR Imaging:
In vivo MR enhancement studies were carried out in a linearly polarized 1H 35mm ID radiofrequency (RF) coil, while whole-body enhancement and pharmacokinetics were carried out in a quadrature, 72 mm ID RF coil. For comparing the imaging efficacy of the HPPH conjugates to existing MR contrast agents, gadopentetic acid (Gd-DTPA) was purchased from commercial sources (Magnevist™, Bayer Healthcare Pharmaceuticals).
Selected lead compounds were examined for in vivo MR imaging ability (tumor contrast enhancement). Prior to imaging, anesthesia was induced in the animals with 4% isoflurane and maintained with 2% isoflurane during imaging. Animal temperature and respiration rate were monitored with an MR-compatible small animal monitoring system (Model 1025, SAII, Stony Brook, NY), and temperature was maintained at 35°C with warm air. MRI data sets were acquired for each animal before and immediately after injection of each agent (10 μmol/kg). Animals were then re-scanned 4 and 24 hours after injection. T1 relaxometry was performed to estimate the drug concentration in the tumor and vessels. Drug concentrations were estimated by measuring the increase in T1 relaxation rates from the baseline and dividing the increase by the relaxivity of the conjugate as determined in vitro:
Additional MRI studies were conducted to probe the accumulation pattern (concentration and pharmacokinetics) of the water-soluble conjugate 4P in various organs up to 48hrs after administration (see Supporting Information). Mice were imaged in a 72 mm RF coil with a field of view large enough to encompass the entire body. Mice were imaged with a T1-weighted, spoiled gradient echo scan with the following parameters: TE/TR = 3/20ms, flip angle = 25 deg, field of view = 10.24 × 3.84 × 3.84 cm, matrix size = 256×96×96. Sealed NMR tubes containing 100 μM Gd(III)-DTPA served as MR signal intensity calibration phantoms and were placed on the side of each animal. One of the phantoms was comprised of 20% D2O (deuterated water) to reduce the MR signal intensity and allow for a three-point standard curve to be generated from the phantoms and background noise measured from a region of interest (ROI) of air. Signal intensities for tumor, skeletal muscle, kidney, liver and spleen were also sampled. Following segmentation, the mean signal intensities for each ROI were sampled and normalized to the phantom data.
Co-registration of MR and fluorescence images:
To examine co-registered, multimodal imaging, an athymic, nude mouse with a Colon-26 tumor implanted subcutaneously at the thigh. Animal was sacrificed 4 h after injection of conjugate 4P at a dose of 10 μmol/kg and imaged with MRI. Immediately after MRI scanning, the mouse was subject to fluorescence-mediated tomographic imaging using the IVIS® SPECTRUM system utilizing transmission fluorescence imaging was utilized to enable 3D tomographic reconstruction of the optical signal. MR image data was imported into Living Image and co-registered with the optical reconstruction using the software’s 3D Multi-Modality Tool.
In vivo PDT efficacy:
In vivo experiments were performed using BALB/c mice bearing Colon-26 tumor (NCI, Bethesda, MD). Tumor cells (1 × 10⁶ Colon-26 cells in 50 μL RPMI 1640 medium) were implanted subcutaneously in the hind flank and were allowed to grow to an approximate diameter of 5–7 mm before imaging and PDT efficacy studies were performed. All animal procedures were carried out in accordance with guidelines approved by Roswell Park’s IACUC committee.
In vivo photosensitizing efficacy:
(i) Light dose–response: BALB/c 5 mice per treatment group were implanted subcutaneously with Colon-26 cells. When tumors reached 4–5 mm in diameter, mice were injected with 10 μmol/kg of compounds by tail vein injection. 48 hours post injection the mice were restrained with tape on glass plates and exposed tumors were treated with laser light for 40 J/cm2 at 40 mW/cm2, or 20 J/cm2 at 20 mW/cm2 (two treatment groups). Following treatment, tumor growth was monitored daily and measured with calipers along the length and width of the tumors. Tumor volumes were calculated by using the formula V=L × W2/2. Mice were considered cured if no palpable tumor grew within 30 days of being treated; otherwise they were euthanized when the tumor volume reached 400 mm3.
Supplementary Material
Acknowledgements
The authors are highly thankful to the NIH (RO1CA127369), Department of Radiology Chair funds and the shared resources of the RPCI support grant (P30CA16056) for financial assistance.
Footnotes
((VIP))
((Twitter))
R.K. Pandey, J.A. Spernyak, et al. @RoswellPark report a highly effective Gd(III)-DOTA-linked photosensitizer for #photodynamictherapy and dual fluorescence & MR #imaging #anticancer #theranostics #drugdiscovery
Declaration
The in vivo experiments discussed in this article were performed in compliance with all state, local, and federal laws and the PHS Policy on the Humane Care and Use of Laboratory Animals. This study was conducted in an AAALAC-accredited facility. All animal work was approved by the IACUC prior to the initiation of the study.
Supporting information for this article can be found under: https://doi.org/10.1002/cmdc.202000449.
Dedicated to renowned scientist and clinician Prof. Zachary Grossman, MD on his retirement in May 2020.
References
- (1).Weissleder R, Pittet MJ, Nature. 2008, 452, 580–589. [DOI] [PMC free article] [PubMed] [Google Scholar]
- (2).Haris M, Yadav SK, Rizwan A, Singh A, Wang E, Hariharan H, Reddy R, Marincola FM, J. Transl. Med 2015, 13, 313. [DOI] [PMC free article] [PubMed] [Google Scholar]
- (3).Khaul A, Majlarh M, Counant V, Hess A, Laisey JP, Debray MP, Diagnostic and Interventional Imaging 2016, 97, 991–1002. [DOI] [PubMed] [Google Scholar]
- (4).Kolokythas O, Shibata DK, Dubinsky TJ, Boston: Artech House, 2009, pp. 17–57. [Google Scholar]
- (5).James ML, Gambhir SS, Physiol. Rev 2012, 92, 897–965. [DOI] [PubMed] [Google Scholar]
- (6).Caravan P, Ellison JJ, McMurry TJ, Lauffer RB, Chem. Rev 1999, 99: 2293–2352. [DOI] [PubMed] [Google Scholar]
- (7).Azar FS, Intes X (Eds.), Translational Multimodality Optical Imaging, Boston: Artech House, 2005, Chapters 1–18, pp.1–368. [Google Scholar]
- (8).Sour A, Jenni S, O-Suarez A, Heitz V, Bolze F, De Sousa PL, Po C, Bonnet CS, Pallier A, Toth E, Ventura B, Inorg. Chem, 2016, 55, 4545–4554. [DOI] [PubMed] [Google Scholar]
- (9).Pandey SK, Gryshuk S,AI, Sajjad M, Zheng X, Chen Y, Abouzeid MM, Morgan J, Charamisinau I, Nabi HA, Oseroff A, Pandey RK, J. Med. Chem, 2005, 48, 6286–6295. [DOI] [PubMed] [Google Scholar]
- (10).Gupta A, Wang S, Pera P, Rao KVR, Patel N, Ohulchanskyy TY, Missert J, Morgan J. Koo-Lee Y-E, Kopelman R, Pandey RK, Nanomedicine: Nanotechnology Biology, 2012, 8, 941–950. [DOI] [PMC free article] [PubMed] [Google Scholar]
- (11).Gupta A , Wang S, Marko S,A, Joshi P, Ethirajan M, Chen Y, Yao R, Sajjad M, Kopelman R, Pandey RK, Theranostics, 2014, 4, 614–628. [DOI] [PMC free article] [PubMed] [Google Scholar]
- (12).Kessel D, J. Clin. Med 2019, 8, 1581–1588. [Google Scholar]
- (13).Pandey RK, Kessel D, Dougherty TJ (Eds.), Handbook of Photodynamic Therapy, World Scientific, New Jersey, 2016, Chapters 1–18, pp. 3–548. [Google Scholar]
- (14).dos Santos AF, de Almeida DRQ, Terra L, Baptista MS, Labriola L, J. Cancer Metastasis Treat 2019, 5, 25. [Google Scholar]
- (15).Frochot C, Mordon S, Journal of Porphyrins and Phthalocyanines, 2019, 23, 347–357. [Google Scholar]
- (16).Rigual N, Shafirstein G, Cooper MT, Baumann H, Bellnier DA, Sunar U, Tracy EC Rohrbach DJ, Wilding G, Sullivan W, Merzianu M, Henderson BW, Clinical Cancer Research, 2013, 19, 6605–6613. [DOI] [PMC free article] [PubMed] [Google Scholar]
- (17).Ethirajan M, Chen Y, Joshi P, Pandey RK, Chem Soc Rev, 2011, 40: 340–362. [DOI] [PubMed] [Google Scholar]
- (18).Pandey RK, Goswami LN, Chen Y, Grushuk A, Missert JR, Dougherty TJ, Lasers in Surgery and Medicine, 2006, 38, 445–467. [DOI] [PubMed] [Google Scholar]
- (19).Li G, Slansky A, Dobhal MP, Goswami LN, Pandey RK, et al. Bioconjugate Chem. 2005, 16, 32–42. [DOI] [PubMed] [Google Scholar]
- (20).Goswami LN, White WH, Pandey RK, et al. Bioconjugate Chemistry. 2010, 21 816–827. [DOI] [PMC free article] [PubMed] [Google Scholar]
- (21).Spernyak JA, White WH, Pandey RK, et al. Bioconjugate Chemistry, 2010, 21: 828–835. [DOI] [PMC free article] [PubMed] [Google Scholar]
- (22).Bousquet JC, Saini S, Stark DD. Hahn PF, Nigam M, Wittenberg J, Ferrucci JT, Radiology, 1988, 166, 693–698. [DOI] [PubMed] [Google Scholar]
- (23).Ethirajan M, Joshi P, William WH, Ohkubo K, Fuzukumi S, Pandey RK. Org. Lett, 2011, 13, 1956–1959. [DOI] [PMC free article] [PubMed] [Google Scholar]
- (24).Ersoy H, Rybicki FJ J. Magn. Resonance Imaging, 2007, 26, 1190–1197. [DOI] [PMC free article] [PubMed] [Google Scholar]
- (25).Barge A, Cravotto G, Gianolio E, Fedeli F, Contrast Med Mol Imaging. 2006, 1, 184–188. [DOI] [PubMed] [Google Scholar]
- (26).Fossheim SL, Fahlvik AK, Klaveness J, Muller RN, Magn. Reson. Imaging, 1999, 17, 83–89. [DOI] [PubMed] [Google Scholar]
- (27).Lindner LH, Reinl HM, Schlemmer M, Stahl R, Peller M, Int. J. Hyperthermia, 2005, 21, 575–588. [DOI] [PubMed] [Google Scholar]
- (28).Schmitt P, Griswold MA, Jakob PM, Kotas M, Gulani V, Flenji M, Haase Magn A. Reson Med. 2004, 51, 661–667. [DOI] [PubMed] [Google Scholar]
- (29).Dorazio SJ Tsitovich PB , Siters KE Spernyak K,JA, Morrow JR, J. Am. Chem. Soc 2011, 133, 14154–14156. [DOI] [PMC free article] [PubMed] [Google Scholar]
Associated Data
This section collects any data citations, data availability statements, or supplementary materials included in this article.