

Abstract
There are no targeted therapies available for triple-negative breast cancers (TNBCs) in part because they represent a heterogeneous group of tumors with diverse oncogenic drivers. Our goal is to identify targeted therapies for subtypes of these cancers using a mechanism-blind screen of natural product extract libraries. An extract from Desmanthodium guatemalense was 4-fold more potent for cytotoxicity against MDA-MB-231 cells, which represent the mesenchymal stem-like (MSL) subtype, as compared to cells of other TNBC subtypes. Bioassay-guided fractionation led to the isolation of six polyacetylenes, and subsequent investigations of plant sources known to produce polyacetylenes yielded six additional structurally related compounds. A subset of these compounds retained selective cytotoxic effects in MSL subtype cells. Studies suggest that these selective effects do not appear to be due to PPARγ agonist activities that have previously been reported for polyacetylenes. A CRISPR-Cas9-mediated gene knockout screen was employed to identify the mechanism of selective cytotoxic activity of the most potent and selective compound, dehydrofalcarinol (1a). This genomic screen identified HSD17B11, the gene encoding the enzyme 17β-hydroxysteroid dehydrogenase type 11, as a mediator of the selective cytotoxic effects of 1a in MDA-MB-231 cells that express high levels of this protein. The Project Achilles cancer dependency database further identified a subset of Ewing sarcoma cell lines as highly dependent on HSD17B11 expression and it was found these were also highly sensitive to 1a. This report demonstrates the value of CRISPR-Cas9 genome-wide screens to identify the mechanisms underlying the selective activities of natural products.
Graphical Abstract

In 2020, it is estimated that over 275,000 individuals will be diagnosed with breast cancer and more than 42,500 will succumb to this disease in the United States alone.1 These statistics highlight the critical need for new therapies for breast cancers. Significant success in the treatment of breast cancer has been achieved in the past 20 years by targeting the estrogen (ER), progesterone (PR) and human epidermal growth factor (HER2) receptors. Selective estrogen receptor modulators, aromatase inhibitors, and monoclonal antibodies targeting HER2 are highly effective and improve survival of patients whose tumors express these receptors.2–5 The addition of the first HER2-targeted monoclonal antibody, trastuzumab, to chemotherapy for HER2-amplified tumors increased disease-free patient survival at four years from 67.1% in the standard-of-care group to 85.3% in the trastuzumab-treated group.6 While targeted therapies are effective in ER, PR, and HER2 amplified breast cancers, they have no utility in triple-negative breast cancers (TNBCs) that do not express these receptors. TNBCs represent 15–20% of all breast cancers and they are more commonly diagnosed in younger women and in African Americans.7 While 30–40% of TNBC patients achieve a pathological complete response from standard-of-care cytotoxic chemotherapies,8 those that do not respond have a much poorer prognosis and a 12-times higher rate of death due to metastatic disease.8–10 This emphasizes the significant need for new drugs to provide long-term survival for TNBC patients.
Identifying new targets and drug leads for TNBC has been challenging because of the heterogeneity of these cancers.11 Lehmann, Bauer, and their colleagues used gene expression analysis of 587 TNBC patient samples to define molecularly distinct subtypes of TNBC.12 These subtypes, based on gene ontologies, include: basal-like 1 and 2 (BL1 and BL2), luminal androgen receptor (LAR), mesenchymal (M), and mesenchymal stem-like (MSL) and immunomodulatory (IM).12 Of importance for drug discovery efforts, these investigators classified 27 TNBC cell lines as representatives of these clinical subtypes based on similar gene expression profiles.12 Other efforts have defined TNBC subtypes, and there are commonalities and notable differences,13, 14 but few groups have identified representative cell lines. The subtyping of TNBC cell lines provides an opportunity to screen for TNBC subtype-selective compounds to facilitate the discovery of new drug leads and targets for these molecularly defined clinical TNBC subtypes.
Crude extracts from plants and fungi were evaluated for selective cytotoxic activity in a panel of cell lines representing five TNBC subtypes (BL1, BL2, LAR, M, and MSL). Bioassay-guided fractionation of the selective extracts was employed to isolate pure compounds responsible for the selective cytotoxic effects. To date, this initiative has yielded TNBC subtype-selective compounds, including deguelin,15 diaryloxazoles,16 and leucinostatins17 that target the LAR subtype, and maximiscin,18 which targets the BL1 subtype. The mechanisms of action of these compounds were identified based on the predicted driver pathways of the respective susceptible TNBC subtype. Deguelin, the diaryloxazoles, and the leucinostatins selectively target the LAR subtype by inhibition of mTORC1 signaling,15, 16 which modulates cell growth and survival of this TNBC subtype.19 Maximiscin is a DNA-damaging agent that has selective effects in cells representing the BL1 subtype, which are known to be more sensitive to DNA damaging agents than other TNBC subtypes.18 Englerin A facilitated the identification of a new subgroup of TNBC cell lines that are particularly susceptible to changes in intracellular sodium and calcium.20 These results demonstrate the ability of our screening program to identify compounds that are selectively cytotoxic to molecularly defined TNBC subtypes and to identify potential new targets and mediators of drug sensitivity for discrete TNBC subtypes.
Herein we report the isolation and identification of 12 polyacetylenes from multiple plant sources, including nine that are selectively cytotoxic to cell lines representing the MSL subtype. These compounds were used to define structure-activity relationships for MSL-subtype selectivity with 1a being the most potent and selective. Surprisingly, the MSL-specific driver pathways predicted by pathway analysis were not affected by 1a. Therefore, we undertook an unbiased genetic approach to identify mediators of MSL subtype cell sensitivity to 1a utilizing a CRISPR-Cas9-mediated pooled sgRNA screen. The success of this approach in the identification and subsequent verification of HSD17B11 expression as a key mediator of selective TNBC subtype cytotoxicity to 1a demonstrates that CRISPR-Cas9-based genetic screens can revolutionize the identification of gene products whose expression underlies the selective cytotoxic activity of compounds, which are often a limiting step in natural product drug discovery initiatives.
RESULTS AND DISCUSSION
Bioassay-Guided Purification of Compounds from the D. guatemalense extract.
An extract from D. guatemalense was prioritized for bioassay-guided fractionation based on screening data revealing that the MDA-MB-231 cell line (representing the MSL TNBC subtype) was 4-fold more sensitive to its cytotoxic effects compared to the MDA-MB-468, HCC1806, MDA-MB-453 and BT-549 cell lines representing the BL1, BL2, LAR and M subtypes, respectively (Figure S1a, Supporting Information). The MDA-MB-231 cell line is typically the most resistant TNBC cell type in our screening panel, which made this degree of selectivity notable and rare. Bioassay-guided fractionation was performed (Figure S1b, Supporting Information) and multiple fractions retained potent and selective activity against MDA-MB-231 cells as compared to cells representing other TNBC subtypes (Figure S1c, Supporting Information). Further fractionation of the samples showing MDA-MB-231 selectivity resulted in the purification of compounds 1 – 6 (Figure 1). Dehydrofalcarinol (1),21, 22 dendroarboreol B (3),22 and 1,2-dihydrodendroarboreol B (5)23 were determined to match known polyacetylenes bearing 17 carbons. In comparison, the new compounds called cofalcarinols A (2), B (4), and C (6) are polyacetylenes bearing 16 carbons, which is a relatively uncommon feature within this metabolite family.
Figure 1.

Structures of compounds identified in this study.
Structure Determination of Compounds from D. guatemalense.
Compound 1 matched data reported for dehydrofalcarinol; however, we were unsure which isomer had been obtained since minor inconsistencies existed between the structures and data presented in literature reports, as well as structure details that appeared in the SciFinder® database. A thorough investigation of the structure commenced including analyses of its 1H, 13C, and 2D NMR data (Tables 1 and 2, and Figure 2). The C-9/C-10 double bond was determined to have a Z configuration based on the coupling constant (J = 10.7 Hz) measured between the olefinic protons. Compound 1 displayed a single peak on different chiral HPLC columns (Figure S2, Supporting Information) and Mosher ester analysis of the sample provided evidence for a 3S configuration (Figure 3, Table 3), which supported sample 1 as being 3S-dehydrofacarinol.
Table 1.
1H NMR Data of Compounds 1 – 6, and 12 in CDCl3 (400 MHz, J in Hz)
| No. | 1 | 2 | 3 | 4 | 5 | 6 | 12 |
|---|---|---|---|---|---|---|---|
| 1 | 5.46, d (16.8) | 5.46, d (17.0) | 5.48, brd (17.1) | 5.48, d (16.6) | 1.03, t (7.5) | 1.04, t (7.5) | 5.46 brd (17.1) |
| 5.24, d (12.7) | 5.24, d (10.1) | 5.26, brd (10.2) | 5.26, d (10.3) | 5.24 brd (10.1) | |||
| 2 | 5.95, ddd (17.1, 10.2, 5.4) | 5.95, ddd (17.0, 10.1, 5.3) | 5.96, ddd (17.1, 10.2, 5.4) | 5.96, ddd (17.1, 10.2, 5.3) | 1.75, m | 1.77, m | 5.94 ddd (17.1, 10.2, 5.4) |
| 3 | 4.90, d (5.8) | 4.91, t (5.7) | 4.97, m | 4.96, m | 4.42, q (6.2) | 4.44, q (6.2) | 4.91 brd (5.4) |
| 8 | 3.03, d (6.8) | 3.03, d (6.8) | 5.77, d (16.0) | 5.77, d (15.7) | 5.76, brd (15.6) | 5.78, brd (15.9) | 3.03 brd (6.8) |
| 9 | 5.38, dtt (10.7, 6.8, 1.6) | 5.38, dtt (10.6, 6.8, 1.6) | 6.33, dd (15.9, 5.6) | 6.33, dd (16.0, 5.6) | 6.32, dd (15.9, 5.7) | 6.33, dd (15.9, 5.7) | 5.39 dt (9.8, 7.2) |
| 10 | 5.51, dtt (10.6, 7.3, 1.7) | 5.51, dtt (10.6, 7.2, 1.8) | 4.19, m | 4.20, m | 4.20, m | 4.21, m | 5.50 m |
| 11 | 2.02, m | 2.03, m | 1.53, m | 1.53, m | 1.51, m | 1.53, m | 2.05 m |
| 12 | 1.38, m | 1.39, m | 1.33, m | 1.40, m | 1.38, m | 1.42, m | 1.47 m |
| 13 | 1.38, m | 1.39, m | 1.33, m | 1.40, m | 1.38, m | 1.42, m | 2.05 m |
| 14 | 1.33, m | 2.06, m | 1.39, m | 2.06, m | 1.38, m | 2.07, m | 5.79 ddd (17.0, 10.3, 6.7) |
| 15 | 2.05, m | 5.80, ddt (17.0, 10.2, 6.7) | 2.04, dt (7.0, 6.8) | 5.80, ddt (17.0, 10.3, 6.6) | 2.05, m | 5.80, ddt (17.0, 10.3, 6.6) | 5.01 dq (17.2, 1.8) 4.96 brd (10.3) |
| 16 | 5.81, ddt (17.1, 10.3, 6.6) | 5.00, dq (17.1, 19) | 5.79, ddt (16.8, 10.3, 6.6) | 5.00, dq (17.1, 1.9) | 5.80, ddt (17.0, 10.3, 6.6) | 5.01, dq (17.1, 19) | |
| 4.94, brd (10.2) | 4.95, brd (9.6) | 4.96, brd (9.6) | |||||
| 17 | 5.00, dq (17.0, 19) | 4.93, brd (10.2) 4.99, brd (17.1) |
5.00, dq (17.1, 19) | ||||
| 4.94, brd (10.1) | 4.94, brd (9.6) | ||||||
| 3-OH | 1.90, d (6.5) | 1.87, d (6.4) | 1.94, d (6.3) | 1.92, d (6.6) | 1.81, d (5.7) |
Table 2.
13C NMR Data of Compounds 1 – 6 and 12 in CDCl3 (100 MHz)
| No. | 1 | 2 | 3 | 4 | 5 | 6 | 112 |
|---|---|---|---|---|---|---|---|
| 1 | 117.0 CH2 | 117.0 CH2 | 117.2 CH2 | 117.2 CH2 | 9.3 CH3 | 9.3 CH3 | 117.1 CH3 |
| 2 | 136.1 CH | 136.2 CH | 135.9 CH | 135.9 CH | 30.7 CH2 | 30.7 CH2 | 136.1 CH |
| 3 | 63.5 CH | 63.5 CH | 63.7 CH | 63.7 CH | 64.2 CH | 64.2 CH | 63.5 CH |
| 4 | 74.2 C | 74.2 C | 80.4 C | 80.4 C | 82.9 C | 82.9 C | 74.2 C |
| 5 | 64.0 C | 64.0 C | 70.9 C | 70.8 C | 69.6 C | 69.5 C | 64.0 C |
| 6 | 71.3 C | 71.3 C | 73.6 C | 73.6 C | 72.0 C | 73.7 C | 71.3 C |
| 7 | 80.2 C | 80.2 C | 77.5 C | 77.5 C | 77.2 C | 77.2 C | 80.2 C |
| 8 | 17.7 CH2 | 17.7 CH2 | 108.1 CH | 108.1 CH | 108.2 CH | 108.2 CH | 17.7 CH2 |
| 9 | 122.0 CH | 122.1 CH | 149.9 CH | 149.8 CH | 149.6 CH | 149.5 CH | 122.3 CH |
| 10 | 133.0 CH | 132.8 CH | 72.0 CH | 71.9 CH | 72.0 CH | 72.0 CH | 132.6 CH |
| 11 | 27.1 CH2 | 27.0 CH2 | 36.8 CH2 | 36.7 CH2 | 36.8 CH2 | 36.7 CH2 | 26.5 CH2 |
| 12 | 28.7 CH2 | 28.4 CH2 | 25.0 CH2 | 24.6 CH2 | 25.0 CH2 | 24.6 CH2 | 28.4 CH2 |
| 13 | 29.0 CH2 | 28.9 CH2 | 28.9 CH2 | 28.7 CH2 | 28.7 CH2 | 28.7 CH2 | 33.2 CH2 |
| 14 | 28.7 CH2 | 33.6 CH2 | 28.7 CH2 | 33.6 CH2 | 28.9 CH2 | 33.6 CH2 | 138.5 CH |
| 15 | 33.7 CH2 | 138.8 CH | 33.6 CH2 | 138.8 CH | 33.6 CH2 | 138.6 CH | 114.8 CH2 |
| 16 | 139.0 CH | 114.0 CH2 | 138.9 CH | 114.0 CH2 | 138.6 CH | 114.6 CH2 | |
| 17 | 114.3 CH2 | 114.3 CH2 | 114.3 CH2 |
Figure 2.

Selected 1H-1H COSY and HMBC correlations of compounds 1, 2, 4, 6, and 12.
Figure 3.

Mosher analysis of compounds 1, 2, 3, 4, and 12 (Δδ in ppm).
Table 3:
Stereochemical Analysis of Compounds 1 – 6, 9 and 12 with R- and S-MTPA (Mosher) Derivatives
| MTPA ester | Δδ = δS-ester - δR-ester (ppm) | Chiral center | ||||
|---|---|---|---|---|---|---|
| H-1 | H-2 | H-8 | H-9 | C-3 | C-10 | |
| 1 | E: −0.068; Z: −0.056 | −0.088 | +0.008 | ~0 | S | NA |
| 2 | E: −0.068; Z: −0.056 | −0.088 | +0.008 | ~0 | S | NA |
| 3 | E: −0.07; Z: −0.058 | −0.09 | ±0.182 | ±0.1 | S | R/S |
| 4 | E: −0.068; Z: −0.054 | −0.086 | ±0.182 | ±0.1 | S | R/S |
| 5 | ±0.082 and ±0.006 | b | ±0.176 | ±0.098 | R/S | R/S |
| 6 | ±0.082 and ±0.006 | b | ±0.178 | ±0.1 | R/S | R/S |
| 9a | ±0.08 | b | ~0 | ~0 | R/S | NA |
| 12 | E: ±0.064; Z: ±0.058 | ±0.084 | ±0.008 | ~0 | R/S | NA |
1H NMR data was obtained on a 400 MHz Varian instrument and all others were measured on a 500 MHz Varian instrument.
Resonances not discernible in overlapped multiplets.
Compound 2 was obtained as a colorless oil. The HRESIMS (m/z 251.1410 [M+Na]+), together with the 1H and 13C NMR data (Tables 1 and 2), led to the proposed molecular formula C16H20O, which differed from metabolite 1 by a single −CH2− unit. Further examination of the 1H and 13C NMR data (Tables 1 and 2) revealed signals attributable to four protons in the range of δH 1.3–1.4 ppm and two carbon resonances in the range of δC 28–29 ppm in metabolite 2, versus six proton and three carbon signals, respectively, in compound 1. Considering that the remaining carbon and proton signals in 2 were nearly identical to those occurring in compound 1, it was proposed that one of the three methylene groups located between C-11 and C-15 in 1 was missing in the new metabolite. This hypothesis was supported by the 2D NMR data (COSY and HMBC, Figure 2), which were instrumental in confirming the bond-line structure of compound 2. The Z configuration of the C-9/C-10 alkene was deduced based on its characteristic coupling constant (J = 10.6 Hz) arising from the olefinic protons. The observations that metabolite 2 featured a rather large optical rotation value ([α]20D +42) and eluted as a single peak under chiral HPLC conditions (Figure S3, Supporting Information) indicated that the natural product existed as a single enantiomer. Turning to Mosher ester analysis, the absolute configuration of C-3 was determined to be S (Figure 3, Table 3), thus establishing the structure of metabolite 2, which was assigned the trivial name cofalcarinol A.
Data obtained from the HRESIMS, and 1H and 13C NMR analysis of the sample representing compound 3 revealed that it matched values reported for dendroarboreol B.22 However, we noted that some of the NMR chemical shifts had not been fully resolved and the stereochemical properties of this molecule remained unsolved, thus we proceeded to investigate those features of the natural product. The C-8/C-9 alkene was confirmed to possess an E configuration based on the large coupling constant (J = 15.9 Hz) observed between the olefinic protons. Next, chiral HPLC analysis was performed on the sample (Figure S4, Supporting Information). Elution of the material over a Phenomenex Lux Cellulose-3 column generated just a single peak, but upon switching to a Phenomenex Lux Cellulose-2 column, a pair of peaks was observed. Since the structure was proposed to contain two stereogenic carbon atoms, we theorized that the sample consisted of a 1:1 epimeric mixture of metabolites. Mosher ester derivatives of 3 were prepared and 1H NMR analysis of the resulting samples revealed two sets of signals (Figure S5, Supporting Information) corroborating the idea that diastereomers were generated. A comparison of the chemical shift data for the Mosher-ester-product protons located in the vicinities of C-3 and C-10 led to the conclusion that the protons near C-10 exhibited greater chemical shift disparity upon comparison of the two data sets. This indicated the C-10 stereocenter was the epimeric carbon whereas C-3 was S configured in both compounds (Figure 3, Table 3). Thus, dendroarboreol B was determined to consist of a 1:1 mixture of C-10 epimers. It must be noted that given the amount of critical data missing from the initial report of dendroarboreol B,22 there is a possibility that the composition of compound 3 and dendroarboreol B are in fact different. Since this issue cannot be resolved, we have opted to take a conservative position and retain the previous published trivial name for this metabolite.
Compound 4 was obtained as a colorless oil and its molecular formula was established by HRESIMS to be C16H20O2 based on the presence of an ion with m/z 267.1352 [M+Na]+ (calcd for 267.1356). This compound differed from metabolite 3 by the equivalent of a single −CH2− unit, which led us to compare the 1H and 13C NMR data of the two samples (Tables 1 and 2). Further investigation using the COSY and HMBC correlations (Figure 2) helped confirm that one of the methylene groups located between C-11 and C-15 in 3 was missing in compound 4. The alkene was determined to have an E configuration based on the large coupling constant (J = 16.0 Hz) between the olefinic protons (Table 1). Chiral HPLC (Figure S6, Supporting Information) demonstrated that the sample was composed of two compounds. Mosher esters were prepared revealing that C-3 absolute configuration as S; however, two sets of 1H NMR signals were detected for the protons in the vicinity of the C-10 stereocenter (Figure S7, Supporting Information). Accordingly, compound 4 was deduced to consist of C-10 epimers and it was assigned the trivial name cofalcarinol B.
Both the HRESIMS and 1D NMR (Tables 1 and 2) data for 5 matched values reported for the compound 1,2-dihydrodendroarboreol B.23 However, the stereochemical features of the molecule had not been defined, which prompted us to investigate the sample further. The C-8/C-9 alkene was determined to have an E configuration based on the large coupling constant (J = 15.9 Hz) observed between the olefinic protons. The deceptive simplicity of the sample’s 1H NMR data became apparent when results from chiral HPLC revealed that 5 was composed of four different molecules (Figure S8, Supporting Information,). This was interpreted to mean that 5 consisted for four diastereomers (3R,10R; 3R,10S; 3S,10R; and 3S,10S). As further confirmation of this inference, Mosher ester derivatives were prepared resulting in a rather complex mixture of diastereomeric products (Figure S9, Supporting Information). Thus, 5 was confirmed to be mixture of diastereomeric metabolites.
Compound 6 was obtained as a colorless oil and its molecular formula was determined to be C16H22O2 based on HRESIMS, which yielded a sodiate adduct ion peak at m/z 269.1516 [M+Na]+ (calcd for 269.1512). This molecular formula differed from 5 by the equivalent of one −CH2− unit. Analysis of the 1H and 13C NMR data (Tables 1 and 2, respectively), as well as results from 2D NMR experiments (Figure 2) confirmed 6 to be a structural analogue of 5 with one of the methylene groups located between C-11 and C-15 missing in the new sample. An investigation of the sample by chiral HPLC revealed that it was composed of four compounds (Figure S10, Supporting Information). Analysis of the 1H NMR data confirmed an E configuration for the C-8/C-9 olefinic bond based on its large coupling constant (J = 15.9 Hz) (Table 1). Further confirmation of the sample’s composition was obtained upon Mosher ester formation, which provided a complex 1H NMR data set (Figure S11, Supporting Information) that was similar to the results observed for 5. This was indicative of the diastereomeric nature of 6. Thus, 6 was determined to be a mixture of 3R,10R; 3R,10S; 3S,10R; and 3S,10S diastereomers and assigned the trivial name cofalcarinol C.
Chemistry-Guided Purification of Polyacetylenes from T. arvensis.
To expand our chemical investigation of bioactive polyacetylenes, we identified reports describing similar metabolites from plants species and/or taxa closely related to them that we could source in our immediate vicinity. One was an Apiaceous plant (Torilis arvensis), which is prevalent in the Norman, OK (USA) area. Chemistry-guided isolation of polyacetylenes from a T. arvensis extract resulted in the purification of compounds 7 and 8, which matched spectrometric and spectroscopic data provided for the previously reported compounds (3R,8S)-falcarindiol and (R)-falcarinol, respectively.24, 25
Chemistry-Guided Purification of Polyacetylenes from H. annuus.
Cultivars of common commercial and garden variety sunflowers, Helianthus annuus (Asteraceae), were reported to produce polyacetylene compounds.26 A qualitative survey of various parts of the whole plant revealed that the roots and the first ~15 cm of above-ground stem materials contained readily detectable amounts of polyacetylene-like molecules. Chemistry-guided purification yielded compound 1a, which matched MS and NMR data for compound 1, as well as the in vitro activity of 1 (Figure S52, Supporting Information). However, there was a key difference in the sample derived from the H. annuus (1a) versus the D. guatemalense (1): whereas compound 1 was determined to consist of a single enantiomer (3S), sample 1a was composed of a scalemic mixture of the 3R and 3S isomers in a ratio of ~1:9, respectively (Figures S12 and S13, Supporting Information). Additionally, scalemic 1,2-dihydro-16,17-dehydrofalcarinol (9),27 (3R,8S,Z)-pentadeca-1,9,14-trien-4,6-diyne-3,8-diol (10),28 and (3R,Z)-3-hydroxypentadeca-1,9,14-trien-4,6-diyn-8-yl acetate (11)28 (note the configuration of the C-8 stereocenter was not unequivocally resolved). Compound 12 was purified as a colorless oil and its spectroscopic data did not match any of the previously reported polyacetylene metabolites. An examination of the 1H and 13C NMR (Tables 1 and 2) confirmed that the metabolite was structurally similar to compounds 1 and 2 but differed by having only 15 carbons. The bond-line structure of 12 was confirmed by 2D NMR (Figure 2) and the Z configuration of the C-9/C-10 double bond was determined based on a coupling constant of J = 9.8 Hz for the olefinic protons. This left the configuration of the C-3 stereocenter to be addressed. Results from the chiral HPLC analysis (Figure S14, Supporting Information) combined with the Mosher ester analysis (Figure 3, Figure S15, Supporting Information, and Table 3) revealed that compound 12 was an ~1:4 scalemic mixture of the 3R and 3S isomers, respectively.
Evaluation of MSL Selectivity.
The isolated compounds were tested in a TNBC cell line panel to evaluate predicted MSL subtype selectivity. The data show that MDA-MB-231 cells representing the MSL subtype are at least 4-fold more sensitive to 1 and 2 as compared to cells representing the BL1 (HCC1806), BL2 (MDA-MB-468), M (BT-549), or LAR (MDA-MB-453) TNBC subtypes throughout the full concentration response curves (Figure 4). A second cell line representing the MSL subtype, MDA-MB-157, was evaluated and found to be the second most sensitive to 1 and 2, confirming the MSL subtype selectivity of these compounds. A selectivity index was calculated by dividing the concentration that causes 50% cytotoxicity (LC50) of the resistant TNBC cells by the LC50 of MDA-MB-231 cells. The selectivity index of 1 for the non-MSL TNBC cell lines ranges from 5.3 to greater than 29 and the selectivity index of 2 ranges from 9.0 to 47 (Table 4).
Figure 4.

Effects of 1 and 2 in TNBC cell lines. Concentration response curves of 1 (a) and 2 (b) in cell lines representing 5 subtypes of TNBC. Cells were treated for 48 h and the SRB assay was used to measure antiproliferative and cytotoxic effects. n = 2 – 4 for each cell line; means ± SEM.
Table 4.
Potency and Selectivity of 1 and 2 in a Cell Line Panel Representing Five Subtypes of TNBC
| Compound | μM ± SD | MDA-MB-231 | MDA-MB-157 | BT-549 | HCC1806 | MDA-MB-468 | MDA-MB-453 |
|---|---|---|---|---|---|---|---|
| 1 | GI50 | 0.051 ± 0.009 | 0.059 ± 0.030 | 0.22 ± 0.01 | 0.30 ± 0.05 | 0.85 ± 0.24 | 2.8 ± 0.5 |
| TGI | 0.089 ± 0.022 | 0.13 ± 0.07 | 0.42 ± 0.03 | 0.54 ± 0.08 | 2.0 ± 0.6 | > 5.0 | |
| LC50 | 0.17 ± 0.07 | 0.29 ± 0.15 | 0.90 ± 0.45 | 1.2 ± 0.06 | 4.4 ± 0.5 | > 5.0 | |
| LC50 Select. Index | NA | 1.7 | 5.3 | 7.1 | 26 | > 29 | |
| 2 | GI50 | 0.074 ± 0.016 | 0.19 ± 0.13 | 0.39 ± 0.012 | 0.39 ± 0.2 | 1.3 ± 0.6 | 1.7 ± 0.9 |
| TGI | 0.12 ± 0.03 | 0.30 ± 0.17 | 0.85 ± 0.10 | 0.88 ± 0.28 | 3.1 ± 1.0 | 5.1 ± 1.7 | |
| LC50 | 0.21 ± 0.06 | 0.51 ± 0.27 | 1.9 ± 0.4 | 1.9 ± 0.3 | 5.4 ± 0.8 | 9.8 ± 3.2 | |
| LC50 Select. Index | NA | 2.4 | 9.0 | 9.0 | 26 | 47 |
Figure 5 shows the concentration response curves for each of the polyacetylenes in the sensitive MDA-MB-231 cells (MSL subtype) and resistant BT-549 cells (M subtype) with the total growth inhibition (TGI) values and selectivity index for each compound calculated in Table 5. The concentration response curves showed that compounds 1 – 6 and 12 have MDA-MB-231 selectivity, while other polyacetylenes, 7 – 11, have little to no selectivity for these cells as compared to BT-549 cells (Figure 5). Evaluation of the structure-activity relationships of the polyacetylenes for MSL subtype selectivity shows that at least two structural features influence this activity. Compound 11 is unique among this series in that it has an acetoxy group at C-8 (Figure 1). Compounds 7 and 10 also have substitutions at C-8, suggesting that substituents at this site diminish the MSL selectivity. Compounds 8 and 9, which differ from the highly selective compound 1 only by reduction of the C-16/C-17 or C-1/C-2 olefins, respectively, suggest that terminal alkenes might be important for the observed selectivity.
Figure 5.

Effects of 1–12 in TNBC cell lines. Concentration response curves from MDA-MB-231 cells of the MSL subtype (shown in green) and BT-549 cells (shown in blue) of the M subtype of TNBC. Cells were treated for 48 h and the SRB assay was used to measure antiproliferative and cytotoxic effects. The results represent n = 3; means ± SEM.
Table 5:
TGI Values of Compounds 1 – 12 in MDA-MB-231 and BT-549 Cells
| TGI (μM) ± SEM | |||
|---|---|---|---|
| Compound | MDA-MB-231 | BT-549 | Selectivity Index |
| 1 | 0.09 ± 0.01 | 0.42 ± 0.02 | 7.3 |
| 2 | 0.12 ± 0.02 | 0.87 ± 0.06 | 4.7 |
| 3 | 0.16 ± 0.02 | 1.1 ± 0.2 | 6.9 |
| 4 | 0.36 ± 0.05 | 4.2 ± 0.5 | 12 |
| 5 | 4.3 ± 0.5 | > 5 | ND |
| 6 | 4.8 ± 0.3 | > 10 | ND |
| 7 | 6 ± 1 | 9 ± 4 | 1.5 |
| 8 | 6 ± 2 | 9 ± 2 | 1.5 |
| 9 | 3.3 ± 0.6 | 7 ± 2 | 2.1 |
| 10 | 12 ± 1 | 29 ± 6 | 2.4 |
| 11 | 2.5 ± 0.6 | 2.0 ± 0.5 | 0.8 |
| 12 | 0.49 ± 0.08 | 2.4 ± 0.8 | 4.9 |
Studies were initiated to probe the mechanism of selectivity for 1a in MDA-MB-231 cells. Compound 1a was used because of the limited amount of 1 that was available. Treatment of the cells with 1a at the LC50 concentration for 18 h did not alter the cell cycle distribution of MDA-MB-231 cells, eliminating common mechanisms of action initiated by mitotic inhibition, which cause G2/M accumulation, or DNA damage responses that typically cause G1 accumulation (Figure S53, Supporting Information). The gene ontology evaluations by Lehmann, Bauer, and colleagues identified that the molecular drivers of the MSL subtype include Wnt, TGF-β, MAPK, PI3K and PDGF signaling.12, 29 Accordingly, the ability of 1a to inhibit multiple known oncogenic driver pathways as a mechanism of the selective sensitivity of MSL subtype cells was evaluated. MDA-MB-231 cells were serum-starved to maximize detection of growth factor-stimulated signaling pathways, treated with the LC50 concentration of 1a and the effects of serum-stimulation on these pathways evaluated at multiple times, from 15 min to 2 h to identify potential early, initiating effects of the compound on these signaling pathways (Figure S54, Supporting Information). The results suggest that 1a does not directly target the key driver pathways that have been associated with the MSL TNBC subtype.
The ability of some polyacetylenes to act as partial PPARγ agonists has been reported.30,31 Therefore, we evaluated whether the selective cytotoxic activities of 1a could be mediated by their effects on PPARγ. The effects of the PPARγ agonist, rosiglitazone, were compared to 1a in MDA-MB-231 and MDA-MB-453 cells (Figure S55, Supporting Information). The results showed that rosiglitazone is not cytotoxic to either cell line at concentrations up to 3 μM. Similar results were obtained with the PPARγ antagonist GW9662 (Figure S55, Supporting Information). Furthermore, preincubation of MDA-MB-231 and MDA-MB-453 cells with GW9662, a PPARγ antagonist, had no effects on the concentration response curve of 1a in either cell line (Figure S55, Supporting Information). These data suggest that the selective cytotoxic effects of 1a in the MSL subtype cells are not due to effects on PPARγ.
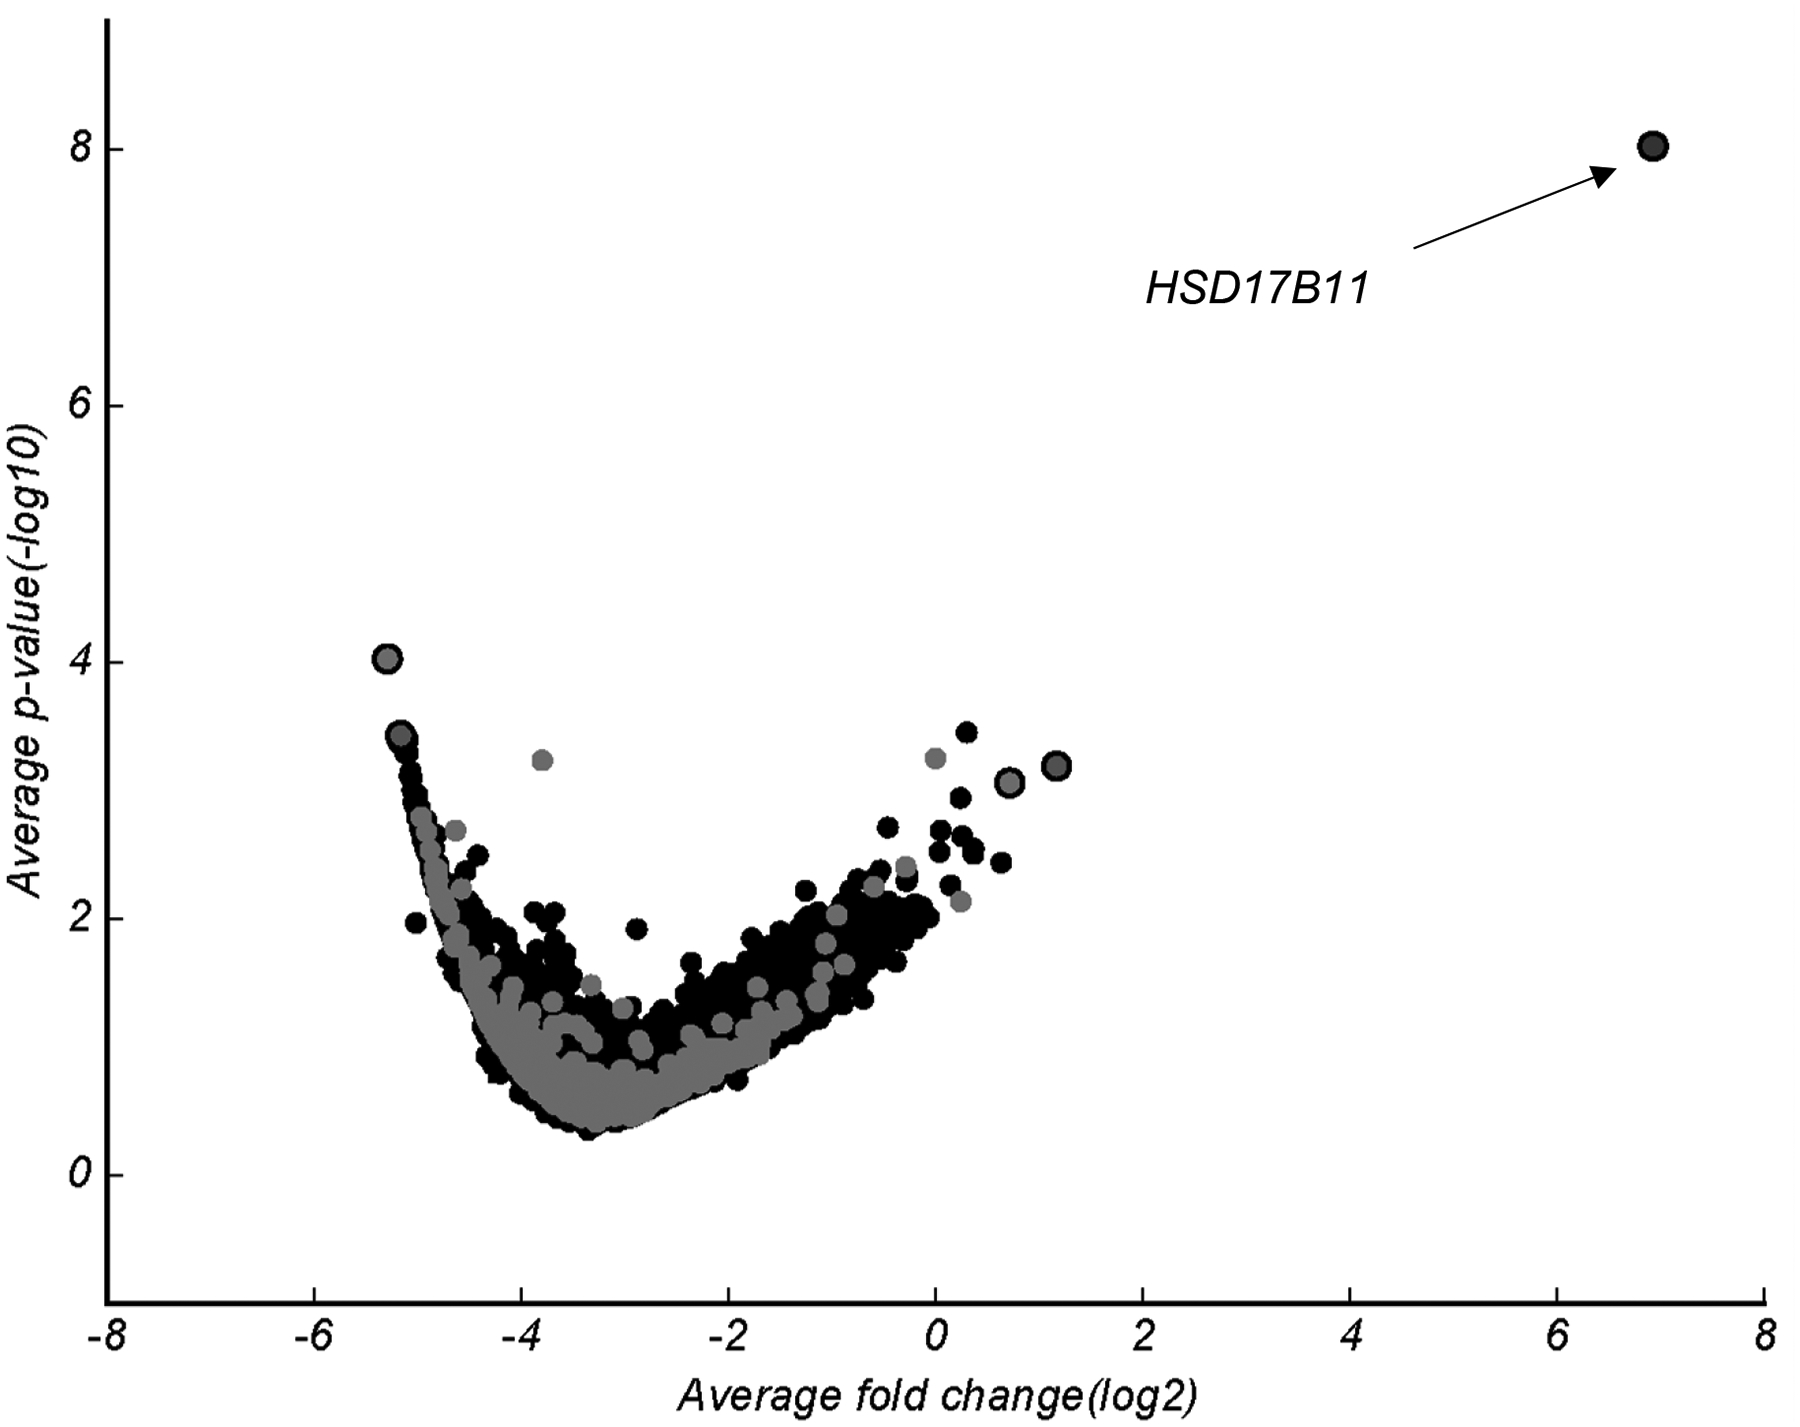
Without a priori knowledge of the potential targets of 1a that are causing the selective cytotoxic effects observed in MSL cell lines, a CRISPR-Cas9-mediated, genome-wide knockout screen was employed to identify potential pathways critical for its cytotoxic effects. This pooled genetic approach has the advantage of identifying gene products that, when disrupted, alter the sensitivity of cells to a cytotoxic compound. While this approach does not guarantee the identification of the direct cellular target of a cytotoxic compound, it offers insight into critical mediators of sensitivity and their corresponding chemical manipulators that could be used to dictate cellular biomarkers of response. Using the Brunello pooled guide RNA (sgRNA) library,32 we disrupted, on average, one gene product per cell in Cas9-expressing MDA-MB-231 cells, followed by treatment with 300 nM of 1a, a concentration that is selectively cytotoxic to MDA-MB-231 cells, but not to cells representing other TNBC subtypes. The survival and outgrowth of MDA-MB-231 cells within this population in the face of long-term treatment with 1a would indicate that they contained a sgRNA targeted to a gene involved in promoting the selective cytotoxic effects of 1a, which could be determined through sequencing of the surviving clones.32, 33 The sgRNA hits identified from MDA-MB-231 cells that were resistant to 1a in this screen were identified by algorithmic analysis of three variables between the 1a-resistant population and the original sgRNA library that was transduced: the number of enriched sgRNA per gene (maximum 4–6), the fold-increase in abundance of those sgRNAs, and the statistical significance of those changes (Figure 6) as compared to vehicle-treated cells (Supporting Information, Figure S56). The top sgRNA hit in 1a-resistant cells was HSD17B11, which encodes the protein 17β-hydroxysteroid dehydrogenase type 11. This enrichment, represented by four distinct sgRNAs to the gene product, was associated with an average fold change (log2) of 6.9 (p = 5.5×10⁻⁹) relative to cells receiving no drug treatment, suggesting that CRISPR-mediated disruption of this gene decreased the sensitivity of MDA-MB-231 cells to 1a. These results were confirmed by evaluating the potency of 1a in MDA-MB-231 cells subjected to siRNA-mediated knockdown of HSD17B11 (Figure 7a, Figure 57, Supporting Information). An siRNA-mediated reduction in 17β-hydroxysteroid dehydrogenase type 11 caused a statistically significant increase in the viability of cells treated with 300 nM 1a (Figure 7b) and resulted in a 1.7-fold increase in the TGI concentration of 1a (Figure S57, Supporting Information), thus validating the role of 17β-hydroxysteroid dehydrogenase type 11 in mediating the cytotoxicity of 1a in MDA-MB-231 cells.
Figure 6.
CRISPR-Cas9 screen identified potential mediators of 1a selectivity. Volcano plot of sgRNA abundance and significance as compared to input sgRNA. Cas9-inducible MDA-MB-231 cells were treated for 2 weeks with 1 μM 1a and allowed to recover for 2 days prior to collection. Volcano plot for cells treated with DMSO (vehicle) control in Figure S56 (Supporting Information).
Figure 7.

A reduction of 17β-hydroxysteroid dehydrogenase type 11 protein decreases the efficacy of 1a. (a) Representative immunoblot of 17β-hydroxysteroid dehydrogenase type 11 in MDA-MB-231 cells following 48 h mock or HSD17B11 knockdown (n = 3, replicate immunoblots in Figure S57 (Supporting Information). (b) The percent cell viability of mock and HSD17B11 knockdown MDA-MB-231 cells treated with 300 nM of 1a for 48 h. n = 3; means ± SEM. *p = 0.03, paired two-tailed t-test.
To further correlate the expression of 17β-hydroxysteroid dehydrogenase type 11 with sensitivity to 1a, a TNBC cell line panel was probed for mRNA expression of HSD17B11, as well as protein levels (Figures 8a, b). Intriguingly, the level of HSD17B11 expression was 167-fold higher in the 1a sensitive MDA-MB-231 cells as compared with the most resistant MDA-MB-453 cells. Protein levels of 17β-hydroxysteroid dehydrogenase type 11 were also assessed in this cell line panel and the protein was only consistently detectable in MDA-MB-231 cells (Figure 8b and Figure S58, Supporting Information). These data suggest that other cell lines in this panel are relatively resistant to 1 and 1a because they express lower levels of 17β-hydroxysteroid dehydrogenase type 11 as compared to MDA-MB-231 cells.
Figure 8.

MDA-MB-231 cells express high levels of HSD17B11 mRNA and 17β-hydroxysteroid dehydrogenase type 11. (a) The fold difference of HSD17B11 mRNA in MDA-MB-157 (MSL), BT-549 (M), HCC1806 (BL2), MDA-MB-468 (BL1), and MDA-MB-453 (LAR) TNBC cells normalized to MDA-MB-231 cells. n = 3 – 4, means ± SEM. Significance determined by one-way ANOVA (p = 0.0007, Dunnett’s multiple comparisons test, ** p < 0.01, *** p < 0.005). Raw Ct values are presented in Table S1 (Supporting Information) (b) Representative immunoblot of 17β-hydroxysteroid dehydrogenase type 11 protein in whole cell lysates from TNBC cells. n = 3; additional replicates in Figure S58 (Supporting Information)
To further understand the role of 17β-hydroxysteroid dehydrogenase type 11 in the sensitivity of TNBC cells to 1a, the more resistant BT-549 cells were transfected with a plasmid expressing HSD17B11-GFP under a constitutive CMV promoter. Western blotting showed that the protein levels of 17β-hydroxysteroid dehydrogenase type 11 were significantly higher than in mock-transfected cells (Figure S59, Supporting Information), but this did not increase the sensitivity of BT-549 cells to 1a and instead they became slightly more resistant (Figure S59, Supporting Information). Together these data demonstrate that while HSD17B11 is a mediator of the sensitivity of MDA-MB-231 cells to 1a, its expression is not sufficient to confer sensitivity to BT-549 cells, suggesting that the mechanism of sensitivity to 1a is not due solely to levels of 17β-hydroxysteroid dehydrogenase type 11 and that other factors are involved.
Given our identification of HSD17B11 expression as a mediator of sensitivity to 1a in MDA-MB-231 cells, we further interrogated the dependency of TNBC cells on this gene product using the Project Achilles cancer dependency database. The MDA-MB-231 cell line was found to be the most dependent on this gene product out of the breast cancer cell lines we evaluated (Figure S60c, Supporting Information), suggesting that other cell lines dependent on this gene might also be sensitive to 1a.34, 35 Intriguingly, two of the four cell lines with the greatest dependency for HSD17B11 (out of 769 total cell lines evaluated) were the Ewing sarcoma cell lines RD-ES and TC-32 (Figure S60c, Supporting Information). Two other Ewing sarcoma cell lines, A-673 and SK-ES-1, also have a high dependency on HSD17B11 (Figure S60c, Supporting Information) prompting us to evaluate the sensitivity of these four cell lines to 1a. Indeed, three of these four Ewing sarcoma cell lines were even more sensitive to the antiproliferative effects of 1a than MDA-MB-231 cells (Supporting Information, Figure S60a,b). Taken together, the data from the CRISPR screen and the cancer dependency database demonstrate that HSD17B11 can contribute to a sensitivity to the cytotoxic effects of 1a and may be related to a dependence on HSD17B11 expression, but exactly how this occurs will require further investigation.
CONCLUSIONS
New targeted therapies are needed to improve the survival of TNBC patients. There is no expectation that a single targeted therapy will be broadly applicable for all TNBCs because they are highly heterogeneous tumors without common driver pathways. The molecular liabilities of subgroups of TNBC need to be identified to discover new therapeutic targets. We used a reverse pharmacological approach and identified a group of polyacetylenes from D. guatemalense, T. arvensis, and H. annuus that are more potent in cell lines representing the MSL subtype of TNBC than other subtypes. Work by others previously identified related polyacetylene metabolites as cytotoxins with less potent activity against leukemia, lung, and melanoma cancer cells.22, 36–38 Multiple polyacetylenes have been shown to have partial PPARγ agonist activities,30, 31 but beyond this, few other mechanisms have been fully elucidated, though 8 and stipudiol were shown to bind and inhibit ALDH2,39 and panaxynol inhibited Hsp90 by binding to the ATP-binding pocket.38 To determine the mechanism of MSL-selective cytotoxicity of the lead compound and uncover a molecular liability of this TNBC subtype, a CRISPR-Cas9-mediated, genome-wide knockout genetic screen was undertaken that identified 17β-hydroxysteroid dehydrogenase type 11 as a mediator of sensitivity of MSL cells to 1a. Moreover, subsequent mining of the Achilles Cancer Dependency Database for other cancer cell lines that are dependent on this gene product correctly predicted Ewing sarcoma cells as another cell type that are exquisitely sensitive to 1a. Together, this work demonstrates the utility of CRISPR genome-wide screens for identifying the mechanisms of sensitivity to a compound, which has been a major limitation in the field of natural product drug discovery.
EXPERIMENTAL SECTION
General Experimental Procedures.
Optical rotation data were measured on a Rudolph Research AUTOPOL® III automatic polarimeter. NMR data were collected on Varian 400 and 500 MHz NMR spectrometers. LC-MS data were obtained on a Shimadzu LC-MS 2020 system (ESI quadrupole) coupled to a photodiode array detector, with a Phenomenex Kintex 2.6 μm C18 column (100 Å, 75 × 3.0 mm, 0.4 mL/min). The preparative HPLC system utilized SCL-10A VP pumps and system controller with a Phenomenex Gemini 5 μm C18 column (110 Å, 250 × 21.2 mm, 10 mL/min). Analytical and semi-preparative HPLC were performed using Waters 1525 binary pumps with Waters 2998 photodiode array detector and Phenomenex Gemini 5 μm C18 and Kinetex 5 μm biphenyl (250 × 4.6 mm, 1 mL/min and 250 × 10 mm, 4 mL/min) columns. Accurate mass data were collected on an Agilent 6538 HRESI QTOF MS coupled to an Agilent 1290 HPLC and a Waters SYNAPT G2-Si mass spectrometer. Chiral analyses were performed using Waters 1525 binary pumps with Waters 2998 photodiode array detector coupled with Phenomenex Lux 5 μm cellulose-3 and cellulose-2 columns (250 × 4.6 mm, 1 mL/min). All solvents were of ACS grade or better.
Plant Material.
An extract prepared from a mixture of the flowers, leaves and twigs of Desmanthodium guatemalense Hemsl., a flowering shrub in the Asteraceae, was provided by the Natural Products Branch, Division of Cancer Treatment and Diagnosis of the National Cancer Institute (USA) (NCI number N079713). The source material was collected by Dr. Juan Castillo on September 10, 1993; 8 km from San Miguel Due in Guatemala under contract to the National Cancer Institute. Voucher specimens for this collection are housed in the Smithsonian Institution (USA) (Voucher #0CKE-1937). Torilis arvensis (Huds.) Link is known commonly as spreading hedge parsley, is an invasive plant in the Apiaceae. The fresh root material used in this study was collected roadside in Norman, OK, USA. The sunflower plant materials [Helianthus annuus L. (Asteraceae)] used in this study was grown in 2017 in Norman, OK, USA from seeds (Nature’s Own Birdfood, Performance Seed, St. Cloud, MN, USA) purchased from a local farm and garden supply store where it was being sold under the colloquial name of “black oil” bird seed. Subsequent discussions with a Performance Seed representative determined that the material used in our study represented a mixture of seeds obtained from farms located throughout the United States upper Midwest region in which as many as 64 different hybrid H. annuus cultivars were being grown during the 2016 seed-production season. Voucher specimens of Torilis arvensis (authenticated by A. Moore, University of Oklahoma Herbarium Director) and sunflower seeds were deposited in the Cichewicz laboratory herbarium.
Extraction and Isolation.
The D. guatemalense extract (3.0 g) was fractionated over HP20ss using a step gradient elution process involving MeOH-H2O (30:70, 50:50, 70:30, 90:10, 100:0) and CH2Cl2-MeOH (50:50). The fourth fraction (MeOH-H2O 90:10) retained bioactivity and it was subjected to C18 preparative HPLC (gradient elution with MeOH-H2O from 50:50 to 100% organic over 30 min). The active fractions were further processed by semi-preparative HPLC (biphenyl column) using isocratic CH3CN-H2O (55:45 and 60:40) to afford 1 (6.5 mg), 2 (3.5 mg), 3 (2.5 mg), 4 (1.5 mg), 5 (0.8 mg), and 6 (1.0 mg).
The roots of Torilis arvensis were subjected to MeOH extraction, which upon evaporation of the solvent afforded 4 g of organic residue. The extract was subjected to HP20ss column chromatography with step-gradient elution using MeOH-H2O (30:70, 50:50, 70:30, 90:10, 100:0) and CH2Cl2-MeOH (50:50). LC-ESIMS analysis of the resulting samples revealed that the fourth fraction (MeOH-H2O 90:10) contained compounds that were likely to be structurally analogous to compounds 1–6. That fraction was subjected to LC-ESIMS-guided purification using C18 preparative HPLC (gradient elution with MeOH-H2O from 30:70 to 100:0 over 30 min) followed by semi-preparative HPLC (biphenyl column) using isocratic conditions (CH3CN-H2O, 60:40) to yield 7 (11.6 mg) and 8 (1.5 mg).
The roots and first ~10–15 cm of above-ground stem material from the sunflowers were extracted using ethanol, which upon evaporation yielded 18.0 g of extract. The extract was subjected to HP20ss column chromatography with step-gradient elution using MeOH-H2O (30:70, 50:50, 70:30, 90:10, 100:0) and CH2Cl2-MeOH (50:50). LC-ESIMS analysis of the resulting samples revealed that the fourth fraction (MeOH-H2O 90:10) contained compounds that were likely to be the same or structurally analogous to compounds 1–6. That fraction was subjected to LC-ESIMS-guided purification using C18 preparative HPLC (gradient elution with MeOH-H2O from 30:70 to 100:0 over 30 min) followed by semi-preparative HPLC (biphenyl column) using isocratic conditions (CH3CN-H2O, 60:40) to yield 1a (60 mg), 9 (7.0 mg), 10 (4.4 mg), 11 (17.7 mg), and 12 (5.4 mg).
Dehydrofalcarinol (1): colorless oil; [α]20D +38 (c 0.44, MeOH); 1H and 13C NMR, see Tables 1 and 2; HRESIMS [M+Na]+ m/z 265.1567 (calcd for C17H22ONa, 265.1563).
Cofalcarinol A (2): colorless oil; [α]20D +42 (c 0.19, MeOH); 1H and 13C NMR, see Tables 1 and 2; HRESIMS [M+Na]+ m/z 251.1410 (calcd for C16H20ONa, 251.1406).
Dendroarboreol B (3): colorless oil; [α]20D +24 (c 0.13, MeOH); 1H and 13C NMR, see Tables 1 and 2; HRESIMS [M+Na]+ m/z 281.1517 (calcd for C17H22O2Na, 281.1512).
Cofalcarinol B (4): colorless oil; [α]20D +19 (c 0.08, MeOH); 1H and 13C NMR, see Tables 1 and 2; HRESIMS [M+Na]+ m/z 267.1352 (calcd for C16H20O2Na, 267.1356).
1,2-Dihydrodendroarboreol B (5): colorless oil; [α]20D −25 (c 0.04, MeOH); 1H and 13C NMR, see Tables 1 and 2; HRESIMS [M+Na]+ m/z 283.1669 (calcd for C17H24O2Na, 283.1669).
Cofalcarinol C (6): colorless oil; [α]20D −20 (c 0.05, MeOH); 1H and 13C NMR, see Tables 1 and 2; HRESIMS [M+Na]+ m/z 269.1516 (calcd for C16H22O2Na, 269.1512).
Cofalcarinol D (12): colorless oil; [α]20D +7.4 (c 0.27, MeOH); 1H and 13C NMR, see Tables 1 and 2. HRESIMS [M+H]+ m/z 215.1428 (calcd for C15H19O, 215.1430).
MTPA (Mosher) Esters of Compounds 1–6, 9, and 12.
Duplicate samples of compounds 1–6 (0.2 mg each), 9 (0.5 mg), and 12 (0.5 mg) were transferred into NMR tubes and the solvent was evaporated under a stream of N2. The samples were individually treated with R and S forms of α-methoxy-α- (trifluoromethyl)-phenylacetic acid chloride (MTPA-Cl, 2 μL) and 0.5 mL pyridine-d5. The mixtures were reacted at room temperature for 4 h at which time the reaction progress was checked by 1H NMR spectroscopy and determined to have reached completion. The (S)-ester [from (R)-MTPA-Cl] and (R)-ester [from (S)-MTPA-Cl] products were analyzed on a 500 MHz NMR instrument to obtain 1H NMR data. The differences in the chemical shifts of the products were determined using the formula Δδ = δS − δR. The resulting chemical shift data for the Mosher ester derivatizes are summarized in Table 3.
Cell Culture.
The MDA-MB-231, MDA-MB-157, HCC1806, MDA-MB-468, MDA-MB-453, A-673, SK-ES-1, and RD-ES cell lines were purchased from the American Type Culture Collection (Manassas, VA, USA). BT-549 cells were obtained from the Lombardi Cancer Center of Georgetown University (Washington, DC, USA). TC-32 cells from the Children’s Oncology Group were obtained from Dr. Alexander Bishop, Greehey Children’s Cancer Research Institute, University of Texas Health Science Center at San Antonio. Cell line identities, except for the TC-32 and SK-ES-1cell lines, were confirmed by DNA short tandem repeat analyses (Genetica DNA Laboratories, Burlington, NC, USA). MDA-MB-157, BT-549, HCC1806, MDA-MB-468, TC-32, and RD-ES cells were grown in RPMI-1640 medium supplemented with 10% FBS and 50 μg/mL gentamicin. A-673 cells were grown in RPMI-1640 medium supplemented with 5% FBS and 50 μg/mL gentamicin. MDA-MB-231 and MDA-MB-453 cells were grown in IMEM supplemented with 10% FBS and 25 μg/mL gentamicin. SK-ES-1 cells were grown in McCoy’s 5A medium with 10% FBS and 50 μg/mL gentamicin. All cells were maintained in a humidified environment at 37 °C with 5% CO2.
Sulforhodamine B Assay.
The antiproliferative and cytotoxic effects of the compounds were measured using the sulforhodamine B (SRB) assay, as previously described.40–42 Concentration-response curves were generated using GraphPad Prism (GraphPad Software, Inc., La Jolla, CA, USA). The concentrations that caused 50% growth inhibition (GI50), total growth inhibition (TGI), and 50% cell death [i.e. cytotoxicity (LC50)] were determined from the concentration-response curves. The selectivity indices were calculated by dividing the LC50 values obtained for the specified TNBC cells by the LC50 obtained for MDA-MB-231 cells.
Genome-wide Knockout Screen.
MDA-MB-231 cells with doxycycline-inducible Cas9 (MDA-MB-231-Cas9) were developed and provided by Dr. Ratna Vadlamudi (University of Texas Health Science Center at San Antonio) and grown in RPMI-1640 supplemented with 10% FBS and 50 μg/mL gentamycin. MDA-MB-231-Cas9 cells were transduced with viral particles from the pooled Brunello32 guide RNA (sgRNA) library (lentiGuide, Broad Institute, Cambridge, MA, USA) by incubating cells with 0.005 μg/mL polybrene (Santa Cruz Biotechnology, Dallas TX, USA), and 0.4% (v/v) viral particles. Cells were incubated for 5 h, the medium removed, and replaced with fresh medium. After a 48 h transduction, the cell medium was supplemented with 1 μg/mL puromycin (Invitrogen, San Diego, CA, USA) and incubated for an additional 72 h. At this point, infection efficiency was confirmed using the sulforhodamine B assay by comparing cell survival of transfected cells treated with puromycin to untreated transfected cells. Puromycin was removed, and cells grown for another 48 h in medium supplemented with 50 ng/mL doxycycline (Cayman Chemical, Ann Arbor, MI, USA). Cas9 expression was confirmed by immunoblot analysis. Cells were treated with 1 μM 1a for 14 days. The medium was changed every 3–4 days, fresh 1a added, then the cells were allowed to recover for 2 days without 1a before collection for DNA analysis. DNA was isolated using Blood & Cell Culture DNA Mini Kit (Qiagen, Germantown, MD, USA). The Genetic Perturbation Platform, a shared resource of the Broad Institute, performed PCR to amplify the sgRNA library, followed by Illumina sequencing and bioinformatics analysis to quantify relative abundance.32
siRNA Mediated Knockdown.
The top hit from the genome-wide knockout screen, HSD17B11 was confirmed to confer sensitivity of cells to 1a using siRNA mediated knockdown. Briefly, lipofectamine RNAi-MAX (Thermo Fisher Scientific) and siRNA targeting HSD17B11 (SASI_Hs01_00087350 and SASI_Hs01_00087352) (Sigma-Aldrich) together in Opti-MEM (Thermo Fisher Scientific) were added dropwise to cells in antibiotic-free medium to a final concentration of 0.025% lipofectamine RNAi-MAX and 12.5 nM siRNA. Cells were incubated for 48 h at which time they were either plated for an SRB assay or lysed for immunoblot analysis to confirm knockdown. For the SRB assay, cells were plated and allowed to attach for 4–6 h and then they were treated with 1a for 48 h.
Immunoblotting.
Cells were lysed with Cell Extraction Buffer (Invitrogen, Waltham, MA, USA) supplemented with Protease Inhibitor Cocktail (MilliporeSigma, Swedesboro, NJ, USA) and equal amounts of protein were separated by SDS-PAGE through Bolt™ Bis-Tris Plus Gels (Invitrogen). Proteins were transferred to Immobilon-FL PVDF (MilliporeSigma) and blocked with Odyssey Blocking Buffer (LI-COR Biosciences, Lincoln, NE, USA) before probing with the following primary antibodies: GAPDH (#97166), Cell Signaling Technologies, Danvers, MA, USA), Cas9 (#14697), Cell Signaling Technologies), or Hsd17b11 (#ab136109), Abcam in Odyssey Blocking Buffer with 1% TBST. Secondary antibody incubation was with IRDye 680 or IRDye 800 against the appropriate species at 1:20,000 prepared in Odyssey Blocking Buffer with 1% TBST and 0.01% SDS (LI-COR Bioscience). Fluorescent signals were visualized with the Odyssey FC and quantified using Image Studio (LI-COR Biosciences).
RNA Isolation, cDNA Preparation, and qRT-PCR Analysis.
RNA was isolated and concentration and purity assessed using a Cytation 5 (BioTek, Winooski, VT, USA). iScript Reverse Transcription Supermix (Bio-Rad, Hercules, CA, USA) was used to make cDNA, and iTaq Universal SYBR Green Supermix (Bio-Rad) used to complete qRT-PCR on a Bio-Rad CFX instrument (Bio-Rad). Primer pair sequences were used as follows: ACTB: (forward) 5′-CATGTACGTTGCTATCCAGGC-3′, (reverse) 5′-CTCCTTAATGTCACGCACGAT-3′ and HSD17B11: (forward) 5′-CCTGCTTCTCCCGTTACTGAT-3′, (reverse) 5′-GATTTCGCCGGTGACTGATTT-3′. HSD17B11 expression analyzed as fold difference compared to the expression in MDA-MB-231 cells by the formula 2−ΔΔCt where ΔΔCt = (CtHSD17B11 − CtACTB) test cell line − (CtHSD17B11 − CtACTB) MDA-MB-231.
Statistical Analysis.
Analysis of cell viability and total growth inhibitory concentration of 1a in HSD17B11 knock-down MDA-MB-231 cells versus mock transfected MDA-MB-231 cells was completed using a paired, two-tailed t-test. Analysis of HSD17B11 mRNA expression in TNBC cell lines as compared to MDA-MB-231 TNBC cell lines was completed using a one-way ANOVA followed by Dunnett’s post-hoc multiple comparisons test. All analyses were completed in GraphPad Prism.
Supplementary Material
ACKNOWLEDGMENTS
Funding for this work was provided by a grant to SLM and RHC from the National Cancer Institute (U01CA182740). The LC-MS instrument used for these studies was provided in part by a Challenge Grant from the Office of the Vice President for Research, University of Oklahoma, Norman Campus and an award through the Shimadzu Equipment Grant Program (R.H.C.). We thank J. B. King for planting and growing the sunflowers in his backyard.
Footnotes
The authors declare no competing financial interest.
REFERENCES
- (1).Siegel RL; Miller KD; Jemal A Ca-Cancer J. Clin 2020, 70, 7–30. [DOI] [PubMed] [Google Scholar]
- (2).Davies C; Godwin J; Gray R; Clarke M; Cutter D; Darby S; McGale P; Pan HC; Taylor C; Wang YC; Dowsett M; Ingle J; Peto R Lancet 2011, 378, 771–784. [DOI] [PMC free article] [PubMed] [Google Scholar]
- (3).Davies C; Pan H; Godwin J; Gray R; Arriagada R; Raina V; Abraham M; Medeiros Alencar VH; Badran A; Bonfill X; Bradbury J; Clarke M; Collins R; Davis SR; Delmestri A; Forbes JF; Haddad P; Hou MF; Inbar M; Khaled H; Kielanowska J; Kwan WH; Mathew BS; Mittra I; Müller B; Nicolucci A; Peralta O; Pernas F; Petruzelka L; Pienkowski T; Radhika R; Rajan B; Rubach MT; Tort S; Urrútia G; Valentini M; Wang Y; Peto R Lancet 2013, 381, 805–816. [DOI] [PMC free article] [PubMed] [Google Scholar]
- (4).Cuzick J; Sestak I; Baum M; Buzdar A; Howell A; Dowsett M; Forbes JF; investigators AL Lancet Oncol 2010, 11, 1135–1141. [DOI] [PubMed] [Google Scholar]
- (5).Early Breast Cancer Trialists’ Collaborative Group. Lancet 2015, 386, 1341–1352. [DOI] [PubMed] [Google Scholar]
- (6).Romond EH; Perez EA; Bryant J; Suman VJ; Geyer CE; Davidson NE; Tan-Chiu E; Martino S; Paik S; Kaufman PA; Swain SM; Pisansky TM; Fehrenbacher L; Kutteh LA; Vogel VG; Visscher DW; Yothers G; Jenkins RB; Brown AM; Dakhil SR; Mamounas EP; Lingle WL; Klein PM; Ingle JN; Wolmark NN Engl. J. Med 2005, 353, 1673–1684. [DOI] [PubMed] [Google Scholar]
- (7).Kohler BA; Sherman RL; Howlader N; Jemal A; Ryerson AB; Henry KA; Boscoe FP; Cronin KA; Lake A; Noone AM; Henley SJ; Eheman CR; Anderson RN; Penberthy LJ Natl. Cancer Inst 2015, 107, djv048. [DOI] [PMC free article] [PubMed] [Google Scholar]
- (8).Liedtke C; Mazouni C; Hess KR; André F; Tordai A; Mejia JA; Symmans WF; Gonzalez-Angulo AM; Hennessy B; Green M; Cristofanilli M; Hortobagyi GN; Pusztai LJ Clin. Oncol 2008, 26, 1275–1281. [DOI] [PubMed] [Google Scholar]
- (9).Esserman LJ; Berry DA; DeMichele A; Carey L; Davis SE; Buxton M; Hudis C; Gray JW; Perou C; Yau C; Livasy C; Krontiras H; Montgomery L; Tripathy D; Lehman C; Liu MC; Olopade OI; Rugo HS; Carpenter JT; Dressler L; Chhieng D; Singh B; Mies C; Rabban J; Chen YY; Giri D; van ‘t Veer L; Hylton NJ Clin. Oncol 2012, 30, 3242–3249. [DOI] [PMC free article] [PubMed] [Google Scholar]
- (10).Masuda H; Baggerly KA; Wang Y; Zhang Y; Gonzalez-Angulo AM; Meric-Bernstam F; Valero V; Lehmann BD; Pietenpol JA; Hortobagyi GN; Symmans WF; Ueno NT Clin. Cancer Res 2013, 19, 5533–5540. [DOI] [PMC free article] [PubMed] [Google Scholar]
- (11).Bianchini G; Balko JM; Mayer IA; Sanders ME; Gianni L Nat. Rev. Clin. Oncol 2016, 13, 674–690. [DOI] [PMC free article] [PubMed] [Google Scholar]
- (12).Lehmann BD; Bauer JA; Chen X; Sanders ME; Chakravarthy AB; Shyr Y; Pietenpol JA J. Clin. Invest 2011, 121, 2750–2767. [DOI] [PMC free article] [PubMed] [Google Scholar]
- (13).Burstein MD; Tsimelzon A; Poage GM; Covington KR; Contreras A; Fuqua SA; Savage MI; Osborne CK; Hilsenbeck SG; Chang JC; Mills GB; Lau CC; Brown PH Clin. Cancer Res 2015, 21, 1688–1698. [DOI] [PMC free article] [PubMed] [Google Scholar]
- (14).Jiang YZ; Ma D; Suo C; Shi J; Xue M; Hu X; Xiao Y; Yu KD; Liu YR; Yu Y; Zheng Y; Li X; Zhang C; Hu P; Zhang J; Hua Q; Zhang J; Hou W; Ren L; Bao D; Li B; Yang J; Yao L; Zuo WJ; Zhao S; Gong Y; Ren YX; Zhao YX; Yang YS; Niu Z; Cao ZG; Stover DG; Verschraegen C; Kaklamani V; Daemen A; Benson JR; Takabe K; Bai F; Li DQ; Wang P; Shi L; Huang W; Shao ZM Cancer Cell 2019, 35, 428–440. [DOI] [PubMed] [Google Scholar]
- (15).Robles AJ; Cai S; Cichewicz RH; Mooberry SL Breast Cancer Res. Treat 2016, 157, 475–488. [DOI] [PMC free article] [PubMed] [Google Scholar]
- (16).Robles AJ; McCowen S; Cai S; Glassman M; Ruiz F; Cichewicz RH; McHardy SF; Mooberry SL J. Med. Chem 2017, 60, 9275–9289. [DOI] [PMC free article] [PubMed] [Google Scholar]
- (17).Kil Y-S; Risinger AL; Petersen CL; Mooberry SL; Cichewicz RH, J. Nat. Prod 2020, 83, 584–592. [DOI] [PMC free article] [PubMed] [Google Scholar]
- (18).Robles AJ; Du L; Cichewicz RH; Mooberry SL J. Nat. Prod 2016, 79, 1822–1827. [DOI] [PMC free article] [PubMed] [Google Scholar]
- (19).Fruman DA; Chiu H; Hopkins BD; Bagrodia S; Cantley LC; Abraham RT Cell 2017, 170, 605–635. [DOI] [PMC free article] [PubMed] [Google Scholar]
- (20).Grant CV; Carver CM; Hastings SD; Ramachandran K; Muniswamy M; Risinger AL; Beutler JA; Mooberry SL Breast Cancer Res. Treat 2019, 177, 345–355. [DOI] [PMC free article] [PubMed] [Google Scholar]
- (21).Harada R; Iwasaki M Phytochemistry 1982, 21, 2009–2011. [Google Scholar]
- (22).Bernart MW; Cardellina JH; Balaschak MS; Alexander MR; Shoemaker RH; Boyd MR J. Nat. Prod 1996, 59, 748–753. [DOI] [PubMed] [Google Scholar]
- (23).Chen W-H; Ma X-M; Wu Q-X; Shi Y-P Can. J. Chem 2008, 86, 892–898. [Google Scholar]
- (24).Lechner D; Stavri M; Oluwatuyi M; Pereda-Miranda R; Gibbons S Phytochemistry 2004, 65, 331–335. [DOI] [PubMed] [Google Scholar]
- (25).Mayer SF; Steinreiber A; Orru RVA; Faber KJ Org. Chem 2002, 67, 9115–9121. [DOI] [PubMed] [Google Scholar]
- (26).Negri R Fitoterapia 2015, 106, 92–109. [DOI] [PubMed] [Google Scholar]
- (27).Bohlmann F; Zdero C Chem. Ber 1969, 102, 1691–1697. [Google Scholar]
- (28).Shigemori H; Seshimoto F; Hong SW; Nakajyo H Heterocycles 2011, 83, 1067–1076. [Google Scholar]
- (29).Abramson VG; Lehmann BD; Ballinger TJ; Pietenpol JA Cancer 2015, 121, 8–16. [DOI] [PMC free article] [PubMed] [Google Scholar]
- (30).Atanasov AG; Blunder M; Fakhrudin N; Liu X; Noha SM; Malainer C; Kramer MP; Cocic A; Kunert O; Schinkovitz A; Heiss EH; Schuster D; Dirsch VM; Bauer R PLoS One 2013, 8, e61755. [DOI] [PMC free article] [PubMed] [Google Scholar]
- (31).Resetar M; Liu X; Herdlinger S; Kunert O; Pferschy-Wenzig EM; Latkolik S; Steinacher T; Schuster D; Bauer R; Dirsch VM J. Nat. Prod 2020, 83, 918–926. [DOI] [PMC free article] [PubMed] [Google Scholar]
- (32).Doench JG; Fusi N; Sullender M; Hegde M; Vaimberg EW; Donovan KF; Smith I; Tothova Z; Wilen C; Orchard R; Virgin HW; Listgarten J; Root DE Nat. Biotechnol 2016, 34, 184–191. [DOI] [PMC free article] [PubMed] [Google Scholar]
- (33).Jost M; Weissman JS ACS Chem. Biol 2018, 13, 366–375. [DOI] [PMC free article] [PubMed] [Google Scholar]
- (34).Tsherniak A; Vazquez F; Montgomery PG; Weir BA; Kryukov G; Cowley GS; Gill S; Harrington WF; Pantel S; Krill-Burger JM; Meyers RM; Ali L; Goodale A; Lee Y; Jiang G; Hsiao J; Gerath WFJ; Howell S; Merkel E; Ghandi M; Garraway LA; Root DE; Golub TR; Boehm JS; Hahn WC Cell 2017, 170, 564–576. [DOI] [PMC free article] [PubMed] [Google Scholar]
- (35).Kil YS; Risinger AL; Petersen CL; Liang H; Grkovic T; O’Keefe BR; Mooberry SL; Cichewicz RH J. Nat. Prod 2020, 83, 584–592. [DOI] [PMC free article] [PubMed] [Google Scholar]
- (36).Yan Z; Yang R; Jiang Y; Yang Z; Yang J; Zhao Q; Lu Y Molecules 2011, 16, 5561–5573. [DOI] [PMC free article] [PubMed] [Google Scholar]
- (37).Zaini RG; Brandt K; Clench MR; Le Maitre CL Anticancer Agents Med. Chem 2012, 12, 640–652. [DOI] [PubMed] [Google Scholar]
- (38).Le HT; Nguyen HT; Min HY; Hyun SY; Kwon S; Lee Y; Le THV; Lee J; Park JH; Lee HY Cancer Lett 2018, 412, 297–307. [DOI] [PubMed] [Google Scholar]
- (39).Heydenreuter W; Kunold E; Sieber SA Chem. Commun. (Camb.) 2015, 51, 15784–15787. [DOI] [PubMed] [Google Scholar]
- (40).Shaffer CV; Cai S; Peng J; Robles AJ; Hartley RM; Powell DR; Du L; Cichewicz RH; Mooberry SL J. Nat. Prod 2016, 79, 531–540. [DOI] [PMC free article] [PubMed] [Google Scholar]
- (41).Skehan P; Storeng R; Scudiero D; Monks A; McMahon J; Vistica D; Warren JT; Bokesch H; Kenney S; Boyd MR J. Natl. Cancer. Inst 1990, 82, 1107–1112. [DOI] [PubMed] [Google Scholar]
- (42).Boyd MR; Paull KD Drug Dev. Res 1995, 34, 91–109. [Google Scholar]
Associated Data
This section collects any data citations, data availability statements, or supplementary materials included in this article.