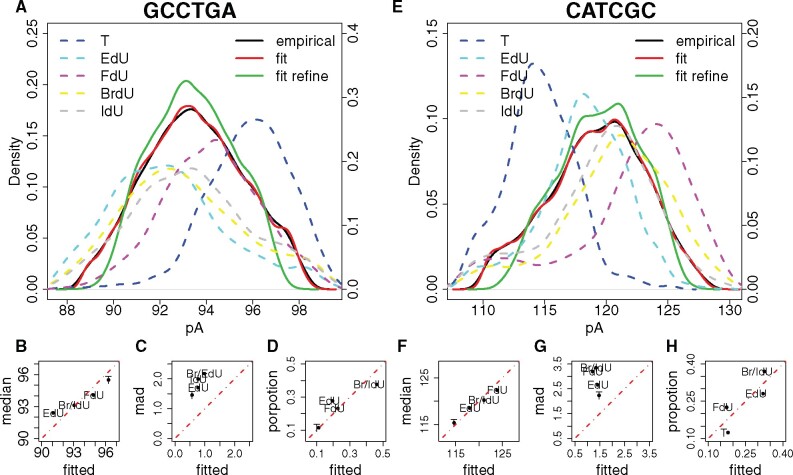
Fig. 3.
Unsupervised modification number detection. (A, E) Signal event distribution for the two modified kmers (GCCTGA and CATCGC) from the primer extension dataset (Mueller et al., 2019). Solid black curve, empirical distribution of all kmer signal events mapped to the specific position; solid red curve, fitted distribution with all Gaussian components of the mixture model; solid green curve, fitted distribution with Gaussian components that passed the mixing proportion threshold; dashed curves, empirical distribution of T (blue), EdU (cyan), FdU (purple), BrdU (yellow) and IdU (grey) kmer signal events. (B, C, D and F, G, H) Relationship between empirical and fitted kmer signal event medians values, kmer signal event MADs and mixing proportions, respectively. Red dashed line, slope equals 1

