

Abstract
Background:
Adolescent alcohol abuse remains a serious public health concern, with nearly a third of high school seniors reporting heavy drinking in the previous month.
Methods:
Using the high ethanol-consuming C57BL/6J mouse strain, we examined the effects of ethanol (3.75 g/kg, IP, daily for 45 days) on body weight and brain region mass (cerebral cortex, cerebellum, corpus callosum) during peri-adolescence (postnatal day [P]25 to 70) or adulthood (P180 to 225) of both males and females.
Results:
In control peri-adolescent animals, body weight gain was greater in males compared with females. In the peri-adolescent exposure group, ethanol significantly reduced body weight gain to a similar extent in both male and female mice (82 and 84% of controls, respectively). In adult animals, body weight gain was much less than that of the peri-adolescent mice, with ethanol having a small but significant effect in males but not females. Between the control peri-adolescent and adult cohorts (measurements taken at P70 and 225, respectively), there were no significant differences in the mass of the cerebral cortex or the cerebellum from either male or female mice, although the rostro-caudal length of the corpus callosum increased slightly but significantly (6.1%) between these time points.
Conclusions:
Ethanol treatment significantly reduced the mass of the cerebral cortex in peri-adolescent (−3.1%), but not adult, treated mice. By contrast, ethanol significantly reduced the length of the corpus callosum in adult (−5.4%), but not peri-adolescent, treated mice. Future studies at the histological level may yield additional details concerning ethanol and the peri-adolescent brain.
Keywords: Body Weight, Cerebral Cortex, Cerebellum, Chronic, Ethanol, Gender
ADOLESCENT AND YOUNG adult alcohol abuse continue to be major problems for modern society as indicated in a recent white paper from the Research Society on Alcoholism (Research Society on Alcoholism, 2009). This is supported by continued survey findings from the Monitoring the Future project (Johnston et al., 2003, 2008) as well as being highlighted in the Surgeon General’s Call to Action to Prevent and Reduce Underage Drinking (National Institute on Alcohol Abuse and Alcoholism, 2007). Youths are initiating alcohol use earlier and experiencing more alcohol-related problems than before (Miller et al., 2001; Quine and Stephenson, 1990; Winters, 2001), with a closing of the “gender gap” (Nelson et al., 1998). Approximately 80% of American high school seniors report consuming alcohol, with half of these individuals drinking alcohol before the eighth grade (Johnston et al., 1999). In addition, approximately 30% of high school seniors report binge or heavy drinking (Johnston et al., 1991, 1993), with more than 70% of college students reporting binge drinking during high school (Wechsler et al., 2000).
The prevalence of alcohol use and misuse among adolescents and young adults have brought on strong interests for experimental animal models of adolescent alcohol exposure to better understand the neurobiological mechanisms underlying adolescent alcohol abuse and its long-range consequences (Spear, 2000; Witt, 1994). Research since these seminal reviews indicates that animal models continue to provide a major tool for expanding our knowledge of peri-adolescent brain development and its associated vulnerabilities (Spear, 2004a,b, 2007; Spear and Varlinskaya, 2006; Witt, 2006). An important consideration in animal models is the more rapid pace of development and maturation compared with humans. In particular, Spear (2000) indicated that the temporal boundaries of the adolescent “window” of neurobehavioral development for rats may differ given the parameters examined. For example, neurochemical and neurobehavioral differences between postweaning and adult rats support the hypothesized adolescent developmental window of postnatal day (P) 28 to 42 (Spear, 2000, 2007; Spear and Brake, 1983). Assessing the effects of pharmacological pretreatment during adolescence on adult behaviors in rats, however, Spear (2000, 2004a, 2007) has suggested that this conservative window (P28 to 42) could be extended to P60 in order to accommodate both the earliest maturational changes in the female rat as well as the latest ones in the male rat. The present study examined the effect of chronic high dose ethanol in mice from P25 to 70 in order to evaluate the effects of ethanol exposure from the juvenile to the early adulthood.
Throughout adolescence and into early adulthood, the human brain continues to mature with prominent changes of white matter in cortical areas associated with synaptic pruning and myelination (Bava et al., 2010; Giedd, 2004, 2008). Chronic ethanol abuse/dependence leads to disruption of white matter in general (Pfefferbaum et al., 2006c), with consistent findings of disruption found in the corpus callosum (Kashem et al., 2008, 2009; Pfefferbaum and Sullivan, 2005; Pfefferbaum et al., 2006b) and frontal cortex (Harris et al., 2008; Liu et al., 2006, 2007; Mayfield et al., 2002; Sullivan, 2003). Chronic ethanol abuse induces profound degeneration in the cerebellum as well (Fitzpatrick et al., 2008; Jaatinen and Rintala, 2008; Sullivan, 2003). Peri-adolescent brain development is particularly sensitive to the deleterious effects of ethanol, with evidence indicating that ethanol-induced alterations in and/or disruptions of this development predisposes an individual to continued ethanol use and abuse as well as subsequent dependence (Clark et al., 2008; Crews et al., 2007; Spear, 2000, 2004a, 2007; Witt, 2010). Therefore, the present study examined 3 brain regions which are strongly affected by ethanol and critically dependent on white matter in function—the cerebral cortex, corpus callosum, and the cerebellum. We also monitored the body weight of mice. Using a between-subjects design, the effects of ethanol were examined during peri-adolescence (P25 to 70) versus adulthood (P180 to 225) in both female and male high alcohol-consuming C57BL/6J mice.
MATERIALS AND METHODS
We selected a younger and an older group of C57BL/6J mice (P25 and 180 at the beginning of ethanol treatment). All mice were acquired from the Jackson Laboratory (Bar Harbor, ME) and were timed to arrive at least 3 days prior to ethanol treatment. Upon arrival, all mice were housed 3 to a cage in the University of Missouri-Kansas City (UMKC) laboratory animal center and maintained on standard lab chow with a 6 AM to 6 PM light cycle. We selected 45 days for the treatment so that the P25 mice could be exposed to ethanol during the entire peri-adolescent period (P27 to 55; Odell, 1990; Spear, 2000). We selected intraperitoneal (IP) injections (carried out daily at noon) which could quickly elevate blood alcohol concentrations (BAC). Forty-five consecutive days of such IP ethanol administration, therefore, should be considered as a model for chronic heavy exposure. To gauge the severity of this chronic ethanol exposure and select a dosage for our ethanol treatment, we carried out a preliminary study to monitor the acute effects of ethanol on mice balance and movement coordination following ethanol delivery in 3 additional groups of P25 mice at 1, 2, and 3.75 g/kg (n = 3 × 6). At 3.75 g/kg, mice regained righting reflex in ~30 to 40 minutes. Within another 10 minutes, ethanol-treated mice appeared to move about in their home cage as well as their controls. A rotorod test at 1 hour postinjection, however, revealed that control mice could stay on the rod for 15.2 ± 5.84 seconds whereas ethanol-treated mice fell off within 5 seconds. Only at 120 to 150 minutes postinjection did the ethanol-treated mice perform at a level comparable to control mice. Accordingly, we selected 3.75 g/kg as the experimental dosage in the present study for the length of its effect on movement (~2 hours, roughly matching the typical bouts of acute intoxication in humans). At this dosage, BAC in our mice should reach levels between 300 and 350 mg/dl within 10 minutes and remain at or greater than 300 mg/dl for ~30 minutes and then decrease gradually (Linsenbardt et al., 2009). We avoided higher doses (e.g., 5 g/kg) for possible immediate liver pathology (Kim et al., 2009). On the 46th day, all mice were sacrificed via cervical dislocation and were immediately perfused intracardiacally with buffered formalin (4%). We coded the brains to avoid human bias and stored all 48 brains (12 P25 to 70 controls, 12 P25 to 70 ethanol mice, 12 P180 to 225 controls, 12 P180 to 225 ethanol mice, with equal number of males and females in each of the group of 12) in osmo-balanced phosphate buffer for 2 weeks. To ensure that our 3-step brain dissection protocol was carried out consistently in all 48 brains, so as to minimize the amount of experimental error in brain weight data, we relied upon clear anatomical landmarks to guide our dissection. First, the cerebellum was dissected free by cutting the cerebellar peduncles (Fig. 1). Second, to free the cerebral cortex, a cut was made from just rostral to the superior colliculi on the dorsal surface of the brainstem extending to the ventral surface of the brainstem just caudal to the pons (Fig. 1). The dissected cerebral cortex (with some midbrain tissue) and cerebellum were carefully blotted to remove extra water and weighed. The mean weight of the cerebral cortex (regardless of age, gender, or ethanol treatment, ~300 mg) was typically 6 times greater than the cerebellum (~50 mg) with the coefficient of variation or the standard deviation as a fraction of the mean at ~6% for the cerebellum and ~3% for the cerebral cortex. This variation was attributed to errors inadvertently introduced in dissection and additional measurement or weighing errors as well as intrinsic individual differences. The third and the last step of the dissection was a vertical midsagittal cut in the brain piece containing the cerebral cortex in order to expose the corpus callosum. We carried out 6 measurements on each of the mouse corpus callosum including its overall rostro-caudal length with the aid of a dissecting microscope (Fig. 2). The overall rostro-caudal length of the mouse corpus callosum (regardless of age, gender, or ethanol treatment) was ~4 mm with a standard deviation of0.11 mm (or 2.6% of the mean value). Thus the coefficient of variation for the overall rostro-caudal length of the corpus callosum was lower than but still comparable to those of brain weights (3 to 6%). This suggested that additional experimental errors introduced by our dissection may be of the order of to 3.5%—the difference between 2.6% for the overall length of the corpus callosum and 3 to 6% for the brain weights. The entire laboratory protocol was approved by the Institutional Animal Care and Use Committee at UMKC.
Fig. 1.
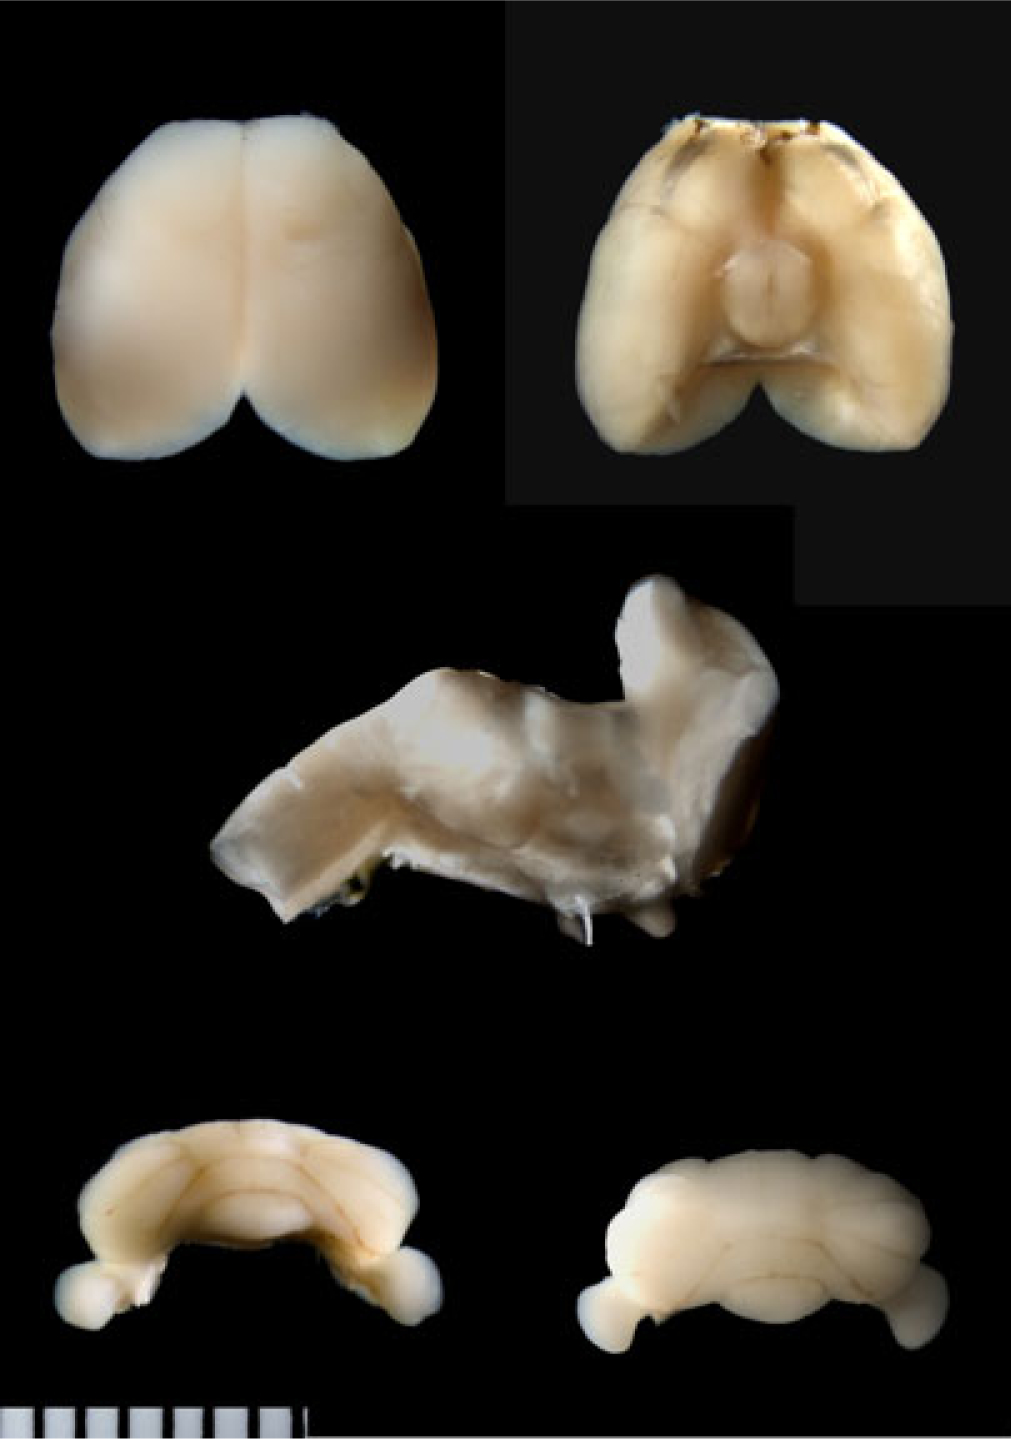
The mouse brain. The 2 top photos show dorsal and ventral views of the mouse cerebral cortex prior to the midsagittal cut to expose the corpus callosum. The olfactory appendages are cut flush at the level of the anterior end of the cerebral cortex. A cut mark (that separated the brainstem) is visible in the ventral view. The middle photo shows a sagittal view of the cut-away brainstem. Here, the rostral cut plane is visible, indicating the cerebral cortex was dissected free just rostral to the superior colliculi on the dorsal surface of the brainstem and just caudal to the pons on the ventral surface of the brainstem. The bottom photos show anterior and posterior views of the cerebellum. Each division of the marker is 0.6 mm.
Fig. 2.
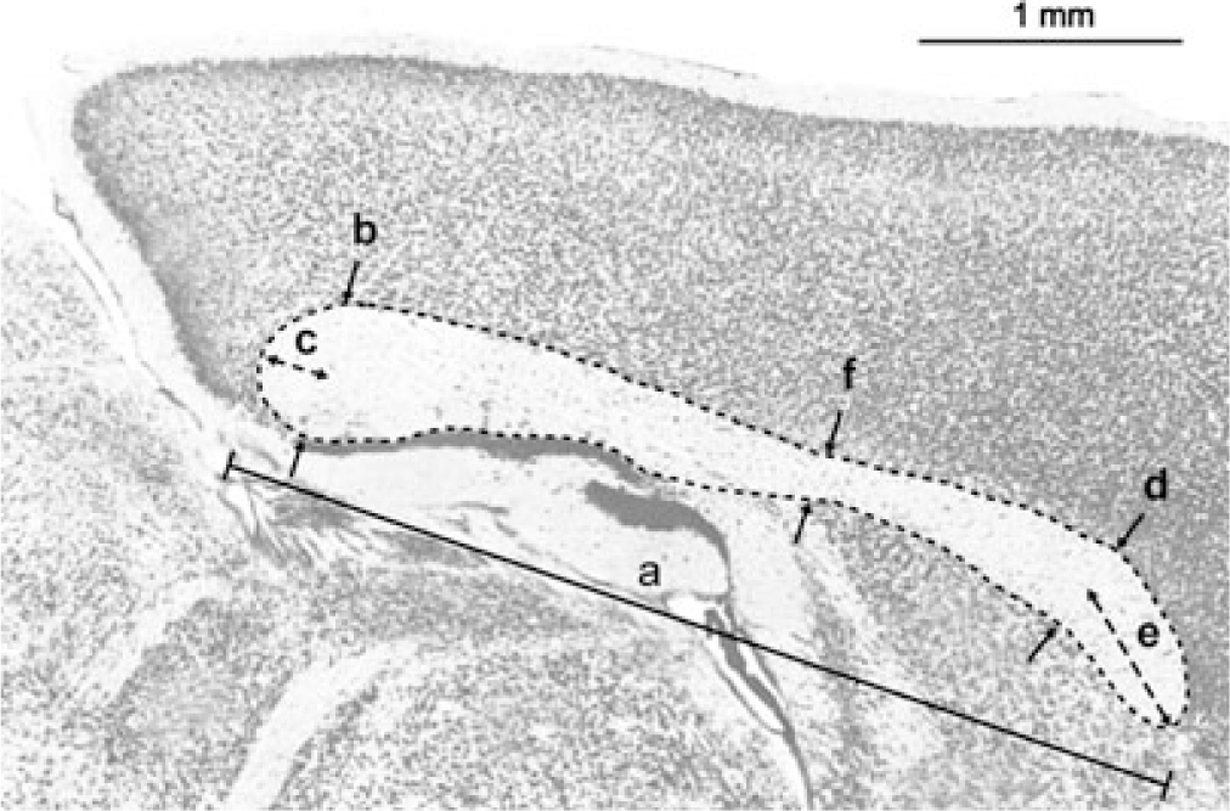
A midsagittal view of the corpus callosum of the mouse. We made 6 measurements on the midsagittal view of the corpus callosum. (A) The overall rostro-caudal length; (B, C) the thickness and the protrusion of the posterior corpus callosum; (D, E) the thickness and the protrusion of the anterior corpus callosum; (F) the thickness of the narrowest part of the corpus callosum.
The 4 major outcome measures as response variables in the present study are (i) body weight, (ii) cerebral cortex mass, (iii) cerebellar mass, and (iv) rostro-caudal length of the corpus callosum in midsagittal sections. Since each of these response variables could vary under the combined effect of age, gender, and the treatment (control or ethanol), we carried out a 2 × 2 × 2 ANOVA to ascertain the age–gender–treatment interactions for each of the response variables. Adjustments for multiple comparisons were made according to the Tukey–Kramer protocol (SPSS, Chicago, IL). No significant interactions were found for any of the 4 response variables (p > 0.05). In the sections to follow, we therefore examined each response variable in more detail with a pair-wise or 2-sample analysis in order to focus on the effect of ethanol, age, or gender. Our statistical analyses were performed with the 2-tailed Student’s t-test. Data were represented as mean ± SD. Cases in which p-values < 0.05 were considered statistically significant.
RESULTS
Body Weight
Growth Patterns of P25 Mice: Similarities Between Male and Female Mice.
Figure 3 shows the time course of body weight gain for our mice. Figure 4 shows that ethanol treatment significantly attenuated body weight gain in peri-adolescent mice compared with adult mice. The main features of the data in these 2 figures are: (i) At P25, male control mice were slightly lighter than females although the difference was not significant (11.47 ± 1.21 g for males, vs. 11.64 ± 1.26 g for females, p > 0.05), also see C25 bars for males and females in Fig. 4). (ii) Control male and female adolescent mice grew significantly heavier and nearly doubled their weight between P25 and 70 (24.81 ± 1.19 g for males vs. 20.06 ± 0.83 g for females (also see C70 bars for males and females in Fig. 4). This weight gain should be viewed as the mouse peri-adolescent growth spurt. (iii) In our P25 mice, the rate of weight gain was the fastest at or near P25 and then appeared to taper off with age from that point on. (iv) In Fig. 3, growth curves for male and female control mice began to separate shortly after P25, confirming P25 to be a suitable choice for the starting age of mice concerning the gender-specific effect of ethanol on peri-adolescent weight gain. (v) Ethanol treatment significantly reduced this peri-adolescent growth spurt in both male and female mice (also compare bars E70 with C70 for males and females in Fig. 4). (vi) In the younger mice (male or female), the values of body weight in control mice were already markedly larger than those for ethanol-treated mice after 2 to 3 weeks of ethanol treatment. (vii) In the older mice (male or female), the values of body weight in control and ethanol treatment mice were more stable throughout the 45-day period (than the younger group).
Fig. 3.
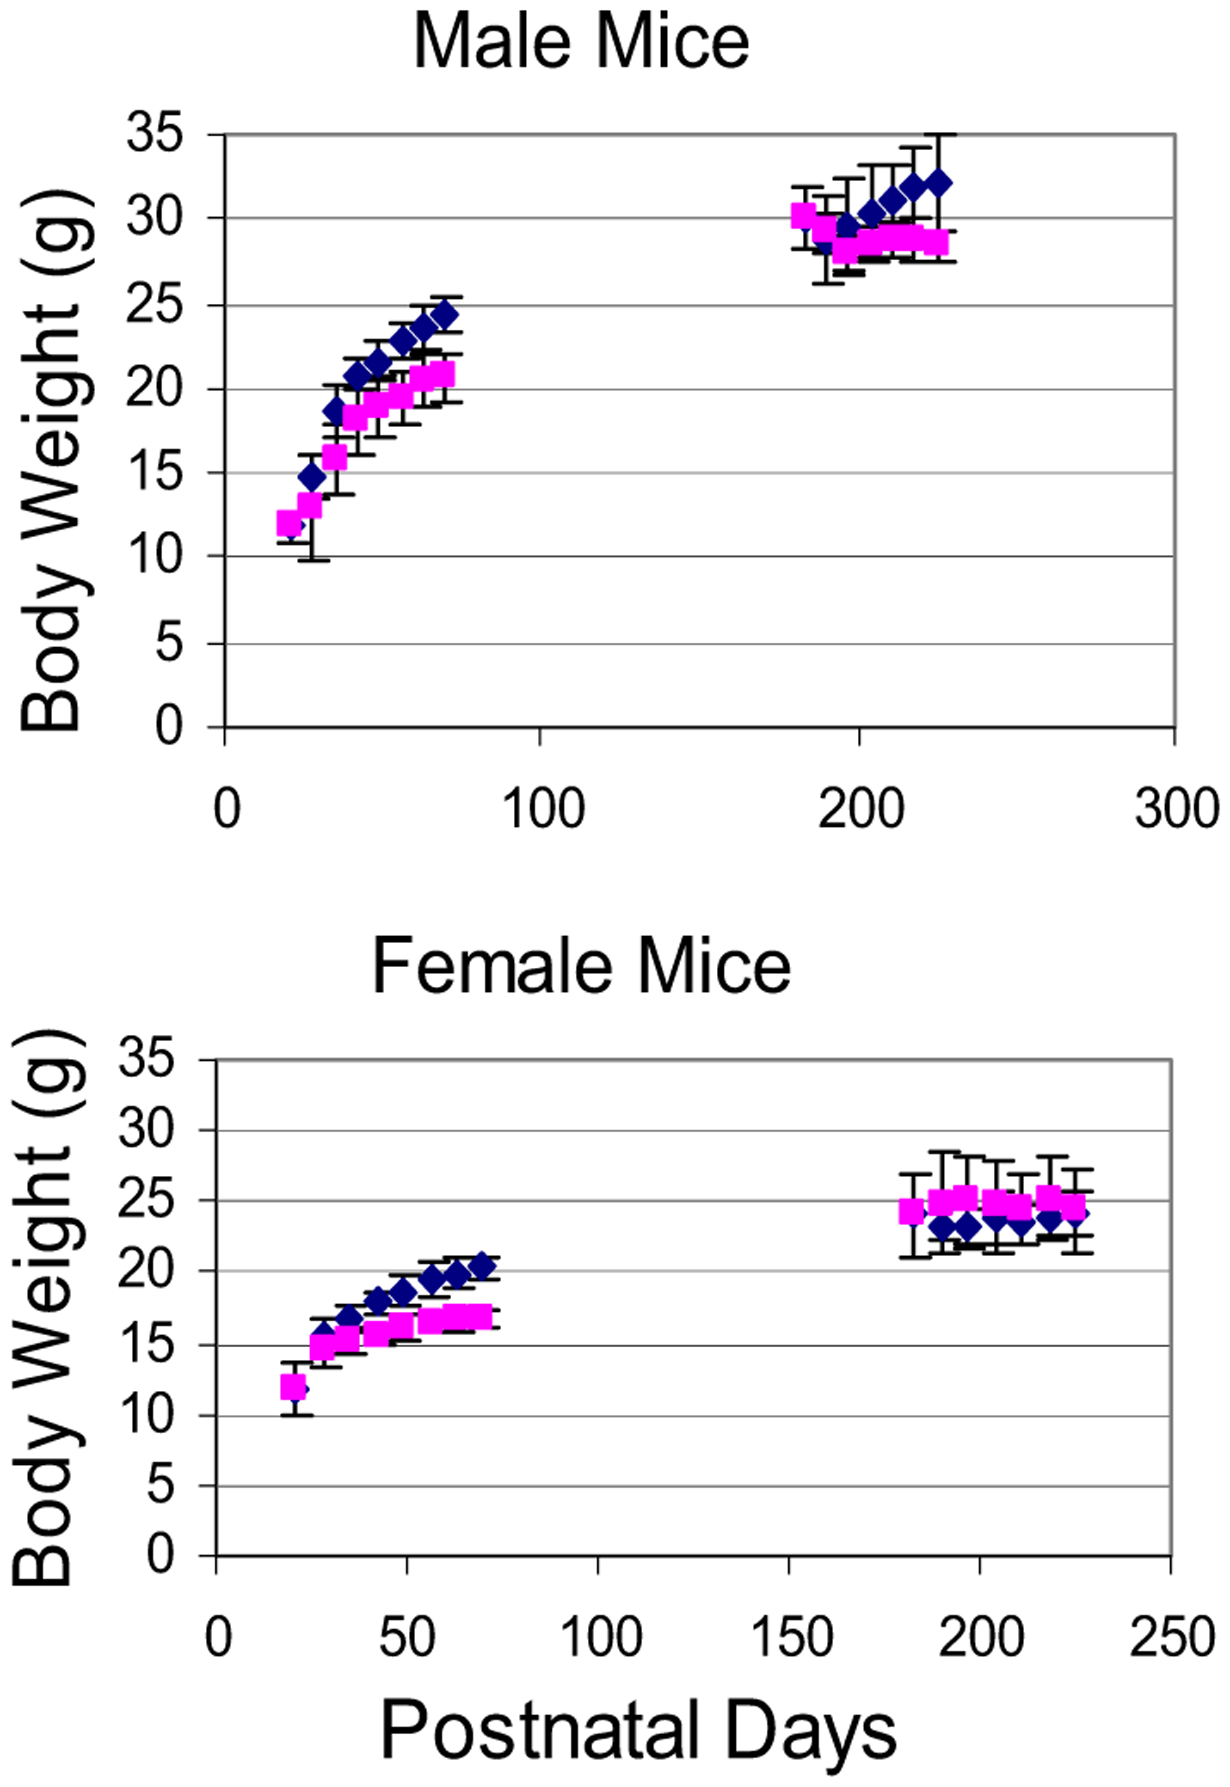
Body weight of mice as a function of time in the present study. Upper panel shows that control P25 males grew more quickly than ethanol-treated P25 males, whereas control P180 males did not grow more than ethanol-treated P180 males. Lower panel shows data on female mice. (Diamonds are control mice and squares are ethanol-treated mice.)
Fig. 4.
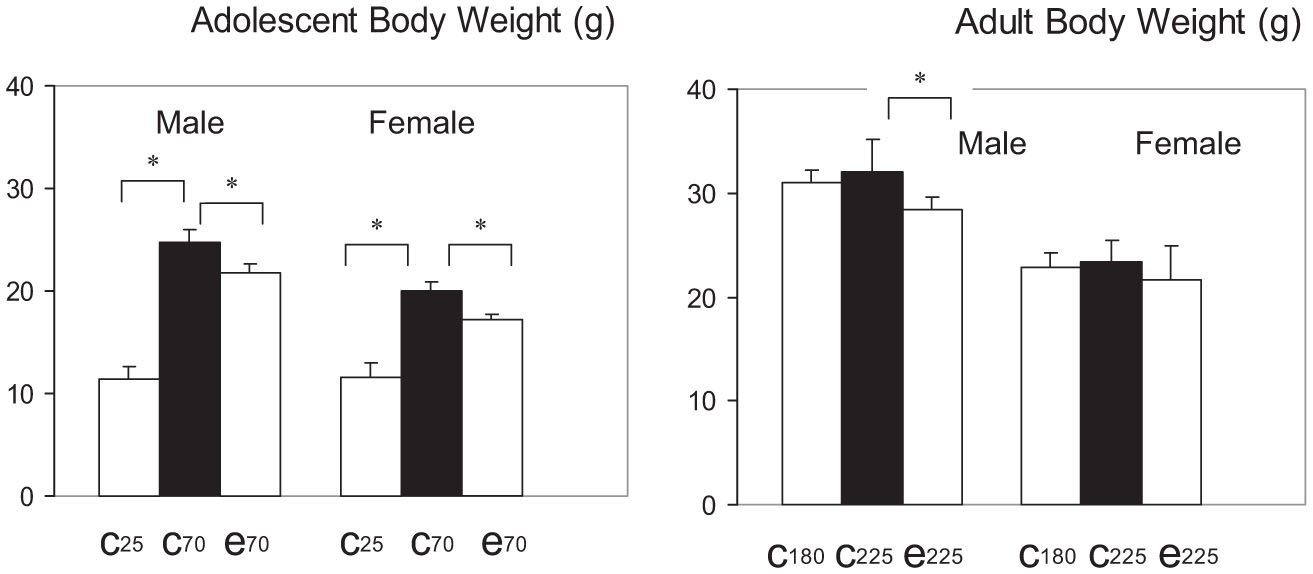
Ethanol markedly attenuated the body weight gain in the adolescent mice but not in adult mice. Left: Adolescent body weight; right: adult body weight. The C25 bar is the body weight of control mice at the beginning of the 45-day period; C70 bar indicates body weight of control mice at the end of the 45-day period; E70 bar indicates body weight of ethanol mice at the end of the 45-day period. The C180, C225, and E225 bars are for adult mice. * indicates significant change.
Peri-Adolescent Growth Spurt is Gender-Specific in Both Control Mice and Ethanol Mice
Peri-adolescent weight gain in control mice was gender-specific. The pair of bars on the left side in the upper left panel of Fig. 5 shows that control males at P70 were significantly heavier than control females (24.81 ± 1.19 g for males vs. 20.06 ± 0.83 g for females, p < 0.01, t = 8.47, df = 13). The pair of bars on the left side in the upper right panel of Fig. 5 shows that males gained significantly more weight than females (13.85 ± 1.1 g vs. 8.74 ± 0.8 g for females, p < 0.01, t = 14.57, df = 9). The pair of bars on the left side in the lower left panel of Fig. 5 shows that at P70, 56 ± 3% of the body weight in males was gained during the 45 day period, whereas for females it was significantly less at 44 ± 1% (p < 0.01, t = 12.32, df = 10). To estimate individual growth rates, we assigned a weight gain ratio (a ratio of body weight at P70 vs. P25) for each mouse. The pair of bars on the left side in the lower right panel of Fig. 5 shows that the growth ratio (P70 body weight/P25 body weight) was 2.27 ± 0.17 for males versus a significantly smaller value at 1.77 ± 0.2 for females (p < 0.01, t = 9.32, df = 9). Thus, whether one examined absolute weight in grams or relative measures as growth ratios or weight gain as a fraction of body weight, our data showed that male control mice grew significantly more than females from P25 to 70, indicating that the underlying peri-adolescent growth process in control mice was gender-specific. We next focused on analyzing whether the effect of ethanol on peri-adolescent mice growth pattern is gender-specific.
Fig. 5.
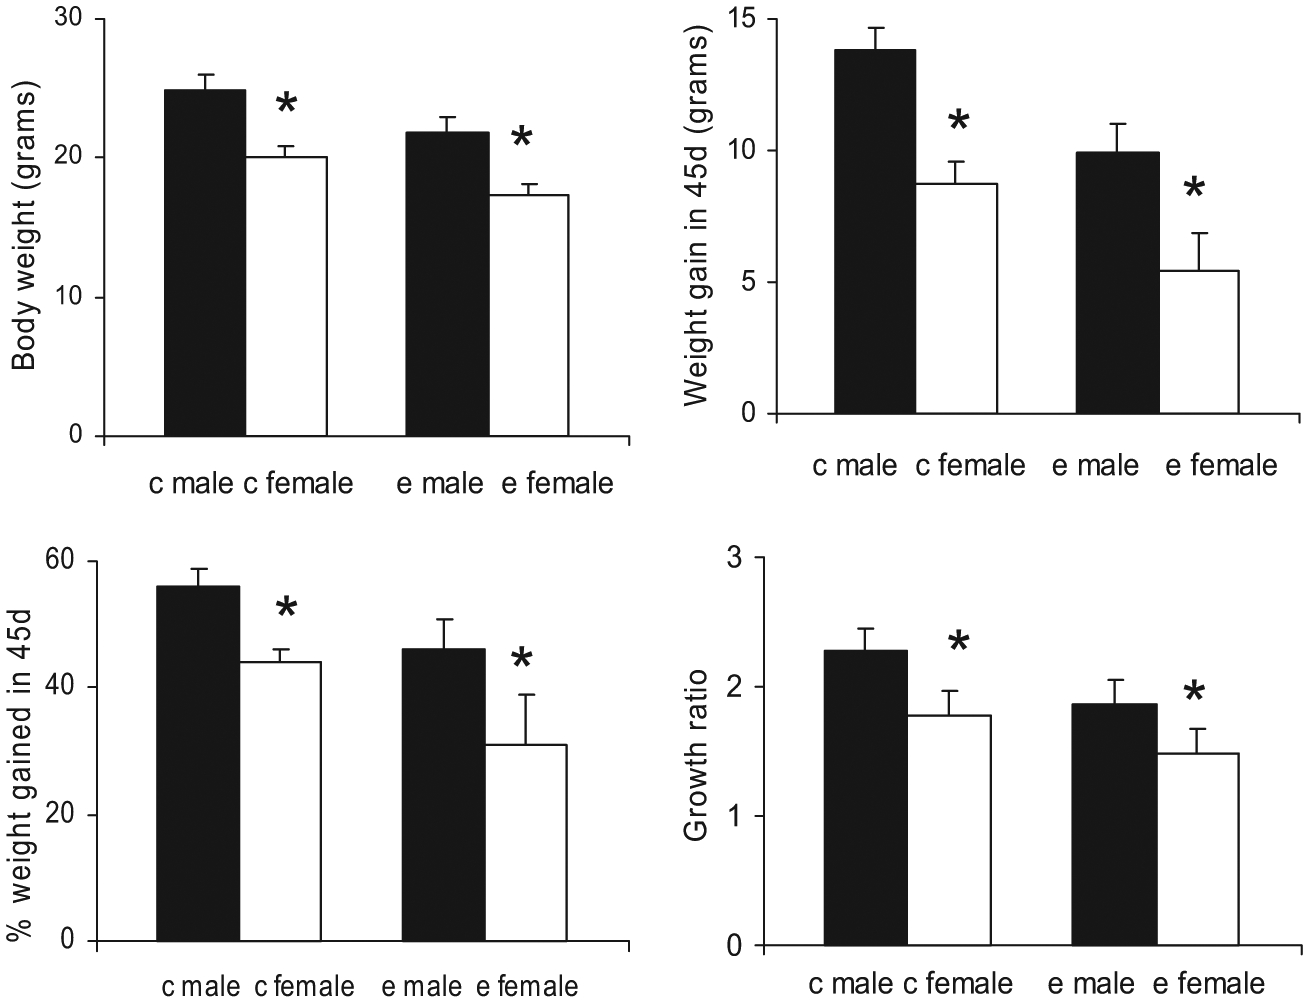
Adolescent body weight growth (from P25 to 70) in both control mice and ethanol-treated mice are gender-specific. Upper left panel: Mice body weight at P70, control males and females are on left, ethanol males and females are on right; upper right panel: amount of weight gain in the 45 days period (between P25 and 70); lower left panel: the % of body weight gained in the 45 days period; lower right panel: growth ratio. Male mice grew significantly more than females from P25 to 70 regardless of ethanol treatment, indicating that the underlying adolescent growth process remained gender-specific despite the ethanol treatment. The * indicates that the difference between the open bar and the filled bar is statistically significant (p < 0.01).
Peri-adolescent weight gain in ethanol-treated mice was gender-specific. The pair of bars in the right side of the upper left panel of Fig. 5 shows that ethanol-treated males were significantly heavier than ethanol females at P70 (21.77 ± 0.85 g for males vs. 17.25 ± 0.40 g for females, p < 0.01, t = 12.37, df = 18). The pair of bars in the right side of the upper right panel of Fig. 5 shows that ethanol-treated males gained significantly more weight (9.94 ± 1.1 g) than females (5.41 ± 1.48 g; p < 0.01, t = 7.58, df = 18). The pair of bars in the right side of the lower left panel shows that at P70, 46 ± 5% of the body weight in ethanol males was gained during the 45 days period, whereas it was significantly less for females (31 ± 8%; p < 0.01, t = 4.56, df = 18). Finally, the pair of bars in the right side of the lower right panel of Fig. 5 shows that weight gain ratios were significantly larger for males (1.86 ± 0.20) than for females (1.48 ± 0.20; p < 0.01, t = 3.91, df = 18). As in control mice, whether one examined absolute weight in grams or relative measures as growth ratios or weight gain as a fraction of body weight, our data showed that male ethanol treated mice grew significantly more than female ethanol treated mice from P25 to 70, indicating that the underlying peri-adolescent growth process in ethanol treated mice was also gender-specific.
Is the effect of ethanol on peri-adolescent weight gain gender-specific? Even though the patterns of body weight gain between P25 and 70 for both the control mice and the ethanol-treated mice were gender-specific, the ethanol-induced effect on body weight growth could either be gender-specific or independent of gender. Comparing all 4 bars in the upper left panel of Fig. 5, both male and female ethanol-treated mice were significantly lighter than their controls at the end of the 45-day period (21.77 ± 0.85 g for ethanol-treated males vs. 24.81 ± 1.19 g for control males, p < 0.01, t = −7.33, df = 22; 17.25 ± 0.45 g for ethanol-treated females vs. 20.06 ± 0.83 g for control females, p < 0.01, t = −10.28, df = 9). The same conclusion can be drawn for the amount of weight gain, the weight gain at P70 as % body weight, or the growth ratio. From the 4 panels in Fig. 5, the degree of disruption in body weight gain by ethanol in mice of different gender and the intrinsic gender-specific differences in control or ethanol-treated mice were of the same order of magnitude. To address the question of whether the ethanol effect on weight gain was gender-specific, we now turn to Fig. 4. Comparing the C70 and E70 bars for males and females in Fig. 4, ethanol caused more reduction in body weight in males (3.04 g, from 24.81 to 21.77 g) than in females (2.81 g, from 20.06 to 17.25 g). But this reduction accounted for a larger percentage of body weight in females (14%) than in males (12.3%). Differences between 3.04 and 2.81 g (0.23 g) and between 14 and 12.3% (1.7%) were small. Here, conventional statistics could not be applied to derive a measure of significance for either 0.23 g or 1.7% because these measures were derived from the differences between 2 mean values rather than from individual pairs which contained the critical information on variance. On the other hand, a rough estimation on the significance of values such as 0.23 g or 1.7% could be made. For example, these differences (e.g., 0.23 g or 1.7%) were smaller than or of the same magnitude as the standard deviations for weight gain, which were generally in the range of 0.8 to 1.48 g and 1 to 8%, respectively (from the standard deviations in Figs 4 and 5). We therefore estimated that it was not likely that these differences (e.g., 0.23 g or 1.7%) would be statistically significant at the p = 0.01 level.
Beyond Adolescent Growth Spurt: Smaller Differences.
The peri-adolescent growth spurt in body weight from P25 to 70, although impressive, accounted for only 77.4 and 85.6% for the total amount of weight gain between P25 and 225 for male and female mice, respectively (Table 1, also see Fig. 3). More growth therefore occurred after P70, although at a progressively reduced rate with age. Thus, the body weight of the P180 mice were at 97 to 98% of the P225 mice for both males and females. At P180, control males were already significantly heavier than females at the beginning of the ethanol treatment (30.94 ± 1.24 g for males vs.22.92 ± 1.38 g for females, p < 0.01, t = 12.25, df = 15). This was also the case at P225 (32.05 ± 3.12 g for males vs.23.44 ± 1.99 g for females, p < 0.01, t = 6.61, df = 13, also compare bars C180 with C225 for males and females in Fig. 4). No significant weight gain occurred, however, from P180 to 225 in either control males or females (p > 0.05). The E225 bars in Fig. 4 showed that ethanol caused a small but significant decrease in body weight in the P180 mice for males (28.47 ± 1.17 g vs. controls at 30.94 ± 1.24 g, 8% decrease, p < 0.01, t = −3.45, df = 13) and no significant difference in females (21.73 ± 3.13 g vs. controls at 23.44 ± 1.99 g, p > 0.05). We concluded that ethanol interferes with peri-adolescent growth spurt during maturation but had a progressively smaller effect on body weight as the mice became older.
Table 1.
Values of Body Weight (g) and % Body Weight (with P225 Body Weight as 100) of Male and Female Control Mice from P25 to 225
| Male (g) | Male (%) | Female (g) | Female (%) | |
|---|---|---|---|---|
| P25 | 11.47 | 34.8 | 11.64 | 49.7 |
| P70 | 24.81 | 77.4 | 20.06 | 85.6 |
| P180 | 30.94 | 96.5 | 22.92 | 97.8 |
| P225 | 32.05 | 100 | 23.44 | 100 |
Between 77 and 86% of the weight gain has occurred at P70 for males and females, respectively, and between 97 and 98% of the weight gain has occurred at P180 for males and females, respectively.
Brain Mass
In the present study, ethanol treatment was associated with significant differences in body weight of the adolescent mice. The differences were clearly visible during much of the 45 days ethanol treatment period (Fig. 3). Brain mass measurements were, however, invasive and therefore were carried out only at P70 and 225. The mass of the cerebellum and the cerebral cortex remained essentially constant between P70 and 225 (Tables 2 and 3). There was no clear correlation between the data on mice body weight and (i) cerebellum or cerebral cortex mass (also the overall rostro-caudal length of the corpus callosum) between P70 and 225, (ii) gender, and (iii) ethanol treatment (Pearson’s correlation coefficients were < 0.5). It was possible that our invasive brain weight measurements contained too few time points for the examination of such correlations. It was also possible that between P70 and 225, age-related differences in brain mass were too small, statistically insignificant, and hence did not correlate well with body weight differences. We therefore did not consider mouse body weight as a covariate for brain measurements. The correlation of body weight and brain mass remains an important and interesting question. More detailed probes on this will have to be made in future studies.
Table 2.
The Weight of the Cerebellum and Cerebral Cortex in Control and Ethanol-Treated Mice (at P70 and 225)
| Age group | Cerebellum of control mice (mg) | Cerebellum of ethanol-treated mice (mg) | Cortex of control mice (mg) | Cortex of ethanol-treated mice (mg) |
|---|---|---|---|---|
| P70 male | 51.5 ± 3.8 | 52.4 ± 2.2 | 296 ± 7.9 | 285 ± 5.6 |
| P70 female | 53.2 ± 3.3 | 50.9 ± 2.0 | 294 ± 12.5 | 285 ± 5.7 |
| P225 male | 54.6 ± 2.6 | 51.9 ± 3.2 | 298 ± 5.3 | 297 ± 5.8 |
| P225 female | 54.4 ± 4.0 | 52.4 ± 2.5 | 303 ± 12.4 | 294 ± 11.8 |
Values for males and females are listed separately (n = 6). There are no gender-specific differences here.
Table 3.
The Weight of the Cerebellum and Cerebral Cortex in Ethanol Treated Mice and Their Controls (at P70 and 225)
| Age group | Cerebellum weight of control mice (mg) | Cerebellum weight of ethanol treated mice (mg) | Cortex weight of control mice (mg) | Cortex weight of ethanol treated mice (mg) |
|---|---|---|---|---|
| P70 mice | 52.1 ± 3.3 | 51.9 ± 1.7 | 295 ± 8.4 | 286 ± 5.2 |
| P225 mice | 54.5 ± 3.0 | 52.2 ± 2.7 | 300 ± 8.2 | 296 ± 8.7 |
Values for males and females are combined (n = 12). There are no age-related differences here. See text for ethanol-related differences.
Age-Related Differences in Control Mice.
In a marked deviation from the data on body weight, gender difference and ethanol treatment were not associated with large and significant differences in the mass of the cerebral cortex or the cerebellum (Table 2, p > 0.05). We therefore pooled the data from males and females into a single entry in Table 3. With the larger sample size (now n = 12), the cerebellum of the P225 controls was 4.6% heavier than the P70 controls (0.0545 g vs. 0.0521 g, p > 0.05); the cerebral cortex of the P225 controls was 1.7% heavier than the P70 controls (0.300 g vs. 0.295 g, p > 0.05). These small differences, however, did not reach statistical significance at p = 0.05.
Effects of Ethanol.
The effect of ethanol treatment on the cerebral cortex mass was more pronounced and statistically significant in the younger group of mice (3.1% decrease from0.295 to 0.286 g, p < 0.01, t = 3.96, df = 28); ethanol caused smaller differences that did not reach statistical significance in the older group of mice. We did not detect significant effects of ethanol on the cerebellum in either age group (p > 0.05). The lack of significant differences in the cerebellum must be considered in light of its smaller mass and the resultant larger coefficients of variation (~3% for the cerebral cortex and 6% for the cerebellum).
The Corpus Callosum.
While the overall rostro-caudal length of all mice (regardless of age, gender, or ethanol treatment) was typically 4 mm, the other 5 width measurements of the corpus callosum were typically between 0.15 and 0.45 mm (Fig. 2, Table 4). The values for the standard deviation of the 5 smaller width measurements in Table 4 were much smaller (0.03 to 0.08 mm) but the coefficients of variation of these 5 measurements of the corpus callosum were greater than those for the overall length of the corpus callosum (8.6 to 20.9% of the mean value). We did not detect significant gender-specific differences in any of the 6 measurements of the corpus callosum from control mice in the same age group (n = 6, p-values ranging from 0.052 to 0.922, data not shown). After combining the data from male and female mice into a single entry, the rostro-caudal length of the corpus callosum in control mice (now n = 12) showed significant age-related difference between P70 and 225(6.09% increase, from 4.058 ± 0.135 mm to 4.305 ± 0.111 mm, p < 0.01, t = −5.16, df = 29). The effect of ethanol on the length of the corpus callosum was significant only in the older group of mice (5.04% decrease, from 4.305 ± 0.111 to 4.088 ± 0.153 mm, p < 0.01, t = 3.59, df = 17). None of the other 5 smaller parameters of the corpus callosum were significantly affected by ethanol or age (p-values ranging from 0.122 to 0.954, data not shown).
Table 4.
Mean and Standard Deviation Values of the 6 Measurements of the Corpus Callosum in P225 Control Mice (Male and Female Data Combined, n = 12)
| Length code | Mean (mm) | SD (mm) | SD/mean (%) |
|---|---|---|---|
| A | 4.31 | 0.11 | 2.6 |
| B | 0.38 | 0.04 | 10.3 |
| C | 0.42 | 0.08 | 18.6 |
| D | 0.45 | 0.04 | 8.6 |
| E | 0.37 | 0.06 | 15.3 |
| F | 0.14 | 0.03 | 20.9 |
A: Overall length; B: maximal width at posterior end; C: extent of protrusion at the posterior end; D: maximal width at anterior end; E: extent of protrusion at the anterior end; F: minimal width (also see Fig. 2).
DISCUSSION
The basic and clinical literature provides strong support for the contention that adolescents consume more ethanol and/or respond differently to ethanol than their adult counterparts (Chin et al., 2010; Doremus et al., 2005; Lallemand et al., 2009; Nixon et al., 2010; Riley et al., 2010; Ristuccia and Spear, 2008; Rodd-Henricks et al., 2002a,b; Truxell et al., 2007; Vetter et al., 2007; Vetter-O’Hagen et al., 2009). The existing literature also indicates that females often consume more ethanol and/or respond differently to ethanol than their male counterparts (Bell et al., 2003, 2008; Devaud et al., 1999; Devaud and Prendergast, 2009; Fox et al., 2009; Kelly et al., 2009; Lallemand et al., 2009; Maldonado et al., 2008; Maldonado-Devincci et al., 2010; Miller et al., 2009; Ridge et al., 2009; Truxell et al., 2007; Vetter-O’Hagen et al., 2009). Thus, the present study examined the effects of peri-adolescent (P25 to 70) and adult (P180 to 225) ethanol exposure in both male and female C57BL/6J mice. The combined choice of the duration of the ethanol treatment (45 days) and the age of our younger group of mice (started at P25) provided ethanol exposure for our mice during their entire peri-adolescence period (Odell, 1990; Spear, 2000; but see Moore et al., 2010, for P21 to 60). Over this period, the adolescent, gender-specific weight gain in mice (from P25 to 70) was impressive. Ethanol caused a dramatic reduction in this peri-adolescent growth spurt. These results on body weight are in general agreement with a recent study in which data were reported on body weight gain of male adolescent mice in a chronic alcohol consumption model over a 6-week period (starting age P28, ~2 g/kg/d in a 2-bottle free-choice paradigm) (Zou et al., 2009). In particular, they also observed that the body weight values for control mice and ethanol mice became significantly different after 2 to 3 weeks of ethanol treatment. Here we have additionally determined that the patterns of peri-adolescent body weight gain remained strongly gender-specific in a statistically significant manner for both control and ethanol-treated mice. We could only estimate, however, that the gender-specificity of the intrinsic process of ethanol-induced attenuation in peri-adolescent weight gain was weak at best and possibly not significant (but see Emanuele et al., 2002, for the effect of ethanol on developing females). Although it is not clear whether the ethanol-treated peri-adolescent mice would have remained smaller throughout their life span, consequences of perturbations on development and maturation can be irreversible.
A rodent model that mimics alcohol consumption and dependence in humans is the alcohol-preferring (P) rat bred from a closed colony of Wistar rats (Bell et al., 2006; McBride and Li, 1998; Murphy et al., 2002). The P rat model is of considerable interest not only because they voluntarily consume large amounts of alcohol, but also because ethanol can produce similar abnormalities in their telencephalon as in human drinkers. Results from a recent longitudinal brain imaging study of male P rats (from P88 to 578) have revealed that free-choice ethanol consumption attenuated the growth and expansion of brain structures, including the corpus callosum and hippocampus (Pfefferbaum et al., 2006a; Sullivan et al., 2006). Direct comparisons between results of the P rat study (Pfefferbaum et al., 2006a; Sullivan et al., 2006) and those of the present study, however, are difficult. Differences exist not only in the different experimental parameters but also in additional considerations. For example, both the cerebral cortex and the cerebellum in control P rats have been found to increase in volume continuously between P88 and 578 although the increases are not likely to involve increases in the number of neurons. Control P rats also gained weight continuously without signs of asymptote between P88 and 578 and became obese. Mice exhibited a significant peri-adolescent growth spurt and then gained weight slowly and perhaps only up to 180 days (Table 1, Fig. 3). Modern human weight gain patterns are partly similar to that of the P rat and partly similar to that of mice. Further studies are needed, as fat metabolism in adults and maturational growth involve different cellular mechanisms which can interact with ethanol differently.
Significant maturational changes are known to occur in the mammalian cerebral cortex between P25 and 225, including synaptic pruning (Rakic et al., 1994). In the cerebellum, significant changes in parallel fiber length and the number of synapses have also been reported for mice and rats (Huang et al., 1999, 2006). In humans, maturational changes occur in both white and gray matters in the cerebral cortex (Ashtari et al., 2007; Bamea-Goraly et al., 2005; Giedd et al., 1999; Lenroot and Giedd, 2006; Pfefferbaum et al., 1994; Rakic et al., 1994; Rubia et al., 2000; Segalowitz and Davies, 2004; Sowell et al., 1999, 2003, 2004). At present, the detailed effects of ethanol on these changes at the cellular level are largely unclear. Although Hommer (2003) has suggested that women may be more vulnerable to alcohol-induced brain damage in a review, detailed evidence on the influence of gender on the effect of ethanol on brain structures is still incomplete.
The developing human brain also displays ethanol-induced changes in the size and shape of the corpus callosum (Bookstein et al., 2002; Riley et al., 1995). In animal models, other than those for fetal alcohol syndrome (Elberger, 2007), details on the effect of ethanol on the corpus callosum in the adolescent brain are largely unclear. The corpus callosum is topographically organized so that the anterior, middle, and posterior portions contain fibers that connect the anterior, middle, and the posterior regions of the cerebral cortex. Detailed topographic features of the corpus callosum at the cellular resolution may provide useful information on region-specific differences in various parts of the cerebral cortex. In the present study, only small differences in mass measurements of the brain, the cerebellum, and the corpus callosum were seen either as a result of age (from P70 to 225), gender, or ethanol treatment. Although greatly increasing the sample size could possibly reveal some small difference in such gross measurements of the brain, it may not be a practical alternative. Detailed studies at the histological level preferably matched by behavioral studies must be considered in future animal model studies to further examine these small but potentially significant effects (Crews et al., 2000; Dlugos and Pentney, 1997; Tabbaa et al., 1999).
Small effects in brain mass measures, however, can still have serious functional consequences if the differences are region-specific (e.g., if all mass differences in the forebrain come from the prefrontal cortex). In the temporal dimension, the results of adolescent exposure to ethanol can be influenced by an array of complex and interacting conditions. First, there may be a latent period with serious functional manifestations taking place only later in adulthood. Second, structural damages in the adolescent brain may also have a better chance for functional recovery compared with the same damage occurring in the adult brain. Third, early onset of alcohol use leads to a higher risk for the development of alcohol dependence in adulthood (Anthony and Petronis, 1995; Chou and Pickering, 1992). Findings from 1 study revealed that almost half of the adult respondents who reported first alcohol use at age 13 met DSM-IV diagnostic criteria for “lifetime” alcohol dependence (American Psychiatric Association, 1994), whereas only one-tenth of those who reported first alcohol use after age 20 met the DSM-IV criteria (Grant and Dawson, 1997). Age of first alcohol use also influences the impact of other psychosocial risk factors for the development of alcohol abuse including parenting and peer influence (Hawkins et al., 1997). These findings reinforce the significance of impact of alcohol on adolescents.
ACKNOWLEDGMENTS
We thank NIH AA 13322 and 14973 for support, and Dr. Andrea Elberger for help with the manuscript.
REFERENCES
- American Psychiatric Association (1994) Diagnostic and Statistical Manual of Mental Disorders. 4th ed. American Psychiatric Association, Washington, DC. [Google Scholar]
- Anthony JC, Petronis KR (1995) Early-onset drug use and risk of later drug problems. Drug Alcohol Depend 40:9–15. [DOI] [PubMed] [Google Scholar]
- Ashtari M, Cervellione KL, Hasan KM, Wu J, McIlree C, Kester H, Ardekani BA, Roofeh D, Szeszko PR, Kumra S (2007) White matter development during late adolescence in healthy males: a cross-sectional diffusion tensor imaging study. Neuroimage 35:501–510. [DOI] [PubMed] [Google Scholar]
- Bamea-Goraly N, Menon V, Eckert M, Tamm L, Bammer R, Karchemskiy A, Dant CC, Reiss AL (2005) White matter development during childhood and adolescence: a cross-sectional diffusion tensor imaging study. Cereb Cortex 15:1848–1854. [DOI] [PubMed] [Google Scholar]
- Bava S, Thayer R, Jacobus J, Ward M, Jernigan TL, Tapert SF (2010) Longitudinal characterization of white matter maturation during adolescence. Brain Res 1327:38–46. [DOI] [PMC free article] [PubMed] [Google Scholar]
- Bell RL, Rodd ZA, Kuc KA, Lumeng L, Li T-K, Murphy JM, McBride WJ (2003) Effects of concurrent access to a single or multiple concentrations of ethanol on the intake of ethanol by male and female periadolescent alcohol-preferring (P) rats. Alcohol 29:137–148. [DOI] [PubMed] [Google Scholar]
- Bell RL, Rodd ZA, Lumeng L, Murphy JM, McBride WJ (2006) The alcohol-preferring P rat and animal models of excessive alcohol drinking. Addict Biol 11:270–288. [DOI] [PubMed] [Google Scholar]
- Bell RL, Rodd ZA, Schultz JA, Peper CL, Lumeng L, Murphy JM, McBride WJ (2008) Effects of short deprivation and re-exposure intervals on the ethanol drinking behavior of selectively bred high alcohol-consuming rats. Alcohol 42:407–416. [DOI] [PMC free article] [PubMed] [Google Scholar]
- Bookstein FL, Streissguth AP, Sampson PD, Connor PD, Barr HM (2002) Corpus callosum shape and neuropsychological deficits in adult males with heavy fetal alcohol exposure. Neuroimage 15:233–251. [DOI] [PubMed] [Google Scholar]
- Chin VS, Van Skike CE, Matthews DB (2010) Effects of ethanol on hippo-campal function during adolescence: a look at the past and thoughts on the future. Alcohol 44:3–14. [DOI] [PubMed] [Google Scholar]
- Chou SP, Pickering RP (1992) Early onset of drinking as a risk factor for lifetime alcohol-related problems. Br J Addict 87:1199–1204. [DOI] [PubMed] [Google Scholar]
- Clark DB, Thatcher DL, Tapert SF (2008) Alcohol, psychological dysregulation, and adolescent brain development. Alcohol Clin Exp Res 32:375–385. [DOI] [PubMed] [Google Scholar]
- Crews FT, Braun CJ, Hoplight B, Switzer RC, Knapp DJ (2000) Binge ethanol consumption causes differential brain damage in young adolescent rats compared with adult rats. Alcohol Clin Exp Res 24:1712–1723. [PubMed] [Google Scholar]
- Crews F, He J, Hodge C (2007) Adolescent cortical development: a critical period of vulnerability for addiction. Pharmacol Biochem Behav 86:189–199. [DOI] [PubMed] [Google Scholar]
- Devaud LL, Matthews DB, Morrow AL (1999) Gender impacts behavioral and neurochemical adaptations in ethanol-dependent rats. Pharmacol Biochem Behav 64:841–849. [DOI] [PubMed] [Google Scholar]
- Devaud LL, Prendergast MA (2009) Introduction to the special issue of alcohol and alcoholism on sex/gender differences in responses to alcohol. Alcohol Alcohol 44:533–534. [DOI] [PubMed] [Google Scholar]
- Dlugos CA, Pentney RJ (1997) Morphometric evidence that the total number of synapses on Purkinje neurons of old F344 rats is reduced after long-term ethanol treatment and restored to control levels after recovery. Alcohol Alcohol 32:161–172. [DOI] [PubMed] [Google Scholar]
- Doremus TL, Brunell SC, Rajendran P, Spear LP (2005) Factors influencing elevated ethanol consumption in adolescent relative to adult rats. Alcohol Clin Exp Res 29:1796–1808. [DOI] [PubMed] [Google Scholar]
- Elberger AJ (2007) What do studies of the corpus callosum in animals tell us about prenatal alcohol-effects in humans? Alcohol Clin Exp Res 31:250A. [Google Scholar]
- Emanuele N, Ren J, LaPaglia N, Steiner J, Emanuele MA (2002) EtOH disrupts female mammalian puberty. Endocrine 18:247–254. [DOI] [PubMed] [Google Scholar]
- Fitzpatrick LE, Jackson M, Crowe SF (2008) The relationship between alcoholic cerebellar degeneration and cognitive and emotional functioning. Neurosci Biobehav Rev 32:466–485. [DOI] [PubMed] [Google Scholar]
- Fox HC, Hong K-IA, Siedlarz KM, Bergquist K, Anderson G, Kreek MJ, Sinha R (2009) Sex-specific dissociations in autonomic and HPA responses to stress and cues in alcohol-dependent patients with cocaine abuse. Alcohol Alcohol 44:575–585. [DOI] [PMC free article] [PubMed] [Google Scholar]
- Giedd JN (2004) Structural magnetic resonance imaging of the adolescent brain. Ann NY Acad Sci 1021:77–85. [DOI] [PubMed] [Google Scholar]
- Giedd JN (2008) The teen brain: insights from neuroimaging. J AdolescHealth 42:335–343. [DOI] [PubMed] [Google Scholar]
- Giedd JN, Blumenthal J, Jeffries NO, Castellanos F, Liu H, Zijdenhos A, Paus T, Evans AC, Rapoport JL (1999) Brain development during childhood and adolescence: a longitudinal MRI study. Nat Neurosci 2:861–863. [DOI] [PubMed] [Google Scholar]
- Grant BF, Dawson DA (1997) Age at onset of alcohol use and its association with DSM-IV alcohol abuse and dependence: results from the National Longitudinal Alcohol Epidemiologic Survey. J Subst Abuse 9:103–110. [DOI] [PubMed] [Google Scholar]
- Harris GJ, Jaffin SK, Hodge SM, Kennedy D, Caviness VS, Marinkovic K, Papadimitriou GM, Makris N, Oscar-Berman M (2008) Frontal white matter and cingulum diffusion tensor imaging deficits in alcoholism. Alcohol Clin Exp Res 32:1001–1013. [DOI] [PMC free article] [PubMed] [Google Scholar]
- Hawkins JD, Graham JW, Maguin E, Abbott R, Hill KG, Catalano RF (1997) Exploring the effects of age of alcohol use initiation and psychosocial risk factors on subsequent alcohol misuse. J Stud Alcohol 58:280–290. [DOI] [PMC free article] [PubMed] [Google Scholar]
- Hommer DW (2003) Male and female sensitivity to alcohol-induced brain damage. Alcohol Res Health 27:181–185. [PMC free article] [PubMed] [Google Scholar]
- Huang C, Brown N, Huang R (1999) Age-related changes in the cerebellum: parallel fibers. Brain Res 840:148–152. [DOI] [PubMed] [Google Scholar]
- Huang C, Miyamoto H, Huang R (2006) The mouse cerebellum from one to thirty-four months: parallel fibers. Neurobiol Aging 27:1715–1718. [DOI] [PubMed] [Google Scholar]
- Jaatinen P, Rintala J (2008) Mechanisms of ethanol-induced degeneration in the developing, mature, and aging cerebellum. Cerebellum 7:332–347. [DOI] [PubMed] [Google Scholar]
- Johnston LD, O’Malley PM, Bachman JG (1991) Drug Use Among American High School Seniors, College Students and Young Adults, 1975–1990. Vol. I: High School Seniors. (DHHS Publication No. ADM 91–1813) Superintendent of Documents, U.S. Government Printing Office, Washington, DC. [Google Scholar]
- Johnston LD, O’Malley PM, Bachman JG (1993) National Survey Results on Drug Use from the Monitoring the Future Study, 1975–1992. Vol. I: Secondary School Students (NIH Publication No. 93–3597) National Institute on Drug Abuse, Rockville, MD. [Google Scholar]
- Johnston LD, O’Malley PM, Bachman JG (1999) National Survey Results on Drug Use from the Monitoring the Future Study, 1975–1997. Vol. I: Secondary School Students (NIH Publication No. 98–4345) National Institute on Drug Abuse, Rockville, MD. [Google Scholar]
- Johnston LD, O’Malley PM, Bachman JG (2003) National Survey Results on Drug Use from the Monitoring the Future Study, 1975–2002. Vol. I: Secondary School Students (NIH Publication No. 03–5375) National Institute on Drug Abuse, Bethesda, MD. [Google Scholar]
- Johnston LD, O’Malley PM, Bachman JG, Schulenberg JE (2008) National Survey Results on Drug Use from the Monitoring the Future Study, 1975–2007. Vol. I: Secondary School Students (NIH Publication No. 08–6418A) National Institute on Drug Abuse, Bethesda, MD. [Google Scholar]
- Kashem MA, Estages HD, Kopitar-Jerala N, McGregor IS, Matsumoto I (2009) Differential protein expression in the corpus callosum (body) of human alcoholic brain. J Neurochem 110:486–495. [DOI] [PubMed] [Google Scholar]
- Kashem MA, Harper C, Matsumoto I (2008) Differential protein expression in the corpus callosum (genu) of human alcoholics. Neurochem Int 53:1–11. [DOI] [PubMed] [Google Scholar]
- Kelly SJ, Leggett DC, Cronise K (2009) Sexually dimorphic effects of alcohol exposure during development on the processing of social cues. Alcohol Alcohol 44:555–560. [DOI] [PMC free article] [PubMed] [Google Scholar]
- Kim SJ, Lee JW, Jung YS, Kwon DY, Park HK, Ryu CS, Kim SK, Oh GT, Kim YC (2009) Ethanol-induced liver injury and changes in sulfur amino acid metabolomics in glutathione peroxidase and catalase double knockout mice. J Hepatol 50:1184–1191. [DOI] [PubMed] [Google Scholar]
- Lallemand F, Ward RJ, De Witte P (2009) The influence of chronic nicotine administration on behavioural and neurochemcial parameters in male and female rats after repeated binge drinking exposure. Alcohol Alcohol 44:535–546. [DOI] [PubMed] [Google Scholar]
- Lenroot RK, Giedd JN (2006) Brain development in children and adolescents: insights from anatomical magnetic resonance imaging. Neurosci Biobehav Rev 30:718–729. [DOI] [PubMed] [Google Scholar]
- Linsenbardt DN, Moore EM, Gross CD, Goldfarb KJ, Blackman LC, Boehm SL II (2009) Sensitivity and tolerance to the hypnotic and ataxic effects of ethanol in adolescent and adult C57BL/6J and DBA/2J mice. Alcohol Clin Exp Res 33:464–476. [DOI] [PMC free article] [PubMed] [Google Scholar]
- Liu J, Lewohl JM, Harris RA, Dodd PR, Mayfield RD (2007) Altered gene expression profiles in the frontal cortex of cirrhotic alcoholics. Alcohol Clin Exp Res 31:1460–1466. [DOI] [PubMed] [Google Scholar]
- Liu J, Lewohl JM, Harris RA, Iyer VR, Dodd PR, Randall PK, Mayfield RD (2006) Patterns of gene expression in the frontal cortex discriminate alcoholic from nonalcoholic individuals. Neuropsychopharmacology 30:1574–1582. [DOI] [PubMed] [Google Scholar]
- Maldonado AM, Finkbeiner LM, Kirstein CL (2008) Social interaction and partner familiarity differentially alter voluntary ethanol intake in adolescent male and female rats. Alcohol 42:641–648. [DOI] [PubMed] [Google Scholar]
- Maldonado-Devincci AM, Badanich KA, Kirstein CL (2010) Alcohol during adolescence selectively alters immediate and long-term behavior and neurochemistry. Alcohol 44:57–66. [DOI] [PMC free article] [PubMed] [Google Scholar]
- Mayfield RD, Lewohl JM, Dodd PR, Herlihy A, Liu J, Harris RA (2002) Patterns of gene expression are altered in the frontal and motor cortices of human alcoholics. J Neurochem 81:802–813. [DOI] [PubMed] [Google Scholar]
- McBride WJ, Li T-K (1998) Animal models of alcoholism: neurobiology of high alcohol-drinking behavior in rodents. Crit Rev Neurobiol 12:339–369. [DOI] [PubMed] [Google Scholar]
- Miller ET, Turner AP, Marlatt GA (2001) The harm reduction approach to the secondary prevention of alcohol problems in adolescents and young adults: considerations across a developmental spectrum, in Adolescents, Alcohol, and Substance Abuse: Reaching Teens Through Brief Interventions (Monti PM, Colby SM, O’Leary TA eds), pp 58–79. Guilford Press, New York, NY. [Google Scholar]
- Miller MA, Weafer J, Fillmore MT (2009) Gender differences in alcohol impairment of simulated driving performance and driving-related skills. Alcohol Alcohol 44:586–593. [DOI] [PMC free article] [PubMed] [Google Scholar]
- Moore EM, Mariani JN, Linsenbardt DN, Melon LC, Boehm SL II (2010) Adolescent C57BL/6J (but not DBA/2J) mice consume greater amounts of limited-access ethanol compared to adults and display continued elevated ethanol intake into adulthood. Alcohol Clin Exp Res 34:1–9. [DOI] [PMC free article] [PubMed] [Google Scholar]
- Murphy JM, Stewart RB, Bell RL, Badia-Elder NE, Carr LG, McBride WJ, Lumeng L, Li T-K (2002) Phenotypic and genotypic characterization of the Indiana University rat lines selectively bred for high and low alcohol preference. Behav Genet 32:363–388. [DOI] [PubMed] [Google Scholar]
- National Institute on Alcohol Abuse and Alcoholism (2007) Underage drinking—highlights from The Surgeon General’s Call to Action to Prevent and Reduce Underage Drinking. Alcohol Alert; 73:1–5. Available at: http://pubs.niaaa.nih.gov/publications/AA73/AA73.htm. Accessed on February 16, 2012. [Google Scholar]
- Nelson CB, Heath AC, Kessler RC (1998) Temporal progression of alcohol dependence symptoms in the U.S. household population: results from the National Comorbidity Survey. J Consult Clin Psychol 66:474–483. [DOI] [PubMed] [Google Scholar]
- Nixon K, Morris SA, Liput DJ, Kelso ML (2010) Roles of neural stem cells and adult neurogenesis in adolescent alcohol use disorders. Alcohol 44: 39–56. [DOI] [PMC free article] [PubMed] [Google Scholar]
- Odell WD (1990) Sexual maturation in the rat, in Control of the Onset of Puberty (Grumbach MM, Sizonenko PC, Aubert ML eds), pp 183–210. Williams and Wilkins, Baltimore, MD. [Google Scholar]
- Pfefferbaum A, Adalsteinsson E, Sood R, Mayer D, Bell R, McBride W, Li T, Sullivan EV (2006a) Longitudinal brain magnetic resonance imaging study of the alcohol-preferring rat. Part II: effects of voluntary chronic alcohol consumption. Alcohol Clin Exp Res 30:1248–1261. [DOI] [PubMed] [Google Scholar]
- Pfefferbaum A, Adalsteinsson E, Sullivan EV (2006b) Dysmorphology and microstructural degradation of the corpus callosum: interaction of age and alcoholism. Neurobiol Aging 27:994–1009. [DOI] [PubMed] [Google Scholar]
- Pfefferbaum A, Adalsteinsson E, Sullivan EV (2006c) Supratentorial profile of white matter microstructural integrity in recovering alcoholic men and women. Biol Psychiatry 59:364–372. [DOI] [PubMed] [Google Scholar]
- Pfefferbaum A, Mathalon DH, Sullivan EV, Rawles JM, Zipursky RH, Lim KO (1994) A quantitative magnetic resonance imaging study of changes in brain morphology from infancy to late adulthood. Arch Neurol 51:874–887. [DOI] [PubMed] [Google Scholar]
- Pfefferbaum A, Sullivan EV (2005) Disruption of brain white matter microstructure by excessive intracellular and extracellular fluid in alcoholism: evidence from diffusion tensor imaging. Neuropsychopharmacology 30:423–432. [DOI] [PubMed] [Google Scholar]
- Quine S, Stephenson JA (1990) Predicting smoking and drinking intentions and behavior of pre-adolescents: the influence of parents, siblings, and peers. Family Sys Med 8:191–200. [Google Scholar]
- Rakic P, Bourgeois JP, Goldman-Rakic PS (1994) Synaptic development of the cerebral cortex: implications for learning, memory, and mental illness, in Prog Brain Res 102: The Self-Organizing Brain: From Growth Cones to Functional Networks (van Pelt J, Corner NA, Uylings HBM, Lopers de Silva FH eds), pp 227–243. Elsevier, Amsterdam. [DOI] [PubMed] [Google Scholar]
- Research Society on Alcoholism (2009) Impact of Alcoholism and Alcohol Induced Disease on America. Research Society on Alcoholism, Austin, TX. [Google Scholar]
- Ridge JP, Ho AM-C, Dodd PR (2009) Sex differences in NMDA receptor expression in human alcoholics. Alcohol Alcohol 44:594–601. [DOI] [PMC free article] [PubMed] [Google Scholar]
- Riley EP, Mattson SN, Sowell ER, Jernigan TL, Sobel DF, Jones KL (1995) Abnormalities of the corpus callosum in children prenatally exposed to alcohol. Alcohol Clin Exp Res 19:1198–1202. [DOI] [PubMed] [Google Scholar]
- Riley HH, Zalud AW, Diaz-Granados JL (2010) The influence of a chronic adolescent nicotine exposure on ethanol withdrawal severity during adulthood in C3H mice. Alcohol 44:81–87. [DOI] [PMC free article] [PubMed] [Google Scholar]
- Ristuccia RC, Spear LP (2008) Autonomic responses to ethanol in adolescent and adult rats: a dose-response analysis. Alcohol 42:623–629. [DOI] [PMC free article] [PubMed] [Google Scholar]
- Rodd-Henricks ZA, Bell RL, Kuc KA, Murphy JM, McBride WJ, Lumeng L, Li T-K (2002a) Effects of ethanol exposure on subsequent acquisition and extinction of ethanol self-administration and expression of alcohol-seeking behavior in adult alcohol-preferring (P) rats. I. Periadolescent exposure. Alcohol Clin Exp Res 26:1632–1641. [DOI] [PubMed] [Google Scholar]
- Rodd-Henricks ZA, Bell RL, Kuc KA, Murphy JM, McBride WJ, Lumeng L, Li T-K (2002b) Effects of ethanol exposure on subsequent acquisition and extinction of ethanol self-administration and expression of alcohol-seeking behavior in adult alcohol-preferring (P) rats. II. Adult exposure. Alcohol Clin Exp Res 26:1642–1652. [DOI] [PubMed] [Google Scholar]
- Rubia K, Overmeyer S, Taylor E, Brammer M, Williams SCR, Simmons A, Andrew C, Bullmore ET (2000) Functional frontalisation with age: mapping neurodevelopmental trajectories with fMRI. Neurosci Biobehav Rev 24:13–19. [DOI] [PubMed] [Google Scholar]
- Segalowitz SJ, Davies PL (2004) Charting the maturation of the frontal lobe: an electrophysiological strategy. Brain Cogn 55:116–133. [DOI] [PubMed] [Google Scholar]
- Sowell ER, Peterson BS, Thompson PM, Welcome SE, Henkenius AL, Toga AW (2003) Mapping cortical change across the human life span. Nat Neurosci 6:309–315. [DOI] [PubMed] [Google Scholar]
- Sowell ER, Thompson PM, Holmes CJ, Bath R, Jernigan TL, Toga AW (1999) Localizing age-related changes in brain structure between childhood and adolescence using statistical parametric mapping. Neuroimage 9:587–597. [DOI] [PubMed] [Google Scholar]
- Sowell ER, Thompson PM, Leonard CM, Welcome SE, Kan E, Toga AW (2004) Longitudinal mapping of cortical thickness and brain growth in normal children. J Neurosci 24:8223–8231. [DOI] [PMC free article] [PubMed] [Google Scholar]
- Spear LP (2000) The adolescent brain and age-related behavioral manifestations. Neurosci Biobehav Rev 24:417–463. [DOI] [PubMed] [Google Scholar]
- Spear LP (2004a) Adolescent brain development and animal models. AnnNY Acad Sci 1021:23–26. [DOI] [PubMed] [Google Scholar]
- Spear LP (2004b) Adolescence and the trajectory of alcohol use: introduction to part IV. Ann NY Acad Sci 1021:202–205. [DOI] [PubMed] [Google Scholar]
- Spear LP (2007) The developing brain and adolescent-typical behavior patterns: an evolutionary approach, in Adolescent Psychopathology and the Developing Brain (Romer D, Walker EF eds), pp 9–30. Oxford University Press, New York, NY. [Google Scholar]
- Spear LP, Brake SC (1983) Periadolescence: age-dependent behavior and psychopharmacological responsivity in rats. Dev Psychobiol 16:83–109. [DOI] [PubMed] [Google Scholar]
- Spear LP, Varlinskaya EI (2006) Adolescence: alcohol sensitivity, tolerance, and intake, in Alcohol Problems in Adolescents and Young Adults (Galanter M ed), pp 143–159. Springer, New York, NY. [PubMed] [Google Scholar]
- Sullivan EV (2003) Compromised pontocerebellar and cerebellothalamocortical systems: speculations on their contributions to cognitive and motor impairment in nonamnesic alcoholism. Alcohol Clin Exp Res 27:1409–1419. [DOI] [PubMed] [Google Scholar]
- Sullivan EV, Adalsteinsson E, Sood R, Mayer D, Bell R, McBride W, Li T, Pfefferbaum A (2006) Longitudinal brain magnetic resonance imaging study of the alcohol-preferring rat. Part II: adult brain growth. Alcohol Clin Exp Res 30:1234–1248. [DOI] [PubMed] [Google Scholar]
- Tabbaa S, Dlugos C, Pentney R (1999) The number of granule cells and spine density on Purkinje cells in aged, ethanol-fed rats. Alcohol 17:253–260. [DOI] [PubMed] [Google Scholar]
- Truxell EM, Molina JC, Spear NE (2007) Ethanol intake in the juvenile, adolescent, and adult rat: effects of age and prior exposure to ethanol. Alcohol Clin Exp Res 31:755–765. [DOI] [PubMed] [Google Scholar]
- Vetter CS, Doremus-Fitzwater TL, Spear LP (2007) Time course of elevated ethanol intake in adolescent relative to adult rats under continuous, voluntary-access conditions. Alcohol Clin Exp Res 31:1159–1168. [DOI] [PMC free article] [PubMed] [Google Scholar]
- Vetter-O’Hagen C, Varlinskaya E, Spear L (2009) Sex differences in ethanol intake and sensitivity to aversive effects during adolescence and adulthood. Alcohol Alcohol 44:547–554. [DOI] [PMC free article] [PubMed] [Google Scholar]
- Wechsler H, Lee JE, Kuo M, Lee H (2000a) College binge drinking in the 1990s: a continuing problem. Results of the Harvard School of Public Health 1999 College Alcohol Study. J Am Coll Health 48:199–210. [DOI] [PubMed] [Google Scholar]
- Winters KC (2001) Assessing adolescent substance abuse problems and other areas of functioning: state of the art, in Adolescents, Alcohol, and Substance Abuse: Reaching Teens Through Brief Interventions (Monti PM, Colby SM, O’Leary TA eds), pp 80–108. Guilford Press, New York, NY. [Google Scholar]
- Witt ED (1994) Mechanisms of alcohol abuse and alcoholism in adolescents: a case for developing animal models. Behav Neural Biol 62:168–177. [DOI] [PubMed] [Google Scholar]
- Witt ED (2006) Neurobiology, in Alcohol Problems in Adolescents and YoungAdults (Galanter M ed), pp 119–122. Springer, New York, NY. [Google Scholar]
- Witt ED (2010) Research on alcohol and adolescent brain development: opportunities and future directions. Alcohol 44:119–124. [DOI] [PubMed] [Google Scholar]
- Zou H, Xie Q, Zhang M, Zhang C, Zhao G, Jin M, Yu L (2009) Chronic alcohol consumption from adolescence to adulthood in mice—effect on growth and social behavior. Drug Alcohol Depend 104:119–125. [DOI] [PMC free article] [PubMed] [Google Scholar]