

Abstract
The Coronaviridae are a family of viruses that cause disease in humans ranging from mild respiratory infection to potentially lethal acute respiratory distress syndrome. Finding host factors common to multiple coronaviruses could facilitate the development of therapies to combat current and future coronavirus pandemics. Here, we conducted genome-wide CRISPR screens in cells infected by SARS-CoV-2 as well as two seasonally circulating common cold coronaviruses, OC43 and 229E. This approach correctly identified the distinct viral entry factors ACE2 (for SARS-CoV-2), aminopeptidase N (for 229E), and glycosaminoglycans (for OC43). Additionally, we identified phosphatidylinositol phosphate biosynthesis and cholesterol homeostasis as critical host pathways supporting infection by all three coronaviruses. By contrast, the lysosomal protein TMEM106B appeared unique to SARS-CoV-2 infection. Pharmacological inhibition of phosphatidylinositol kinases and cholesterol homeostasis reduced replication of all three coronaviruses. These findings offer important insights for the understanding of the coronavirus life cycle and the development of host-directed therapies.
Keywords: SARS-CoV-2, COVID-19, 229E, OC43, coronavirus, CRISPR, virus-host interactions, host factors, host-targeted antivirals, genetic screen
Graphical Abstract
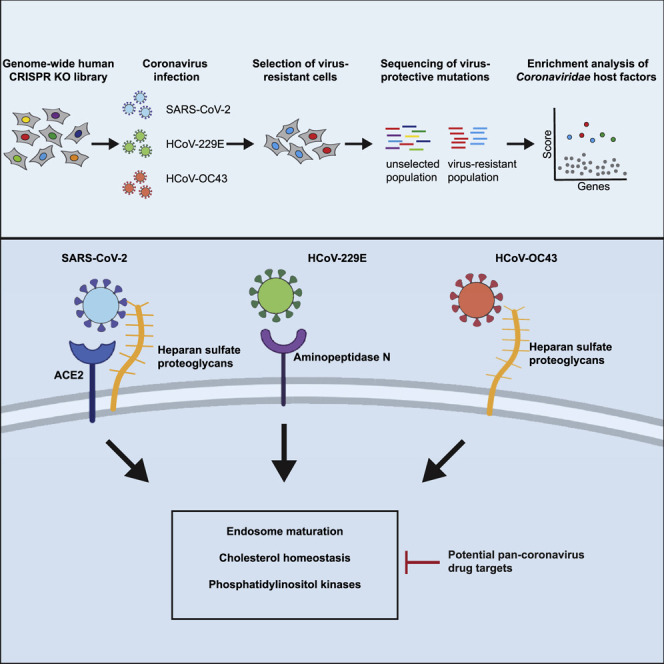
To identify host factors required for the infection with SARS-CoV-2 and the common cold coronaviruses OC43 and 229E, Wang et al. conduct genome-wide CRISPR knockout screens. In addition to virus-specific entry factors, they uncover shared host pathways, including cholesterol homeostasis and phosphatidylinositol kinases, required for the infection with all three viruses and demonstrate that pharmacological inhibition of these pathways exhibits pan-coronavirus antiviral activity.
Introduction
The Coronaviridae family includes seven known human pathogens for which there are no approved vaccines and only limited therapeutic options. The seasonally circulating human coronaviruses (HCoV) OC43, HKU1, 229E, and NL63 cause mild, common cold-like respiratory infections in humans (van der Hoek, 2007). However, three highly pathogenic coronaviruses emerged in the last two decades, highlighting the pandemic potential of this viral family (Drosten et al., 2003; Wu et al., 2020; Zaki et al., 2012). Infection with severe acute respiratory syndrome coronavirus 1 (SARS-CoV-1) and Middle East respiratory syndrome coronavirus (MERS-CoV) can lead to acute respiratory distress syndrome and death, with fatality rates between 10%–40% (Petersen et al., 2020). SARS-CoV-2, though less deadly, is far more transmissible than SARS-CoV-1 and MERS-CoV and has been responsible for over 50 million cases and 1.2 million deaths globally as of November 2020 (Dong et al., 2020; Petersen et al., 2020). Because of the severity of their impact on global health, it is critical to understand how SARS-CoV-2 and other coronaviruses hijack the host cell machinery during infection and apply this knowledge to develop new therapeutic strategies.
Coronaviruses are enveloped, positive-sense single-stranded RNA viruses with a genome length of approximately 30 kb. Upon receptor binding and membrane fusion, the viral RNA is released into the cytoplasm, where it is translated to produce viral proteins. Subsequently, the viral replication/transcription complexes form on double-membrane vesicles and generate genome copies. These are then packaged into new virions via a budding process, through which they acquire the viral envelope, and the resulting virions are released from infected cells (Fung and Liu, 2019). During these steps, specific cellular proteins are hijacked and play crucial roles in the viral life cycle. For example, the angiotensin-converting enzyme 2 (ACE2) is exploited as the viral entry receptor for NL63, SARS-CoV-1, and SARS-CoV-2 (Hofmann et al., 2005; Letko et al., 2020; Li et al., 2003). Additionally, cellular proteases, such as TMPRSS2, cathepsin L, and furin, are important for the cleavage of the viral spike (S) protein of several coronaviruses thereby mediating efficient membrane fusion with host cells (Bertram et al., 2013; Hoffmann et al., 2020b; 2020c; Shirato et al., 2013; Simmons et al., 2005). Systematic studies have illuminated virus-host interactions during the later steps of the viral life cycle. For example, proteomics approaches revealed comprehensive interactomes between individual coronavirus proteins and cellular proteins (Gordon et al., 2020a; 2020b; Stukalov et al., 2020). Additionally, biotin labeling identified candidate host factors based on their proximity to coronavirus replicase complexes (V’kovski et al., 2019). While these studies uncovered physical relationships between viral and cellular proteins, they do not provide immediate information about the importance of these host components for viral replication.
An orthogonal strategy is to screen for mutations that render host cells resistant to viral infection using CRISPR-based mutagenesis. These screens identify host factors that are functionally required for viral infection and could be targets for host-directed therapies (Puschnik et al., 2017). In this study, we have performed a genome-wide CRISPR knockout (KO) screen using SARS-CoV-2 (USA/WA-1 isolate) in human cells. Importantly, we expanded our functional genomics approach to distantly related Coronaviridae members in order to probe for commonalities and differences across the family. This strategy can reveal potential pan-coronavirus host factors and thus illuminate targets for antiviral therapy to combat the current and potential future outbreaks. We conducted comparative CRISPR screens for SARS-CoV-2 and two seasonally circulating common cold coronaviruses, OC43 and 229E. Our results corroborate previously implicated host pathways, uncover new aspects of virus-host interaction, and identify targets for host-directed antiviral treatment.
Results
CRISPR KO Screens Identify Common and Virus-Specific Candidate Host Factors for Coronavirus Infection
Phenotypic selection of virus-resistant cells in a pooled CRISPR KO screen is based on survival and growth differences of mutant cells upon virus infection. We chose Huh7.5.1 hepatoma cells as they were uniquely susceptible to all tested coronaviruses. We readily observed drastic cytopathic effect during OC43 and 229E infection (Figure S1 A). Huh7.5.1 also supported SARS-CoV-2 replication but exhibited limited virus-induced cell death (Figures S1B and S1C). To improve the selection conditions for the SARS-CoV-2 CRISPR screen, we overexpressed ACE2 and/or TMPRSS2, which are present at low levels in wild-type (WT) Huh7.5.1 cells (Figure S1D). This led to increased viral uptake of a SARS-CoV-2 S-pseudotyped lentivirus, confirming the important function of ACE2 and TMPRSS2 for SARS-CoV-2 entry (Figure S1E). We ultimately used Huh7.5.1 cells harboring a bicistronic ACE2-IRES-TMPRSS2 construct for the SARS-CoV-2 screen as these cells sustained efficient infection that led to widespread cell death while still allowing the survival of a small number of cells (Figures S1C and S1F). The generated CRISPR KO libraries in Huh7.5.1 and Huh7.5.1-ACE2-IRES-TMPRSS2 cells had virtually complete single-guide RNA (sgRNA) representation prior to the start of the virus challenge but, as expected, were depleted of cells containing sgRNAs against commonly essential fitness genes within 7 days post-library transduction (Figures S1G and S1H) (Hart et al., 2015).
Figure S1.

Optimization of Phenotypic Selection of Coronavirus-Infected Huh7.5.1 Cells and Quality Control Metrics for CRISPR Screens, Related to Figure 1
(A) Light microscopy images of WT Huh7.5.1 infected with OC43 (7 dpi) and 229E (4 dpi).
(B) Quantification of SARS-CoV-2 RNA in WT Huh7.5.1 cells at 24 and 72 hpi by RT-qPCR. Cq values represent mean ± SEM from 3 biological replicates.
(C) Light microscopy images of SARS-CoV-2 infected WT Huh7.5.1 cells or Huh7.5.1 cells expressing ACE2-IRES-TMPRSS2 at 3 and 7 dpi.
(D) Quantification of ACE2 and TMPRSS2 expression in WT and lentivirally transduced Huh7.5.1 cells by RT-qPCR and western blot. mRNA levels are displayed as means ± SEM from two independent sample collections and are relative to expression in WT cells. Anti-ACE2 and anti-TMPRSS2 antibodies were used to detect protein levels in WT and overexpression cells. GAPDH was used as loading control. Molecular weight markers are indicated on the left.
(E) Quantification of infection with pseudotyped lentivirus bearing SARS-CoV-2 spike and expressing GFP by flow cytometry. Values are from two biological samples and are displayed as means ± s.d.
(F) Quantification of cell survival by measuring cell number of mock or SARS-CoV-2 infected Huh7.5.1-ACE2-IRES-TMPRSS2 cells (moi = 0.01) at 3 dpi. Values are from two independent wells and are displayed as means ± s.d.
(G) sgRNA representation and distribution in the genome-wide CRISPR KO libraries at day 7 post-transduction (prior to coronavirus infection). Reads for each sgRNA were normalized to the total number of reads.
(H) Gene-level log fold changes (LFCs) between the lentiviral CRISPR library transduced into target cells at day 0 and the KO library cell population at day 7 post-transduction (x axis) versus gene-level LFCs between the KO library cell population at day 7 post-transduction (prior to virus infection) and after phenotypic selection by coronavirus infection (y axis). Gene knockouts showing growth defects in absence of virus challenge are highlighted in red.
(I) LFCs for the individual sgRNAs for the top 10 scoring genes from each CRISPR screen between the starting cell populations and the virus-selected cell populations. Overall sgRNA distribution is shown at the bottom of the graph and dotted line indicates mean LFC of all sgRNAs.
The three CRISPR screens—for resistance to SARS-CoV-2, 229E, and OC43—identified a compendium of critical host factors across the human genome (Figure 1 A; Table S1). The overall performance of the screens was robust as indicated by the enrichment of multiple individual sgRNAs against the top 10 scoring genes from each screen (Figure S1I). Importantly, the known viral entry receptors ranked among the top hits: ACE2 for SARS-CoV-2 and aminopeptidase N (ANPEP) for 229E (Figures 1B and 1C) (Letko et al., 2020; Yeager et al., 1992). OC43, unlike the other coronaviruses, does not have a known proteinaceous receptor but primarily depends on sialic acid or glycosaminoglycans for cell entry (Hulswit et al., 2019; Ströh and Stehle, 2014); consistent with this fact, multiple heparan sulfate biosynthetic genes (B3GALT6, B3GAT3, B4GALT7, EXT1, EXT2, EXTL3, FAM20B, NDST1, SLC35B2, UGDH, XYLT2) were identified in our OC43 screen (Figures 1D and S2 A). Several of these genes were also markedly enriched in the SARS-CoV-2 screen (Figures 1B and S2A), which is consistent with a recent report that SARS-CoV-2 requires both ACE2 and cellular heparan sulfate for efficient infection (Clausen et al., 2020). Overall, the identification of the expected entry factors validates the phenotypic selection of our host factor screens.
Figure 1.

Genome-wide Loss-of-Function Screens in Human Cells Identify Host Factors Important for Infection by SARS-CoV-2, 229E, and OC43
(A) Schematic of CRISPR-based KO screens for the identification of coronavirus host factors. Huh7.5.1-Cas9 (with bicistronic ACE2-IRES-TMPRSS2 construct for SARS-CoV-2 and without for 229E and OC43 screen) were mutagenized using a genome-wide single-guide RNA (sgRNA) library. Mutant cells were infected with each coronavirus separately and virus-resistant cells were harvested 10–14 days post infection (dpi). The abundance of each sgRNA in the starting and selected population was determined by high-throughput sequencing and a gene enrichment analysis was performed.
(B) Gene enrichment for CRISPR screen of SARS-CoV-2 infection. Enrichment scores were determined by MaGECK analysis and genes were colored by biological function. Dotted line indicates −log10(Enrichment Score) = 4. The SARS-CoV-2 screen was performed once. All genes and their enrichment scores can be found in Table S1.
(C) Gene enrichment for CRISPR screen of 229E infection. The 229E screen was performed twice and combined MaGECK scores are displayed.
(D) Gene enrichment for CRISPR screen of OC43 infection. The OC43 screen was performed twice and combined MaGECK scores are displayed.
Figure S2.

Comparison of CRISPR Screens Reveals Common and Distinct Host Factors across SARS-CoV-2, 229E, and OC43, Related to Figure 1
(A) CRISPR screen ranking of genes (according to MaGECK enrichment scores in Table S1) clustered in specific cellular pathway or complexes across the three CRISPR screens.
(B) Pairwise comparisons of gene enrichments between CRISPR screens. Dotted lines indicate -log10(Enrichment score) = 3. Genes that scored above the threshold in both screens are highlighted in red.
(C) Representation of the 332 high-confidence SARS-CoV-2 protein-protein interactome hits from (Gordon et al., 2020a) (highlighted in red) within the ranked CRISPR screen data for SARS-CoV-2, OC43 and 229E infection. Gene labels are added for interactome hits that scored in the top 500 of the CRISPR screens.
Gene Ontology (GO) enrichment analysis for each screen found a number of cellular processes to be important for multiple coronaviruses. These processes included proteoglycan and aminoglycan biosynthesis, vacuolar and lysosomal transport, autophagy, Golgi vesicle transport, and phosphatidylinositol metabolic processes (Figure 2 A; Table S2).
Figure 2.

Gene Ontology Analysis and Network Propagation Highlight Pathways and Biological Networks Important for Coronavirus Infection
(A) Gene Ontology (GO) enrichment analysis was performed on significant hits from the individual CRISPR screens (MaGECK enrichment score ≤ 0.005). p values were calculated by hypergeometric test and a false discovery rate was used to account for multiple hypothesis testing. The top GO terms of each screen were selected for visualization. A complete list of significant GO terms can be found in Table S2.
(B) Data integration pipeline for network propagation of identified host factor genes. Unthresholded CRISPR screen enrichment scores served as initial gene labels for network propagation using Pathway Commons. Separately propagated networks were integrated gene-wise (via multiplication) to identify biological networks that are shared between all three datasets. Genes found to be significant in the propagation were extracted, clustered into smaller subnetworks, and annotated using GO enrichment analysis (see STAR Methods).
(C) Selected biological subnetwork clusters from network propagation. Cluster title indicates the most significant biological function(s) for each cluster. Circle size represents p value from network propagation permutation test (see STAR Methods and Table S3). The original enrichment score of a gene in each CRISPR screen is indicated by color scale within the circle. The entire set of identified clusters is displayed in Figure S3A. (#) is the cluster number, which refers to the GO enrichment analysis of biological processes in Figure S3B and Table S2.
In the phosphatidylinositol metabolic process, the SARS-CoV-2 screen identified VAC14, which is part of the PIKfyve kinase complex (Figure 1B). PIKFYVE itself was moderately enriched in the SARS-CoV-2 screen (Figure S2A). This complex catalyzes the conversion of phosphatidylinositol-3-phosphate to phosphatidylinositol-3,5-bisphosphate, which is localized to late endosomes (Shisheva, 2012). Interestingly, the CRISPR screens with 229E and OC43 identified the subunits (PIK3C3, UVRAG, BECN1, and PIK3R4) of the class III phosphatidylinositol 3-kinase (PI3K) complex, which generates the precursor phosphatidylinositol-3-phosphate in early endosome membranes (Figures 1C, 1D, and S2A) (Bilanges et al., 2019). Taken together, our data highlight different steps of the phosphatidylinositol biosynthetic pathway, which regulates endocytic sorting, endomembrane homeostasis, and autophagy, to be critical for the life cycle of all three and possibly all coronaviruses.
Another group of genes found in all three CRISPR screens is linked to cholesterol metabolism. The SARS-CoV-2-resistant cell population contained multiple KOs of genes in the sterol regulatory element-binding protein (SREBP) pathway (SCAP, MBTPS1, MBTPS2) (Figures 1B and S2A) (Brown et al., 2018). SCAP is an escort protein for the transport of the transcription factors SREBF1 and SREBF2 from the ER to the Golgi in response to low levels of cholesterol. In the Golgi, the SREBF proteins are sequentially cleaved by the proteases MBTPS1 and MBTPS2. Subsequently, the transcription factors translocate to the nucleus to activate fatty acid and cholesterol biosynthesis. SREBF1 and SREBF2 themselves did not score in the screen, potentially due to their functional redundancy. LDLR (low density lipoprotein receptor), important for cholesterol uptake, was enriched in both the SARS-CoV-2 and the 229E screen, while SCAP was also enriched in the OC43 screen (Figures S2A and S2B). Additionally, NPC1 (Niemann-Pick intracellular cholesterol transporter 1), which facilitates export of cholesterol from the endolysosomal compartment, ranked highly in the 229E screen (Figure 1C) (Höglinger et al., 2019). Overall, our data indicate a strong link between intracellular cholesterol levels and infection by all three coronaviruses.
Some genes were found in the OC43 and 229E screens but not in the SARS-CoV-2 screen. For instance, the common cold coronavirus screens showed a strong overlap of genes that are important for endosome and autophagosome maturation (Figures 1C, 1D, and S2B). These include RAB7A, components of the HOPS complex (encoded by VPS11, VPS16, VPS18, VPS33A), the Ccz1-Mon1 guanosine exchange factor complex (encoded by CCZ1, CCZ1B, C18orf8), genes expressing the WDR81-WDR91 complex, and other genes related to lysosome and autophagosome function (SPNS1, TOLLIP, TMEM41B, AMBRA1) (Balderhaar and Ungermann, 2013; Hegedűs et al., 2016; Hoffmann et al., 2020a; Katoh et al., 2004; Fimia et al., 2007; Moretti et al., 2018; Rapiteanu et al., 2016; Rong et al., 2011). We also identified cathepsin L (CTSL1) as well as the mannose-6-phosphate receptor (M6PR) and GNPTAB, which are important for proper trafficking of lysosomal enzymes from the trans-Golgi network (Flint et al., 2019; Saftig and Klumperman, 2009). Interestingly, the HOPS complex, cathepsins, GNPTAB, and SPNS1 were previously linked to Ebola virus entry, implying similar viral entry strategies (Carette et al., 2011; Flint et al., 2019).
The OC43 and 229E screens also uncovered KEAP1, the principal negative regulator of NRF2, whose activation restores cellular redox and protein homeostasis (Figures 1C and 1D) (Cuadrado et al., 2019). Activation of the NRF2 transcriptional program may induce a cellular state that is protective against coronavirus infection. Indeed, NRF2 agonists seem to elicit an antiviral response as demonstrated in cell culture and were proposed for SARS-CoV-2 treatment (Cuadrado et al., 2020; Olagnier et al., 2020).
In addition to genes that scored in multiple CRISPR screens, we also found genes that were only enriched in one screen. Several genes related to the Golgi apparatus were uncovered only in the 229E screen and may possibly have 229E-specific roles. Among them were GPR89A and GPR89B, which encode two highly homologous G protein coupled receptors important for Golgi acidification (Maeda et al., 2008), and NBAS and USE1, which play a role in Golgi-to-ER retrograde transport (Aoki et al., 2009). The exact role of these factors in coronavirus infection—and their specificity to 229E—remain to be determined.
The SARS-CoV-2 screen identified multiple subunits of the exocyst (EXOC1–8) (Figures 1B and S2A), an octameric protein complex that facilitates the tethering of secretory vesicles to the plasma membrane prior to SNARE-mediated fusion (Mei and Guo, 2018). This complex could therefore facilitate trafficking of virus particles during entry or egress or regulate surface expression of viral entry factors. The top hit of the SARS-CoV-2 screen was TMEM106B, a poorly characterized lysosomal transmembrane protein linked to frontotemporal dementia (Figure 1B) (Lüningschrör et al., 2020). Deletions in TMEM106B have been shown to cause defects in lysosome trafficking, impaired acidification, and reduced levels of lysosomal enzymes, but its precise molecular function remains enigmatic (Klein et al., 2017; Lüningschrör et al., 2020). TMEM106B KO could thus affect SARS-CoV-2 entry, although it is also possible to protect from virus-induced cell death at other stages of the life cycle.
Overall, the comparative CRISPR screen strategy provides a rich list of shared and distinct candidate host factors for subsequent validation and host-directed inhibition of coronavirus infection.
Network Propagation across Multiple CRISPR Screens Highlights Functional Biological Clusters Important for Coronavirus Infection
To expand upon our manual curated analysis, which highlighted top-scoring genes from each coronavirus screen, we employed a network propagation approach using the entirety of our unthresholded datasets to better understand the functional connections between the genes identified in our screens (Cowen et al., 2017). This approach allowed us to identify molecular networks that emerge from our datasets even if certain gene members fell below our top-scoring threshold. Network propagation is a powerful technique that uses a “guilt-by-association” approach to propagate biological signal within large networks (e.g., Pathway Commons) to identify interconnected neighborhood clusters or pathways. In addition to revealing the functional networks underlying a particular dataset, this approach can be especially useful for identifying converging molecular networks across datasets. Here, we used an integrative network propagation approach to identify subnetworks and pathways that were common across the three coronavirus screens (Figure 2B). Briefly, we propagated the unthresholded CRISPR screen enrichment scores from each coronavirus screen and utilized a statistical permutation test paired with network clustering methods to extract network neighborhoods implicated across all three coronavirus screens.
Propagations from the three CRISPR screens identified subnetworks most common to all three viruses and independently confirmed the biological processes highlighted as important for coronavirus infection in our previous analysis (Figures 2C, S3 A, and S3B; Tables S2 and S3). For instance, we found clusters linked to cholesterol metabolism (containing SCAP, MBTPS1, SREBF2, LDLR, and NPC1), endosome to lysosome transport (including the HOPS complex components VPS11, VPS16, VPS18, VPS33A, and VPS39), and glycoprotein biosynthetic processes (containing heparan sulfate biosynthesis genes). Another cluster reflected the critical role of autophagy/ phospholipid metabolism and indicated a functional link between VAC14 and subunits of the PI3K complex as described above.
Figure S3.

Network Propagation of CRISPR Screen Hits Reveals Functional Clusters with Distinct Biological Functions, Related to Figure 2
(A) Biological subclusters from network propagation. Cluster number refers to the enrichment analysis of biological processes for each cluster, displayed in Figure S3B. Circle size represents p value from integrative network propagation permutation test (see Methods and Table S3). The CRISPR screen enrichment score of a gene from each screen is indicated by color scale within the circle.
(B) Gene ontology (GO) enrichment analysis was performed on each subcluster from the network propagation. P values were calculated by hypergeometric test and a false-discovery rate was used to account for multiple hypothesis testing. The entire set of enriched biological processes for each subcluster is listed in Table S2.
Moreover, network propagation also identified previously unappreciated biological functions, such as steroid hormone signaling, cell-cell adhesion, metal ion transport, intra-Golgi vesicle transport, snare complex assembly, Rab protein signal transduction, peroxisomal transport, and mRNA splicing (Figures 2C, S3A, and S3B; Tables S2 and S3). Interestingly, some of these processes were also implicated by recent coronavirus interactome studies (Gordon et al., 2020a; 2020b). We therefore additionally compared our CRISPR screen results with the hits from the SARS-CoV-2 interactome revealing SCAP, several Rab proteins, and HOPS complex subunits as functionally relevant for infection as well as interactors with viral proteins (Figure S2C). Altogether, the network propagation and cross-comparison with the protein interaction network highlighted numerous distinct cellular processes that may have critical roles during coronavirus infection.
KO of Candidate Host Factor Genes Reduces Coronavirus Replication
To validate the candidate genes from the SARS-CoV-2 screen, we generated individual KO cells in three cell types. We introduced gene deletions for several top hits in A549 lung epithelial cells transduced with ACE2 (A549-ACE2) using Cas9 ribonucleoproteins (RNPs), resulting in high indel frequencies (Table S4). SARS-CoV-2 RNA levels were markedly reduced in A549-ACE2 cells that contained mutations in ACE2; ADP Ribosylation Factor 5 (ARF5); multiple subunits of the exocyst (EXOC2, EXOC6, EXOC8); the cholesterol homeostasis genes SCAP, MBTPS1, and MBTPS2; the phosphatidylinositol kinase complex genes PIKFYVE and VAC14; or TMEM106B (Figure 3 A). Next, we lentivirally introduced Cas9 and sgRNAs against a subset of these genes (TMEM106B, VAC14, SCAP, MBTPS2, EXOC2) into Calu-3 lung epithelial cells with endogenous ACE2 levels and also observed reduced viral replication compared to control cells harboring a non-targeting sgRNA (Figure 3B).
Figure 3.

KO of Candidate Host Factor Genes Reduces Coronavirus Infection
(A) Quantitative reverse-transcriptase PCR (RT-qPCR) quantification of intracellular SARS-CoV-2 levels in RNP-edited A549-ACE2 cells. A non-targeting sgRNA was used as control. Cells were infected using MOI = 0.1 and harvested at 72 h post-infection (hpi).
(B) RT-qPCR quantification of intracellular SARS-CoV-2 levels in Calu-3 cells lentivirally transduced with Cas9/sgRNA cassettes targeting the indicated genes. A non-targeting sgRNA was used as control. Cells were infected using MOI = 0.1 and harvested at 48 hpi.
(C) RT-qPCR quantification of intracellular SARS-CoV-2 levels in WT Huh7.5.1, TMEM106B KO, or TMEM106B KO cells with TMEM106B cDNA add-back (AB). Cells were infected using MOI = 0.1 and harvested at 24 hpi.
(D) RT-qPCR quantification of intracellular SARS-CoV-2 levels in WT Huh7.5.1, VAC14 KO, or VAC14 KO cells with VAC14 cDNA AB. Cells were infected using MOI = 0.1 and harvested at 24 hpi.
(E) RT-qPCR quantification of intracellular SARS-CoV-2 levels in WT Huh7.5.1, SCAP KO, MBTPS2 KO, or EXOC2 KO cells. Cells were infected using MOI = 0.1 and harvested at 24 hpi.
(F) RT-qPCR quantification of intracellular OC43 and 229E RNA levels in WT and TMEM106B, VAC14, SCAP, MBTPS2, or EXOC2 KO Huh7.5.1 cells. Cells were infected using MOI = 0.05 (229E) and MOI = 3 (OC43) and harvested at 48 hpi.
(G–I) RT-qPCR quantification of intracellular viral RNA for (G) OC43, (H) 229E, or (I) SARS-CoV-2 in WT Huh7.5.1 cells or cell lines deficient in CCZ1B, RAB7A, VPS16, BECN1, PIK3R4, or UVRAG.
(J–L) RT-qPCR quantification of intracellular viral RNA for (J) SARS-CoV-2, (K) OC43, or (L) 229E in WT, PIK3R4 KO, or PIK3R4 KO cells with PIK3R4 cDNA AB.
(M–O) RT-qPCR quantification of intracellular viral RNA for (M) SARS-CoV-2, (N) OC43, or (O) 229E in WT, VPS16 KO, or VPS16 KO cells with VPS16 cDNA AB.
For SARS-CoV-2 infection, viral N gene transcripts were normalized to cellular RNaseP. For OC43 and 229E experiments, viral RNA was normalized to 18S RNA. For all RT-qPCR experiments, results are displayed relative to infection in WT cells, and data represent means ± SEM from three biological samples.
Lastly, we generated clonal Huh7.5.1 cells (without ACE2-IRES-TMPRSS2 overexpression) containing frameshift mutations in candidate genes, resulting in loss of protein expression (Figures S4 A and S4B). Deletion of TMEM106B and VAC14 decreased SARS-CoV-2 replication, and this effect was reversed by add-back (AB) of respective cDNAs (Figures 3C and 3D and S4B), confirming the role of these two factors in the SARS-CoV-2 life cycle. Similarly, knocking out SCAP, MBTPS2, or EXOC2 led to a decrease of SARS-CoV-2 RNA levels (Figure 3E). When we infected the same Huh7.5.1 KO cells with OC43 and 229E, we observed reduced viral replication in SCAP, MBTPS2, and EXOC2 KO cells but not in TMEM106B KO and only moderately in VAC14 KO cells (Figure 3F). This suggests that the latter genes are more rate-limiting in SARS-CoV-2 infection.
Figure S4.

Characterization of Gene-Edited Cells, Related to Figure 3
(A) Genotyping of clonal Huh7.5.1. Targeted loci were PCR-amplified, Sanger-sequenced and aligned to WT reference sequence. Frameshifts are highlighted in blue.
(B) Western blot analysis of WT, KO and KO cells with respective cDNA add-backs (AB) for TMEM106B, VAC14 and PIK3R4. Lysates to probe for TMEM106B were prepared under non-reducing conditions and bands appear as dimers. GAPDH was used as loading control.
(C) Cell viability measurement of 229E infected WT and KO Huh7.5.1 cells. Cells were infected with 229E (moi = 0.05) and viability was determined 8 dpi using Cell Titer Glo. Values are displayed as means ± SD from three biological samples.
(D) Cell viability measurement of OC43 infected WT and KO Huh7.5.1 cells. Cells were infected with OC43 (moi = 3) and viability was determined 8 dpi using Cell Titer Glo. Values are displayed as means ± SD from two biological samples.
(E) Analysis of cell proliferation of RNP-edited A549-ACE2 cells. Cells were plated in 96-wells and confluency was measured daily using an automated microscope. Values are displayed as means ± SD from four separate wells per cell line.
(F) Analysis of cell proliferation of WT and clonal KO Huh7.5.1 cells. Cells were plated in 96-wells and cell proliferation was measured daily using Cell Titer Glo. Values are displayed as means ± SD from three separate wells per cell line per time point.
Next, we probed Huh7.5.1 cells lacking genes involved in endosome maturation or the PI3K complex, which were initially found in the common cold coronavirus screens. We saw reduced viral replication for OC43 and 229E (Figures 3G and 3H). Additionally, we observed increased cell viability in all KO cells relative to WT Huh7.5.1 cells 8 days post infection (dpi) (Figures S4C and S4D), indicating that these genes are important for infection by the common cold viruses and for virus-induced cell death. We then tested whether the hits shared between OC43 and 229E affect SARS-CoV-2. Indeed, SARS-CoV-2 infection was reduced in cells lacking certain endosomal or PI3K genes in the context of Huh7.5.1 without ACE2-IRES-TMPRSS2, similar to the common cold coronaviruses (Figure 3I). Complementation of PIK3R4 and VPS16 KO cells with respective cDNAs restored SARS-CoV-2 and 229E and, to a lesser degree, OC43 replication levels (Figures 3J–3O and S4B). To rule out the possibility that decreased viral replication is not due to severe cellular growth defects, we measured proliferation of RNP-edited A549-ACE2 and clonal Huh7.5.1 KO cells. Apart from SCAP KO cells, we did not observe any notable growth differences compared to WT cells (Figures S4E and S4F).
Together, these experiments confirm that the host factors identified in our screens in Huh7.5.1 cells have functional roles for Coronaviridae, which are also relevant in lung epithelial cells. Furthermore, we demonstrated that important aspects of SARS-CoV-2 biology can be revealed by studying the common cold coronaviruses.
Compounds Directed at Host Factors Inhibit Coronavirus Replication
Host factors important for virus infection are potential targets for antiviral therapy. Host-directed therapy is advantageous as it allows pre-existing drugs to be repurposed, may provide broad-spectrum inhibition against multiple viruses, and is generally thought to be more refractory to viral escape mutations than drugs targeting viral factors (Bekerman and Einav, 2015). We therefore explored whether the cellular pathways identified in our screens could serve as targets for therapy against coronavirus infection.
Given the strong dependence of all three coronaviruses on PIK3R4, we tested SAR405, a selective and ATP-competitive inhibitor of class III PI3K (PIK3C3) (Ronan et al., 2014). The drug exhibited a dose-dependent effect against all three coronaviruses with low cytotoxicity in Huh7.5.1 cells, which is consistent with the reduced virus replication in PIK3R4 KO cells and suggests that SAR405 could serve as a pan-coronavirus inhibitor (Figures 4 A–4C). Given that VAC14, a PIKfyve complex component, was a strong hit in the SARS-CoV-2 screen, we also tested the PIKfyve inhibitor YM201636 and observed inhibition of SARS-CoV-2 replication (Figure S5 A) (Jefferies et al., 2008). Similar antiviral activity was previously demonstrated with apilimod, another PIKfyve inhibitor (Bouhaddou et al., 2020; Kang et al., 2020; Ou et al., 2020).
Figure 4.

Pharmacological Inhibition of Identified Host Factors Decreases Infection with SARS-CoV-2 and Common Cold Coronaviruses
(A–C) SAR405 (PI3K inhibitor) dose-response curves for (A) SARS-CoV-2, (B) 229E, and (C) OC43 replication in Huh7.5.1 cells and for cell viability of SAR405-treated cells.
(D–F) PF-429242 (MBTPS1 inhibitor) dose-response curves for (D) SARS-CoV-2, (E) 229E, and (F) OC43 replication in Huh7.5.1 cells and for cell viability of PF-429242 treated cells.
(G–I) 25-hydroxycholesterol (25-HC) dose-response curves for (G) SARS-CoV-2, (H) 229E, and (I) OC43 replication in Huh7.5.1 cells and for cell viability of 25-HC treated cells.
(J and K) Bardoxolone (KEAP1-NRF2 activator) dose-response curves for (J) SARS-CoV-2, (K) 229E, and (L) OC43 replication in Huh7.5.1 cells and for cell viability of Bardoxolone-treated cells.
For all experiments, compounds were added simultaneously with virus. Viral RNA was quantified after 24 hpi (SARS-CoV-2) or 48 hpi (229E and OC43) using RT-qPCR. SARS-CoV-2 RNA was normalized to RnaseP, and 229E and OC43 RNA was normalized to 18S RNA. Values represent means ± SEM relative to untreated cells. Cell viability was assessed in parallel in drug-treated, uninfected cells and is displayed as means ± SEM relative to DMSO or EtOH treated cells. Non-linear curves were fitted with least-squares regression using GraphPad Prism 8 and IC50 was determined. All experiments were performed in three biological replicates.
Figure S5.

Pharmacological Inhibition of Host Factors in Huh7.5.1 and Calu-3 cells, and Validation of On-Target Activity of SREBP Pathway Inhibitors, Related to Figure 4
(A and B) Dose-response curves of the effect of (A) YM201636 and (B) Fatostatin on SARS-CoV-2 replication in Huh7.5.1 cells and on cell viability of drug treated cells. Viral RNA was quantified after 24 hpi using RT-qPCR and normalized to RnaseP. Values represent means ± SEM relative to DMSO treated cells. Non-linear curves were fitted with least-squares regression using GraphPad Prism 8 and IC50 was determined. All experiments were performed with 3 biological replicates.
(C) Gene expression analysis of the SREBP-regulated cholesterol biosynthesis genes 3-Hydroxy-3-Methylglutaryl-CoA Synthase 1 (HMGCS1) and HMG-CoA reductase (HMGCR) as well as SREBP2, LDLR and SCAP in uninfected/no drug, infected/no drug and infected/drug-treated conditions (25 μM PF-429242 and 6.25 μM 25-HC) in Huh7.5.1 cells at 24 h post-infection/treatment. mRNA levels are displayed as means ± SEM from three biological replicates and are relative to expression in uninfected/no drug cells.
(D) RT-qPCR quantification of intracellular SARS-CoV-2 levels in drug-treated Calu-3 cells. Cells were infected using moi = 0.1, treated with 5 μM at time of infection and harvested at 24 hpi. Values represent means ± SEM from three biological replicates and are relative to the no drug (DMSO treated) condition.
(E) Cell viability of drug-treated Calu-3 cells 24 h after addition of compounds using Cell Titer Glo. Values are displayed as means ± SD from three biological replicates.
Furthermore, we tested compounds modulating cholesterol homeostasis as this pathway also appeared important for all three coronaviruses. PF-429242, a reversible, competitive aminopyrrolidineamide inhibitor of MBTPS1 showed strong dose-dependent reduction of SARS-CoV-2, 229E, and, to lesser degree, OC43 replication with cytotoxicity only at high concentration (Figures 4D–4F) (Hawkins et al., 2008). 25-Hydroxycholesterol (25-HC), which promotes ER retention of the SCAP-SREBP complex (Brown et al., 2018), also potently reduced replication of all three coronaviruses (Figures 4G–4I). Fatostatin, which binds to SCAP and inhibits ER-to-Golgi translocation of SREBPs (Kamisuki et al., 2009), moderately reduced SARS-CoV-2 infection levels at higher doses (Figure S5B). We confirmed on-target activity of the SREBP pathway modulators by measuring reduced expression of SREBP-regulated genes upon drug treatment (Figure S5C).
We also tested Bardoxolone, an activator of the KEAP1-NRF2 complex (Liby and Sporn, 2012), since KEAP1 scored highly in both common cold coronavirus screens. Bardoxolone potently inhibited 229E and OC43 replication and also reduced SARS-CoV-2 RNA levels at slightly higher concentrations (Figures 4J–4L), suggesting potential pan-coronaviral activity.
Finally, we confirmed the inhibitory effects of the different compounds against SARS-CoV-2 replication in Calu-3 cells; viral RNA levels were markedly suppressed without notable cytotoxicity (Figures S5D and S5E). Therefore, our genetic and pharmacological studies provide new targets for potential pan-coronavirus host-directed therapies that may be explored further in vivo.
Cellular Cholesterol Is Important for S-Mediated Entry of SARS-CoV-2
Next, we tested whether some of the identified genes affect viral entry. We generated a clonal Huh7.5.1-ACE2/TMPRSS2 overexpression cell line to facilitate efficient infection with a SARS-CoV-2 S-pseudotyped vesicular stomatitis virus (VSV-SARS-CoV-2-S) expressing GFP, which can be utilized to specifically probe effects on S-mediated entry of SARS-CoV-2. We then introduced Cas9 RNPs and created KO lines for our genes of interest. Editing efficiencies were high and loss of protein was confirmed for TMEM106B (Figures 5 A; Table S4). As expected, ACE2 KO drastically reduced infection with VSV-SARS-CoV-2-S (Figure 5B). By contrast, we did not observe a decrease of viral entry in TMEM106B and VAC14 KO cells, suggesting that they do not play a role in S-mediated entry (Figure 5B). We saw reduced uptake of pseudotyped viral particles in all cells with KOs in cholesterol-related genes (SCAP, MBTPS1, MBTPS2) as well as a modest decrease in exocyst deficient cells (Figure 5B). Finally, to examine whether treatment with cholesterol inhibitors also prevents viral entry similar to the genetic perturbations, we pretreated Huh7.5.1-ACE2/TMPRSS2 cells with different concentrations of PF-429242 or 25-HC and measured pseudotyped virus infection. Both drugs exhibited a dose-dependent reduction of infection levels (Figures 5C and 5D), suggesting that cellular cholesterol is required for efficient S-mediated entry of SARS-CoV-2.
Figure 5.

Cholesterol Is Required for S-Mediated Entry of SARS-CoV-2
(A) Western blot of ACE2 and TMEM106B levels from Huh7.5.1-ACE2/TMPRSS2 cells edited with non-targeting (NT) or TMEM106B-targeting RNPs. Lysates were prepared under non-reducing conditions and TMEM106B appears as dimer. GAPDH was used as loading control. Molecular weight markers are indicated on the left.
(B) VSV-SARS-CoV-2-S infection of clonal Huh7.5.1-ACE2/TMPRSS2 cells edited with RNPs targeting the specified genes. A NT sgRNA was used as control. Cells were harvested at 8 hpi and analyzed for GFP+ cells using flow cytometry. Values represent five biological replicates and are displayed as means ± SD
(C) VSV-SARS-CoV-2-S infection of PF-429242-treated cells. Huh7.5.1-ACE2/TMPRSS2 cells were pretreated with different concentrations of PF-429242 for 2 h and then infected with virus. Cells were analyzed by flow cytometry at 14 hpi and analyzed for GFP+ cells using flow cytometry. Values represent two biological replicates at each concentration and are displayed as means ± SD
(D) VSV-SARS-CoV-2-S infection of 25-HC-treated cells. Huh7.5.1-ACE2/TMPRSS2 cells were pretreated with different concentrations of 25-HC for 2 h and then infected with virus. Cells were analyzed by flow cytometry at 14 hpi. Values represent two biological replicates at each concentration and are displayed as means ± SD
Discussion
In this study, we performed genome-scale CRISPR KO screens to identify host factors important for SARS-CoV-2, 229E, and OC43. Our data highlight that while the three coronaviruses exploit distinct entry factors, they also depend on a convergent set of host pathways, with potential roles for the entire Coronaviridae family.
In particular, genes involved in cholesterol homeostasis were enriched in all of our screens and in the network propagation. Two recent SARS-CoV-2 interactome maps have also revealed binding of viral proteins to the cholesterol regulator SCAP (Gordon et al., 2020a; Stukalov et al., 2020); given the essentiality of SCAP for infection, the interacting viral proteins are likely to positively regulate SCAP activity and cholesterol levels. Interestingly, two clinical studies found improved outcomes for coronavirus disease 2019 patients treated with cholesterol reducers statins (Daniels et al., 2020; Zhang et al., 2020). Mechanistically, our genetic and pharmacological experiments showed that SARS-CoV-2 requires cellular cholesterol for efficient entry. This observation is also supported by a recent screen for interferon-stimulated genes that protect from SARS-CoV-2 infection, which identified cholesterol 25-hydroxylase (CH25H) as one of the top hits (Zang et al., 2020). Cholesterol homeostasis has also been linked to viral entry and membrane fusion in the context of bunya- and hantavirus infections, suggesting a pro-viral function across different viral families (Charlton et al., 2019; Kleinfelter et al., 2015; Petersen et al., 2014).
Our screens also uncovered phosphatidylinositol biosynthesis as an important pathway for coronavirus infection. While PIKfyve kinase has previously been implicated through chemical inhibition (Bouhaddou et al., 2020; Kang et al., 2020; Ou et al., 2020), which is consistent with our identification of VAC14, we also found the upstream PI3K complex as a new critical host factor that may exhibit pan-coronavirus function. Due to its involvement in multiple cellular processes including vesicular trafficking and autophagy (Bilanges et al., 2019), it remains to be determined whether coronaviruses hijack the PI3K pathway during entry and/or for the generation of double-membrane vesicles required for the viral replication/transcription complexes. Our results also inform those of a recent drug repurposing screen that identified ∼100 compounds that inhibited SARS-CoV-2 replication (Riva et al., 2020); notably, among those were PIKfyve inhibitors, protease inhibitors, and modulators of cholesterol homeostasis. Our functional genomics data therefore suggest that the observed effects of these compounds were possibly due to inhibition of critical host factors.
While this study was under review, several other SARS-CoV-2 CRISPR screen studies were published or deposited as preprints, revealing important aspects of the viral life cycle (Baggen et al., 2020; Daniloski et al., 2020; Schneider et al., 2020; Wei et al., 2020; Zhu et al., 2020). Our screen for SARS-CoV-2 host factors using Huh7.5.1-ACE2-IRES-TMPRSS2 cells identified the known SARS-CoV-2 entry factors, such as ACE2 and heparan sulfate, supporting its validity. Additional notable candidate host factors are TMEM106B, VAC14, cholesterol regulators, and subunits of the exocyst. Remarkedly, the majority of these genes were independently identified in a CRISPR screen using Huh7.5 cells, the parental line of the Huh7.5.1 cells we used in our study, underscoring the reproducibility and importance of these host factors for SARS-CoV-2 infection (Schneider et al., 2020). TMEM106B was additionally found in a third study (Baggen et al., 2020). While the exact molecular function of TMEM106B for SARS-CoV-2 infection remains to be determined, its importance was confirmed in several cell lines (including lung cells) by Baggen et al. (2020) and our study.
By contrast, many of the host factors we found to be essential were missed by the other recently published studies (Daniloski et al., 2020; Wei et al., 2020; Zhu et al., 2020), possibly due to the different chosen experimental systems. Wei et al. (2020) performed genome-wide CRISPR screens in the African green monkey cell line VeroE6. Besides the bona fide entry factors ACE2 and cathepsin L, the screen largely revealed chromatin modifiers such as HMGB1 and the SWI/SNF chromatin remodeling complex (Wei et al., 2020). The former was shown to regulate transcription of ACE2, thereby indirectly modulating susceptibility to SARS-CoV-2 infection in VeroE6. HMGB1 was not markedly enriched in any of the CRISPR screens conducted in human cells, suggesting that regulation of receptor expression levels may be species- or cell-type-dependent. Daniloski et al. (2020) and Zhu et al. (2020) conducted their screens in A549-ACE2 cells. Both studies identified ACE2, cathepsin L, and genes related to endosome acidification (e.g., subunits of the V-ATPase) or endosomal protein sorting and recycling (RAB7A, retromer complex, commander complex, WASH complex) (Daniloski et al., 2020; Zhu et al., 2020). The latter were shown to be critical for ACE2 cell surface expression and therefore likely to affect viral entry indirectly.
There is emerging evidence that SARS-CoV-2 entry can occur through different “routes,” depending on the level of TMPRSS2 on target cells as well as on mutations in the polybasic S1/S2 site of the viral S protein (Hoffmann et al., 2020b; 2020c; Zhu et al., 2020). The cleavage of SARS-CoV-2 S can occur either at the plasma membrane via TMPRSS2 or in endolysosomes through cathepsins. Sufficient TMPRSS2 levels may thus ablate the requirement for cathepsin and other factors linked to endolysosomal activity, a hypothesis supported by our screen, which was carried out in the context of TMPRSS2 overexpression and did not uncover cathepsins as crucial host factors. By contrast, A549 and VeroE6 cells do not express detectable TMPRSS2 levels, and the virus may thus rely preferentially on cathepsins for entry as screens in these cells indicate (Daniloski et al., 2020; Matsuyama et al., 2020; Wei et al., 2020; Zhu et al., 2020). However, nasal and lung epithelial cells, the natural target cells of SARS-CoV-2, can express high levels of TMPRSS2 (Sungnak et al., 2020). We therefore speculate that the genes identified in our SARS-CoV-2 CRISPR screen using Huh7.5.1-ACE2-IRES-TMPRSS2 cells are physiologically relevant to SARS-CoV-2 infection in vivo.
In summary, our study presents a screen for host factors carried out in a TMPRSS2-positive genetic background. It therefore unveils host factors critical for SARS-CoV-2 infection that may be more physiologically relevant than those uncovered so far in other genetic backgrounds. In addition, our comparative screens highlight commonalities and differences between SARS-CoV-2 and the common cold coronaviruses OC43 and 229E. In particular, this comparison led to the identification of the PI3K complex and cholesterol homeostasis as targets to pursue for the development of host-directed, pan-coronaviral therapy.
STAR★Methods
Key Resources Table
| REAGENT or RESOURCE | SOURCE | IDENTIFIER |
|---|---|---|
| Antibodies | ||
| Mouse Anti-GAPDH | Santa Cruz Biotechnology | Cat#sc-32233; RRID: AB_627679 |
| Goat anti-Rabbit IgG-HRP | Southern Biotech | Cat#4030-05; RRID: AB_2687483 |
| Goat anti-Mouse IgG-HRP | Southern Biotech | Cat#1031-05; RRID: AB_2794307 |
| Goat anti-ACE2 IgG | R&D Systems | Cat#AF933; RRID: AB_355722 |
| Rabbit anti-TMPRSS2 IgG | Abcam | Cat#ab92323; RRID: AB_10585592 |
| Rabbit Anti-Goat IgG-HRP | R&D Systems | Cat#HAF017; RRID: AB_562588 |
| Rabbit Anti-PIK3R4 | Novus Biologicals | Cat#NBP1-30463; RRID: AB_2163632 |
| Rabbit Anti-TMEM106B | Atlas Antibodies | Cat#HPA058342; RRID: AB_2683684 |
| Mouse Anti-VAC14 (C-10) | Santa Cruz Biotechnology | Cat#sc-271831; RRID: AB_10709168 |
| Bacterial and Virus Strains | ||
| HCoV-OC43 | ATCC | Cat#VR-1558 |
| HCoV-229E | ATCC | Cat#VR-740 |
| SARS-CoV-2 (USA/WA-1/2020 strain) | BEI Resources | Cat#NR-52281 |
| SARS-CoV-2 Reporter Virus Particles | Integral Molecular | Cat#RVP-701 |
| SARS-CoV-2 Spike-Pseudotyped VSV-dG-GFP | This study | N/A |
| Stbl3 E.coli | Berkeley MacroLabs | N/A |
| Chemicals, Peptides, and Recombinant Proteins | ||
| Polybrene | Santa Cruz Biotechnology | Cat#SC134220 |
| Puromycin Dihydrochloride | GIBCO | Cat#A1113803 |
| Blasticitin S HCl | GIBCO | Cat#A1113903 |
| Hygromycin B | Mirus Bio | Cat#MIR5930 |
| TrypLE Express | GIBCO | Cat#12604013 |
| SAR405 | SelleckChem | Cat#S7682 |
| YM201636 | SelleckChem | Cat#S1219 |
| PF-429242 dihydrochloride | Sigma | Cat#SML0667 |
| Fatostatin HBr | SelleckChem | Cat#S8284 |
| Bardoxolone | SelleckChem | Cat#S6647 |
| 25-Hydroxycholesterol | Sigma | Cat#H1015 |
| Zeocin | InvivoGen | Cat#ant-zn-1 |
| Critical Commercial Assays | ||
| KAPA HiFi HotStart ReadyMixPCR Kit | Kapa Biosciences | Cat#KK2602 |
| QuickExtract | Lucigen | Cat#QE09050 |
| Power SYBR Cells-to-CT kit | Invitrogen | Cat#44-029-55 |
| NEBuilder HiFi DNA Assembly Master Mix | New England BioLabs | Cat#E2621L |
| FugeneHD | Promega | Cat#E2311 |
| QIAamp DNA Blood Maxi Kit | QIAGEN | Cat#51194 |
| Quick-DNA Midiprep Plus | Zymo | Cat#D4075 |
| QIAquick PCR Purification kit | QIAGEN | Cat#28104 |
| QIAquick Gel Extraction Kit | QIAGEN | Cat#28704 |
| TransIT-X2 | Mirus Bio | Cat#MIR6003 |
| DNA/RNA Shield | Zymo | Cat#R1100-250 |
| Quick-DNA/RNA Viral MagBead kit | Zymo | Cat#R2141 |
| Luna Universal Probe One-Step RT-qPCR Kit | NEB | Cat#E3006E |
| Cell Titer Glo | Promega | Cat#G7570 |
| Gibson Assembly master mix | NEB | Cat#E2611L |
| JetOptimus | Polyplus | Cat#117-07 |
| QiaAmp virus RNA mini kit | QIAGEN | Cat#52906 |
| SuperScript™ III One-Step RT-PCR System with Platinum™ Taq DNA Polymerase | Invitrogen | Cat#12574026 |
| Deposited Data | ||
| Raw sequencing data for CRISPR KO screens | EMBL-EBI ArrayExpress | E-MTAB-9638 |
| Tables S1, S2, S3, S4, and S5 | Mendeley Data | https://dx.doi.org/10.17632/r49yg49ddc |
| Experimental Models: Cell Lines | ||
| Huh7.5.1 | Zhong et al., 2005 | N/A |
| HEK293FT | Thermo Scientific | Cat#R70007 |
| Vero | ATCC | Cat#CCL-81 |
| A549-ACE2 | Gift from Olivier Schwartz | N/A |
| Calu-3 | ATCC | Cat#HTB-55 |
| VeroE6 | ATCC | Cat#CRL-1586 |
| Oligonucleotides | ||
| Primers for CRISPR screen library amplification, see Table S5 | This study | N/A |
| Primers for cDNA cloning, see Table S5 | This study | N/A |
| sgRNA sequences for clonal Huh7.5.1 KO cell generation, see Table S5 | This study | N/A |
| Primers for genotyping of clonal Huh7.5.1 KO cells, see Table S5 | This study | N/A |
| sgRNA sequences for RNP editing of A549-ACE2 cells, see Table S5 | This study | N/A |
| Primers for genotyping of RNP-edited A549-ACE2 cells, see Table S5 | This study | N/A |
| sgRNA sequences for Calu-3 KO cell generation, see Table S5 | This study | N/A |
| qPCR primer and probe sequences, see Table S5 | This study | N/A |
| Primers for VSVdG-CoV-2-S generation and sequencing, see Table S5 | This study | N/A |
| Recombinant DNA | ||
| lentiCas9-Blast | Sanjana et al., 2014 | Addgene Cat#52962 |
| human GeCKO v2 library | Sanjana et al., 2014 | Addgene Cat#1000000049 |
| pX458 | Ran et al., 2013 | Addgene Cat#48138 |
| hACE2 | Li et al., 2003 | Addgene Cat#1786 |
| TMPRSS2 | Edie et al., 2018 | Addgene Cat#53887 |
| TMEM106B | Genscript | Cat#OHu17671 |
| VAC14 | Lemaire and McPherson, 2006 | Addgene Cat#47418 |
| plenti-CMV-Puro-DEST | Campeau et al., 2009 | Addgene Cat#17452 |
| plenti-CMV-Hygro-DEST | Campeau et al., 2009 | Addgene Cat#17454 |
| pCMV-dR8.2 dvpr | Stewart et al., 2003 | Addgene Cat#8455 |
| pCMV-VSV-G | Stewart et al., 2003 | Addgene Cat#8454 |
| pAdVAntage | Promega | Cat#E1711 |
| pLenti-DsRed_IRES_EGFP | Rousseaux et al., 2016 | Addgene Cat#92194 |
| PIK3R4 | Johannessen et al., 2010 | Addgene Cat#23488 |
| VPS16 | Jiang et al., 2014 | Addgene Cat#67023 |
| lentiCRISPRv2 | Sanjana et al., 2014 | Addgene Cat#52961 |
| plenti-CMV-GFP-Zeo | Campeau et al., 2009 | Addgene Cat#17449 |
| pCAGEN | Matsuda and Cepko, 2004 | Addgene Cat#11160 |
| VSV-eGFP-dG | Beier et al., 2011 | Addgene Cat#31842 |
| SARS-CoV2-S codon optimized gBlocks, see Table S5 | IDT | N/A |
| Software and Algorithms | ||
| MaGeCK | Li et al., 2014 | https://sourceforge.net/p/mageck/wiki/Home |
| R 3.6.0 | R | https://www.r-project.org |
| FlowJo 10.6.1 | FlowJo LLC | N/A |
| ChemiDoc MP Imaging System | Bio-Rad | N/A |
| MATLAB R2020a | MathWorks | N/A |
| Cytoscape 3.8.0 | Cytoscape | https://cytoscape.org |
| GraphPad Prism 8 | GraphPad | N/A |
| Sequencher 5.1 | Gene Codes | N/A |
| CFX Maestro™ Software | Bio-Rad | Cat #12004110 |
Resource Availability
Lead Contact
Further information and requests for resources and reagents should be directed to and will be fulfilled by the Lead Contact, Andreas S. Puschnik (andreas.puschnik@czbiohub.org).
Materials Availability
All requests for resources and reagents should be directed to and will be fulfilled by the Lead Contact author. Materials will be made available through the authors upon execution of a Material Transfer Agreement.
Data and Code Availability
The accession number for the raw sequencing data of the CRISPR KO screens reported in this paper is EMBL-EBI ArrayExpress: E-MTAB-9638.
Experimental Model and Subject Details
Cell lines
Huh7.5.1 (gift from Frank Chisari) (Zhong et al., 2005), HEK293FT (Thermo Scientific), Vero cells (ATCC), VeroE6 (ATCC) and A549-ACE2 cells (gift from Olivier Schwartz) were cultured in DMEM (GIBCO) supplemented with 10% fetal bovine serum (FBS, Omega Scientific), penicillin/streptomycin (GIBCO), non-essential amino acids (GIBCO) and L-glutamine (GIBCO) at 37C and 5% CO2. Calu-3 cells (ATCC) were cultured in DMEM/F12 (GIBCO) supplemented with 10% FBS (Omega Scientific), penicillin/streptomycin (GIBCO), non-essential amino acids (GIBCO) and L-glutamine (GIBCO) at 37C and 5% CO2. Huh7.5.1 and 293FT cell lines were tested negative for mycoplasma contamination.
Virus stocks
OC43 was obtained from ATCC (VR-1558) and propagated in Huh7.5.1 cells at 33C. 229E was obtained from ATCC (VR-740) and propagated in Huh7.5.1 cells at 33C. SARS-CoV-2 (USA/WA-1/2020 strain) was obtained through BEI Resources (NR-52281) and propagated in Vero cells at 37C. Supernatants were collected when cytopathic effect was apparent, filtered and stored at −80C. Viral titers were determined by standard plaque assay using either Huh7.5.1 cells (OC43 and 229E) or Vero cells (SARS-CoV-2). Briefly, serial 10-fold dilutions of virus stocks were used to infect cells in 6-well plates for 1 h and an overlay of DMEM media containing 1.2% Avicel RC-591 was added. Cells were incubated for 3-4 days, followed by fixation with 10% formaldehyde, staining with crystal violet and plaque counting. Additionally, SARS-CoV-2 stock was sequence-verified by next-generation sequencing. All experiments with OC43 and 229E were performed in a biosafety level 2 laboratory and all experiments involving SARS-CoV-2 were performed in a biosafety level 3 laboratory.
Method Details
Plasmids, cloning and lentivirus production
The following cDNA sequence containing plasmids were obtained: hACE2 (Addgene, #1786, gift from Hyeryun Choe) (Li et al., 2003), TMPRSS2 (Addgene, #53887, gift from Roger Reeves) (Edie et al., 2018), TMEM106B (Genscript, OHu17671), VAC14 (Addgene, #47418, gift from Peter McPherson) (Lemaire and McPherson, 2006), PIK3R4 (Addgene, #23488, gift from William Hahn & David Root) (Johannessen et al., 2010) and VPS16 (Addgene, #67023, gift from Noboru Mizushima) (Jiang et al., 2014).
Individual cDNAs were cloned into EcoRV-cut plenti-CMV-Puro-DEST (Addgene, #17452, gift from Eric Campeau & Paul Kaufman) (Campeau et al., 2009) (TMEM106B, VAC14, PIK3R4, VPS16) or plenti-CMV-Hygro-DEST (Addgene, #17454, gift from Eric Campeau & Paul Kaufman) (Campeau et al., 2009) (hACE2, TMPRSS2) using NEBuilder HiFi DNA Assembly Master Mix (NEB). To generate the plenti-CMV-ACE2-IRES-TMPRSS2 construct, ACE2, EMCV IRES (derived from pLenti-DsRed_IRES_EGFP (Addgene, #92194, gift from Huda Zoghbi)) (Rousseaux et al., 2016), and TMPRSS2 were individually amplified with addition of overlapping sequences and the three fragments were assembled using NEBuilder HiFi DNA Assembly Master Mix. To generate plenti-TMPRSS2-TwinStrep, TMPRSS2 was inserted into a plenti-CMV-GFP-Zeo vector (Addgene, # 17449, gift from Eric Campeau & Paul Kaufman) (Campeau et al., 2009) via digestion with BamHI and SalI followed by assembly using the Gibson Assembly master mix (NEB). All primer sequences for cloning can be found in Table S5.
Lentivirus was produced in HEK293FT by co-transfection of cDNA containing lentiviral plasmid together with pCMV-dR8.2 dvpr (Addgene, #8455, gift from Bob Weinberg) (Stewart et al., 2003), pCMV-VSV-G (Addgene, #8454, gift from Bob Weinberg) (Stewart et al., 2003) and pAdVAntage (Promega) using FugeneHD (Promega). Supernatants were collected 48 h post-transfection, filtered and added to recipient cells in presence of Polybrene (SCBT). Transduced cells were subsequently selected using Puromycin or Hygromycin for 5-7 days.
Genome-wide CRISPR screens
Huh7.5.1-Cas9 cells were generated by lentiviral transduction with lentiCas9-blast (Addgene, #52962, gift from Feng Zhang) (Sanjana et al., 2014) and subsequently selected with blasticidin for 7 days. A portion of Huh7.5.1-Cas9 cells were additionally transduced with lentivirus containing ACE2-IRES-TMPRSS2-hygro. To generate CRISPR KO libraries, a total of 240 million Huh7.5.1-Cas9-blast or Huh7.5.1-Cas9-blast+ACE2-IRES-TMPRSS2-hygro cells were transduced with lentivirus of the human GeCKO v2 library (Addgene, #1000000049, gift from Feng Zhang) (Sanjana et al., 2014) at a moi of 0.4 and subsequently selected using puromycin and expanded for 7 days. A total of 60 million mutagenized cells for each GeCKO sublibrary (A and B) were collected for genomic DNA extraction to assess the sgRNA representation of the starting population at day 7 post-transduction. In order to assess the sgRNA representation in the lentiviral supernatant used for transduction at day 0, we isolated lentiviral genomes using the DirectZol kit (Zymo), reverse-transcribed the purified RNA and amplified the sgRNA sequences as described below.
For the SARS-CoV-2 CRISPR host factor screen, 100 million cells of Huh7.5.1-Cas9-blast+ACE2-IRES-TMPRSS2-hygro GeCKO library cells were infected with SARS-CoV-2 at a multiplicity of infection (moi) of 0.01. Virus-induced cell death was apparent after 2-3 days and surviving cells were collected 12 dpi. The screen was performed once.
For the 229E and OC43 CRISPR screens, 100 million cells (per screen) of Huh7.5.1-Cas9-blast GeCKO library cells were infected with 229E and OC43 at moi of 0.05 and 3, respectively. Cells were incubated at 33C to increase CPE, which was apparent after 3-4 days. Surviving cells were collected after 10 days for 229E and 14 days for OC43. Each screen was performed in two replicates. For all CRISPR screens, genomic DNA (gDNA) was extracted using either QIAamp DNA Blood Maxi Kit (QIAGEN) or Quick-DNA Midiprep Plus (Zymo). The sgRNA expression cassettes were amplified from gDNA in a two-step nested PCR using KAPA HiFi HotStart ReadyMixPCR Kit (Kapa Biosystems). For PCR1, 40 reactions (for control samples) and 10-16 reactions (for virus selected samples) containing 4 μg gDNA were set up and amplified for 16 cycles. Reactions were pooled, mixed and 200 μL were cleaned up using QIAquick PCR Purification kit (QIAGEN). For PCR2, 3 reactions containing 5 μL PCR1 product were amplified for 12 cycles using indexed primers. PCR products were gel purified using QIAquick Gel Extraction Kit (QIAGEN) and sequenced on an Illumina NextSeq 500 using a custom sequencing primer. Primers sequences are listed in Table S5.
Demultiplexed FASTQ files were aligned to a reference table containing sgRNA sequences and abundance of each sgRNA was determined for each starting and selected cell population. Guide count tables were further processed using MaGECK with default “norm-method” to determine positive enrichment scores for each gene (Li et al., 2014). For 229E and OC43, two biological screen replicates were used as input, and for SARS-CoV-2, one biological screen replicate was used. The gene ontology enrichment of the individual screens was run on genes with MaGECK positive score £ 0.005 using the GO Biological Processes of the Molecular Signatures Database (MSigDB).
Network propagation
We performed network propagation analysis for the three virus CRISPR screens using the Pathway Commons network (Cerami et al., 2011). Specifically, we used a heat-diffusion kernel analogous to random walk with restart (RWR, also known as insulated diffusion and personalized PageRank) which better captures the local topology of the interaction network compared to a general heat diffusion process. The process is captured by the steady-state solution as follows:
where PSS represents the vector of propagated values at steady-state, P0 is the initial labeling (genes of interest from molecular studies), W is the normalized version of the adjacency matrix of the underlying network (in this implementation W = AD-1, where A is the unnormalized adjacency matrix, and D is the diagonal degree matrix of the network), I is the identity matrix, and α denotes the restart probability (here, α = 0.2), which is the probability of returning to the previously visited node, thus controlling the spread through the network.
We performed three independent propagations, one for each CRISPR dataset (i.e., each virus). After propagation, each propagated network was integrated by multiplying gene-wise. Such an operation is used to create a gene list ranked to prioritize genes with high scores from all propagated datasets. To control for nodes with high degree (i.e., many connections), which due to their heightened connectivity are biased to receive higher propagation scores, we conducted a permutation test. Specifically, we simulated random propagations by shuffling the positive scores to random genes, repeating this 20,000 times per CRISPR screen. Next, we calculated an empirical p value by calculating the fraction of random propagation runs greater than or equal to the true propagation run for each gene.
The network was created by extracting a subnetwork from the same Pathway Commons network corresponding to genes possessing a significant p value (p £ 0.01) from the propagation (n = 378). Of these, interconnected genes were visualized using Cytoscape (n = 284). The resulting network was clustered into subnetworks using the GLay Cytoscape plugin (Su et al., 2010). Three large clusters (1, 3, and 5) were further clustered using GLay into additional subclusters (denoted with letters), resulting in a total of 25 subnetwork clusters (see Figure S3A and Table S3). Lastly, Gene Ontology (GO) enrichment analysis (biological process) was performed for each of the 25 resulting subclusters to identify biological processes and pathways associated with each subcluster.
Generation of clonal Huh7.5.1 KO cell lines
sgRNA sequences against gene targets were designed using the GPP sgRNA Designer (https://portals.broadinstitute.org/gpp/public/analysis-tools/sgrna-design). DNA oligos (IDT) containing sgRNA sequences were annealed and ligated into pX458 (Addgene, #48138, gift from Feng Zhang) (Ran et al., 2013). Cells were transfected with pX458 constructs using Mirus TransIT-X2 (Mirus Bio) and two days later GFP positive cells were single-cell sorted into 96-well plates using a Sony SH800 cell sorter. For genotyping, genomic DNA was isolated from obtained clones using DNA QuickExtract (Lucigen), the sgRNA-targeted sites PCR amplified and the products Sanger-sequenced. Obtained sequences were compared to reference sequences and clones containing a frameshift indel or de novo stop codon were selected. A list of all used sgRNA sequences and genotyping primers can be found in Table S5.
To isolate a clonal Huh7.5.1-ACE2/TMPRSS2 cell line, polyclonal Huh7.5.1-ACE2/TMPRSS2 were diluted and plated in 96-well plates. Single colonies were grown up and clones were screened for high expression of ACE2 and TMPRSS2 by western blot.
Generation of RNP edited A549-ACE2 and Huh7.5.1-ACE2/TMPRSS2 cells
sgRNAs were designed according to Synthego’s multi-guide gene knockout. Briefly, two or three sgRNAs are bioinformatically designed to work in a cooperative manner to generate small, knockout-causing, fragment deletions in early exons. These fragment deletions are larger than standard indels generated from single guides. The genomic repair patterns from a multi-guide approach are highly predictable based on the guide-spacing and design constraints to limit off-targets, resulting in a higher probability protein knockout phenotype.
RNA oligonucleotides were chemically synthesized on Synthego solid-phase synthesis platform, using CPG solid support containing a universal linker. 5-Benzylthio-1H-tetrazole (BTT, 0.25 M solution in acetonitrile) was used for coupling, (3-((Dimethylamino-methylidene)amino)-3H-1,2,4-dithiazole-3-thione (DDTT, 0.1 M solution in pyridine) was used for thiolation, dichloroacetic acid (DCA, 3% solution in toluene) for used for detritylation. Modified sgRNA were chemically synthesized to contain 2’-O-methyl analogs and 3¢ phosphorothioate nucleotide interlinkages in the terminal three nucleotides at both 5¢ and 3¢ ends of the RNA molecule. After synthesis, oligonucleotides were subject to series of deprotection steps, followed by purification by solid phase extraction (SPE). Purified oligonucleotides were analyzed by ESI-MS.
To induce gene knockout in A549-ACE2 cells, 5 pmol Streptococcus Pyogenes NLS-Sp.Cas9-NLS (SpCas9) nuclease (Aldevron) was combined with 15 pmol total synthetic sgRNA (5 pmol each sgRNA) (Synthego) to form ribonucleoproteins (RNPs) in 20uL total volume with SE. Buffer (Lonza). To induce knockouts in Huh7.5.1-ACE2/TMPRSS2 cells, 30 pmol total synthetic sgRNA was mixed with 10 pmol Cas9 in 20uL total volume SE buffer. The RNP assembly reaction was mixed by pipetting up and down and incubated at room temperature for 10 min.
All cells were dissociated into single cells using TrypLE Express (GIBCO), as described above, resuspended in culture media and counted. For A549-ACE2 transfections, 100,000 cells per reaction were used while for Huh7.5.1-ACE2/TMPRSS2 200,000 cells per reaction were used. Cells were pelleted by centrifugation at 200 xg for 5 min. Following centrifugation, cells were resuspended in transfection buffer according to cell type. 5 μL of cell solution was added to preformed RNP solution and gently mixed. Nucleofections were performed on a Lonza HT 96-well nucleofector system using program CM-120 and CM-104 for A549-ACE2 and Huh7.5.1-ACE2/TMPRSS2, respectively. All transfections were performed in Lonza SE buffer. Immediately following nucleofection, each reaction was divided evenly between two wells of a tissue-culture treated 96-well plate containing 100μL normal culture media. Two days post-nucleofection, DNA was extracted from using DNA QuickExtract (Lucigen). Amplicons for indel analysis were generated by PCR amplification. PCR products were cleaned-up and analyzed by sanger sequencing. Sanger data files and sgRNA target sequences were input into Inference of CRISPR Edits (ICE) analysis (https://ice.synthego.com) to determine editing efficiency and to quantify generated indels (Hsiau et al., 2019). A list of all used sgRNA sequences and genotyping primers can be found in Table S5.
Generation of polyclonal Calu-3 KO cell lines
DNA oligos (IDT) containing sgRNA sequences (see Table S5) were annealed and ligated into lentiCRISPRv2 (Addgene, #52961, gift from Feng Zhang) (Sanjana et al., 2014). Lentivirus for each individual construct was produced as described above. Calu-3 cells were co-transduced with two lentiviruses encoding separate sgRNAs per gene or with a non-targeting sgRNA encoding lentivirus in presence of polybrene. Transduced Calu-3 cells were selected with puromycin (2 μg/mL) for 9 days prior to infection experiments.
RT-qPCR infection assays
Cells were plated in 96-well plates and infected the next day with virus: OC43 (moi = 3), 229E (moi = 0.05), SARS-CoV-2 (moi = 0.1). For infection with HCoVs, cells were harvested 48 hpi, lysates were reverse transcribed and quantitative PCR was performed on a Bio-Rad CFX96 Touch system using the Power SYBR Cells-to-CT kit (Invitrogen) according to the manufacturer’s instructions. 229E and OC43 RNA levels were quantified with virus-specific primer sets and viral RNA levels were normalized to cellular 18S levels.
For SARS-CoV-2 infections, Huh7.5.1, Calu-3 and A549-ACE2 cells were harvested after 24, 48 and 72 h, respectively, using 200 μL DNA/RNA Shield (Zymo) to inactivate virus prior to export from the BSL3 laboratory. Samples were extracted using the Quick-DNA/RNA Viral MagBead kit (Zymo) on a Bravo automated liquid handling platform (Agilent). Briefly, the Bravo RNA extraction protocol consists of: 1) 180 μL sample transfer from 2mL deep well to a 1mL deep well plate containing Proteinase K; 2) addition of Zymo Viral DNA/RNA Buffer for sample lysis; 3) Addition of Zymo MagBeads; 4) 10 min mixing and shaking of samples with lysis buffer and MagBeads; 5) incubation of the mixture on a 96 well ring magnet to collect the beads to a ring at the bottom of the deep well plate; 6) aspiration of the supernatant and dispensing into a 2mL deep well waste plate; 7) addition of wash buffers 1 with mixing; 8) incubation on the 96 well ring magnet; 9) aspiration. Steps 7-9 are repeated for wash buffer 2 and two rounds of 100% ethanol. 10) incubation on the magnet for 20 min to fully evaporate residual 100% ethanol from the beads; 11) Elution with nuclease-free water.
For RT-qPCR, separate reactions were performed for the quantification of SARS-CoV-2 N and E gene transcripts as well as cellular RNaseP for normalization using the Luna Universal Probe One-Step RT-qPCR Kit (NEB) on a Bio-Rad CFX384 Touch system. N and E gene transcripts showed high concordance and N gene levels normalized to RNaseP were displayed in figures. All qPCR primer/probe sequences are listed in Table S5.
Western blots
Cells were lysed using Laemmli SDS sample buffer containing 5% beta-mercaptoethanol and boiled at 95C for 10min with the exception of lysates for TMEM106B immunoblotting. In this case, cells were lysed in RIPA buffer on ice for 15min, then mixed with Laemmli under non-reducing conditions and without boiling. All lysates were separated by SDS-PAGE on pre-cast Bio-Rad 4%–15% poly-acrylamide gels in Bio-Rad Mini-Protean electrophoresis system. Proteins were transferred onto PVDF membranes using Bio-Rad Trans-Blot Turbo transfer system. PVDF membranes were blocked with PBS buffer containing 0.1% Tween-20 and 5% non-fat milk. Blocked membranes were incubated with primary antibody diluted in blocking buffer and incubated overnight at 4C on a shaker. Primary antibodies were detected by incubating membranes with 1:5000 dilution of HRP-conjugated (Southern Biotech) secondary anti-mouse and anti-rabbit antibodies for 1 h at room temperature. Blots were visualized using a ChemiDoc MP Imaging System (Bio-Rad). The following primary antibodies and their dilutions were used in this study: GAPDH (SCBT, sc-32233) at 1:2000, ACE2 (R&D Systems, AF933) at 1:1000, TMPRSS2 (Abcam, ab92323) at 1:1000, TMEM106B (Sigma, HPA058342) at 1:2500, VAC14 (SCBT, sc-271831) at 1:2500, PIK3R4 (Novus Biologicals, NBP1-30463) at 1:2500.
Lentiviral pseudo-typed virus infection
Cells were plated in 96-well plates and infected with 30 μL of SARS-CoV-2 Reporter Virus Particles (Integral Molecular, RVP-701) per well. After 48-72 h, infection rates were measured according the GFP levels using a Cytoflex flow cytometer (Beckman Coulter Life Sciences).
Generation of SARS-CoV-2-S pseudotyped Vesicular stomatitis virus (VSV-SARS-CoV-2-S)
SARS-2-S (based on Wuhan-Hu-1 isolate, GenBank: MN908947.3) was generated using codon optimized gBlock fragments (IDT) spanning genome fragments from 18851-19820, 19771-20740, 20692-21595, 21544-22338, and 22289-22745 (see Table S5), assembled by Gibson Assembly. Two mutation (K1269A and H1271A) to remove a prospective ER retention domain) based on data from SARS-CoV1 (McBride et al., 2007) were introduced by PCR. This gene was assembled into VSV-eGFP-dG (Addgene, #31842, gift from Connie Cepko) (Beier et al., 2011) in frame with the G coding sequence between MluI and NotI to generate VSV-eGFP-CoV2-S(AA). Helper plasmids for rescue were generated by amplification of genes from VSV-eGFP-dG and cloning by restriction digestion and ligation into pCAGEN (Addgene, # 11160, gift from Connie Cepko) (Matsuda and Cepko, 2004) to generate pCAGEN-VSV-N, pCAGEN-VSV-P, and pCAGEN-VSV-L. To rescue the VSVdG-CoV2-S(AA), 293FT cells were co-cultured with Huh7.5.1 cells at a ratio of 1:2 in a 6-well plate to be 80%–90% confluent the next day. Cells were transfected using JetOptimus (Polyplus) with pCAGGS-T7 (200ng), pCAGEN-CoV2-N (300ng), pCAGEN-CoV2-P (500ng), pCAGEN-CoV2-L (200ng), pCMV-VSV-G (800ng), and VSV-eGFP-CoV2-S(AA) (650ng). Cells were trypsinized and passed to a 10cm plate at 4 days post-transfection. At 10 days post-transfection, syncytia formation was seen and at 11 days post-transfection most of the cells had strong green fluorescence and supernatant was collected and frozen at −80°C. Huh7.5.1 cells were infected with supernatant and passaged 6 times every 3-4 days. Passage 6 supernatant was collected and a plaque assay was performed using VeroE6-TMPRSS2 cells. At day 4, plaques were isolated and grown on VeroE6-TMPRSS2- cells. Stock virus used for experiments was generated by infecting VeroE6 cells at 34°C for 3 days and collecting supernatant. Clarified supernatant was supplemented with sucrose phosphate and frozen at −80°C. Viruses were titrated on VeroE6-TMPRSS2 cells. To sequence the S region of the virus, RNA was isolated using the QiaAmp viral RNA mini kit (QIAGEN). The S regions was amplified using SuperScript III One-Step RT-PCR System with Platinum Taq DNA Polymerase (Invitrogen). Mutations in S were detected with a 27nt (9aa) deletion at the C terminus (1274STOP) and a partial mutation A372T (∼50%) in the ectodomain. Similar adaptive mutations were found in previously published VSVdG-CoV2-S (Dieterle et al., 2020).
Flow cytometry analysis of VSV-SARS-CoV-2-S infected cells
Cells plated in 96-well plates were spin-infected with VSV-SARS-CoV-2-S (800 g, 60min, 34C) and subsequently cultured at 37C for 7-14 hpi. For analysis of VSV-SARS-CoV-2-S infection rates, cells were trypsinized, and analyzed using a Cytoflex S flow cytometer (Beckman Coulter). Approximately 5,000 cells were recorded and gated based on FSC/SSC, FSC-H/FSC-A (singlets) and FITC (eGFP) using FlowJo 10.
Compounds
The following compounds were used in this study: SAR405 (SelleckChem, S7682), YM201636 (SelleckChem, S1219), PF-429242 dihydrochloride (Sigma, SML0667), 25-Hydroxycholesterol (Sigma, H1015), Bardoxolone (SelleckChem, S6647) and Fatostatin HBr (SelleckChem, S8284). 25-Hydroxycholesterol was resuspended in 100% ethanol and all other compounds were resuspended in DMSO. All compounds were stored at −20C until use.
Cell viability and growth assays
Huh7.5.1 or Calu-3 cells were treated with compounds at the same concentrations and durations as in infection assays. Cell viability was measured using Cell Titer Glo (Promega) by mixing cells in 40 μl media with 40 μl assay buffer and reading the luminescence signal on Envision 2105 plate reader (Perkin Elmer). To assess cell growth for WT and KO Huh7.5.1 cells, cells were plated in 96-well plates and Cell Titer Glo assay was performed daily for three consecutive days. To assess cell growth for RNP-edited A549-ACE2 cells, proliferation was determined by confluence of knockout pools using a Celigo Imaging Cytometer (Celigo) with built in ‘Confluence’ image analysis pipeline. Each well was independently imaged using brightfield illumination, autoexposure and autofocus with a 40 μm focus offset to increase contrast. Analysis was performed using standard settings except for an intensity threshold of 8. To measure the number of surviving cells upon SARS-CoV-2 challenge, cells were plated in a 96-well black plates with glass bottom and infected with moi = 0.01. Cells were fixed with 4% paraformaldehyde followed by PBS washes. Nuclei were counted after staining with Hoechst 33258. Images were taken at the Gladstone Institutes Assay Development and Drug Discovery Core facility on a Molecular Devices ImageXpress confocal microscope using a 10X objective. Nuclear fluorescence was measured and counted by MetaXpress software using a multi-wavelength cell scoring module.
Quantification and Statistical Analysis
For CRISPR screens, the enrichment scores, p values and false-discovery rates were determined using the MaGeCK algorithm (Li et al., 2014). For the GO analysis, p values of hypergeometric tests were determined using the Cluster Profiler enricher function in R and adjusted with “fdr” correction method. For viral infection, drug treatment, and cell growth experiments biological replicates are defined as independent treatments and measurements from cells separately plated in and harvested from multiple wells. Replicates are displayed as mean ± SEM or mean ± SD as specified in the figure legends. Mean ± SEM for RT-qPCR data was determined using CFX Maestro Software (Bio-Rad) and then visualized in GraphPad Prism 8. Mean ± SEM or mean ± SD for remaining data was calculated and visualized using GraphPad Prism 8. Dose-response curves for drug treatments were generated by applying a non-linear curve fit with least-squares regression and default parameters using GraphPad Prism 8. No additional statistical tests were performed. No methods were used to determine sample size estimation or whether the data met assumptions of the statistical approaches. For all experiments, the statistical details can be found in the figure legends.
Acknowledgments
This research was funded by grants from the National Institutes of Health (R01AI140186-S and R01AI141970 to J.E.C.; P50AI150476, U19AI135990, U19AI135972, R01AI143292, R01AI120694, P01A1063302, and R01AI122747 to N.J.K.; F32CA239333 to M.B.; and 5DP1DA038043 to M.O.). J.E.C. was also supported by a pilot grant from Stanford ChEM-H Innovative Medicines Accelerator (IMA). M.O. acknowledges support through a gift from the Roddenberry Foundation. N.J.K also acknowledges support from the Defense Advanced Research Projects Agency (DARPA) (#HR0011-19-2-0020), the Laboratory for Genomics Research (LGR) Excellence in Research Award (ERA) from the Innovative Genomics Institute at UC Berkeley (#133122P), FastGrants COVID19 grant, F. Hoffmann-La Roche, Vir Biotechnology, the Roddenberry Foundation, and gifts from the Ron Conway Family. Funding to A.S.P. was provided by the Chan Zuckerberg Biohub. We would like to thank Dr. Nathan Meyers for laboratory support; Matthew Laurie for help with Bravo liquid handling; Anke Meyer-Franke for help with automated microscopy; Michelle Tan, Angela Detweiler, and Norma Neff for help with sequencing; Dr. Sandra Schmid, Dr. Don Ganem, and Dr. Francoise Chanut for editorial comments; and Dr. Olga Gulyaeva, Sara Sunshine, Dr. Marco Hein, and Dr. Scott Biering for helpful discussions. We also express gratitude to the Biohub lab management and operations team for their support.
Author Contributions
R.W., C.R.S., J.K., K.A.T., J.M.H., J.C.-S., J.R.Z., C.M.R., P.F., J.O., L.R., and A.S.P. performed experiments. R.W., C.R.S., J.K., K.A.T., J.M.H., J.C.-S., J.R.Z., C.M.R., and A.S.P. designed experiments. R.W., C.R.S., J.K., M.B., K.A.T., J.M.H., J.C.-S., J.R.Z., and A.S.P. analyzed and visualized data. L.R., B.J., K.W., and A.S. provided BSL-3 laboratory support and training. K.H., A.S., J.E.C., N.J.K., M.O., and A.S.P. supervised the study and provided technical guidance. A.S.P. conceptualized the study and wrote the initial draft of the manuscript. R.W., C.R.S., M.B., K.A.T., J.M.H., J.C.-S., J.R.Z., J.E.C., N.J.K., and M.O. provided comments and edits on the manuscript.
Declaration of Interests
J.C.-S., J.O., and K.H. are employees of Synthego Corporation. All authors declare no other competing interests.
Published: December 9, 2020
Footnotes
Supplemental Information can be found online at https://doi.org/10.1016/j.cell.2020.12.004.
Supplemental information
References
- Aoki T., Ichimura S., Itoh A., Kuramoto M., Shinkawa T., Isobe T., Tagaya M. Identification of the neuroblastoma-amplified gene product as a component of the syntaxin 18 complex implicated in Golgi-to-endoplasmic reticulum retrograde transport. Mol. Biol. Cell. 2009;20:2639–2649. doi: 10.1091/mbc.E08-11-1104. [DOI] [PMC free article] [PubMed] [Google Scholar]
- Baggen J., Persoons L., Jansen S., Vanstreels E., Jacquemyn M., Jochmans D., Neyts J., Dallmeier K., Maes P., Daelemans D. Identification of TMEM106B as proviral host factor for SARS-CoV-2. BioRxiv. 2020 doi: 10.1101/2020.09.28.316281. [DOI] [Google Scholar]
- Balderhaar H.J., Ungermann C. CORVET and HOPS tethering complexes - coordinators of endosome and lysosome fusion. J. Cell Sci. 2013;126:1307–1316. doi: 10.1242/jcs.107805. [DOI] [PubMed] [Google Scholar]
- Beier K.T., Saunders A., Oldenburg I.A., Miyamichi K., Akhtar N., Luo L., Whelan S.P.J., Sabatini B., Cepko C.L. Anterograde or retrograde transsynaptic labeling of CNS neurons with vesicular stomatitis virus vectors. Proc. Natl. Acad. Sci. USA. 2011;108:15414–15419. doi: 10.1073/pnas.1110854108. [DOI] [PMC free article] [PubMed] [Google Scholar]
- Bekerman E., Einav S. Infectious disease. Combating emerging viral threats. Science. 2015;348:282–283. doi: 10.1126/science.aaa3778. [DOI] [PMC free article] [PubMed] [Google Scholar]
- Bertram S., Dijkman R., Habjan M., Heurich A., Gierer S., Glowacka I., Welsch K., Winkler M., Schneider H., Hofmann-Winkler H., et al. TMPRSS2 activates the human coronavirus 229E for cathepsin-independent host cell entry and is expressed in viral target cells in the respiratory epithelium. J. Virol. 2013;87:6150–6160. doi: 10.1128/JVI.03372-12. [DOI] [PMC free article] [PubMed] [Google Scholar]
- Bilanges B., Posor Y., Vanhaesebroeck B. PI3K isoforms in cell signalling and vesicle trafficking. Nat. Rev. Mol. Cell Biol. 2019;20:515–534. doi: 10.1038/s41580-019-0129-z. [DOI] [PubMed] [Google Scholar]
- Bouhaddou M., Memon D., Meyer B., White K.M., Rezelj V.V., Correa Marrero M., Polacco B.J., Melnyk J.E., Ulferts S., Kaake R.M., et al. The Global Phosphorylation Landscape of SARS-CoV-2 Infection. Cell. 2020;182:685–712.e19. doi: 10.1016/j.cell.2020.06.034. [DOI] [PMC free article] [PubMed] [Google Scholar]
- Brown M.S., Radhakrishnan A., Goldstein J.L. Retrospective on Cholesterol Homeostasis: The Central Role of Scap. Annu. Rev. Biochem. 2018;87:783–807. doi: 10.1146/annurev-biochem-062917-011852. [DOI] [PMC free article] [PubMed] [Google Scholar]
- Campeau E., Ruhl V.E., Rodier F., Smith C.L., Rahmberg B.L., Fuss J.O., Campisi J., Yaswen P., Cooper P.K., Kaufman P.D. A versatile viral system for expression and depletion of proteins in mammalian cells. PLoS ONE. 2009;4:e6529. doi: 10.1371/journal.pone.0006529. [DOI] [PMC free article] [PubMed] [Google Scholar]
- Carette J.E., Raaben M., Wong A.C., Herbert A.S., Obernosterer G., Mulherkar N., Kuehne A.I., Kranzusch P.J., Griffin A.M., Ruthel G., et al. Ebola virus entry requires the cholesterol transporter Niemann-Pick C1. Nature. 2011;477:340–343. doi: 10.1038/nature10348. [DOI] [PMC free article] [PubMed] [Google Scholar]
- Cerami E.G., Gross B.E., Demir E., Rodchenkov I., Babur O., Anwar N., Schultz N., Bader G.D., Sander C. Pathway Commons, a web resource for biological pathway data. Nucleic Acids Res. 2011;39:D685–D690. doi: 10.1093/nar/gkq1039. [DOI] [PMC free article] [PubMed] [Google Scholar]
- Charlton F.W., Hover S., Fuller J., Hewson R., Fontana J., Barr J.N., Mankouri J. Cellular cholesterol abundance regulates potassium accumulation within endosomes and is an important determinant in bunyavirus entry. J. Biol. Chem. 2019;294:7335–7347. doi: 10.1074/jbc.RA119.007618. [DOI] [PMC free article] [PubMed] [Google Scholar]
- Clausen T.M., Sandoval D.R., Spliid C.B., Pihl J., Perrett H.R., Painter C.D., Narayanan A., Majowicz S.A., Kwong E.M., McVicar R.N., et al. SARS-CoV-2 Infection Depends on Cellular Heparan Sulfate and ACE2. Cell. 2020;183:1043–1057.e15. doi: 10.1016/j.cell.2020.09.033. [DOI] [PMC free article] [PubMed] [Google Scholar]
- Cowen L., Ideker T., Raphael B.J., Sharan R. Network propagation: a universal amplifier of genetic associations. Nat. Rev. Genet. 2017;18:551–562. doi: 10.1038/nrg.2017.38. [DOI] [PubMed] [Google Scholar]
- Cuadrado A., Rojo A.I., Wells G., Hayes J.D., Cousin S.P., Rumsey W.L., Attucks O.C., Franklin S., Levonen A.-L., Kensler T.W., Dinkova-Kostova A.T. Therapeutic targeting of the NRF2 and KEAP1 partnership in chronic diseases. Nat. Rev. Drug Discov. 2019;18:295–317. doi: 10.1038/s41573-018-0008-x. [DOI] [PubMed] [Google Scholar]
- Cuadrado A., Pajares M., Benito C., Jiménez-Villegas J., Escoll M., Fernández-Ginés R., Garcia Yagüe A.J., Lastra D., Manda G., Rojo A.I., Dinkova-Kostova A.T. Can Activation of NRF2 Be a Strategy against COVID-19? Trends Pharmacol. Sci. 2020;41:598–610. doi: 10.1016/j.tips.2020.07.003. [DOI] [PMC free article] [PubMed] [Google Scholar]
- Daniels L.B., Sitapati A.M., Zhang J., Zou J., Bui Q.M., Ren J., Longhurst C.A., Criqui M.H., Messer K. Relation of Statin Use Prior to Admission to Severity and Recovery Among COVID-19 Inpatients. Am. J. Cardiol. 2020;136:149–155. doi: 10.1016/j.amjcard.2020.09.012. [DOI] [PMC free article] [PubMed] [Google Scholar]
- Daniloski Z., Jordan T.X., Wessels H.-H., Hoagland D.A., Kasela S., Legut M., Maniatis S., Mimitou E.P., Lu L., Geller E., et al. Identification of Required Host Factors for SARS-CoV-2 Infection in Human Cells. Cell. 2020 doi: 10.1016/j.cell.2020.10.030. [DOI] [PMC free article] [PubMed] [Google Scholar]
- Dieterle M.E., Haslwanter D., Bortz R.H., 3rd, Wirchnianski A.S., Lasso G., Vergnolle O., Abbasi S.A., Fels J.M., Laudermilch E., Florez C., et al. A Replication-Competent Vesicular Stomatitis Virus for Studies of SARS-CoV-2 Spike-Mediated Cell Entry and Its Inhibition. Cell Host Microbe. 2020;28:486–496.e6. doi: 10.1016/j.chom.2020.06.020. [DOI] [PMC free article] [PubMed] [Google Scholar]
- Dong E., Du H., Gardner L. An interactive web-based dashboard to track COVID-19 in real time. Lancet Infect. Dis. 2020;20:533–534. doi: 10.1016/S1473-3099(20)30120-1. [DOI] [PMC free article] [PubMed] [Google Scholar]
- Drosten C., Günther S., Preiser W., van der Werf S., Brodt H.-R., Becker S., Rabenau H., Panning M., Kolesnikova L., Fouchier R.A.M., et al. Identification of a novel coronavirus in patients with severe acute respiratory syndrome. N. Engl. J. Med. 2003;348:1967–1976. doi: 10.1056/NEJMoa030747. [DOI] [PubMed] [Google Scholar]
- Edie S., Zaghloul N.A., Leitch C.C., Klinedinst D.K., Lebron J., Thole J.F., McCallion A.S., Katsanis N., Reeves R.H. Survey of Human Chromosome 21 Gene Expression Effects on Early Development in Danio rerio. G3 (Bethesda) 2018;8:2215–2223. doi: 10.1534/g3.118.200144. [DOI] [PMC free article] [PubMed] [Google Scholar]
- Fimia G.M., Stoykova A., Romagnoli A., Giunta L., Di Bartolomeo S., Nardacci R., Corazzari M., Fuoco C., Ucar A., Schwartz P., et al. Ambra1 regulates autophagy and development of the nervous system. Nature. 2007;447:1121–1125. doi: 10.1038/nature05925. [DOI] [PubMed] [Google Scholar]
- Flint M., Chatterjee P., Lin D.L., McMullan L.K., Shrivastava-Ranjan P., Bergeron É., Lo M.K., Welch S.R., Nichol S.T., Tai A.W., Spiropoulou C.F. A genome-wide CRISPR screen identifies N-acetylglucosamine-1-phosphate transferase as a potential antiviral target for Ebola virus. Nat. Commun. 2019;10:285. doi: 10.1038/s41467-018-08135-4. [DOI] [PMC free article] [PubMed] [Google Scholar]
- Fung T.S., Liu D.X. Human Coronavirus: Host-Pathogen Interaction. Annu. Rev. Microbiol. 2019;73:529–557. doi: 10.1146/annurev-micro-020518-115759. [DOI] [PubMed] [Google Scholar]
- Gordon D.E., Jang G.M., Bouhaddou M., Xu J., Obernier K., White K.M., O’Meara M.J., Rezelj V.V., Guo J.Z., Swaney D.L., et al. A SARS-CoV-2 protein interaction map reveals targets for drug repurposing. Nature. 2020;583:459–468. doi: 10.1038/s41586-020-2286-9. [DOI] [PMC free article] [PubMed] [Google Scholar]
- Gordon D.E., Hiatt J., Bouhaddou M., Rezelj V.V., Ulferts S., Braberg H., Jureka A.S., Obernier K., Guo J.Z., Batra J., et al. QCRG Structural Biology Consortium. Zoonomia Consortium Comparative host-coronavirus protein interaction networks reveal pan-viral disease mechanisms. Science. 2020;370:eabe9403. doi: 10.1126/science.abe9403. [DOI] [PMC free article] [PubMed] [Google Scholar]
- Hart T., Chandrashekhar M., Aregger M., Steinhart Z., Brown K.R., MacLeod G., Mis M., Zimmermann M., Fradet-Turcotte A., Sun S., et al. High-Resolution CRISPR Screens Reveal Fitness Genes and Genotype-Specific Cancer Liabilities. Cell. 2015;163:1515–1526. doi: 10.1016/j.cell.2015.11.015. [DOI] [PubMed] [Google Scholar]
- Hawkins J.L., Robbins M.D., Warren L.C., Xia D., Petras S.F., Valentine J.J., Varghese A.H., Wang I.-K., Subashi T.A., Shelly L.D., et al. Pharmacologic inhibition of site 1 protease activity inhibits sterol regulatory element-binding protein processing and reduces lipogenic enzyme gene expression and lipid synthesis in cultured cells and experimental animals. J. Pharmacol. Exp. Ther. 2008;326:801–808. doi: 10.1124/jpet.108.139626. [DOI] [PubMed] [Google Scholar]
- Hegedűs K., Takáts S., Boda A., Jipa A., Nagy P., Varga K., Kovács A.L., Juhász G. The Ccz1-Mon1-Rab7 module and Rab5 control distinct steps of autophagy. Mol. Biol. Cell. 2016;27:3132–3142. doi: 10.1091/mbc.E16-03-0205. [DOI] [PMC free article] [PubMed] [Google Scholar]
- Hoffmann H.-H., Schneider W.M., Rozen-Gagnon K., Miles L.A., Schuster F., Razooky B., Jacobson E., Wu X., Yi S., Rudin C.M., et al. TMEM41B is a pan-flavivirus host factor. bioRxiv. 2020 doi: 10.1101/2020.10.09.334128. [DOI] [PMC free article] [PubMed] [Google Scholar]
- Hoffmann M., Kleine-Weber H., Pöhlmann S. A Multibasic Cleavage Site in the Spike Protein of SARS-CoV-2 Is Essential for Infection of Human Lung Cells. Mol. Cell. 2020;78:779–784.e5. doi: 10.1016/j.molcel.2020.04.022. [DOI] [PMC free article] [PubMed] [Google Scholar]
- Hoffmann M., Kleine-Weber H., Schroeder S., Krüger N., Herrler T., Erichsen S., Schiergens T.S., Herrler G., Wu N.-H., Nitsche A., et al. SARS-CoV-2 Cell Entry Depends on ACE2 and TMPRSS2 and Is Blocked by a Clinically Proven Protease Inhibitor. Cell. 2020;181:271–280.e8. doi: 10.1016/j.cell.2020.02.052. [DOI] [PMC free article] [PubMed] [Google Scholar]
- Hofmann H., Pyrc K., van der Hoek L., Geier M., Berkhout B., Pöhlmann S. Human coronavirus NL63 employs the severe acute respiratory syndrome coronavirus receptor for cellular entry. Proc. Natl. Acad. Sci. USA. 2005;102:7988–7993. doi: 10.1073/pnas.0409465102. [DOI] [PMC free article] [PubMed] [Google Scholar]
- Höglinger D., Burgoyne T., Sanchez-Heras E., Hartwig P., Colaco A., Newton J., Futter C.E., Spiegel S., Platt F.M., Eden E.R. NPC1 regulates ER contacts with endocytic organelles to mediate cholesterol egress. Nat. Commun. 2019;10:4276. doi: 10.1038/s41467-019-12152-2. [DOI] [PMC free article] [PubMed] [Google Scholar]
- Hsiau T., Conant D., Rossi N., Maures T., Waite K., Yang J., Joshi S., Kelso R., Holden K., Enzmann B.L., et al. Inference of CRISPR Edits from Sanger Trace Data. bioRxiv. 2019 doi: 10.1101/251082. [DOI] [PubMed] [Google Scholar]
- Hulswit R.J.G., Lang Y., Bakkers M.J.G., Li W., Li Z., Schouten A., Ophorst B., van Kuppeveld F.J.M., Boons G.-J., Bosch B.-J., et al. Human coronaviruses OC43 and HKU1 bind to 9-O-acetylated sialic acids via a conserved receptor-binding site in spike protein domain A. Proc. Natl. Acad. Sci. USA. 2019;116:2681–2690. doi: 10.1073/pnas.1809667116. [DOI] [PMC free article] [PubMed] [Google Scholar]
- Jefferies H.B.J., Cooke F.T., Jat P., Boucheron C., Koizumi T., Hayakawa M., Kaizawa H., Ohishi T., Workman P., Waterfield M.D., Parker P.J. A selective PIKfyve inhibitor blocks PtdIns(3,5)P(2) production and disrupts endomembrane transport and retroviral budding. EMBO Rep. 2008;9:164–170. doi: 10.1038/sj.embor.7401155. [DOI] [PMC free article] [PubMed] [Google Scholar]
- Jiang P., Nishimura T., Sakamaki Y., Itakura E., Hatta T., Natsume T., Mizushima N. The HOPS complex mediates autophagosome-lysosome fusion through interaction with syntaxin 17. Mol. Biol. Cell. 2014;25:1327–1337. doi: 10.1091/mbc.E13-08-0447. [DOI] [PMC free article] [PubMed] [Google Scholar]
- Johannessen C.M., Boehm J.S., Kim S.Y., Thomas S.R., Wardwell L., Johnson L.A., Emery C.M., Stransky N., Cogdill A.P., Barretina J., et al. COT drives resistance to RAF inhibition through MAP kinase pathway reactivation. Nature. 2010;468:968–972. doi: 10.1038/nature09627. [DOI] [PMC free article] [PubMed] [Google Scholar]
- Kamisuki S., Mao Q., Abu-Elheiga L., Gu Z., Kugimiya A., Kwon Y., Shinohara T., Kawazoe Y., Sato S., Asakura K., et al. A small molecule that blocks fat synthesis by inhibiting the activation of SREBP. Chem. Biol. 2009;16:882–892. doi: 10.1016/j.chembiol.2009.07.007. [DOI] [PubMed] [Google Scholar]
- Kang Y.-L., Chou Y., Rothlauf P.W., Liu Z., Soh T.K., Cureton D., Case J.B., Chen R.E., Diamond M.S., Whelan S.P.J., et al. Inhibition of PIKfyve kinase prevents infection by Zaire ebolavirus and SARS-CoV-2. Proc. Natl. Acad. Sci. 2020;117:20803–20813. doi: 10.1073/pnas.2007837117. [DOI] [PMC free article] [PubMed] [Google Scholar]
- Katoh Y., Shiba Y., Mitsuhashi H., Yanagida Y., Takatsu H., Nakayama K. Tollip and Tom1 form a complex and recruit ubiquitin-conjugated proteins onto early endosomes. J. Biol. Chem. 2004;279:24435–24443. doi: 10.1074/jbc.M400059200. [DOI] [PubMed] [Google Scholar]
- Klein Z.A., Takahashi H., Ma M., Stagi M., Zhou M., Lam T.T., Strittmatter S.M. Loss of TMEM106B Ameliorates Lysosomal and Frontotemporal Dementia-Related Phenotypes in Progranulin-Deficient Mice. Neuron. 2017;95:281–296.e6. doi: 10.1016/j.neuron.2017.06.026. [DOI] [PMC free article] [PubMed] [Google Scholar]
- Kleinfelter L.M., Jangra R.K., Jae L.T., Herbert A.S., Mittler E., Stiles K.M., Wirchnianski A.S., Kielian M., Brummelkamp T.R., Dye J.M., Chandran K. Haploid Genetic Screen Reveals a Profound and Direct Dependence on Cholesterol for Hantavirus Membrane Fusion. MBio. 2015;6:e00801. doi: 10.1128/mBio.00801-15. [DOI] [PMC free article] [PubMed] [Google Scholar]
- Lemaire J.-F., McPherson P.S. Binding of Vac14 to neuronal nitric oxide synthase: Characterisation of a new internal PDZ-recognition motif. FEBS Lett. 2006;580:6948–6954. doi: 10.1016/j.febslet.2006.11.061. [DOI] [PubMed] [Google Scholar]
- Letko M., Marzi A., Munster V. Functional assessment of cell entry and receptor usage for SARS-CoV-2 and other lineage B betacoronaviruses. Nat. Microbiol. 2020;5:562–569. doi: 10.1038/s41564-020-0688-y. [DOI] [PMC free article] [PubMed] [Google Scholar]
- Li W., Moore M.J., Vasilieva N., Sui J., Wong S.K., Berne M.A., Somasundaran M., Sullivan J.L., Luzuriaga K., Greenough T.C., et al. Angiotensin-converting enzyme 2 is a functional receptor for the SARS coronavirus. Nature. 2003;426:450–454. doi: 10.1038/nature02145. [DOI] [PMC free article] [PubMed] [Google Scholar]
- Li W., Xu H., Xiao T., Cong L., Love M.I., Zhang F., Irizarry R.A., Liu J.S., Brown M., Liu X.S. MAGeCK enables robust identification of essential genes from genome-scale CRISPR/Cas9 knockout screens. Genome Biol. 2014;15:554. doi: 10.1186/s13059-014-0554-4. [DOI] [PMC free article] [PubMed] [Google Scholar]
- Liby K.T., Sporn M.B. Synthetic oleanane triterpenoids: multifunctional drugs with a broad range of applications for prevention and treatment of chronic disease. Pharmacol. Rev. 2012;64:972–1003. doi: 10.1124/pr.111.004846. [DOI] [PMC free article] [PubMed] [Google Scholar]
- Lüningschrör P., Werner G., Stroobants S., Kakuta S., Dombert B., Sinske D., Wanner R., Lüllmann-Rauch R., Wefers B., Wurst W., et al. The FTLD Risk Factor TMEM106B Regulates the Transport of Lysosomes at the Axon Initial Segment of Motoneurons. Cell Rep. 2020;30:3506–3519.e6. doi: 10.1016/j.celrep.2020.02.060. [DOI] [PubMed] [Google Scholar]
- Maeda Y., Ide T., Koike M., Uchiyama Y., Kinoshita T. GPHR is a novel anion channel critical for acidification and functions of the Golgi apparatus. Nat. Cell Biol. 2008;10:1135–1145. doi: 10.1038/ncb1773. [DOI] [PubMed] [Google Scholar]
- Matsuda T., Cepko C.L. Electroporation and RNA interference in the rodent retina in vivo and in vitro. Proc. Natl. Acad. Sci. USA. 2004;101:16–22. doi: 10.1073/pnas.2235688100. [DOI] [PMC free article] [PubMed] [Google Scholar]
- Matsuyama S., Nao N., Shirato K., Kawase M., Saito S., Takayama I., Nagata N., Sekizuka T., Katoh H., Kato F., et al. Enhanced isolation of SARS-CoV-2 by TMPRSS2-expressing cells. Proc. Natl. Acad. Sci. USA. 2020;117:7001–7003. doi: 10.1073/pnas.2002589117. [DOI] [PMC free article] [PubMed] [Google Scholar]
- McBride C.E., Li J., Machamer C.E. The cytoplasmic tail of the severe acute respiratory syndrome coronavirus spike protein contains a novel endoplasmic reticulum retrieval signal that binds COPI and promotes interaction with membrane protein. J. Virol. 2007;81:2418–2428. doi: 10.1128/JVI.02146-06. [DOI] [PMC free article] [PubMed] [Google Scholar]
- Mei K., Guo W. The exocyst complex. Curr. Biol. 2018;28:R922–R925. doi: 10.1016/j.cub.2018.06.042. [DOI] [PubMed] [Google Scholar]
- Moretti F., Bergman P., Dodgson S., Marcellin D., Claerr I., Goodwin J.M., DeJesus R., Kang Z., Antczak C., Begue D., et al. TMEM41B is a novel regulator of autophagy and lipid mobilization. EMBO Rep. 2018;19:e45889. doi: 10.15252/embr.201845889. [DOI] [PMC free article] [PubMed] [Google Scholar]
- Olagnier D., Farahani E., Thyrsted J., Blay-Cadanet J., Herengt A., Idorn M., Hait A., Hernaez B., Knudsen A., Iversen M.B., et al. SARS-CoV2-mediated suppression of NRF2-signaling reveals potent antiviral and anti-inflammatory activity of 4-octyl-itaconate and dimethyl fumarate. Nat Commun. 2020;11:4938. doi: 10.1038/s41467-020-18764-3. [DOI] [PMC free article] [PubMed] [Google Scholar]
- Ou X., Liu Y., Lei X., Li P., Mi D., Ren L., Guo L., Guo R., Chen T., Hu J., et al. Characterization of spike glycoprotein of SARS-CoV-2 on virus entry and its immune cross-reactivity with SARS-CoV. Nat. Commun. 2020;11:1620. doi: 10.1038/s41467-020-15562-9. [DOI] [PMC free article] [PubMed] [Google Scholar]
- Petersen J., Drake M.J., Bruce E.A., Riblett A.M., Didigu C.A., Wilen C.B., Malani N., Male F., Lee F.-H., Bushman F.D., et al. The major cellular sterol regulatory pathway is required for Andes virus infection. PLoS Pathog. 2014;10:e1003911. doi: 10.1371/journal.ppat.1003911. [DOI] [PMC free article] [PubMed] [Google Scholar]
- Petersen E., Koopmans M., Go U., Hamer D.H., Petrosillo N., Castelli F., Storgaard M., Khalili S.A., Simonsen L. Comparing SARS-CoV-2 with SARS-CoV and influenza pandemics. Lancet Infect. Dis. 2020;20:E238–E244. doi: 10.1016/S1473-3099(20)30484-9. [DOI] [PMC free article] [PubMed] [Google Scholar]
- Puschnik A.S., Majzoub K., Ooi Y.S., Carette J.E. A CRISPR toolbox to study virus-host interactions. Nat. Rev. Microbiol. 2017;15:351–364. doi: 10.1038/nrmicro.2017.29. [DOI] [PMC free article] [PubMed] [Google Scholar]
- Ran F.A., Hsu P.D., Wright J., Agarwala V., Scott D.A., Zhang F. Genome engineering using the CRISPR-Cas9 system. Nat. Protoc. 2013;8:2281–2308. doi: 10.1038/nprot.2013.143. [DOI] [PMC free article] [PubMed] [Google Scholar]
- Rapiteanu R., Davis L.J., Williamson J.C., Timms R.T., Paul Luzio J., Lehner P.J. A Genetic Screen Identifies a Critical Role for the WDR81-WDR91 Complex in the Trafficking and Degradation of Tetherin. Traffic. 2016;17:940–958. doi: 10.1111/tra.12409. [DOI] [PMC free article] [PubMed] [Google Scholar]
- Riva L., Yuan S., Yin X., Martin-Sancho L., Matsunaga N., Pache L., Burgstaller-Muehlbacher S., De Jesus P.D., Teriete P., Hull M.V., et al. Discovery of SARS-CoV-2 antiviral drugs through large-scale compound repurposing. Nature. 2020;586:113–119. doi: 10.1038/s41586-020-2577-1. [DOI] [PMC free article] [PubMed] [Google Scholar]
- Ronan B., Flamand O., Vescovi L., Dureuil C., Durand L., Fassy F., Bachelot M.-F., Lamberton A., Mathieu M., Bertrand T., et al. A highly potent and selective Vps34 inhibitor alters vesicle trafficking and autophagy. Nat. Chem. Biol. 2014;10:1013–1019. doi: 10.1038/nchembio.1681. [DOI] [PubMed] [Google Scholar]
- Rong Y., McPhee C.K., Deng S., Huang L., Chen L., Liu M., Tracy K., Baehrecke E.H., Yu L., Lenardo M.J. Spinster is required for autophagic lysosome reformation and mTOR reactivation following starvation. Proc. Natl. Acad. Sci. U S A. 2011;108:7826–7831. doi: 10.1073/pnas.1013800108. [DOI] [PMC free article] [PubMed] [Google Scholar]
- Rousseaux M.W., de Haro M., Lasagna-Reeves C.A., De Maio A., Park J., Jafar-Nejad P., Al-Ramahi I., Sharma A., See L., Lu N., et al. TRIM28 regulates the nuclear accumulation and toxicity of both alpha-synuclein and tau. eLife. 2016;5:e19809. doi: 10.7554/eLife.19809. [DOI] [PMC free article] [PubMed] [Google Scholar]
- Saftig P., Klumperman J. Lysosome biogenesis and lysosomal membrane proteins: trafficking meets function. Nat. Rev. Mol. Cell Biol. 2009;10:623–635. doi: 10.1038/nrm2745. [DOI] [PubMed] [Google Scholar]
- Sanjana N.E., Shalem O., Zhang F. Improved vectors and genome-wide libraries for CRISPR screening. Nat. Methods. 2014;11:783–784. doi: 10.1038/nmeth.3047. [DOI] [PMC free article] [PubMed] [Google Scholar]
- Schneider W.M., Luna J.M., Hoffmann H.-H., Sánchez-Rivera F.J., Leal A.A., Ashbrook A.W., Pen J.L., Michailidis E., Ricardo-Lax I., Peace A., et al. Genome-scale identification of SARS-CoV-2 and pan-coronavirus host factor networks. bioRxiv. 2020 doi: 10.1101/2020.10.07.326462. [DOI] [PMC free article] [PubMed] [Google Scholar]
- Shirato K., Kawase M., Matsuyama S. Middle East respiratory syndrome coronavirus infection mediated by the transmembrane serine protease TMPRSS2. J. Virol. 2013;87:12552–12561. doi: 10.1128/JVI.01890-13. [DOI] [PMC free article] [PubMed] [Google Scholar]
- Shisheva A. In: Phosphoinositides and Disease. Falasca M., editor. Springer Netherlands; Dordrecht: 2012. PIKfyve and its Lipid Products in Health and in Sickness; pp. 127–162. [Google Scholar]
- Simmons G., Gosalia D.N., Rennekamp A.J., Reeves J.D., Diamond S.L., Bates P. Inhibitors of cathepsin L prevent severe acute respiratory syndrome coronavirus entry. Proc. Natl. Acad. Sci. USA. 2005;102:11876–11881. doi: 10.1073/pnas.0505577102. [DOI] [PMC free article] [PubMed] [Google Scholar]
- Stewart S.A., Dykxhoorn D.M., Palliser D., Mizuno H., Yu E.Y., An D.S., Sabatini D.M., Chen I.S.Y., Hahn W.C., Sharp P.A., et al. Lentivirus-delivered stable gene silencing by RNAi in primary cells. RNA. 2003;9:493–501. doi: 10.1261/rna.2192803. [DOI] [PMC free article] [PubMed] [Google Scholar]
- Ströh L.J., Stehle T. Glycan Engagement by Viruses: Receptor Switches and Specificity. Annu. Rev. Virol. 2014;1:285–306. doi: 10.1146/annurev-virology-031413-085417. [DOI] [PubMed] [Google Scholar]
- Stukalov A., Girault V., Grass V., Bergant V., Karayel O., Urban C., Haas D.A., Huang Y., Oubraham L., Wang A., et al. Multi-level proteomics reveals host-perturbation strategies of SARS-CoV-2 and SARS-CoV. bioRxiv. 2020 doi: 10.1101/2020.06.17.156455. [DOI] [PubMed] [Google Scholar]
- Su G., Kuchinsky A., Morris J.H., States D.J., Meng F. GLay: community structure analysis of biological networks. Bioinformatics. 2010;26:3135–3137. doi: 10.1093/bioinformatics/btq596. [DOI] [PMC free article] [PubMed] [Google Scholar]
- Sungnak W., Huang N., Bécavin C., Berg M., Queen R., Litvinukova M., Talavera-López C., Maatz H., Reichart D., Sampaziotis F., et al. HCA Lung Biological Network SARS-CoV-2 entry factors are highly expressed in nasal epithelial cells together with innate immune genes. Nat. Med. 2020;26:681–687. doi: 10.1038/s41591-020-0868-6. [DOI] [PMC free article] [PubMed] [Google Scholar]
- V’kovski P., Gerber M., Kelly J., Pfaender S., Ebert N., Braga Lagache S., Simillion C., Portmann J., Stalder H., Gaschen V., et al. Determination of host proteins composing the microenvironment of coronavirus replicase complexes by proximity-labeling. eLife. 2019;8:e42037. doi: 10.7554/eLife.42037. [DOI] [PMC free article] [PubMed] [Google Scholar]
- van der Hoek L. Human coronaviruses: what do they cause? Antivir. Ther. 2007;12(4 Pt B):651–658. [PubMed] [Google Scholar]
- Wei J., Alfajaro M.M., DeWeirdt P.C., Hanna R.E., Lu-Culligan W.J., Cai W.L., Strine M.S., Zhang S.-M., Graziano V.R., Schmitz C.O., et al. Genome-wide CRISPR Screens Reveal Host Factors Critical for SARS-CoV-2 Infection. Cell. 2020 doi: 10.1016/j.cell.2020.10.028. [DOI] [PMC free article] [PubMed] [Google Scholar]
- Wu F., Zhao S., Yu B., Chen Y.-M., Wang W., Song Z.-G., Hu Y., Tao Z.-W., Tian J.-H., Pei Y.-Y., et al. A new coronavirus associated with human respiratory disease in China. Nature. 2020;579:265–269. doi: 10.1038/s41586-020-2008-3. [DOI] [PMC free article] [PubMed] [Google Scholar]
- Yeager C.L., Ashmun R.A., Williams R.K., Cardellichio C.B., Shapiro L.H., Look A.T., Holmes K.V. Human aminopeptidase N is a receptor for human coronavirus 229E. Nature. 1992;357:420–422. doi: 10.1038/357420a0. [DOI] [PMC free article] [PubMed] [Google Scholar]
- Zaki A.M., van Boheemen S., Bestebroer T.M., Osterhaus A.D.M.E., Fouchier R.A.M. Isolation of a novel coronavirus from a man with pneumonia in Saudi Arabia. N. Engl. J. Med. 2012;367:1814–1820. doi: 10.1056/NEJMoa1211721. [DOI] [PubMed] [Google Scholar]
- Zang R., Case J.B., Castro M.F.G., Liu Z., Zeng Q., Zhao H., Son J., Rothlauf P.W., Hou G., Bose S., et al. Cholesterol 25-hydroxylase suppresses SARS-CoV-2 replication by blocking membrane fusion. Proc Nat Acad Sci U S A. 2020 doi: 10.1073/pnas.2012197117. [DOI] [PMC free article] [PubMed] [Google Scholar]
- Zhang X.-J., Qin J.-J., Cheng X., Shen L., Zhao Y.-C., Yuan Y., Lei F., Chen M.-M., Yang H., Bai L., et al. In-Hospital Use of Statins Is Associated with a Reduced Risk of Mortality among Individuals with COVID-19. Cell Metab. 2020;32:176–187.e4. doi: 10.1016/j.cmet.2020.06.015. [DOI] [PMC free article] [PubMed] [Google Scholar]
- Zhong J., Gastaminza P., Cheng G., Kapadia S., Kato T., Burton D.R., Wieland S.F., Uprichard S.L., Wakita T., Chisari F.V. Robust hepatitis C virus infection in vitro. Proc. Natl. Acad. Sci. USA. 2005;102:9294–9299. doi: 10.1073/pnas.0503596102. [DOI] [PMC free article] [PubMed] [Google Scholar]
- Zhu Y., Feng F., Hu G., Wang Y., Yu Y., Zhu Y., Xu W., Cai X., Sun Z., Han W., et al. The S1/S2 boundary of SARS-CoV-2 spike protein modulates cell entry pathways and transmission. bioRxiv. 2020 doi: 10.1101/2020.08.25.266775. [DOI] [Google Scholar]
Associated Data
This section collects any data citations, data availability statements, or supplementary materials included in this article.
Supplementary Materials
Data Availability Statement
The accession number for the raw sequencing data of the CRISPR KO screens reported in this paper is EMBL-EBI ArrayExpress: E-MTAB-9638.